I. INTRODUCTION
Copper ions, both essential and toxic for living systems, play very important roles in physiology such as bone formation, cellular respiration, neuroendocrine function, organ functions. Reference Kramer1–Reference Jung, Kwon, Lee, Kim, Hong, Kim, Yan, Lee, Lee, Joo and Kim4 The deficiency of Cu2+ ions can result in mental retardation, anemia, hypothermia, impaired immune/organ function, and excessive amount of Cu2+ ions can lead to eczema, kidney disease, and irreversible damage to nervous systems. Reference Kramer1–Reference Jung, Kwon, Lee, Kim, Hong, Kim, Yan, Lee, Lee, Joo and Kim4 To quantificationally detect the concentration of Cu2+ ions in drinking water can benefit on controlling the daily intake of appropriate Cu2+ ions. To accurately know the amount of Cu2+ ions participating functions in physiological process also has a pronounced influence on disease prevention and clinical diagnosis.
Among various techniques, using the fluorescence of semiconductor quantum dots (QDs) as the substrates is a powerful spectroscopic one developed on the basis of quenched or enhanced fluorescent signals of the substrate when the molecules of an analyte are absorbed onto or in close proximity of the substrates. Reference Chan, Maxwell, Gao, Bailey, Han and Nie5–Reference Freeman and Willner8 Fluorescence of semiconductors QDs is originated from the recombination of photogenerated electrons and holes under the light excitation. Any competitive charge transfer process can lead to the fluorescence quench of the semiconductor QDs. Upon this feature, a variety of approaches based on quenched or enhanced fluorescence of QDs have been explored to selectively detect targets with high sensitivity and excellent reproducibility. Reference Chan, Maxwell, Gao, Bailey, Han and Nie5–Reference Freeman and Willner8 Combining the paramagnetic nature of Cu2+ ions, the strategies for sensitive detection of Cu2+ ions using semiconductor QDs have been widely investigated. Reference Zhang, Li, Zhang and Jiang9–Reference Sung and Lo18
Metal Cd-based QDs such as CdSe, CdS, CdTe, and CdSeTe have been successfully used for selective detection of copper ions. Reference Xie, Liang, Zhang, Liu, He and Pang10–Reference Sung and Lo18 The chemical reactions between Cu2+ ions and Cd-based QDs and subsequently formed copper compounds on the surface of QDs have been considered as the mechanism for QDs fluorescence quenching. Reference Xie, Liang, Zhang, Liu, He and Pang10–Reference Chan, Chen, Liu, Wark, Son and Batteas12 However, the applications of Cd-based QDs for Cu2+ ion detection have been limited by their low photo and chemical stability and following release of toxic heavy metal ions. Reference Hardman19–Reference Klaine, Alvarez, Batley, Fernandes, Handy, Lyon, Mahendra, McLaughlin and Lead21 One approach to solve those problems is to introduce a pin-hole free protective shell on the surface of Cd-based QDs. Reference Shen, Li, Lu, Ji, Fei, Zhang, Abdel-Halim and Zhu17,Reference Reiss, Protiere and Li22,Reference Donega23 SiO2, a common insulator, offers a wide range of benefits including suppressed photobleaching, tailored surface properties, improved biocompatibility, and reduced toxicity. However, the existence of protective shell means a mitigated analyte–substrate interaction, and thus a compromised charge exchange between analytes and substrate. Moreover, the formation of protective shell is always time-consuming and requires a strict set of reaction conditions. Alternative approach is to find a metal free candidate with extrusive photo and chemical stability for highly sensitive and selective detection of Cu2+ ions at various strict environments.
Photoluminescent carbon nanomaterials such as carbon dots and diamond dots, have been proved with the potentials as a platform for chemical sensors due to their extraordinary stability, prominent luminescence intensity, tunable emission spectra, tailorable surface properties, high biocompatibility, and low toxicity. Reference Fan and Chu24,Reference Baker and Baker25 Using carbon nanomaterials as the substrates including polymer and carbon QDs for detection of Cu2+ ions has been reported. Reference Liu, Tian, Wang, Zhang, Qin, Luo, Asiri, Al-Youbi and Sun26–Reference Wang, Gu, Lei, Wang, Xia and Hao28
Graphene quantum dots (GQDs), a zero-dimensional carbon nanostructure with a size below 10 nm, display unusual chemical and physical properties because of their strong quantum confinement and edge effects. Hence, GQDs have been considered as a promising candidate for applications of chemical sensors, photovoltaics, bioimaging, and electrocatalysis. Reference Cao, Meziani, Sahu and Sun29–Reference Li, Zhao, Cheng, Hu, Shi, Dai and Qu34 Compared with conventional inorganic QDs, the GQDs have many advantages for chemical sensors: (i) simple, cost-effective, and scalable synthesis; (ii) rich surface chemistry for functionalization; (iii) controllable size and tunable band gap with corresponding photoluminescence (PL). Of particular interest is the recent report that GQDs synthesized by re-oxidizing graphene can detect the Cu2+ ions. Reference Wang, Gu, Lei, Wang, Xia and Hao28 Inspired by the above propitious traits of GQDs, we present pristine GQDs as fluorescence substrates for detection for Cu2+ ions with high sensitivity through a facile approach, in which the PL of GQDs is “turn-off” by metal ions and “turn-on” again after subsequent treatment of biothiol cysteine.
II. EXPERIMENTAL PROCEDURE
A. Synthesis of GQDs
Briefly, 0.3 g of pitch graphite fibers was dispersed in 80 mL of concentrated H2SO4 and HNO3 with a volume ratio of 3:1. The temperature of the mixture was maintained at 70 °C for 24 h. The mixture was naturally cooled down to room temperature and diluted with 800 mL of MQ (Millipore) water, followed by the addition of Na2CO3 to adjust the pH of the solution near neutral. After neutralization, the GQDs aqueous solution was dialyzed through semipermeable membranes (retained molecular weight: 2000 Da) for one week. Precipitate was removed by filtration. A stock solution of GQDs with the concentration of 0.14 mg/mL was used for further characterization and application.
B. PL quench of GQDs by addition of metal ions
PL measurements were carried out on a luminescence spectrometer (F4600, Hitachi, Japan) with 50 W xenon lamp as the source of excitation. For each measurement, 0.9 mL of GQDs stock solution was mixed with 0.1 mL of metal ion aqueous solutions of various concentrations. The concentration of GQDs was constant for all measurements. I 0 is referred as the PL intensity of the mixture of 0.9 mL GQDs stock solution and 0.1 mL MQ water. After thoroughly mixing 0.1 mL of metal ion solution with 0.9 mL of GQDs stock solution for 5 min, the PL intensities of the mixture were recorded and compared with I 0.
C. PL recovery of metal ion-quenched-GQDs by addition of biothiol cysteine
For this series measurement, 0.8 mL of GQDs stock solution was mixed with metal ions and 10 mM cysteine aqueous solutions. The final volume was controlled as 1 mL. The PL intensities were recorded as I 0, I q, and I r for mixing 0.8 mL of GQDs stock solution with 0.2 mL of MQ water, 0.1 mL of MQ water + 0.1 mL of metal ion aqueous solution, and 0.1 mL of metal ion aqueous solution + 0.1 mL of 10 mM cysteine aqueous solution, respectively. The final concentrations of GQDs and cysteine for all recovery experiments were controlled at 0.112 mg/mL and 1 mM, respectively. The solution was thoroughly mixed for 5 min for each step.
III. RESULTS AND DISCUSSIONS
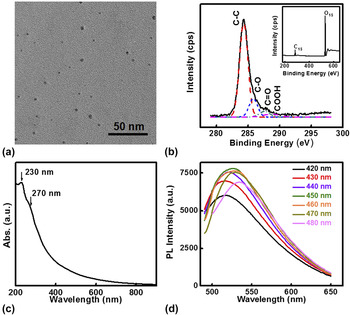
The synthesis of GQDs has been well developed through various approaches such as hydrothermal, electrochemical synthesis, chemical synthesis, chemical exfoliation from graphite fibers, and electron beam lithography. Reference Yan, Cui, Li and Li30–Reference Lee, Kim, Park, Kim, Park, Kim, Bong, Kim, Chae, Jun, Hwang, Jung and Jeon39 Herein, GQDs were synthesized by chemical oxidation of pitch graphite fibers. Reference Peng, Gao, Gupta, Liu, Romero-Aburto, Ge, Song, Alemany, Zhan, Gao, Vithayathil, Kaipparettu, Marti, Hayashi, Zhu and Ajayan37 Microstructure characterizations of the GQDs are summarized in Fig. 1. Transmission electron microscopy (TEM) image [Fig. 1(a)] shows the size of as-synthesized GQDs in the range of 2–5 nm. X-ray photoelectron spectroscopy (XPS) measurements were also performed to find out the composition of GQDs. As shown in Fig. 1(b), the C 1s peak at 284.3 eV and the O 1s peak at 531.9 eV for GQDs were obtained. The observation of C=C, C–O, C=O, and COOH from the high resolution C 1s XPS spectra indicated the presence of hydroxyl, carbonyl, and carboxylic acid groups in the GQDs.
Characterizations of as-synthesized GQDs. (a) A typical TEM image of GQDs. The scale bar is 50 nm. (b) The XPS of C 1s spectrum of GQDs. Inset is the XPS survey spectrum of GQDs. (c) Absorption curve of GQDs. (d) PL spectra of GQDs upon excitation from 420 to 480 nm.

Two absorption peaks at 230 nm and 270 nm [Fig. 1(c)] were observed for as-synthesized GQDs, which was similar to the previous report. Reference Pan, Zhang, Li and Wu36,Reference Luo, Lu, Somers and Johnson40 The absorption at 230 nm originated from the n–n* transition. Reference Pan, Zhang, Li and Wu36 The absorption feature of 270 nm, which was not observed in graphene and graphene oxide, could be attributed to n–π* transition of the C=O bond. Such an observed absorption may be explained by the large edge/bulk ratio of GQDs. Reference Luo, Lu, Somers and Johnson40 The PL spectra of as-prepared GQDs excited at various wave lengths from 420 to 480 nm are shown in Fig. 1(d). Increasing the excitation wave length results in a red shift of the PL peak. The excitation wave length dependence of the emission wave length has been widely observed for carbon-based QDs including carbon dots and GQDs. Reference Cao, Meziani, Sahu and Sun29–Reference Liu, Wu, Feng and Mullen38,Reference Sun, Zhou, Lin, Wang, Fernando, Pathak, Meziani, Harruff, Wang, Wang, Luo, Yang, Kose, Chen, Veca and Xie41,Reference Yang, Cao, Luo, Lu, Wang, Wang, Meziani, Liu, Qi and Sun42 The phenomenon is generally attributed to the emissive traps, electronic conjugate structures, free zigzag sites, and surface states. Reference Wang, Gu, Lei, Wang, Xia and Hao28,Reference Tang, Ji, Cao, Lin, Jiang, Li, Teng, Luk, Zeng, Hao and Lau35,Reference Peng, Gao, Gupta, Liu, Romero-Aburto, Ge, Song, Alemany, Zhan, Gao, Vithayathil, Kaipparettu, Marti, Hayashi, Zhu and Ajayan37 When 450 nm light was used to excite the GQDs aqueous solution, the highest emission at 525 nm was observed. In this work, the excitation wave length was fixed at 450 nm for all PL measurements. Compared with the low chemical stability of bare Cd-based semiconductor QDs, the prominent chemical stability of GQDs was confirmed by the unchanged PL intensity (Fig. S1) with a duration of 21 days exposure to the aerobic conditions. Therefore, GQDs could provide a more reliable platform for chemical sensing.
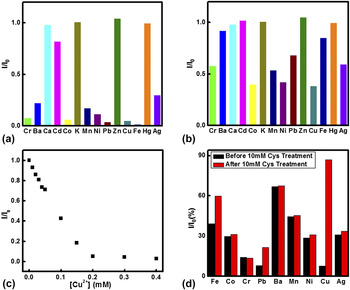
The presence of function groups (–COOH) containing oxygen in the GQDs provides the reactive sites for absorption and desorption of incoming chemical molecules, indicating the potential application of GQDs as a platform for the chemical detection of metal ions. To evaluate the selectivity of the sensing system for various metal ions, the changes in the PL of the GQD in the presence of representative metals ions including Cr3+, Ba2+, Ca2+, Cd2+, Co2+, K+, Mn2+, Ni2+, Pb2+, Zn2+, Cu2+, Fe3+, Ag+, and Hg2+ were examined at the same conditions as shown in Fig. 2. The change in the PL intensity is defined by I/I 0, where I is the PL intensity of the mixture of 0.9 mL of GQDs stock solution and 0.1 mL of metal ion solution and I 0 is the PL intensity of the mixture of 0.9 mL of GQDs stock solution and 0.1 mL of MQ water. The final concentration of GQDs was controlled at 0.126 mg/mL. After mixing with metal ions for 5 min, an unchanged PL intensity of the mixture indicated a fast response of metal ions with GQDs. When the concentration of metal ions was controlled at 1 mM, the tremendous PL quenching of pristine GQDs was observed for most of the metal ions including Cr3+, Ba2+, Co2+, Mn2+, Ni2+, Pb2+, Cu2+, and Fe3+ [Fig. 2(a)]. Due to the easy absorption of metal ions on the pristine GQDs, the charge transfer between metal ions and GQDs becomes possible. Therefore, it is not a surprise to observe the PL quenching of GQDs toward multiple metal ions due to the suppressed photoexcited charge recombination of GQDs in the presence of high concentration of metal ions, since metal ions can interact with GQDs through the electrostatic force. Decreasing the concentrations of metal ions will increase the possibility of charge recombination. As shown in Fig. 2(b), the quenching of PL intensity of GQDs was much weaker for 0.1 mM metal ions, compared with that for 1 mM metal ions. The results indicate that the expected selectivity for sensing Cu2+ ions could not be realized by using pristine GQDs. Nevertheless, the PL intensity of GQDs could be quenched by Cu2+ ions. The PL intensity of GQDs in the presence of Cu2+ ions versus Cu2+ ions concentration was thoroughly investigated as shown in Fig. 2(c). It was found that PL intensity was almost totally quenched when the concentration of Cu2+ ions was larger than 0.2 mM derived from Fig. 2(c). The relative PL intensity of the mixture displays a linear relationship (R = 0.991) to the concentration of Cu2+ ions over the range of 0–0.20 mM with a limit of detection of 0.33 µM. The sensitivity of our GQDs is similar to the previous study. Reference Wang, Gu, Lei, Wang, Xia and Hao28 However, our GQDs exhibit the PL response to a wide range of metal ions, compared with the high sensitivity of GQDs toward to Cu2+ ions in the previous report. Reference Wang, Gu, Lei, Wang, Xia and Hao28 This may be attributed to different chemical environments of GQDs generated from the synthesis.
The PL intensity of GQDs quenched in the presence of different metal ions. (a) Relative PL intensity of the mixture of 0.9 mL of GQDs stock solution and 0.1 mL of metal ion solution, compared with that of 0.9 mL of GQDs stock solution and 0.1 mL of MQ water. The final concentration of metal ions was 1 mM. (b) Relative PL intensity of the mixture of 0.9 mL of GQDs stock solution and 0.1 mL of metal ion solution, compared with that of 0.9 mL of GQDs stock solution and 0.1 mL of MQ water. The final concentration of metal ions was 0.1 mM. (c) Plot of relative PL intensity of GQDs versus the concentrations of Cu2+ ions. (d) The recovery of quenched PL intensity of GQDs after treatment of biothiol cysteine. For the PL recovery experiments, the final concentrations of GQDs, metal ions, and cysteine were controlled at 0.112 mg/mL, 0.2 mM, and 1 mM, respectively.

Previous investigations indicate that biothiol cysteine has a strong binding to Cu2+ ions, in which two cysteine molecules react with one Cu2+ (2Cys + Cu(II) → Cys-Cu(II)-Cys, Fig. S2). Reference Liu, Zhu, Eggers, Nersissian, Faull, Goto, Ai, Sanders-Loehr, Gralla and Valentine43,Reference Rigo, Corazza, Paolo, Rossetto, Ugolini and Scarpa44 Herein, the PL intensity of the mixture of GQDs and metal ions in the presence or absence of biothiol cysteine as the parallel measurements was studied. Details are listed in the experimental section. The concentrations of GQDs were 0.112 mg/mL for all measurements. For each parallel measurement, the concentrations of metal ions and cysteine were identical. The PL intensity of GQDs quenched by metal ions was denoted by I q. The recovery of PL intensity (I r) was observed for quenched GQDs solution after adding cysteine. Our control experiments given in Fig. S3 indicate that the PL intensity of 1 mM cysteine is near zero at the identical conditions for PL measurements. Therefore, such a PL recovery could be attributed to the ability of cysteine to capture the metal ions absorbed on the surface of GQDs and suppress the charge transfer between metal ions and GQDs. Herein, 0.2 mM of the final concentration for all metal ions was used. The results are displayed in Fig. 2(d). For Cr3+, Ba2+, Co3+, Mn2+, Ni2+ ions, the intensities of PL signals after the addition of cysteine have negligible change, compared with I q. The metal ions, Cu2+, Pb2+, and Fe3+, showed distinct response after cysteine treatment. The value of I r/I q for Cu2+ ions was 11.3, which was much larger than 2.74 and 1.52 for Pb2+ and Fe3+, respectively. Such a large difference clearly demonstrates sensitive detection of Cu2+ ions could be achieved by adding cysteine to recover PL intensity of GQDs quenched by Cu2+ ions.
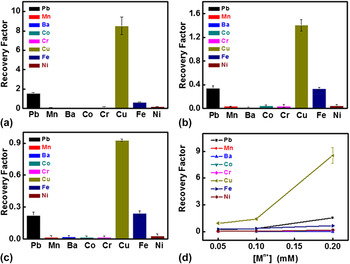
To address the universality of the aforementioned phenomenon, the PL recovering experiments were also conducted at various concentrations of metal ions (Cu2+, Fe3+, and Pb2+). The recovery factor was defined as the values of (I r − I q)/I q to evaluate the detection of pristine GQDs for Cu2+ ions. All measurements were performed for five times. The recovered factors for metal ion concentrations of 0.05, 0.1, and 0.2 mM are summarized in Fig. 3. Three metal ions, Cu2+, Fe3+, and Pb2+, displayed a relative high recovery to cysteine [Figs. 3(a)–3(c)], which was consistent to results shown in Fig. 2(d). The recovery factor (8.52) for 0.2 mM Cu2+ ions was 5.56 and 13.43 times higher than that for Pb2+ and Fe3+ ions with 0.2 mM concentration [Fig. 3(a)], respectively. Similar relationship holds for the metal ion concentrations of 0.1 mM and 0.05 mM as shown in Figs. 3(b) and 3(c), respectively. The summary of recovery factors for three metal ions with various concentrations is displayed in Fig. 3(d), indicating the detection of Cu2+ ion could be realized through this simple two-step method as described.
Recovered PL intensities of the mixtures of metal ions and GQDs by cysteine at various concentrations of metal ions: (a) 0.2 mM; (b) 0.1 mM; (c) 0.05 mM. (d) Summary of recovery factors for various metal ions. The final concentrations of GQDs and cysteine for all recovery experiments were controlled at 0.112 mg/mL and 1 mM, respectively.

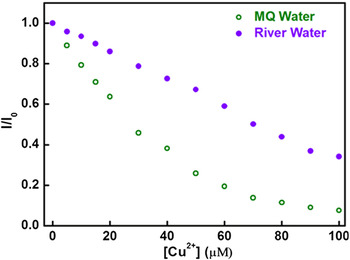
The evaluation of the performance of GQDs as the Cu2+ ion sensor with the real water was also carried out by using current method. The river water taken from the Chanba wetland of Xi'an was treated with filtration (0.22 µm membrane) and followed centrifuging at 12,000 rpm for 30 min. The concentration of GQDs was diluted to 0.07 mg/mL by the pretreated river water and MQ water, respectively. Figure 4 shows that the sensing performance of GQDs in the presence of river water displayed a similar phenomenon of PL decrease, compared with that of GQDs aqueous solution prepared from MQ water only. The concentrations of Cu2+ ions were in the range of 0–100 µM for the measurements. The PL decrease rate of GQDs dispersed in MQ water was much faster than that in the presence of river water, indicating the PL interference of minerals and organic species in the river water for Cu2+ ion detection. However, a linear sensing behavior (R = 0.998) for Cu2+ ion sensing in the range of 0–100 µM was observed in Fig. 4, demonstrating that the pristine GQDs could function as the suitable sensing platform for determining the Cu2+ ion concentrations in real water. Cu2+ ions with a concentration as low as 1 µM are easily detectable at the current system. Therefore, satisfying the sensitivity requirement for detection of the maximum concentration of Cu2+ ions in the drinking water (1.0 mg/L, 15.6 µM) defined by Ministry of Health, P.R. China, and this simple approach has the potential practical application in monitoring Cu2+ ions level for drinking water.
Plot of relative PL intensity of GQDs with a concentration of 0.07 mg/mL versus the concentrations of Cu2+ ions in the range of 0–100 µM. The green hollow circles represent the PL measurements carried out in the MQ water only. The purple solid circles represent the changes in the PL intensity after the addition of different amounts of Cu2+ ions in the presence of pretreated river water.

IV. CONCLUSION
In conclusion, GQDs have been synthesized and used for detection of Cu2+ ions. Majority metal ions could quench the PL intensity of pristine GQDs. Adding biothiol cysteine can recover the quenched PL signal of GQDs. Compared with other metal ions, the significant PL recovery factors for Cu2+ ions at various concentrations indicate the sensitive sensing for Cu2+ ions by GQDs. Such a simple approach provides a practical and environmental friendly method for detection of Cu2+ ions.
Supplementary Material
To view supplementary material for this article, please visit http://dx.doi.org/jmr.2014.1459.
ACKNOWLEDGMENTS
We acknowledge the support from the National Science Foundation of China through Grant No. 21201138 and from the Ministry of Science and Technology of China through a 973-program under Grant No. 2012CB619401. We acknowledge TEM support from Electron Microscopy Laboratory of Frontier Institute of Science and Technology at Xi’an Jiaotong University.