Implications
The contamination of animal-derived food sources with drugs and antibiotics used in the farms, the risks of zoonotic diseases, and economic losses due to diseases are three main and convincing reasons for studying the immune system of farm animals.
An efficient genetic selection requires enough knowledge about the factors controlling immune system. This study indicated that there is genomic regions controlling the innate ability of chicken to respond to antigenic challenges. Finding of this study showed that selection on important regions affecting immune response traits may speed up and facilitate genomic selection for immunity related traits in chicken.
Introduction
Infections are one of the major challenges in livestock industry. Although different medication and sanitation strategies have been developed, the problem remained and causes a great loss in livestock income. Genetic improvement of the immune system could be a stable solution instead of using drugs and antibiotics.
The immune system which could be humoral and cellular, is a constellation of responses to attack pathogens and a strong immune system could have important implications in animal husbandry. Humoral immunity consists of agents found in extracellular fluids such as antibodies, complement proteins and antimicrobial peptides (Janeway et al., Reference Janeway, Travers, Walport and Shlomchik2001). Immunoglobulins, also known as antibodies, are the main component of humoral immunity. In vertebrates, they provide important mechanisms to resist invasions and infections from pathogens. Antibody levels are major parameters of humoral immunity as they partially reflect the potential of an animal to resist pathogen infection. The levels control by multiple genes (van der Zijpp et al., Reference Van der Zijpp, Frankena, Boneschanscher and Nieuwland1983), and selection may improve antibody-mediated immunity (Gross et al., Reference Gross, Siegel, Hall, Domermuth and DuBoise1980).
Recently, large panels of single nucleotide polymorphisms (SNPs) have been developed for chicken (Gallus Gallus). Genome-wide association studies use these panels to identify genomic variation underlying complex traits and genetic markers associated with antibody production in chicken have been reported previously (Zhang et al., Reference Zhang, Li, Liu, Zheng, Sun, Wu, Hu, Wen and Zhao2015). Heritability of antibody titer response is low to moderate (Bovenhuis et al., Reference Bovenhuis, Bralten, Nieuwland and Parmentier2002), which indicates that it is possible to identify the genomic loci underlying humoral immunity. This study aimed to investigate the primary and secondary antibody responses in a chicken F2 population to identify common genetic regions in both traits as well as the regions that differ for each trait to make better knowledge about the genetic basis of antibody-mediated immune responses.
Material and methods
Animal resource and phenotypic measurements
A F2 population descended from a commercial broiler named Arian and an Iranian indigenous chicken named Urmia were used for this experiment (Raeesi et al., Reference Raeesi, Ehsani, Torshizi, Sargolzaei, Masoudi and Dideban2017). A total number of 290 birds consisting of 8 half-sib and 52 full-sib families were genotyped and the phenotypic data collected. The number of phenotypic data used for each trait was differ due to the quality of the collected phenotypes, ranging from 269 for secondary immunoglobulin M (IgM2) and total secondary immunoglobulin (IgT2) to 290 for primary immunoglobulin M (IgM1), respectively (Supplementary Table S1). The gender composition of the population was almost equal comprising 137 males and 153 females. At 56 days of age (primary antibody response) and 63 days of age (secondary antibody response), 0.2 ml of a 5% sheep red blood cell (SRBC) suspension injected intramuscularly in the breast of the chicks and blood samples were collected 7 days post-injection from the brachial vein with syringes containing ethylenediaminetetraacetic acid as anticoagulant. Blood plasma isolated after that blood centrifuged at 3000 rpm for 30 min. Antibody titers against SRBC, including total level of immunoglobulins in primary (IgT1) and secondary responses, level of immunoglobulin M in primary and secondary responses, and level of immunoglobulin Y in primary (IgY1) and secondary (IgY2) responses, were measured as log2 of the reciprocal of the highest dilution in which there was complete hemaglutination (Wegmann and Smithies, Reference Wegmann and Smithies1966). In order to distinguish between IgM and IgY, a 2-mercaptoethanol treatment was used (Capel et al., Reference Capel, Gerlag, Hagemann and Koene1980). Descriptive statistics of all traits phenotypes are shown in Supplementary Table S1.
Genotyping and quality control
Blood samples were collected from the brachial vein by standard venipuncture and were genotyped with the chicken 60K SNP BeadChip produced by Illumina Inc. for GWMAS consortium. Quality controls were performed in PLINK v1.90 package (Chang et al., Reference Chang, Chow, Tellier, Vattikuti, Purcell and Lee2015). Samples with a call rate less than 90% were removed and SNPs with the following specifications were excluded from the association test: (a) difference between observed and expected heterozygosity greater than 0.15; (b) minor allele frequency less than 0.05; (c) missing rate greater than 0.1; (d) unknown chromosome number and position; and (e) those located on sex chromosomes. The SNP characteristics in the original SNP-chip output was based on the reference genome assembly 2.1 Ensembl release 67 which we updated it based on chicken genome assembly Gallus_gallus-5.0.
Statistical analysis
We performed univariate tests of association using mixed linear model employing genomic relationship matrix (GRM). Single nucleotide polymorphisms effects were calculated using single marker regression that associate each SNP to phenotypes individually. To estimate the variance explained by the SNPs that were used to estimate the GRM we performed a restricted maximum likelihood analysis. Genome-wide Complex Trait Analysis software was used to perform mixed linear model analysis. The model included the fixed effects of hatch, sex, and SNP additive effect and random polygenic effect captured by the GRM. In order to account for multiple comparisons, a chromosomal false discovery rate (FDR) of 0.05 and 0.1 used as significant and suggestive thresholds, respectively (Benjamini and Hochberg, Reference Benjamini and Hochberg1995). The univariate linear mixed model for each SNP marker is as follows:
 ${\bf{y}} {\equals}{\bf{W}} _{\alpha } {\plus}{\bi x}{{\bf \beta }} {\plus}{\bf{u}} {\plus}{\bf{{\varepsilon}}} $
in this equation, y is an n × 1 vector of phenotypic values for n individuals, W an n × c matrix of covariates (fixed effects, i.e. sex, hatch) including a column vector of 1, α is a c × 1 vector of corresponding coefficients including the intercept, x an n × 1 vector of marker genotypes at the locus tested, β the corresponding effect size of the marker and all effects are reported for the minor allele in each marker, u an n × 1 vector of random polygenic effects with a covariance structure as u ∼ N(0, KV g ), where K represents a known n × n genetic relatedness matrix derived from SNP markers and V g the polygenic additive variance, and ε is an n × 1 vector of random residuals with ε ∼ N(0, IV e ), where I is an n × n identity matrix and V e the residual variance component.
Linkage disequilibrium (LD) scores r 2 between adjacent markers were calculated to show the degree of connectedness of significant SNPs in a given genome region. This score ranges from 0 to1 and the higher score indicates a stronger connectedness between the markers.
Candidate gene discovery and pathway analysis
The pathway annotations associated with genes located in the upstream/downstream interval of 0.25 Mb of the significant SNPs were studied. Although in the present population, the average distance between adjacent SNPs (with average r 2 > 0.5) was around 80 kb, markers located within the regions of 0.25 Mb around significant SNPs (FDR < 0.1). Other studies on chicken populations have used up to 1 Mb interval for associated SNPs to study harboring candidate genes (Luo et al., Reference Luo, Qu, Ma, Wang, Li, Yang, Hu, Li and Shu2013).These genes were identified using getBM function in the biomaRt package for R program (Durinck et al., Reference Durinck, Spellman, Birney and Huber2009). The pathway analysis was done using database for annotation and visualization and the integrated discovery (DAVID) bioinformatics resource 6.7 (Huang et al., Reference Huang, Sherman, Tan, Kir, Liu, Bryant, Guo, Stephens, Baseler and Lane2007). An FDR level of 0.1 was used as a criteria to determine the significant biochemical pathways. The kyoto encyclopedia of genes and genomes and REACTOME databases were selected as the source of biological pathways. We used STRING database to predict protein–protein interactions of the proteins related to the detected candidate genes around significant SNPs (Szklarczyk et al., Reference Szklarczyk, Morris, Cook, Kuhn, Wyder, Simonovic, Santos, Doncheva, Roth and P. Bork “Von mering2017).
Results and discussions
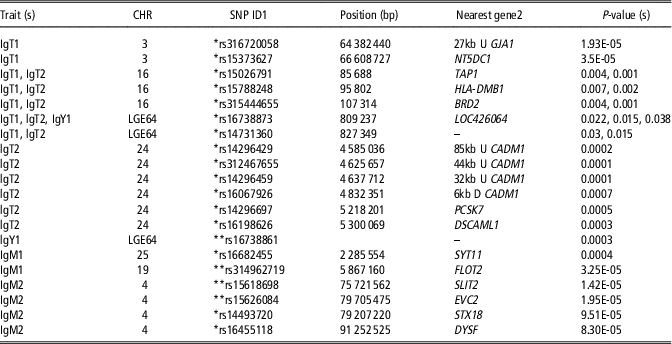
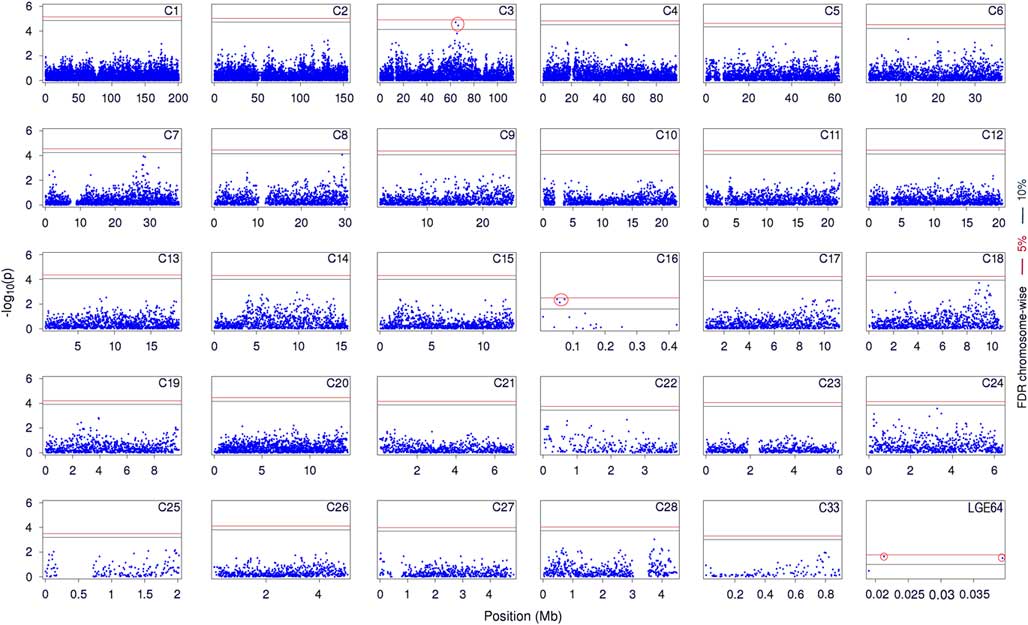
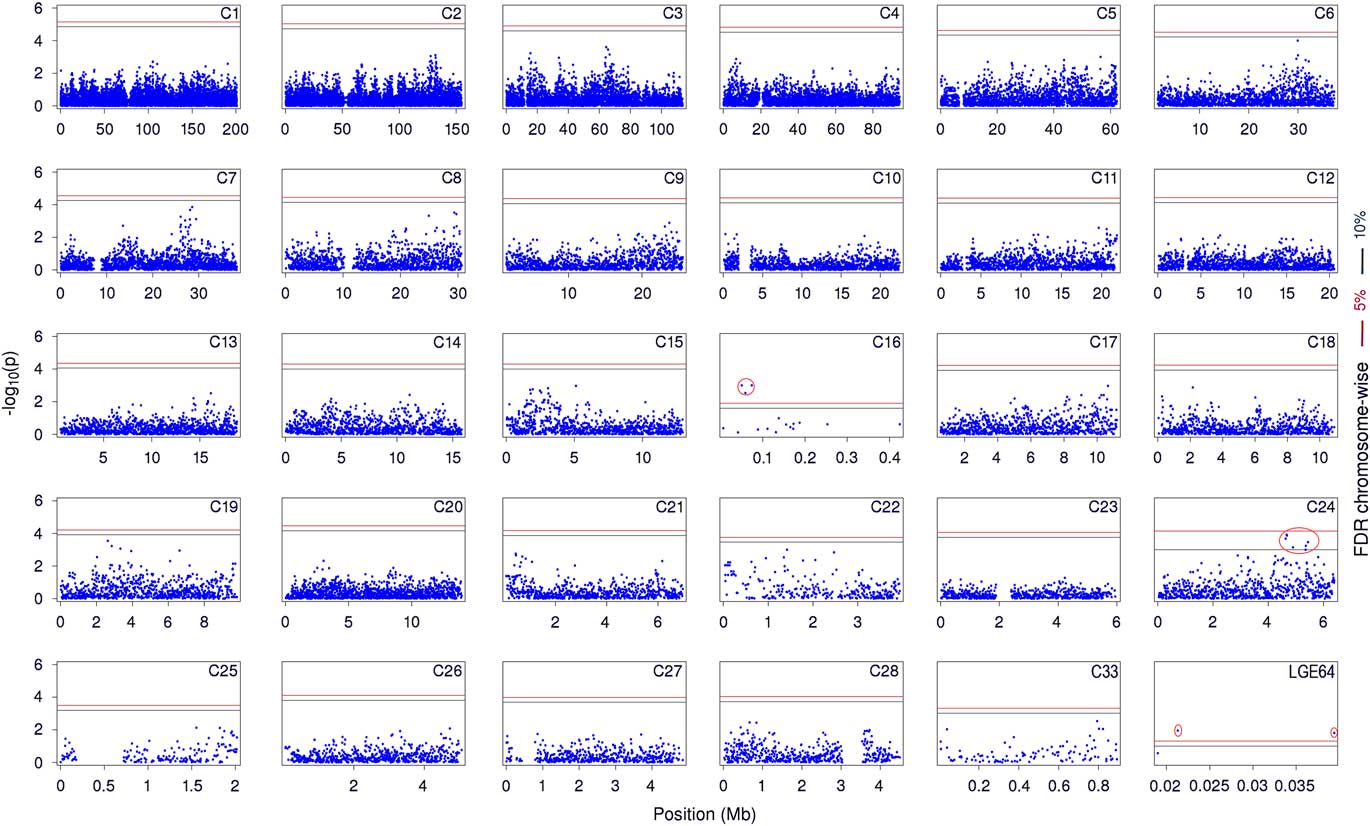
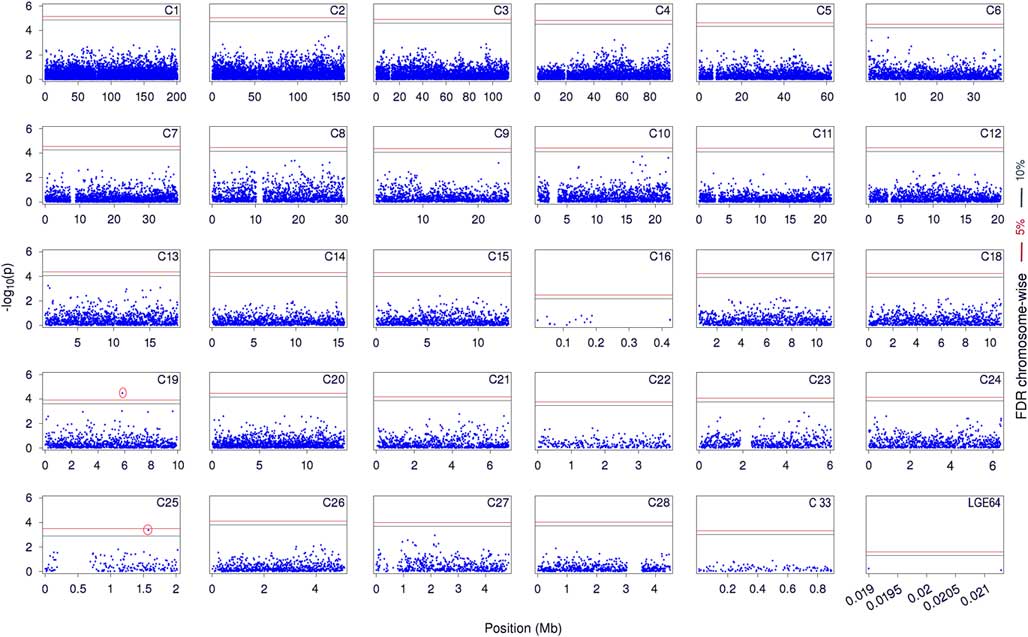
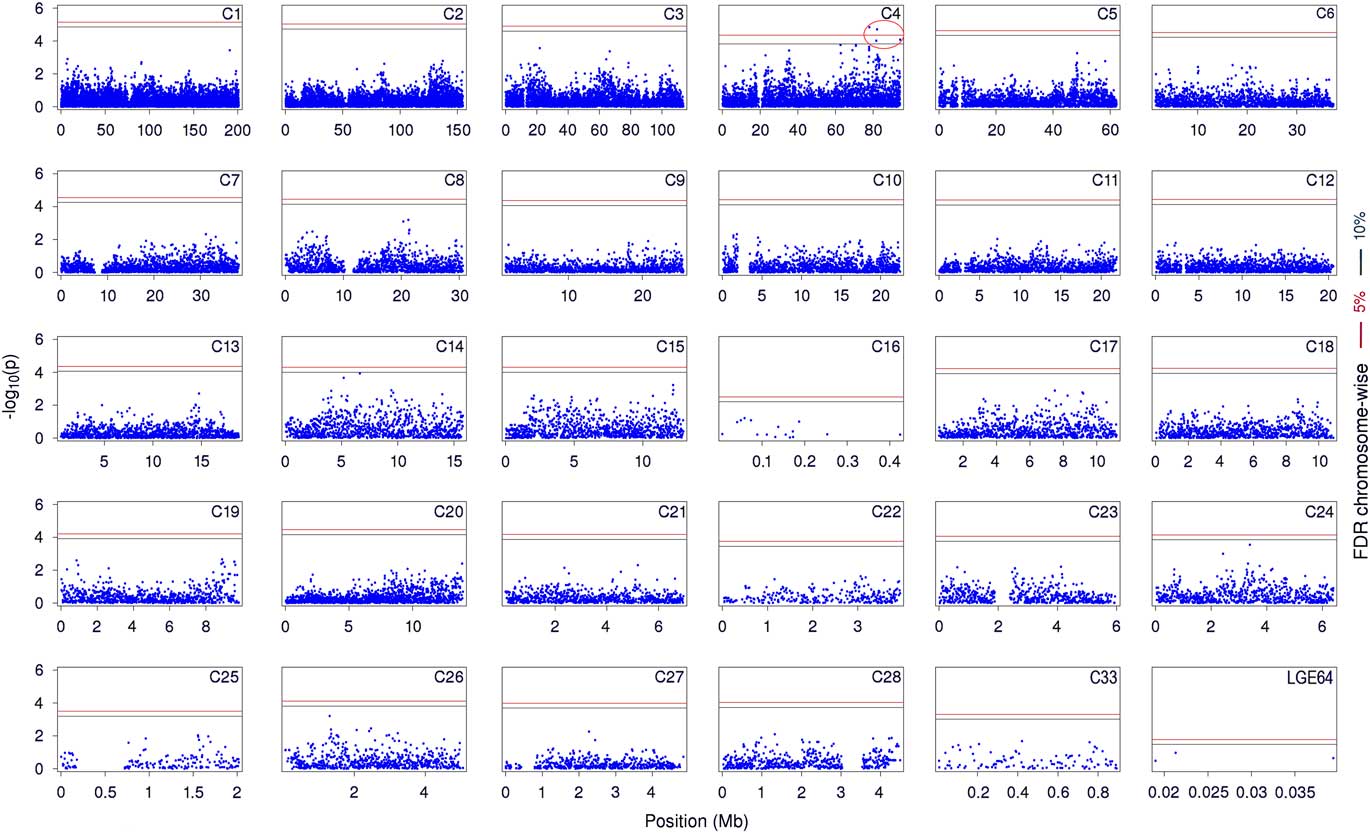
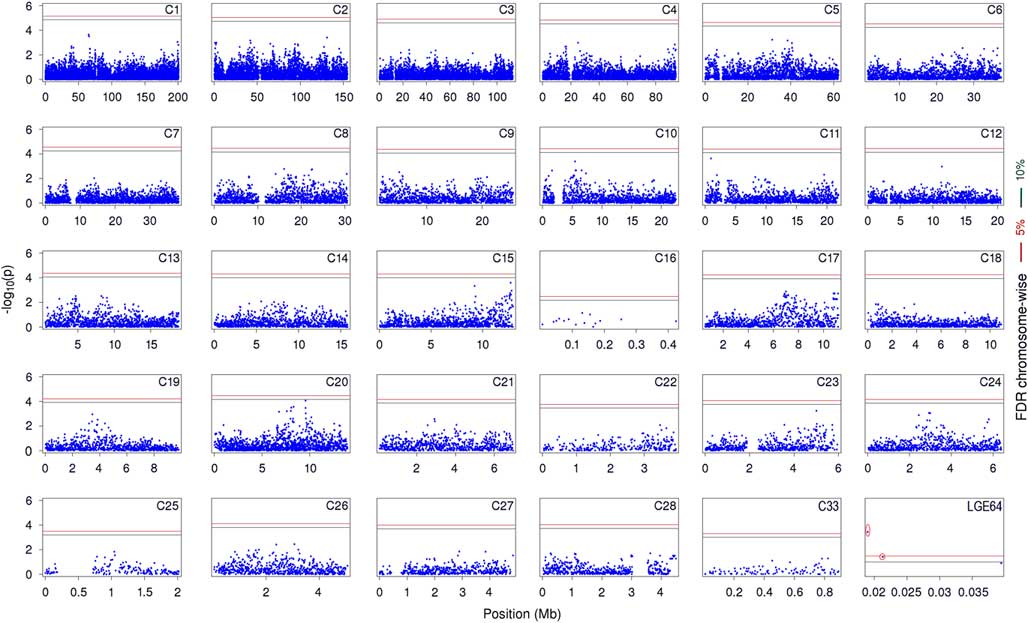
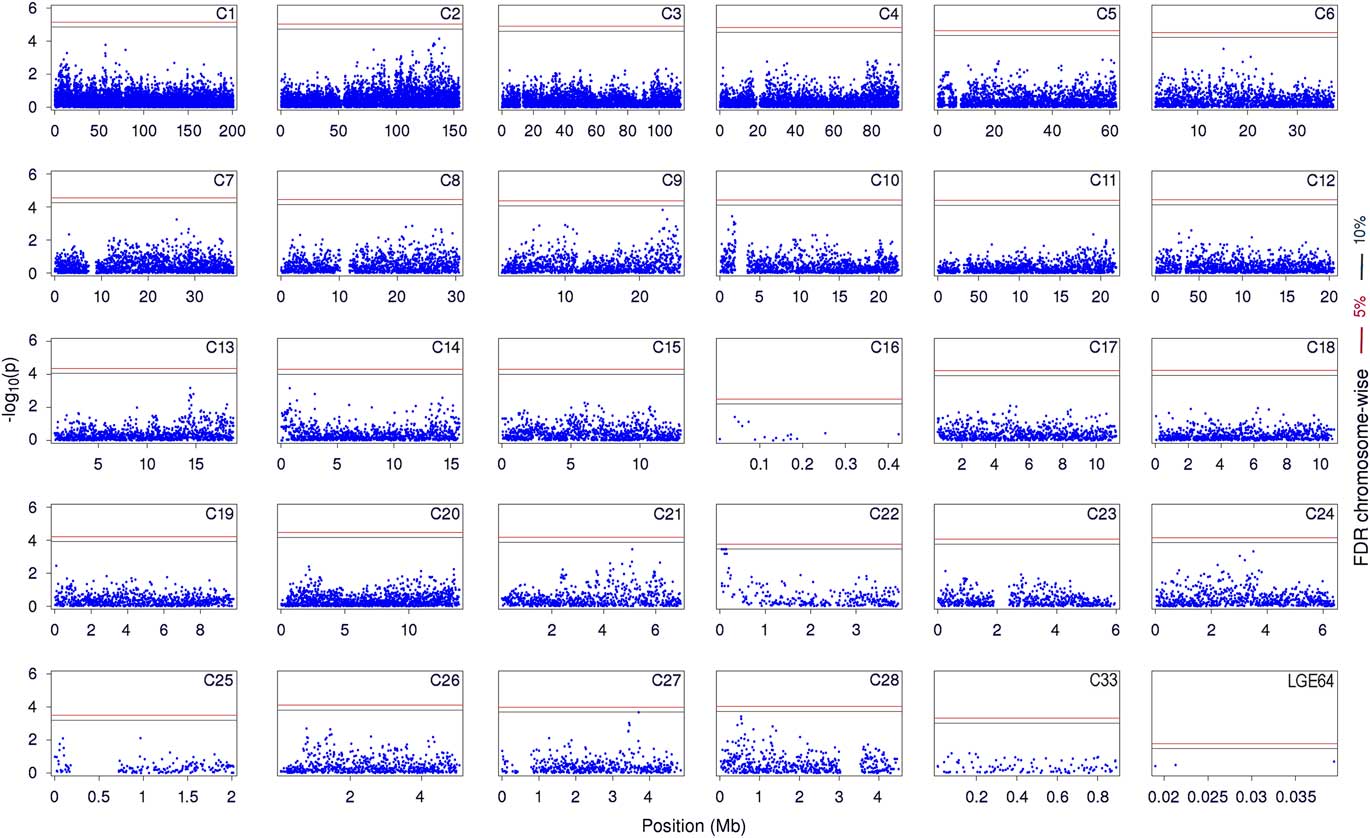
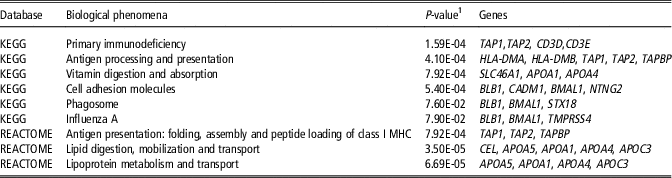
The result of data quality control is shown in Supplementary Table S2. About 45 000 markers and 290 phenotypes were analysed for each trait. In total, 26 SNPs, consisting of 17 suggestively associated SNPs and nine significantly associated SNPs identified for all six traits. The numbers of significant SNPs detected for the observed traits, and their details, including their positions in the genome, the nearest known genes, and the P-values presented in Table 1. We also represented the global view of P-values (−log10) for all SNP markers of each trait by a manhattan plot. Figures 1 and 2 show the manhattan plots for total primary and secondary immunoglobulin, respectively. Figures 3 and 4 show the manhattan plots for primary and secondary immunoglobulin Y, respectively. The manhattan plot for primary and secondary immunoglobulin M are shown in Figure 5 and 6, respectively. As shown in Table 2, pathway analysis in DAVID showed that nine biological pathways are associated with antibody production in poultry (FDR < 0.1). Of these overrepresented biochemical pathways, five pathways directly involve in the immune system, including the antigen processing and presentation, primary immunodeficiency, phagosome, influenza A and folding, assembly and peptide loading of class I major histocompatibility complex (MHC). Four remaining pathways had pivotal indirect effects on the immune system, including vitamin digestion and absorption, cell adhesion, lipid digestion, mobilization, and transport, and lipoprotein metabolism and transport (Supplementary Figure 1). In the figure, the relationship between the pathways of processing and the presentation of antigens (HLA-DMA, HLA-DMB, TAP1, TAPBP and TAP2), primary immunodeficiency (TAP1, TAP2, CD3D and CD3E), cell adhesion molecules (BLB1 or HLA-DMA), influenza A (TMPRSS4 and HLA-DMA) and the metabolism of lipids and vitamins (CEL, APOA5, APOA1, APOA4 and APOC3) are visualized. Protein–protein interaction network for the detected candidate genes. Network nodes represent proteins, edges represent protein–protein associations. The colored nodes are query proteins and first shell of interactors and white nodes are second shell of interactors. The empty nodes mean proteins of unknown three-dimensional structure and the filled nodes indicate that the protein structure is known or predicted.
Suggestively (false discovery rate (FDR) < 0.1) and significantly (FDR < 0.05) associated single nucleotide polymorphisms (SNPs) with antibody responses against sheep red blood cell in chicken

CHR = Chromosome; SNP ID = Single nucleotide polymorphism id; IgT1 = Total primary immunoglobulin; IgT2 = Total secondary immunoglobulin; IgY1 = Primary immunoglobulin Y; IgM1 = Primary immunoglobulin M; IgM2 = Secondary immunoglobulin M.
GJA1 = Gap Junction Protein Alpha 1; NT5DC1 = 5’-Nucleotidase Domain Containing 1; TAP1 = Transporter 1; HLA-DMB1 = human leukocyte antigen DM Beta; BRD2 = Bromodomain Containing 2; LOC426064 = uncategorized gene; CADM1 = Cell Adhesion Molecule 1; PCSK7 = Proprotein Convertase Subtilisin/Kexin Type 7; DSCAML1 = DS Cell Adhesion Molecule Like 1; SYT11 = Synaptotagmin 11; FLOT2 = Flotillin 2; SLIT2 = Slit Guidance Ligand 2; EVC2 = EvC Ciliary Complex Subunit 2; STX18 = Syntaxin 18; DYSF = Dysferlin.
1 *,**Indicate suggestive (FDR < 0.1) and significant (FDR < 0.05) association, respectively.
2 Genes located around 250 kb upstream and downstream of the SNP were searched. U indicates that the SNP is upstream of the gene, gene name alone indicates that the SNP is within the gene and D indicates that the SNP is downstream of the gene.
Manhattan plot for total primary immunoglobulin (lgT1) titter in chicken. The x-axis is the position of each single nucleotide polymorphism on the chicken chromosomes 1 to 28, 33 and linkage group LGE64 and the y-axis is the −log10 P-value. The upper red and lower green lines indicate chromosome-wise 5% and 10% false discovery rate (FDR), respectively.

Manhattan plot for total secondary immunoglobulin (lgT2) in chicken. The x-axis is the position of each single nucleotide polymorphism on the chicken chromosomes 1 to 28, 33 and linkage group LGE64 and the y-axis is the −log10 P-value. The upper red and lower green lines indicate chromosome-wise 5% and 10% false discovery rate (FDR), respectively.
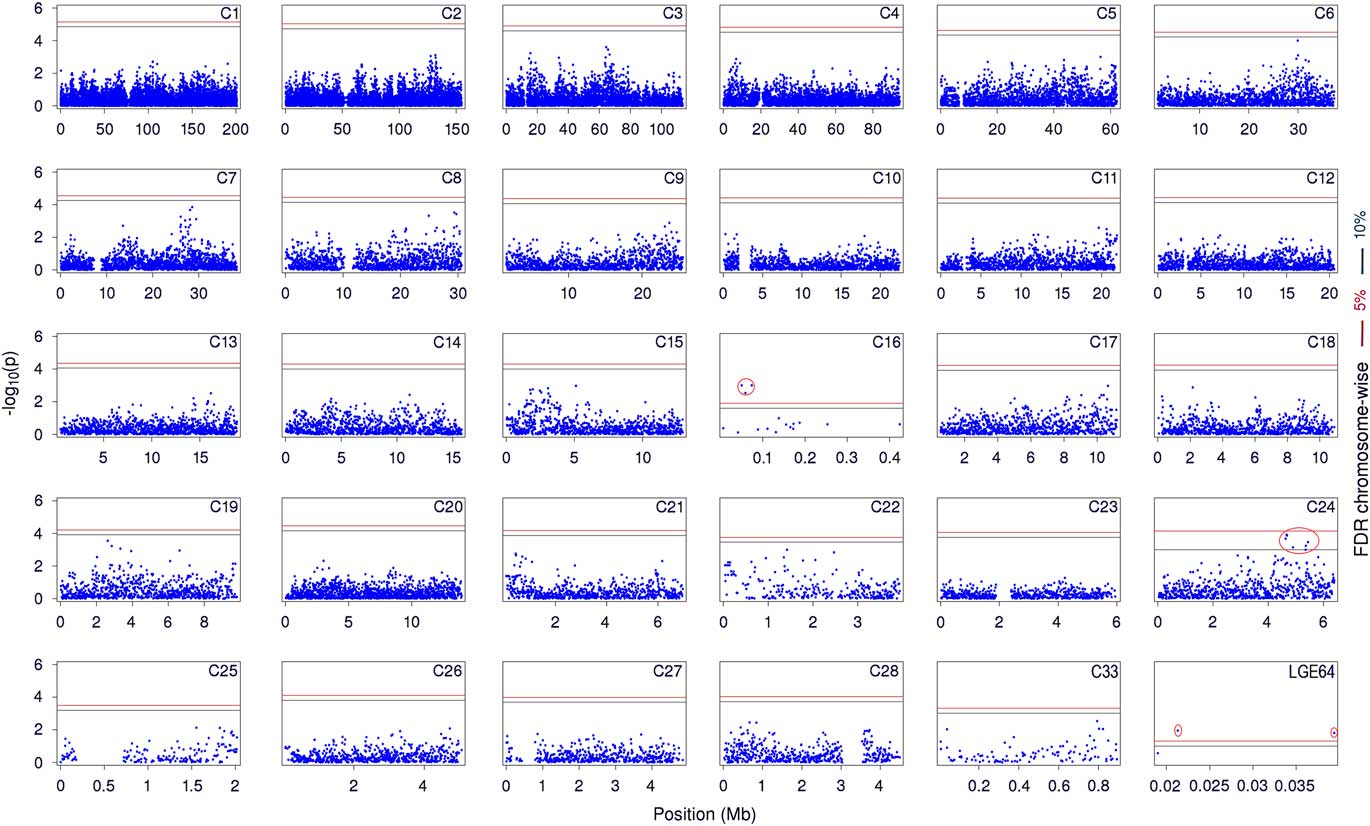
Manhattan plot for primary immunoglobulin (IgM1) titter in chicken. The x-axis is the position of each single nucleotide polymorphism on the chicken chromosomes 1 to 28, 33 and linkage group LGE64 and the y-axis is the −log10 P-value. The upper red and lower green lines indicate chromosome-wise 5% and 10% false discovery rate (FDR), respectively.

Manhattan plot for secondary immunoglobulin M (IgM2) titter in chicken. The x-axis is the position of each single nucleotide polymorphism on the chicken chromosomes 1 to 28, 33 and linkage group LGE64 and the y-axis is the −log10 P-value. The upper red and lower green lines indicate chromosome-wise 5% and 10% false discovery rate (FDR), respectively.

Manhattan plot for primary immunoglobulin Y titter in chicken. The x-axis is the position of each single nucleotide polymorphism on the chicken chromosomes 1 to 28, 33 and linkage group LGE64 and the y-axis is the −log10 P-value. The upper red and lower green lines indicate chromosome-wise 5% and 10% false discovery rate (FDR), respectively.

Manhattan plot for secondary immunoglobulin titter in chicken. The x-axis is the position of each single nucleotide polymorphism on the chicken chromosomes 1 to 28, 33 and linkage group LGE64 and the y-axis is the −log10 P-value. The upper red and lower green lines indicate chromosome-wise 5% and 10% false discovery rate (FDR), respectively.

Functional annotation in KEGG and REACTOME databases for candidate genes associated to antibody mediated responses in chicken (P < 0.1)

KEGG = Kyoto Encyclopedia of Genes and Genomes; REACTOME = REACTOME pathway database; TAP1 = Transporter 1; TAP2 = Transporter 2; CD3D = CD3d molecule; CD3E = CD3e molecule; HLA-DMA = human leukocyte antigen DM Alpha; HLA-DMB1 = human leukocyte antigen DM Beta 1; TAPBP = Transporter BP; SLC46A1 = Solute Carrier Family 46 Member 1; APOA1 = Apolipoprotein A1; APOA4 = Apolipoprotein A4, BLB1 = Major histocompatibility complex (MHC) class II beta chain BLB1; CADM1 = Cell Adhesion Molecule 1; BMAL1 = Brain and Muscle ARNT-Like 1; TMPRSS4 = Transmembrane Protease Serine 4; CEL = Carboxyl Ester Lipase; APOC3 = Apolipoprotein C3; APOA5 = Apolipoprotein A5; NTNG2 = Netrin G2; STX18 = Syntaxin 18.
1 The threshold of EASE score, a modified Fisher Exact P-value, for gene-enrichment analysis.
Out of seven SNPs that were significant for IgT1, five SNPs were in common to IgT2 which indicates a dependency of these two traits in terms of the genomic regions controlling their phenotypes in chicken (Table 1). All these SNPs were suggestively associated to IgT1 but significantly associated to IgT2. Since in secondary immune response antibody is produced more rapidly and in greater quantity rather than primary response, the SNPs effects are relatively higher and they have passed the significant threshold (FDR < 0.05). Three of these markers were located on chromosome 16 in an area of 21 kb in length, and the LD between them was higher than 0.8. In the chicken, chromosome 16 plays a central role in the immune response, especially because it contains MHC (Zhang et al., Reference Zhang, Li, Liu, Zheng, Sun, Wu, Hu, Wen and Zhao2015).
The SNP rs15026791 is located within transporter associated with antigen processing 1 (TAP1) on chromosome 16. This protein belongs to the ATP-dependent family of transporters. TAP1 transports peptides derived from proteolytic degradation in the proteasome into the endoplasmic reticulum (ER) to load them onto empty class I major MHC molecules in conjunction with β2-microglobulin. Afterward, this complex is transported to the cell surface and presented to class I-restricted CD8+ cytotoxic T lymphocytes (Zeidler et al., Reference Zeidler, Eissner, Meissner, Uebel, Tampe, Lazis and Hammerschmidt1997). Another SNP was located within the intron region of human leukocyte antigen DM (HLA-DMB1) which encodes a protein anchored in the membrane that plays a central role in the peptide loading of MHC class II molecules by helping to release the CLIP (class II-associated invariant chain peptide) molecule from the peptide binding site. HLA-DMB1 molecules are expressed in antigen presenting cells (B lymphocytes, dendritic cells, macrophages) (Pyo et al., Reference Pyo, Hur, Kim, Kim and Kim2003).
Moreover, the SNP rs315444655 was located within bromodomain-containing protein 2 (BRD2), a critical component for macrophage inflammatory responses that has activities specific for TLR7- or TLR9-mediated Nuclear Factor Kappa B (NF-kB) transcriptional activation (Chiang et al., Reference Chiang, Engel, Opaluch, Ramos, Maestre, Secundino, De Jesus, Nguyen, Welch and Bonamy2012). Although BRD2 is located in the MHC region, the influence of MHC on the link between BRD2 and immune regulation is not clear. Recently, BRD2 has been demonstrated as a target for the pharmacological control of gene expression and it could participate in the regulation of immune response genes (Prinjha and Tarakhovsky, Reference Prinjha and Tarakhovsky2013). Low levels of BRD2 are associated with the reduced cytotoxic cytokine production by in vitro triggered macrophages (Prinjha and Tarakhovsky, Reference Prinjha and Tarakhovsky2013). For chromosome 16 of chicken, two quantitative trait loci (QTLs) for titers of Natural antibodies (Biscarini et al., Reference Biscarini, Bovenhuis, Van Arendonk, Parmentier, Jungerius and Van Der Poel2010) and serum concentrations of IgY (Zhang et al., Reference Zhang, Li, Liu, Zheng, Sun, Wu, Hu, Wen and Zhao2015) were reported near the SNP rs15788248 found here. Around significant regions in the present study, several QTLs for natural antibodies, acquired antibody titers for the Newcastle disease and complement activity have been reported (Biscarini et al., Reference Biscarini, Bovenhuis, Van Arendonk, Parmentier, Jungerius and Van Der Poel2010).
There were six SNPs detected on chromosome 24 as being suggestively associated with the IgT2 (Figure 1). As shown in Table 1, three of these SNPs were mapped around cell adhesion molecule 1 (CADM1) in an area of 52 kb in length, while the average LD between them was higher than 0.8. CADM1 stimulates interleukin 22 expression in activated CD8+ T-cells (Galibert et al., Reference Galibert, Diemer, Liu, Johnson, Smith, Walzer, Comeau, Rauch, Wolfson, Sorensen, Van der Vuurst de Vries, Branstetter, Koelling, Scholler, Fanslow, Baum, Derry and Yan2005). It also interacts with class I-restricted T-cell-associated molecule and promotes cytotoxicity of NK cells and interferon-γ secretion of CD8+ T cells (Boles et al., Reference Boles, Barchet, Diacovo, Cella and Colonna2005). One SNP (rs14296697) was mapped within proprotein convertase subtilisin/kexin type 7 (PCSK7) that have an important function in MHC I-mediated antigen presentation (Leonhardt et al., Reference Leonhardt, Fiegl, Rufer, Karger, Bettin and Knittler2010). A QTL for antibody response against SRBC on chromosome 24 at 2.5 Mb (Dorshorst et al., Reference Dorshorst, Siegel and Ashwell2011) and another one at 4.5 Mb for natural antibody titers (Biscarini et al., Reference Biscarini, Bovenhuis, Van Arendonk, Parmentier, Jungerius and Van Der Poel2010) were reported.
The SNP rs16682455 on chromosome 25 and rs314962719 on chromosome 19 were suggestively and significantly associated with IgM1, respectively (Figure 3). The former is located within synaptotagmin XI (SYT11), a regulator of neurotransmitter release fundamental for the regulation of cytokine secretion and phagocytosis (Duque and Descoteaux, Reference Arango Duque and Descoteaux2014). A QTL for salmonella colonization was detected on chromosome 25 near rs16682455 (Fife et al., Reference Fife, Howell, Salmon, Hocking, van Diemen, Jones, Stevens and Kaiser2011). The second SNP located within the intron region of flotillin 2 (FLOT2) which is thought to involve in neuronal signaling and cell–cell junctions. This gene is expressed in human B cells and affecting on their functions (Solomon et al., Reference Solomon, Masilamani, Rajendran, Bastmeyer, Stuermer and Illges2002). FLOT2 prevents Fas (a member of tumor necrosis factor superfamily) mediated apoptosis and plays crucial functions in cellular homeostasis and cell survival (Wei et al., Reference Wei, Moon, Zheng, Liang, An and Jin2013).
There were four SNPs in a region of 16 Mb on chromosome 4, 2 suggestive and 2 significant, associated with IgM level in secondary immune responses against SRBC (Figure 4). One SNP was mapped within slit homolog 2 (SLIT2) gene. SLIT2 has different roles, such as decreasing inflammation and disease progression, regulating axon guidance in neuronal cells, regulating chemotaxis and HIV infection in leukocytes, regulating metastasis and proliferation in carcinoma cells and regulating angiogenesis in endothelial cells (Zhao et al., Reference Zhao, Anand and Ganju2014). Moreover, the binding of the functional region of SLIT2 to Roundabout receptor 1(Robo-1) could initiate a cascade of events leading to altered cell proliferation, migration, apoptosis and angiogenesis. SLIT2 and Robo-1 inhibit chemotaxis of neutrophils, T lymphocytes and dendritic cells to diverse chemoattractants (Chaturvedi et al., Reference Chaturvedi, Yuen, Bajwa, Huang, Sokollik, Huang, Lam, Tole, Liu, Pan, Chan, Sokolskyy, Puthia, Godaly, John, Wang, Lee, Brumell, Okusa and Robinson2013).
One SNP at 78.7 Mb on chromosome 4 is located within ellis van creveld syndrome 2 (EVC2). This gene encodes a protein that functions in bone formation and skeletal development (Ruiz-Perez et al., Reference Ruiz-Perez, Blair, Rodriguez-Andres, Blanco, Wilson, Liu, Miles, Peters and Goodship2007). It also positively regulates Hedgehog (Hh) signaling pathway (Ruiz-Perez et al., Reference Ruiz-Perez, Blair, Rodriguez-Andres, Blanco, Wilson, Liu, Miles, Peters and Goodship2007). Hedgehog signaling regulates multiple stages of T-cell development and promotes differentiation of type 2 helper T-cells (Furmanski et al., Reference Furmanski, Saldana, Ono, Sahni, Paschalidis, D’Acquisto and Crompton2013). The rs14493720 SNP is located within syntaxin 18 (STX18). This gene controls the organization of ER subdomains and involved in transport between the ER and Golgi compartments. STX18, by participation in the phagocytosis, involves in killing and degrading pathogens for antigen presentation and controls key aspects of innate and adaptive immunity (Campbell-Valois et al., Reference Campbell-Valois, Trost, Chemali, Dill, Laplante, Duclos, Sadeghi, Rondeau, Morrow and Bell2012).
Another SNP, rs16455118, is located within dysferlin, a sarcolemmal protein that plays important roles in membrane muscles repair and regulation of cell adhesion in monocytes (de Morrée et al., Reference De Morrée, Flix, Bagaric, Wang, van den Boogaard, Grand Moursel, Frants, Illa, Gallardo, Toes and van der Maarel2013). Dysferlin deficiency causes reduced cytokine and chemokine secretion (de Morrée et al., Reference De Morrée, Flix, Bagaric, Wang, van den Boogaard, Grand Moursel, Frants, Illa, Gallardo, Toes and van der Maarel2013). Mutations in dysferlin deficiency causes several muscular dystrophies, known as the dysferlinopathies that characterized by muscle inflammation, defective monocyte function, active involvement of the complement system and toll-like receptors, the presence of mononuclear cell infiltrates and cytokine and chemokine components and increased NF-κB signaling (Uaesoontrachoon et al., Reference Uaesoontrachoon, Cha, Ampong, Sali, Vandermeulen, Wei, Creeden, Huynh, Quinn, Tatem, Rayavarapu, Hoffman and Nagaraju2013). Three QTLs associated with antibody responses against the Avian Influenza Virus near present findings on chromosome 4 were reported (Zhang et al., Reference Zhang, Li, Liu, Zheng, Sun, Wu, Hu, Wen and Zhao2015). There were two SNPs, rs16738873 and rs16738861, which were associated at suggestive and significant levels with the plasma level of IgY1, respectively (Figure 5). These SNPs were located on the linkage group LGE64. Marker rs16738873 mapped within LOC426064, a protein with unknown function. Of the 45 226 markers analysed for the IgY2, none of them showed any significant association with the plasma level of IgY2 (Figure 6).
In short, this study identified 26 genomic regions underlying six immune traits in chickens, some previous QTLs near these regions have been reported in previous genome wide association studies. Interestingly, there were the same regions associated with multiple immune-related traits. Antibody levels in the secondary immune response are higher than the primary response. Probably this is the reason that has caused suggestive SNPs (FDR < 0.1) for primary response pass the significant threshold (FDR < 0.05) in the secondary response. Chromosome 16 of chicken is known as a key factor affecting the immunity system in chicken, especially because the MHC has taken place on it. We found a region of almost 21 kb with average LD greater than 0.8 on this chromosome was significantly associated with total immunoglobulin levels in chicken blood plasma. In this study, all nine biologic pathways that have a significant association with the antibody titre have also known associations with different parts of the immune system. These findings provide useful molecular information for humoral immunity and disease resistance in chicken. Further studies (e.g. gene expression analysis) on the loci and the genes that we found here could help to determine the functional properties of presented phenotypes of antibodies in chicken.
Acknowledgements
The authors would like to thank Tarbiat Modares University and Aarhus University for providing financial support, Staff of Arian Line Breeding Center and West Azarbaijan Native Fowls Breeding Center for providing parents of F1 chickens. The authors would like to thank Dr Ali Maghsoodi and Rahim Dideban for their important contributions to provide the phenotypic data. Access to the developed 60K SNP Illumina chicken array was kindly provided by the USDA Chicken GWMAS Consortium, Cobb Vantress and Hendrix Genetics for access to the developed 60K SNP Illumina chicken array. The authors would like to express our deepest gratitude to Dr Mehdi Sargolzaei from the University of Guelph for all of his assistance in statistical analysis and manuscript preparation. The authors sincerely commend Dr Just Jensen from Aarhus University for his support for the genotyping of birds as well as his valuable advice during this project. The authors thank GWMAS consortium for allowing us to use the chicken 60K SNP chip.
Declaration of interest
The authors declare that there is no conflicts of interest regarding the publication of this article.
Ethics statement
All experimental procedures were approved by the Animal Care Committee of Tarbiat Modares University.
Software and data repository resources
None of the data were deposited in an official repository due to commercial purposes.
Supplementary material
To view supplementary material for this article, please visit https://doi.org/10.1017/S1751731118003014