


1 Introduction
Random walks on graphs are a key concept in network theory used to model various dynamics such as user navigation and epidemic spreading [Reference Newman32], to quantify node centrality [Reference Newman33, Reference Noh and Rieger34] or to reveal communities and core–periphery structures [Reference Cucuringu, Rombach, Lee and Porter12, Reference Della Rossa, Dercole and Piccardi13, Reference Rombach, Porter, Fowler and Mucha37, Reference Tudisco and Higham41]. The standard random walk on a graph considers a hypothetical walker that starting from node i moves to a new node of the graph choosing it uniformly at random among the neighbours of i. This defines a memoryless stochastic process which corresponds to a Markov chain on the nodes. However, the process described by a standard graph random walk is often localised and may fail to capture the underlying physical model as well as to fully exploit the global graph structure. For this reason, there is a growing interest in recent years towards so-called higher-order stochastic processes whose evolution may depend on past states, including stochastic processes modelled by transition probability tensors [Reference Benson, Gleich and Lim7, Reference Fasino and Tudisco15] as well as non-local diffusion mappings [Reference Cipolla, Durastante and Tudisco10, Reference Estrada, Delvenne, Hatano, Mateos, Metzler, Riascos and Schaub14] and non-backtracking random walks [Reference Fitzner and Hofstad16].
The latter is one of the best-known examples of second-order stochastic processes, where node transitions depend on both the current and the previous state spaces as the process is not allowed to backtrack, i.e. to immediately revisit the previous space in the next step. Non-backtracking random walks are often more appropriate than classical random walks to model real-world diffusive phenomena on networks where a message-passing or disease-spreading analogy is relevant. In particular, non-backtracking walks can avoid unwanted localisation effects on the leading eigenvector of the adjacency matrix of a graph [Reference Kawamoto20, Reference Krzakala, Moore, Mossel, Neeman, Sly, Zdeborová and Zhang23, Reference Martin, Zhang and Newman28] and their mixing rate, in many cases, is faster than the one of classical random walks [Reference Alon, Benjamini, Lubetzky and Sodin1, Reference Cioabă and Xu9]. Furthermore, many computations with non-backtracking walks have negligible overheads compared to standard approaches [Reference Arrigo, Grindrod, Higham and Noferini2, Reference Grindrod, Higham and Noferini17].
The non-backtracking paradigm is at the basis of several second-order stochastic processes appearing in recent graph-theoretic, network mining and machine learning literature. For example, the mixing time of a clique-based version of the non-backtracking random walk on regular graphs is studied in [Reference Cioabă and Xu9]. Similarity measures based on second-order random walks are used in [Reference Wu, Bian and Zhang44] to measure node proximity and improve classical walk-based link prediction and clustering algorithms. Eigenvalues and eigenvectors of non-backtracking matrices have been shown to provide remarkable performances in community detection and in various centrality measurements [Reference Arrigo, Grindrod, Higham and Noferini2, Reference Krzakala, Moore, Mossel, Neeman, Sly, Zdeborová and Zhang23, Reference Torres, Chan, Tong and Eliassi-Rad39]. The graph embedding generated by the popular node2vec algorithm [Reference Grover and Leskovec18] is based on a flexible second-order random walk depending on two parameters: one used to control the likelihood of backtracking (i.e. immediately revisiting a node in the walk) and the other used to bias the navigation towards or away from the immediately preceding nodes.
In this work, we are concerned with hitting and return times of second-order random walks on graphs with possibly countably many vertices. Roughly speaking, a hitting time is the first time at which a stochastic process reaches a given subset of its state space, while a return time is the first time the process gets back to a given starting state. Hitting and return times are well understood for Markov chains, which include as a particular case the stochastic process that describes a standard random walk on a graph. In this case, the state space is given by the set of nodes and explicit formulas are available to compute mean hitting and return times by means of suitable systems linear equations which, for finite and connected graphs, have unique solutions. Moreover, these quantities have numerous applications to, for example, quantify node distances and similarities. For this reason, they are an important tool to evaluate network cohesion and node centrality and are at the basis of popular node classification and link prediction algorithms [Reference Liben-Nowell and Kleinberg26, Reference Nadler, Srebro and Zhou31].
In this paper, we extend several results concerning mean hitting and return times of standard first-order stochastic processes to the second-order setting. In particular, we show that also mean hitting times of second-order random walks can be obtained from a set of linear equations, which has potential applications in higher-order classification and link prediction methods [Reference Arrigo, Higham and Tudisco4, Reference Benson, Abebe, Schaub, Jadbabaie and Kleinberg6, Reference Tudisco, Benson and Prokopchik40]. Moreover, we prove that mean return times of second-order random walks coincide with standard return times of suitably defined random walks in the original graph. In particular, mean return times for non-backtracking random walks coincide with the usual mean return times in all finite undirected graphs.
The paper is organised as follows. In Sections 2 and 3, we present the notations used in this work and some basic results about random walks and second-order random walks, respectively. In Section 4, we introduce mean hitting times and return times for second-order random walks and we present first results concerning possible ways to compute them numerically via the solution of systems of linear equations. Our main results are in Section 5. There, we analyse second-order mean hitting and return times under what we call ‘equilibrium assumption’, corresponding to the condition that the second-order random walk is at the steady state. In particular, we derive an algebraic relationship between the hitting time matrix for a second-order random walk and the one corresponding to a standard random walk on the directed line graph of the original graph. Moreover, we show second-order analogues of the Kac’s and the Random Target Lemmas for standard Markov chains. Finally, in Section 6, we illustrate some of the results of this paper on some real-world examples.
2 Notations and basic results
An oriented graph (or network) is a pair
 $\mathcal{G}=(V,E)$
, where V is the vertex (or node) set and E is the set of oriented edges, i.e., ordered pairs of nodes. We say that
 $(i,j)\in E$
is an edge going from i to j. From here onward, letters i, j, k denote generic nodes of
 $\mathcal{G}$
, while e, f are used to denote generic edges of
 $\mathcal{G}$
. Furthermore,
-
if
 $e = (i,j)\in E$
, then we set
${\tt S}(e) = i$
and
${\tt T}(e) = j$
, the source and terminal node of the edge e;
-
for
$i\in V$
we denote by
$\mathcal{I}_i = \{e\in E : {\tt T}(e) = i\}$
and
$\mathcal{O}_i = \{e\in E : {\tt S}(e) = i\}$
the in-neighbourhood and out-neighbourhood of i, respectively. The in-degree and the out-degree of node i are
$d^-_i = |\mathcal{O}_i|$
and
$d^+_i = |\mathcal{I}_i|$
, respectively.


In the present work,
 $\mathcal{G}$
can have a countably infinite number of nodes. However, we will assume that
 $\mathcal{G}$
is locally finite, that is, V is possibly infinite but each node has finite in- and out-degree.
A graph
 $\mathcal{G} = (V,E)$
can be completely described by its (possibly infinite dimensional) adjacency matrix
 $A=(A_{ij})$
, defined as
 \begin{equation*}A_{ij}=\begin{cases} 1 & \hbox{ if } (i,j)\in E ; \\[5pt] 0 & \hbox{ otherwise.} \end{cases}\end{equation*}
If the adjacency matrix is symmetric then
 $\mathcal{G}$
is called undirected. Hence, in an undirected graph each edge (i, j) has its own reciprocal edge (j, i). In that case we have
 $d^-_i = d^+_i$
and this common value is the degree of node i, denoted as
 $d_i$
.
A walk of length m on
 $\mathcal{G}$
is a sequence
 $v_0,v_1,\ldots,v_m \in V$
of nodes such that
 $(v_{i-1},v_i)\in E$
for
 $i=1,\ldots,m$
. If for all
 $i,j\in V$
there exists a walk from i to j, then the graph
 $\mathcal{G}$
is called strongly connected.
Finally, the symbols
 $\mathbb{P}$
and
 $\mathbb{E}$
denote the probability and the expectation, respectively. All vectors used in the text are column vectors, with possibly infinitely many entries. In particular, the symbol
 $\mathbb{1}$
denotes the column vector with all entries equal to 1, the size of which should be clear from the context.
2.1 Random walks
In this section, we recall from [Reference Kemeny and Snell21, Reference Norris35] some basic concepts and results in Markov chain theory. A random walk on
 $\mathcal{G}$
is a sequence of nodes
 $v_0,v_1,\ldots,v_k,\ldots$
where
 $v_{k+1}$
is chosen at random between the out-neighbours of
 $v_k$
, according to specified probabilities
 $p_{i,j}:=\mathbb{P}(v_{k+1} = j | v_k = i)$
such that
 $p_{i,j} = 0$
if
 $(i,j)\notin E$
and
 $\sum_{j\in\mathcal{O}_i} p_{i,j} = 1$
for every
 $i\in V$
. The last condition implies that
 $d^+_i \geq 1$
for every
 $i\in V$
, which will be assumed henceforth. A standard choice for
 $p_{i,j}$
is
 $p_{i,j} = 1/d^+_i$
, for
 $j\in \mathcal{O}_i$
. In this case, the random walk is called uniform. Our subsequent discussion is not restricted to this case.
A random walk can be viewed as a Markov chain
 $\{Y_n,n\in\mathbb{N}\}$
with state space V and transition matrix P with entries
 $P_{ij}=p_{i,j}$
. Clearly, P is a row-stochastic matrix. The random variable
 $Y_n$
represents the state of the walker at time n.
For a fixed subset
 $S\subset V$
, we call hitting time to S the random variable
 $T_S$
defined as
 $T_S=\min\{n\in\mathbb{N}:Y_n\in S\}$
. In other words,
 $T_S$
is the first time the random walker reaches the subset S, starting from a given initial state
 $Y_0$
. Based on
 $T_S$
, we can define the hitting probability
 $\varphi_{i\to S}$
from i to S as
 \begin{equation} \varphi_{i\to S}= \mathbb{P}(T_S < + \infty\vert Y_0=i) ,\end{equation}
i.e., the probability that, starting from node i, the random walker ever hits S. When
 $\varphi_{i\to S}=1$
, it is interesting to compute the average time taken by the random walker to reach S, starting from i. This quantity is given by
 \begin{equation*} \tau_{i\to S}=\mathbb{E}(T_S\vert Y_0=i),\end{equation*}
and is called the mean hitting time from i to S. It is well-known that the quantities
 $\varphi_{i\to S}$
and
 $\tau_{i\to S}$
can be obtained from the solution of certain linear systems, as shown by the next two theorems, whose proofs can be found in, e.g., [Reference Norris35].
Theorem 2.1. For a graph
 $\mathcal{G}=(V,E)$
and for a subset
 $S\subset V$
, the hitting probabilities
 $\{\varphi_{i\to S}:i\in V\}$
are the minimal non-negative solution of the following linear system:
 \begin{equation}\begin{cases} \varphi_{i\to S}=1 & \hbox{if $i\in S$}\\[5pt] \varphi_{i\to S}=\sum_{j\in V} P_{i,j}\varphi_{j\to S} & \hbox{if $i\notin S$.} \end{cases}\end{equation}
In the previous theorem, minimality of the solution means that if
 $\{x_i:i\in V\}$
is another non-negative solution of (2.2) then
 $\varphi_{i\to S}\leq x_i$
for all
 $i\in V$
.
Theorem 2.2. For a graph
 $\mathcal{G}=(V,E)$
and for a subset
 $S\subset V$
, suppose that
 $\varphi_{i\to S}=1$
for all
 $i\in V$
. Then the mean hitting times
 $\{\tau_{i\to S}:i\in V\}$
are the minimal non-negative solution of the following linear system:
 \begin{equation}\begin{cases} \tau_{i\to S}=0 & \hbox{if } i\in S \\[5pt] \tau_{i\to S}=1+\sum_{j\in V} P_{i,j}\tau_{j\to S} & \hbox{if } i\notin S . \end{cases}\end{equation}
The case of finite graphs is the most usual in applications. In this case, a well-known result shows that for strongly connected graphs (2.3) has a unique solution, see e.g., Chap. III of [Reference Kemeny and Snell21]. Precisely:
Theorem 2.3. Let
 $\mathcal{G}=(V,E)$
be finite and strongly connected. For any given subset
 $S\subset V$
, all the hitting probabilities to S are equal to 1 and the linear system (2.3) has a unique solution.
As shown in, e.g., Section 1.3 of [Reference Norris35], if
 $\mathcal{G}$
is either infinite or finite but not strongly connected then the solution of the equations (2.2) and (2.3) may not be unique, and the minimality condition is essential for the correct definition of the hitting times and probabilities. It is interesting to note that equation (2.3) can be written in compact matrix-vector form as follows. Let
 $t^S$
and
 $r^S$
be the vectors entrywise defined as follows:
 \begin{equation}t^S_i = \begin{cases} 0 & i\in S \\[5pt] \tau_{i\to S} & i\notin S \end{cases} \qquad r^S_i = \begin{cases} \tau^+_{i\to S} & i\in S \\[5pt] 0 & i\notin S , \end{cases}\end{equation}
where the numbers
 $\tau^+_{i\to S}$
are defined as
 \begin{equation} \tau^+_{i\to S} = 1 + \sum_{j\in V}P_{i,j}\tau_{j\to S} , \qquad (i\in S) \, .\end{equation}
Then, the vector
 $t^S$
solves the singular equation
 \begin{equation} (I-P)x = \mathbb{1} - r^S .\end{equation}
In particular, among the infinitely many solutions x of this equation, the vector
 $t^S$
is the one characterised by the condition
 $t^S_i = 0$
for
 $i\in S$
. The quantities (2.5) are called mean return times and represent the average number of steps required to return to S after leaving it from
 $i\in S$
. Indeed, if we consider the random variable
 $T^+_S = \min \{n \geq 1 : Y_n \in S\}$
, then it holds
 $\tau^+_{i\to S}= \mathbb{E}(T^+_S\vert Y_0=i)$
. The special case when S is a singleton deserves a special attention, and we adopt the simplified notation
 $\tau_i = \mathbb{E}(T^+_i\vert Y_0=i)$
. This quantity is called mean return time to i.
When
 $\mathcal{G}$
is finite and strongly connected, by means of the Perron–Frobenius theorem (see, e.g., [Reference Meyer29]), we can conclude that the random walk
 $\{Y_n,n\in\mathbb{N}\}$
admits a unique positive invariant distribution, i.e., a vector
 $\pi>0$
such that
 $\pi^T\mathbb{1} = 1$
and
 $\pi^T P=\pi^T$
. More generally, when V is countable, the same conclusion holds true if and only if the associated Markov chain is irreducible and positive recurrent, that is,
 $\tau_i$
is finite for at least one
 $i\in V$
, see e.g., Thm. 21.12 of [Reference Levin, Peres and Wilmer25] or Thm. 1.7.7 of [Reference Norris35]. The latter property also implies that all hitting probabilities (2.1) are equal to 1 and all hitting times are finite.
With the help of the invariant distribution, we can obtain an explicit formula for the mean return time to a set
 $S \subset V$
,
 \begin{align*} \tau_S & = \mathbb{E}(T^+_S | Y_0 \in S) \nonumber \\[5pt] & = \sum_{i\in S} \mathbb{P}(Y_0 = i | Y_0 \in S)\mathbb{E}(T^+_S | Y_0 = i) = \frac{1}{\sum_{j\in S} \pi_j} \sum_{i\in S} \pi_i \tau^+_{i\to S} . \end{align*}
This number quantifies the average number of steps taken by a random walker initially placed in S to hit again S, given that its probability of being in node i is proportional to
 $\pi_i$
. Indeed, the number
 $\pi_i/\sum_{j\in S} \pi_j$
gives the conditional probability that the random walker is in i given that it is in S. The average return time
 $\tau_S$
can be computed by means of Kac’s Lemma, see e.g., [Reference Kac19] or Lemma 21.13 of [Reference Levin, Peres and Wilmer25]:
Lemma 2.4. Let
 $\pi$
be the stationary density of an irreducible Markov chain on the state space V. Then for any
 $S\subset V$
,
 \begin{equation*} \tau_S=\frac{1}{\sum_{i\in S} \pi_i}.\end{equation*}
In particular,
 $\tau_i = 1/\pi_i$
for every
 $i\in V$
.
If
 $\mathcal{G}$
is finite then the mean hitting times fulfill the so-called Random Target Lemma, see e.g., Lemma 10.1 of [Reference Levin, Peres and Wilmer25].
Lemma 2.5. Let P be irreducible, and let
 $\pi$
be its stationary density. Then, there exists a constant
 $\kappa$
such that
 \begin{equation*} \sum_{j\in V} \pi_j \tau_{i\to j} = \kappa ,\end{equation*}
independently of
 $i\in V$
.
The number
 $\kappa = \kappa(P)$
appearing in the preceding Lemma is the renowned Kemeny’s constant of P. This constant quantifies the expected number of steps to get from node i to a node j, selected randomly according to the stationary density.
Introducing the matrix
 $T = (\tau_{i\to j})$
, whose ij-th entry is the mean hitting time from i to j, the claim of Lemma 2.5 can be compactly expressed via the identity
 $T\pi = \kappa \mathbb{1}$
. Since the j-th column of T fulfills equation (2.6) with
 $S = \{{\kern1.5pt}j\}$
, using Lemma 2.4 it is not difficult to verify that this matrix solves the equation
 \begin{equation} (I-P)T = \mathbb{1}\mathbb{1}^T - \textrm{Diag}(\pi)^{-1} ,\end{equation}
where
 $\textrm{Diag}(\pi)$
is the diagonal matrix with diagonal entries given by the entries of the vector
 $\pi$
. Actually, the matrix T is the unique solution of (2.7) with zero diagonal entries.
We conclude this review on random walks with a technical lemma of independent interest and that will be useful for later. This result shows that, apart from a constant term, the vector
 $t^S$
defined in (2.4) can be expressed by a convex linear combination of the vectors
 $\{t^i, i\in S\}$
. Hence, mean access times to a subset can be computed from mean access times to the single elements of the set.
Lemma 2.6. For any fixed subset
 $S\subset V$
there exist positive coefficients
 $\beta$
and
 $\{\alpha_i\}$
, for
 $i\in S$
, such that
 $\sum_{i\in S} \alpha_i = 1$
, and
 \begin{equation*} t^S = \sum_{i\in S} \alpha_i t^i - \beta \mathbb{1} .\end{equation*}
In particular,
 $\tau_{i\to S} = \sum_{j\in S} \alpha_j\tau_{i\to j} - \beta$
for every
 $i\in V$
.
Proof. Consider the vector
 $a = (\alpha_i)_{i\in V}$
with entries
 \begin{equation} \alpha_i = \begin{cases} 0 & i\notin S \\[5pt] \pi_i\tau^+_{i\to S} & i\in S . \end{cases}\end{equation}
By (2.6), we have
 \begin{equation*} 0 = \pi^T(I - P)t^S = \pi^T(\mathbb{1} - r^S) = 1 - \sum_{i\in S} \pi_i\tau^+_{i\to S} .\end{equation*}
Hence,
 $\sum_i\alpha_i = \sum_{i\in S}\pi_i\tau^+_{i\to S} = 1$
. Moreover, from (2.7) we derive
 \begin{equation*} (I-P) T a = (\mathbb{1}\mathbb{1}^T - \textrm{Diag}(\pi)^{-1}) a = \mathbb{1} (\mathbb{1}^Ta) - r^S = \mathbb{1} - r^S .\end{equation*}
This proves that the difference
 $Ta - t^S$
belongs to the kernel of
 $I-P$
, that is,
 $\sum_{i\in S} \alpha_i t^i - t^S = \beta \mathbb{1}$
for some
 $\beta\in \mathbb{R}$
. Considering the k-th entry of this identity for
 $k\in S$
, we have
 \begin{equation*} \beta = \sum_{i\in S} \alpha_i \tau_{k\to i} - t^S_k = \sum_{i\in S} \alpha_i \tau_{k\to i} > 0 ,\end{equation*}
and the proof is complete.
3 Second-order random walks
A second-order random walk on a graph
 $\mathcal{G} = (V,E)$
is a walk
 $v_0,v_1,\ldots,v_k,\ldots$
where the probability of choosing
 $v_{k+1}$
depends not only on
 $v_k$
but also on
 $v_{k-1}$
. More precisely, we describe this random walk by means of a stochastic process
 $\{X_n, n \in \mathbb{N}\}$
, where
 $X_n \in V$
represents the node where the walker is located at time n. Hence, there exists constant probabilities
 $p_{i,j,k}$
such that, for
 $n\geq 0$
 \begin{equation} \mathbb{P}(X_{n+2} = k | X_{n+1} = j , X_n = i ) = p_{i,j,k},\end{equation}
if (i, j) and (j, k) are in E, while
 $\mathbb{P}(X_{n+2} = k | X_{n+1} = j, X_n = i)=0$
, otherwise. We additionally assume that there are specific probabilities
 $p'_{\!\!i,j}$
for the first transition, that is,
 \begin{equation} \mathbb{P}(X_{1} = j | X_{0} = i ) = p'_{\!\!i,j} \qquad (i,j) \in E .\end{equation}
A second-order random walk is not a Markov chain because it does not fulfill the Markov condition, as we need to remember the previous step in order to take the next step. However, it can be turned into a Markov chain by changing the state space from the vertices of the graph to the directed edges. More precisely, let
 $\widehat{\mathcal{G}} = (\widehat V,\widehat E)$
be the (directed) line graph of
 $\mathcal{G} = (V,E)$
, where
 $\widehat V = E$
and
 $(e,f)\in \widehat E$
if and only if
 ${\tt T}(e) = {\tt S}(f)$
. Then, the second-order random walk can be seen as a (first-order) walk on
 $\widehat{\mathcal{G}}$
, that is, a sequence of directed edges
 $e_0,e_1,\ldots,e_k,\ldots$
where
 $v_0 = {\tt S}(e_0)$
and
 $v_i = {\tt S}(e_i) = {\tt T}(e_{i-1})$
, for
 $n \geq 1$
. However, we must keep in mind that a walk of length m in
 $\mathcal{G}$
corresponds to a walk of length
 $m-1$
in
 $\widehat{\mathcal{G}}$
.
For
 $n\geq 0$
consider the random variable
 $W_n \in E$
defined as
 \begin{equation} W_n = (i,j) \ \Longleftrightarrow \ X_{n+1} = j, \ X_n = i .\end{equation}
On the basis of (3.1) and (3.2), the sequence
 $\{W_n\}$
is a Markov chain with initial distribution
 $\mathbb{P}(W_0 = (i,j)) = \mathbb{P}(X_0 = i)p'_{\!\!i,j}$
and transition matrix
 $\widehat P$
given by
 $\widehat P_{(i,j)(j,k)} = p_{i,j,k}$
. Hence, if
 $(e,f)\in \widehat E$
then
 $\widehat P_{ef} \geq 0$
while
 $\widehat P_{ef} = 0$
if
 $(e,f)\notin \widehat E$
. Note that we allow the case
 $\widehat P_{ef} = 0$
for some pair
 $(e,f)\in \widehat E$
, which may occur in some special circumstances, notably the non-backtracking random walk on
 $\mathcal{G}$
, see Example 3.2 below.
We remark that, as for standard first-order random walks on graphs, the second-order stochastic process defined by (3.1) relies on the underlying graph structure. As such, the assumption on the first transition probabilities in (3.2) is a necessary requirement. Different choices of
 $p_{ij}'$
may impact the long-term behaviour of the process, as we will show in Section 5. In particular, we emphasise that, depending on the graph structure, this model may differ from a general second-order Markov chain as defined in, e.g., [Reference Benson, Gleich and Lim5, Reference Fasino and Tudisco15, Reference Wu and Chu42], whilst the two models always coincide when
 $\mathcal{G}$
is the complete graph. For example, Raftery’s Mixture Transition Distribution model [Reference Raftery36] and its variants, such as the LAMP [Reference Kumar, Raghu, Sarlós and Tomkins24] and RHOMP [Reference Wu and Gleich43] models, are not second-order random walks as per the above definition since they allow transitions that do not correspond to edges in
 $\mathcal{G}$
. While adhering to the graph structure may limit the generality of the model in (3.1), we observe below that several well-known stochastic processes from the graph literature are indeed of the form we consider here.
Example 3.1. The uniform random walk on
 $\widehat{\mathcal{G}}$
is the Markov chain governed by the transition matrix
 $\widehat P$
,
 \begin{equation*}\widehat P_{ef} = \begin{cases} 1/d^+_{{\tt S}(f)} & {\tt S}(f) = {\tt T}(e) \\[5pt] 0 & \hbox{otherwise.} \end{cases}\end{equation*}
As
 $\widehat P_{ef}$
do not depend on
 ${\tt S}(e)$
, the corresponding stochastic process on
 $\mathcal{G}$
is the uniform random walk where
 $P_{ij} = \mathbb{P}(X_{n+1} = j | X_n = i ) = 1/d^+_{i}$
. If
 $\mathcal{G}$
is undirected, then
 $\widehat P$
is bi-stochastic.
Example 3.2. The Hashimoto graph of
 $\mathcal{G} = (V,E)$
is the (directed) graph
 $\mathcal{H} = (V_{\mathcal{H}},E_{\mathcal{H}})$
where
 $V_{\mathcal{H}} = E$
and
 $(e,f)\in E_{\mathcal{H}}$
if and only if both
 ${\tt T}(e) = {\tt S}(f)$
and
 ${\tt T}(f) \neq {\tt S}(e)$
. A random walk on the Hashimoto graph is obviously related to a non-backtracking random walk on
 $\mathcal{G}$
. We can look at a random walk on
 $\mathcal{H}$
as a weighted random walk on the directed line graph
 $\widehat{\mathcal{G}} = (\widehat V,\widehat E)$
by applying a null weight on the edges
 $(e,f) \in \widehat E$
such that
 ${\tt T}(f) = {\tt S}(e)$
. The corresponding transition matrix
 $\widehat P$
is defined as follows. If
 $e = (i,j)$
and A is the adjacency matrix of
 $\mathcal{G}$
, then
 \begin{equation} \widehat P_{ef} = \begin{cases} 1/(d^+_j-A_{ji}) & {\tt S}(f) = j \hbox{ and } i \neq {\tt T}(f) \\[5pt] 0 & \hbox{otherwise.} \end{cases}\end{equation}
A directed edge
 $e = (i,j)\in E$
such that
 $\mathcal{O}_j = \{(j,i)\}$
is called dangling. The stochasticity condition
 $\sum_{f\in E} \widehat P_{ef} = 1$
implies that no edge in
 $\mathcal{G}$
is dangling, otherwise the out-degree of the corresponding node in
 $\mathcal{H}$
would be zero. Hence, the non-backtracking random walk on
 $\mathcal{G}$
is well defined if (and only if)
 $d^+_i \geq 1$
for
 $i\in V$
and there are no dangling edges. Finally, we recall from, e.g., [Reference Kempton22] that, if
 $\mathcal{G}$
is undirected then
 $\widehat P$
is bi-stochastic.
Example 3.3. Let
 $\widehat P^{(1)}$
and
 $\widehat P^{(0)}$
be the stochastic matrices defined in the Example 3.1 and Example 3.2, respectively. For any
 $\alpha\in(0,1)$
, the matrix
 $\widehat P^{(\alpha)} = \alpha \widehat P^{(1)} + (1-\alpha) \widehat P^{(0)}$
is stochastic (bi-stochastic, if
 $\mathcal{G}$
is undirected). The corresponding Markov chain describes random walks in
 $\mathcal{G}$
where backtracking steps are not completely eliminated, but rather the probability of performing one such step is downweighted by a factor depending on
 $\alpha$
. Thus, the corresponding second-order process can be called a backtrack-downweighted random walk. Combinatorial aspects of this kind of walks are addressed in, e.g., [Reference Arrigo, Higham and Noferini3].
Remark 3.4. The Markov chain
 $\{W_n\}$
defined by (3.3) may not be irreducible even if
 $\mathcal{G}$
is strongly connected. For example, if
 $\mathcal{G}$
is an undirected graph consisting of a cycle, then the Hashimoto graph of
 $\mathcal{G}$
is not connected, and the matrix
 $\widehat P$
built as in Example 3.2 is reducible. However, the matrix
 $\widehat P^{(\alpha)}$
defined in Example 3.3 is irreducible in the sole assumption that
 $\mathcal{G}$
is strongly connected.
4 Second-order mean hitting times
In this section, we introduce the concept of mean hitting time for the second-order random walk
 $\{X_n , n \in \mathbb{N}\}$
defined by (3.1) and (3.2) and we give results analogous to Theorems 2.1 and 2.2 for it. For each node
 $k\in V$
, let
 $\widetilde T_k$
be the random variable counting the first time the process arrives at node k,
 \begin{equation*} \widetilde T_k = \min\{n \geq 0 : X_n=k\} .\end{equation*}
The aim of this section is to compute the corresponding mean second-order hitting time
 $\widetilde{\tau}_{i\to k}=\mathbb{E}\left(\widetilde T_k \vert X_0=i\right)$
, i.e., how many steps are required by a second-order random walk on average to reach k, starting from i. To this goal, we first compute the mean second-order hitting times to a node k, given both the first and the second node,
 \begin{equation} \widetilde{\tau}_{i,j\to k} = \mathbb{E}(\widetilde T_k \vert X_1=j,X_0=i)\, ,\end{equation}
and then we use these values to compute
 $\widetilde{\tau}_{i\to k}$
by means of the formula
 \begin{align} \widetilde{\tau}_{i\to k} & = \mathbb{E}\left(\widetilde T_k \vert X_0=i\right) \nonumber \\[5pt] & = \sum_{j\in V} \mathbb{P}(X_1=j\vert X_0=i) \mathbb{E}(\widetilde T_k\vert X_1=j,X_0=i) = \sum_{j\in V} p'_{\!\!ij} \widetilde{\tau}_{i,j\to k} . \end{align}
The above formula shows that, unlike mean hitting times for Markov chains, second-order mean hitting times depend on the choice of the first transition probabilities, as defined in (3.2). In the sequel, we will see that there is a quite natural choice for these probabilities. On the other hand, the finiteness of the numbers
 $\widetilde{\tau}_{i,j\to k}$
, which is essential for the finiteness of second-order hitting times, is not influenced by the values of the probabilities
 $p'_{\!\!ij}$
. Indeed, in an infinite network it can happen that
 $\mathbb{P}({\widetilde T}_{k}{=}{+\infty}\vert X_1={j},X_0={i})>0$
for some
 $(i,j)\in E$
and
 $k\in V$
. For example, this happens when
 $\widehat P$
is the transition matrix of the uniform random walk on
 $\widehat{\mathcal{G}}$
and this chain is transient. In this case,
 $\widetilde\tau_{i,j\to k}=+\infty$
because
 $\widetilde\tau_{i,j\to k}$
is the expectation of a random variable that is equal to
 $+\infty$
with positive probability. For this reason, we first compute
 $\varphi_{i,j\to k}=\mathbb{P}({\widetilde T}_{k}{<}{+\infty}\vert X_1={j},X_0={i})$
, the probability that, starting with
 $X_0=i$
and
 $X_1=j$
, the random walker reaches k in finite time. For these quantities, the following result holds:
Theorem 4.1. For all
 $k\in V$
,
 $\{{\varphi}_{i,j\to k}:(i,j)\in E\}$
is the minimal non-negative solution of the following linear system:
 \begin{equation} \begin{cases} {\varphi}_{i,j\to k} = 1 & \hbox{if } i = k \text{ or } j = k \\[5pt] {\varphi}_{i,j\to k} = \sum_{\ell\in V}p_{i,j,\ell} {\varphi}_{j,\ell\to k} & \hbox{otherwise.} \end{cases}\end{equation}
Proof. We first show that
 $\{{\varphi}_{i,j\to k}:(i,j)\in E\}$
solves the linear system (4.3). Let us consider an edge
 $(i,j)\in E$
. If
 $i=k$
then
 $X_0=k$
, so
 $\widetilde T_k=0$
; if
 $j=k$
then
 $X_1=k$
and
 $\widetilde T_k=1$
. In both cases, it immediately follows that
 ${\varphi}_{i,j\to k}=\mathbb{P}({\widetilde T}_{k}{<}{+\infty}\vert X_1={j},X_0={i})=1$
. In the other cases, we have
 \begin{align*} {\varphi}_{i,j\to k} & = \mathbb{P}({\widetilde T}_{k}{<}{+\infty}\vert X_1={j},X_0={i}) \\[5pt] & = \sum_{\ell\in V} \mathbb{P}(X_2=\ell\vert X_1=j,X_0=i) \mathbb{P}(\widetilde T_k<+\infty\vert X_2=\ell,X_1=j,X_0=i) \\[5pt] & = \sum_{\ell\in V}p_{i,j,\ell}{\varphi}_{j,\ell\to k} ,\end{align*}
that is, (4.3). Now let
 $\{x_{i,j}:(i,j)\in E\}$
be another non-negative solution of (4.3) for a fixed k. We show that
 $x_{i,j}\geq{\varphi}_{i,j\to k}$
for all
 $(i,j)\in E$
. Indeed, if
 $i=k$
or
 $j=k$
then
 $x_{i,j}={\varphi}_{i,j\to k}$
and the claim follows. Otherwise, for
 $i,j\neq k$
we have
 $x_{i,j} =p_{i,j,k} + \sum_{\ell\neq k} p_{i,j,\ell} x_{j,l}$
. Let
 $\ell_0 = i$
and
 $\ell_1 = j$
. For any
 $\bar n \geq 2$
, we have
 \begin{align*} x_{\ell_0,\ell_1} & = p_{\ell_0,\ell_1, k} + \sum_{\ell_2\neq k} p_{\ell_0,\ell_1,\ell_2} x_{\ell_1,\ell_2} \\[8pt] & = p_{\ell_0,\ell_1, k} + \sum_{\ell_2\neq k} p_{\ell_0,\ell_1,\ell_2} \bigg[ p_{\ell_1,\ell_2, k} + \sum_{\ell_3\neq k} p_{\ell_1,\ell_2,\ell_3} x_{\ell_2, \ell_3} \Big] \\[8pt] & = \ldots \\[8pt] & = \sum_{n = 1}^{\bar n} \Bigg[ \sum_{\ell_2,\ldots,\ell_n \neq k} \prod_{t = 2}^{n} p_{\ell_{t-2},\ell_{t-1},\ell_n} \Bigg] p_{\ell_{n-1},\ell_{n}, k} + \sum_{\ell_2,\ldots,\ell_{\bar n + 1}\neq k} \prod_{t = 2}^{\bar n+1} p_{\ell_{t-2},\ell_{t-1},\ell_{t}} x_{\ell_{t-1}\ell_{t}} \\[8pt] & \geq \sum_{n = 1}^{\bar n} \Bigg[ \sum_{\ell_2\neq k}\cdots\sum_{\ell_n \neq k} \prod_{t = 2}^{n} p_{\ell_{t-2},\ell_{t-1},\ell_n} \Bigg] p_{\ell_{n-1},\ell_{n}, k} ,\end{align*}
where we used the inequality
 $x_{\ell_{t-1}\ell_{t}}\geq 0$
and the empty sum (i.e., the square bracket in the
 $n = 1$
case) must be considered equal to 1. Observe that for
 $n = 1,2,3,\ldots$
 \begin{equation*} \Bigg[ \sum_{\ell_2\neq k}\cdots\sum_{\ell_n \neq k} \prod_{t = 2}^{n} p_{\ell_{t-2},\ell_{t-1},\ell_n} \Bigg] p_{\ell_{n-1},\ell_{n}, k} = \mathbb{P}(\widetilde T_k = n+1 | X_1 = j, X_0 = i) .\end{equation*}
Hence, we have
 $x_{i,j} \geq \mathbb{P}(\widetilde T_k \leq \bar n+1 | X_1 = j, X_0 = i)$
. Finally,
 \begin{align*} x_{i,j} & \geq \lim_{\bar n\to+\infty} \mathbb{P}({\widetilde T}_{k}{\leq}{\bar n + 1}\vert X_1={j},X_0={i}) \\[7pt] & = \mathbb{P}({\widetilde T}_{k}{<}{+\infty}\vert X_1={j},X_0={i}) = {\varphi}_{i,j\to k}\end{align*}
and the claim follows.
On the basis of the preceding theorem, we can compute the probability that the second-order process
 $\{X_n\}$
hits a node
 $k\in V$
in a finite number of steps.
Corollary 4.2. For any fixed
 $k\in V$
define
 ${\varphi}_{i\to k} = \mathbb{P}(\widetilde T_k < +\infty | X_0 = i )$
. Then, the vector
 $({\varphi}_{i\to k})_{i\in V}$
is the vector
 $({\varphi}_{i,j\to k})_{(i,j)\in E}$
premultiplied by the matrix
 $M\in\mathbb{R}^{|V|\times |E|}$
given by
 \begin{equation} M_{ie} = \begin{cases} p'_{\!\!i,j} & e = (i,j) \in E \\[5pt] 0 & {else.} \end{cases}\end{equation}
Proof. By elementary considerations, we have
 \begin{align*} {\varphi}_{i\to k} & = \mathbb{P}(\widetilde T_k < +\infty | X_0 = i ) \\[5pt] & = \sum_{j\in V} \mathbb{P}(X_1=j\vert X_0=i) \mathbb{P}({\widetilde T}_{k}{<}{+\infty}\vert X_1={j},X_0={i}) = \sum_{j\in V} p'_{\!\!i,j} {\varphi}_{i,j\to k}.\end{align*}
In a similar way, we can compute the second-order mean hitting times, as shown in the next theorem:
Theorem 4.3. In the previous notation, if
 ${\varphi}_{i,j\to k}=1$
for each
 $(i,j)\in E$
, then
 $\{\widetilde\tau_{i,j\to k}:(i,j)\in E\}$
is the minimal non-negative solution of the following linear system:
 \begin{equation} \begin{cases} \widetilde\tau_{i,j\to k} = 0 & \hbox{if } i=k \\[5pt] \widetilde\tau_{i,j\to k} = 1 & \hbox{if } j = k \hbox{ and } i\neq k \\[5pt] \widetilde\tau_{i,j\to k} = 1 + \sum_{\ell\in V} p_{i,j,\ell}\widetilde\tau_{j,\ell\to k} & \hbox{if } i\neq k \hbox{ and } j\neq k. \end{cases} \end{equation}
Proof. We first show that
 $\{\widetilde\tau_{i,j\to k}:(i,j)\in E\}$
is a solution of the linear system (4.5). Let
 $(i,j)\in E$
. If
 $i=k$
then
 $\mathbb{P}({\widetilde T}_{k}{=}{0}\vert X_1={j},X_0={i})=1$
and
 $\widetilde\tau_{i,j\to k}=0$
. If
 $j=k$
then
 $\mathbb{P}({\widetilde T}_{k}{=}{1}\vert X_1={j},X_0={i})=1$
and
 $\widetilde\tau_{i,j\to k}=1$
. Otherwise, if both
 $i\neq k$
and
 $j\neq k$
then, by using the definition of expectation we obtain
 \begin{equation*} \begin{split} \widetilde\tau_{i,j\to k}&=\mathbb{E}(\widetilde T_k\vert X_1=j,X_0=i)\\[5pt] &=2\mathbb{P}({\widetilde T}_{k}{=}{2}\vert X_1={j},X_0={i})+\sum_{n\geq 3}n\mathbb{P}(\widetilde T_{k}=n\vert X_1=j,X_0=i). \end{split} \end{equation*}
Now we observe that
 $\mathbb{P}(\widetilde T_{k}=2\vert X_1=j,X_0=i)=\mathbb{P}(X_{2}=k\vert X_1=j,X_0=i)=p_{i,j,k}$
. Then
 $\widetilde\tau_{i,j\to k}$
is given by
 \begin{align*} \widetilde\tau_{i,j\to k} = & \, 2p_{i,j,k}+\sum_{n\geq 3}n\sum_{\ell\neq k} \mathbb{P}(X_{2}=\ell\vert X_1=j,X_0=i) \mathbb{P}(\widetilde T_k=n\vert X_2=\ell,X_1=j) \\[5pt] = & \, 2p_{i,j,k}+\sum_{\ell\neq k}p_{i,j,\ell} \sum_{n\geq 3}n \, \mathbb{P}(\widetilde T_k=n\vert X_2=\ell,X_1=j) \\[5pt] = & \, 2p_{i,j,k}+\sum_{\ell\neq k}p_{i,j,\ell} \sum_{m\geq 2}(m+1) \mathbb{P}(\widetilde T_{k}=m\vert X_1=\ell,X_0=j).\end{align*}
Finally, since
 $\kern-0.2pt\sum_{m\geq 2}m\mathbb{P}(\widetilde T_{k}=m\vert X_1=\ell,X_0=j)=\widetilde\tau_{j,\ell\to k}$
and
 $\kern-0.2pt\sum_{m\geq 2}\mathbb{P}(\widetilde T_{k}=m\vert X_1=\ell,X_0=j)={\kern-0.2pt}1$
for
 $\ell\neq k$
, we have
 \begin{align*} \widetilde\tau_{i,j\to k} & = 2p_{i,j,k}+\sum_{\ell\neq k}p_{i,j,\ell}(\widetilde\tau_{j,\ell\to k}+1) \\[5pt] & = 2p_{i,j,k}+\sum_{\ell\neq k}p_{i,j,\ell}\widetilde\tau_{j,\ell\to k}+\sum_{\ell\neq k}p_{i,j,\ell} \\[5pt] & = 1+p_{i,j,k}+\sum_{\ell\neq k}p_{i,j,\ell}\widetilde\tau_{j,\ell\to k} = 1+\sum_{\ell\in V}p_{i,j,\ell}\widetilde\tau_{j,\ell\to k},\end{align*}
where in the last passages we have used the fact that
 $\sum_{\ell\in V}p_{i,j,\ell} = 1$
.
Now let
 $\{y_{i,j}:(i,j)\in E\}$
be another non-negative solution of (4.5). We show that
 $y_{i,j}\geq\widetilde\tau_{i,j\to k}$
for all
 $(i,j)\in E$
. If
 $i=k$
or
 $j=k$
, then
 $y_{i,j}=\widetilde\tau_{i,j\to k}$
and the claim follows.
For
 $i,j\neq k$
, we have
 $y_{i,j} = 1 + p_{i,j,k} + \sum_{\ell\neq k} p_{i,j,\ell} y_{j,l}$
. Now, let
 $\ell_0 = i$
and
 $\ell_1 = j$
. For any
 $\bar n \geq 2$
, we have
 \begin{align*} y_{\ell_0,\ell_1} & = 1 + p_{\ell_0,\ell_1, k} + \sum_{\ell_2\neq k} p_{\ell_0,\ell_1,\ell_2} y_{\ell_1,\ell_2} \\[5pt] & = 1 + p_{\ell_0,\ell_1, k} + \sum_{\ell_2\neq k} p_{\ell_0,\ell_1,\ell_2} \bigg[ 1 + p_{\ell_1,\ell_2, k} + \sum_{\ell_3\neq k} p_{\ell_1,\ell_2,\ell_3} y_{\ell_2, \ell_3} \Big] \\[5pt] & = \ldots \\[5pt] & = \sum_{n = 1}^{\bar n} \Bigg[ \sum_{\ell_2,\ldots,\ell_n \neq k} \prod_{t = 2}^{n} p_{\ell_{t-2},\ell_{t-1},\ell_n} \Bigg] \big( 1 + p_{\ell_{n-1},\ell_{n}, k} \big) + \sum_{\ell_2,\ldots,\ell_{\bar n + 1}\neq k} \prod_{t = 2}^{\bar n+1} p_{\ell_{t-2},\ell_{t-1},\ell_{t}} y_{\ell_{t-1},\ell_{t}} \\[5pt] & \geq \sum_{n = 1}^{\bar n} \Bigg[ \sum_{\ell_2,\ldots,\ell_n \neq k} \prod_{t = 2}^{n} p_{\ell_{t-2},\ell_{t-1},\ell_n} \Bigg] \big( 1 + p_{\ell_{n-1},\ell_{n}, k} \big) ,\end{align*}
where the empty sum (i.e., the square bracket when
 $n = 1$
) must be considered equal to 1 and the last inequality holds since
 $y_{\ell_{t-1},\ell_{t}}\geq 0$
. Rearranging terms,
 \begin{align*} y_{\ell_0,\ell_1} & \geq 1 + \sum_{\ell_2} p_{\ell_0,\ell_1,\ell_2} + \sum_{n=3}^{\bar n} \sum_{\ell_2\neq k}\cdots \sum_{\ell_{n-1} \neq k} \sum_{\ell_n} \prod_{t = 2}^{n} p_{\ell_{t-2},\ell_{t-1},\ell_n} \\[5pt] & = \sum_{n = 1}^{\bar n} \mathbb{P}(\widetilde T_k \geq n | X_1 = j, X_0 = i) \\[5pt] & \geq \sum_{n = 1}^{\bar n} n \, \mathbb{P}(\widetilde T_k = n | X_1 = j, X_0 = i).\end{align*}
Finally, passing to the limit
 $\bar n\to\infty$
, we obtain
 \begin{align*} y_{i,j} & \geq \sum_{n = 1}^{\infty} n \, \mathbb{P}(\widetilde T_k = n | X_1 = j, X_0 = i) = \mathbb{E}(\widetilde T_k | X_1 = j, X_0 = i) = \hat \tau_{i,j\to k} ,\end{align*}
and the proof is complete.
As in the first-order case, if
 $\mathcal{G}$
is finite and strongly connected then a result analogous to Theorem 2.3 holds true and the solution of the linear systems (4.3) and (4.5) is unique. If the state space is countable or
 $\mathcal{G}$
is not strongly connected, then uniqueness can be lost. This motivates the minimality condition in Theorems 4.1 and 4.3.
Analogously to the argument of Corollary 4.2, we obtain the following characterisation for the second-order hitting times directly from equation (4.2).
Corollary 4.4. For any fixed
 $k\in V$
, the vector
 $(\widetilde\tau_{i\to k})_{i\in V}$
coincides with the vector
 $(\widetilde\tau_{i,j\to k})_{(i,j)\in E}$
pre-multiplied by the matrix M in (4.4).
4.1 Mean hitting times via directed line graph
The linear system in Theorem 4.3 allows us to compute second-order mean hitting times by means of the transition probabilities of the stochastic process
 $\{X_n,n\in\mathbb{N}\}$
. In this section, we show that, for finite graphs, one can also characterise the second-order mean hitting times using another system of linear equations. This system is obtained using the fact that to any second-order random walk
 $\{X_n\}$
on
 $\mathcal{G}$
corresponds a suitable random walk
 $\{W_n\}$
on the directed line graph
 $\widehat{\mathcal{G}}$
, as in (3.3). The two walks have the same transition probability, but the second is shorter than the first by one step. By correcting this discrepancy, we can obtain mean hitting times for
 $\{X_n\}$
from those for
 $\{W_n\}$
.
To this end, for any fixed subset
 $S\subset E$
, consider the random variables
 \begin{equation*} \widehat T_S = \min\{n \geq 0 : W_n \in S\} , \qquad \widehat T^+_S = \min\{n \geq 1 : W_n \in S\} ,\end{equation*}
and the corresponding expectations
 \begin{equation} \widehat{\tau}_{e\to S} = \mathbb{E}(T_S | W_0 = e) , \qquad \widehat{\tau}^+_{e\to S} = \mathbb{E}(T^+_S | W_0 = e) .\end{equation}
These quantities can be computed by means of the techniques recalled in Section 2.1, since
 $\{W_n\}$
is a classical Markov chain. The theorem below shows how mean hitting (4.6) for
 $\{W_n\}$
relate to the solution of the linear system in (4.5). It follows that the problem of computing second-order mean hitting times in
 $\mathcal{G}$
can be expressed as the problem of computing traditional mean hitting times in
 $\widehat{\mathcal{G}}$
.
Let us consider a node
 $k\in V$
. By Theorem 2.2,
 $\{\hat\tau_{e\to\mathcal{I}_k}: e\in E\}$
is the minimal non-negative solution of the following linear system:
 \begin{equation} \begin{cases} \hat\tau_{e\to\mathcal{I}_k}=0 & \hbox{if } e\in\mathcal{I}_k \\[5pt] \hat\tau_{e\to\mathcal{I}_k}=1+\sum_{f\in E}\widehat{P}_{ef}\hat\tau_{f\to\mathcal{I}_k} & \hbox{if $e\notin\mathcal{I}_k$.} \end{cases}\end{equation}
Theorem 4.5. In the previous notation, it holds
 \begin{equation*} \widetilde\tau_{i,j\to k} = \begin{cases} 0 & \hbox{if } i=k\\[5pt] \hat\tau_{(i,j)\to\mathcal{I}_k} + 1 & \hbox{if } i\neq k . \end{cases}\end{equation*}
Proof. We show that each non-negative solution of (4.7) corresponds to a non-negative solution of (4.5) and vice versa. Let
 $\{z_{i,j}:(i,j)\in E\}$
be a non-negative solution of (4.7). For all
 $(i,j)\in E$
, we define
 $y_{i,j}$
as
 \begin{equation*} y_{i,j}= \begin{cases} 0 & \hbox{if } i = k \\[5pt] z_{i,j}+1 & \hbox{if } i\neq k . \end{cases}\end{equation*}
Then
 $\{y_{i,j}:(i,j)\in E\}$
is a non-negative solution of (4.5). In fact, if
 $j=k$
but
 $i\neq k$
then
 $y_{i,j}=1$
. On the other hand, when
 $i\neq k$
and
 $j\neq k$
we have
 \begin{align*} y_{i,j} = 1+z_{i,j} & = 1 + \Bigl(1+\sum_{\ell\in V} \widehat{P}_{(i,j)(j,\ell)}z_{j,\ell}\Bigr) \\[5pt] & = 1 + \sum_{\ell\in V} \widehat{P}_{(i,j)(j,\ell)} (1+z_{\ell,m}) = 1 + \sum_{\ell\in V} p_{i,j,\ell} \, y_{j,\ell} .\end{align*}
In the previous passages, we used the fact that
 $\widehat P$
is stochastic and
 $\widehat P_{(i,j)(\ell,m)} = 0$
if
 $\ell \neq j$
. Conversely, if
 $\{y_{i,j}:(i,j)\in E\}$
is a non-negative solution of (4.5), then
 $y_{i,j}\geq 1$
if
 $i\neq k$
. Thus, if we put, for all
 $(i,j)\in E$
,
 \begin{equation*} z_{i,j} = \begin{cases} 0 & \hbox{if } i = k \\[5pt] y_{i,j}-1 & \hbox{if } i\neq k , \end{cases}\end{equation*}
then
 $\{z_{i,j}:(i,j)\in E\}$
is a non-negative solution of (4.7). The thesis follows by considering the minimal non-negative solution of both systems.
4.2 Second-order mean return times
In this section, we formulate the concept of return time for second-order random walks and we give an explicit formula for their computation in arbitrary networks, whenever the numbers
 $\widetilde\tau_{i,j\to k}$
can be computed from (4.5). For a set
 $S\subset V$
, consider the random variable
 \begin{equation*} \widetilde T^+_S = \min\{n \geq 1 : X_n \in S\} .\end{equation*}
We are interested in computing the second-order mean return time to S, namely,
 $\widetilde\tau_S=\mathbb{E}(\widetilde T^+_S \vert$
X 0 ∈ S). This quantity represents the average number of steps that are required to reach again S, starting from a node in S and moving through the vertices of
 $\mathcal{G}$
according to a second-order random walk. For simplicity, in this section, we limit ourselves to the single-node case
 $S = \{i\}$
. We will go back to the general case in Section 5.1. Firstly, we observe that
 \begin{equation*} \widetilde\tau_i= \mathbb{E}(\widetilde T^+_i\vert X_0=i) = \sum_{j\in V} \mathbb{P}(X_1=j\vert X_0=i) \mathbb{E}(\widetilde T^+_i\vert X_1=j,X_0=i) .\end{equation*}
Introducing the auxiliary notation
 $\widetilde\tau_{i,j}= \mathbb{E}(\widetilde T^+_i\vert X_1=j,X_0=i)$
, we obtain
 \begin{equation} \widetilde\tau_i = \sum_j p'_{\!\!i,j} \widetilde\tau_{i,j} .\end{equation}
The intuition behind this formula is that the random walker chooses at first an out-neighbour j of i at random and then follows a second-order random walk that ends with node i. In fact,
 $\widetilde\tau_{i,j}$
can be easily computed by using the vector
 $\{\widetilde\tau_{i,j\to k}:(i,j)\in E\}$
obtained from (4.5). Indeed, it holds
 \begin{align*} \widetilde\tau_{i,j} & = \sum_{k\in V} \mathbb{P}(X_2=k \vert X_1=j,X_0=i) \mathbb{E}(\widetilde T^+_i\vert X_2 = k,X_1=j,X_0=i) \\[5pt] & = \sum_{k\in V}p_{i,j,k} \bigl( 1 + \mathbb{E}(\widetilde T_i\vert X_1 = k,X_0 = j) \bigr) \\[5pt] & = 1 + \sum_{k\in V}p_{i,j,k}\widetilde\tau_{j,k\to i}.\end{align*}
Placing the formula above into (4.8) yields
 \begin{equation*} \widetilde\tau_i = 1 + \sum_{j,k\in V} p'_{\!\!i,j} p_{i,j,k}\widetilde\tau_{j,k\to i}.\end{equation*}
This identity represents the second-order counterpart of equation (2.5) in the case where
 $S = \{i\}$
. Here, the first transition probabilities
 $p'_{\!\!i,j}$
are needed to specify the initial distribution of the second-order process. In the sequel, we propose to adopt a specific choice for the numbers
 $p'_{\!\!i,j}$
that allows us to obtain a result for any
 $S\subset V$
analogous to Lemma 2.4.
5 The pullback of a second-order random walk
From now on, we suppose that the Markov chain associated to
 $\widehat P$
is ergodic, so that there exists a (unique) vector
 $\widehat \pi > 0$
with
 $\widehat\pi^T \widehat P = \widehat\pi^T$
. In this case, we can consider the additional assumption that the random walk
 $\{W_n\}$
on
 $\widehat{\mathcal{G}}$
is at equilibrium, i.e.,
 $\mathbb{P}(W_n = e) = \widehat\pi_e$
, for
 $n \geq 0$
. Indeed, if the Markov chain
 $\{W_n\}$
is at the stationary state, then, owing to the correspondence between the events
 $X_{n+1} = i$
and
 $W_n \in \mathcal{I}_i$
for
 $n \geq 0$
, the analysis of the process
 $\{X_n\}$
is simplified and reveals new properties.
For every
 $e\in E$
, define
 \begin{equation} \lambda_e = \frac{\widehat\pi_e}{\sum_{f:{\tt T}(f) = {\tt T}(e)}\widehat \pi_f} .\end{equation}
The numbers
 $\lambda_e$
appearing in (5.1) have a simple probabilistic interpretation, namely
 $\lambda_e = \mathbb{P}(W_n=e | W_n\in \mathcal{I}_{{\tt T}(e)})$
is the conditional probability that the random walker in
 $\widehat{\mathcal{G}}$
is in e, given that they are also in
 $\mathcal{I}_{{\tt T}(e)}$
. Moreover, let
 $L\in\mathbb{R}^{|V|\times |E|}$
be the “lifting” matrix defined as follows:
 \begin{equation} L_{ie} = \begin{cases} \lambda_e & {\tt T}(e) = i \\[5pt] 0 & \hbox{else,} \end{cases}\end{equation}
Note that the scalars
 $\lambda_e$
fulfill the condition
 \begin{equation*} \sum_{e\in\mathcal{I}_i} \lambda_e = 1 , \qquad i = 1,\ldots, n .\end{equation*}
This condition implies that L is stochastic,
 $L\mathbb{1} = \mathbb{1}$
. If p is a probability vector on the nodes of
 $\mathcal{G}$
, then
 $\widehat p^T = p^TL$
is a probability vector defined on the edges, and fulfills the identity
 $p_i = \sum_{e\in\mathcal{I}_i} \widehat p_e$
. Furthermore, let
 $R\in\mathbb{R}^{|E|\times |V|}$
be the ‘restriction’ matrix
 \begin{equation} R_{ei} = \begin{cases} 1 & \hbox{if } {\tt T}(e) = i \\[5pt] 0 & \hbox{else.} \end{cases}\end{equation}
Given any probability distribution
 $\widehat p$
on the edges of
 $\mathcal{G}$
, the product
 $p^T = \widehat p^T R$
defines a probability distribution on the nodes such that
 $p_i = \sum_{e\in\mathcal{I}_i} \widehat p_e$
. We note in passing that the product LR is the identity in
 $\mathbb{R}^n$
.
Theorem 5.1 relates the stationary distributions of
 $\widehat P$
and
 $P = L\widehat P R$
for suitable choices of the initial transition probabilities (3.2), generalising to second-order processes a known property of the non-backtracking random walk on undirected graphs, see e.g. [Reference Kempton22, Thm. 2] (see also Example 5.3 below).
Theorem 5.1. Let
 $P = L\widehat P R\in\mathbb{R}^{n\times n}$
,
 \begin{equation} P_{ij} = \sum_{e\in \mathcal{I}_i}\sum_{f\in \mathcal{I}_j} \lambda_e \widehat P_{ef} .\end{equation}
Then, P is an irreducible stochastic matrix. Assuming that the Markov chain
 $\{W_n\}$
is at equilibrium with stationary density
 $\widehat\pi$
, then also
 $\{X_n\}$
is at equilibrium with stationary density
 $\pi^T = \widehat \pi^T R$
and, for
 $n \geq 1$
,
 \begin{equation*} P_{ij} = \mathbb{P}(X_{n+1} = j | X_n = i ) .\end{equation*}
Moreover, the initial transition probabilities (3.2) are
 \begin{equation} p'_{\!\!i,j} = \frac{\widehat\pi_{(i,j)}}{\sum_{f\in\mathcal{O}_i}\widehat \pi_f} , \qquad (i,j)\in E,\end{equation}
and the vector
 $\pi^T = \widehat \pi^T R$
is the (unique) invariant vector of the Markov chain associated to P.
Proof. First, note that the matrix P is non-negative and stochastic. To prove that P is irreducible, let
 $i,j\in V$
be arbitrary. Owing to the irreducibility of
 $\widehat P$
, for any
 $e\in\mathcal{I}_i$
and
 $f\in\mathcal{I}_j$
there is a path in
 $\widehat{\mathcal{G}}$
from e to f. Let
 $e = e_0, e_1, \ldots, e_m = f$
be such path. Then, the sequence
 ${\tt T}(e_0), {\tt T}(e_1),\ldots,{\tt T}(e_m)$
is a path in
 $\mathcal{G}$
from i to j.
Thus, owing to the correspondence between
 $X_{n+1} = i$
and
 $W_n \in \mathcal{I}_i$
, we have
 \begin{align*} \mathbb{P}( X_{n+1} = j | X_n = i ) & = \mathbb{P}( W_{n} \in\mathcal{I}_j | W_{n-1} \in\mathcal{I}_i ) \\[5pt] & = \sum_{e\in\mathcal{I}_i}\sum_{f\in\mathcal{I}_j} \mathbb{P} ( W_{n} = f | W_{n-1} = e) \mathbb{P}(W_{n-1} = e | W_{n-1} \in\mathcal{I}_i) \\[5pt] & = \sum_{e\in\mathcal{I}_i}\sum_{f\in\mathcal{I}_j} \widehat P_{ef} \lambda_e = P_{ij}\end{align*}
for any
 $n \geq 1$
. Moreover, consider the vector
 $\pi^T = \widehat\pi^T R$
. In detail,
 \begin{equation} \pi_i = \sum_{e\in\mathcal{I}_i}\widehat\pi_e > 0 , \qquad i = 1,\ldots, n.\end{equation}
To prove that
 $\pi$
is an invariant vector of P, first observe that
 $\widehat\pi^T RL = \widehat\pi$
. Indeed, owing to (5.1), for any fixed
 $e\in E$
, we obtain
 \begin{equation*} (\widehat\pi^T RL)_e = \lambda_e \sum_{f:{\tt T}(f)={\tt T}(e)}\widehat\pi_f = \widehat\pi_e .\end{equation*}
Moreover,
 $\pi^T\mathbb{1} = \widehat\pi^T R\mathbb{1} = \widehat\pi^T\mathbb{1} = 1$
, eventually yielding
 \begin{equation*} \pi^T P = \widehat \pi^T R L\widehat P R = \widehat\pi^T \widehat P R = \widehat \pi^T R = \pi^T .\end{equation*}
To complete the proof, it is sufficient to observe that, if
 $\{W_n\}$
is at equilibrium then also
 $\{X_n\}$
is at equilibrium and
 \begin{align*} \widehat\pi_{(i,j)} = \mathbb{P}(W_0 = (i,j)) & = \mathbb{P}(X_1 = j, X_0 = i) \\[5pt] & = \mathbb{P}(X_1 = j | X_0 = i) \mathbb{P}(X_0 = i) = p'_{\!\!i,j} \sum_{f\in\mathcal{I}_i} \widehat\pi_f .\end{align*}
Thus,
 $p'_{\!\!i,j} = \widehat\pi_{(i,j)}/\sum_{f\in\mathcal{I}_i} \widehat\pi_f$
. Finally, as
 $\sum_{f\in\mathcal{I}_i} \widehat\pi_f = \sum_{f\in\mathcal{O}_i} \widehat\pi_f$
, we obtain (5.5), which concludes the proof.
We call the matrix P in (5.4) the pullback of
 $\widehat{P}$
on
 $\mathcal{G}$
. Note that these two matrices correspond to two different stochastic processes, as briefly pointed out in Remark 5.2 below. Moreover, as we may expect, we remark that the pullback operation is not injective, as different stochastic processes on
 $\widehat{\mathcal{G}}$
may have the same pullback in
 $\mathcal{G}$
. This is shown by the Example 5.3 below, where the classic and non-backtracking processes are shown to have the same pullback.
Remark 5.2. As shown in Theorem 5.1, the entries of the pullback matrix P correspond to first-order transition probabilities of the stochastic process
 $\{X_n\}$
. However, this does not mean that
 $\{X_n\}$
is a Markov chain, which would be true if (and only if) the sequence
 $\{X_n\}$
were to satisfy the Markov condition
 $\mathbb{P}(X_{n+1} = k | X_n = j)= \mathbb{P}(X_{n+1} = k | X_n = j, X_{n-1} = i)$
, for every
 $(i,j),(j,k)\in E$
, at least under the considered assumptions. On the other hand, Equation (5.4) yields
 \begin{equation*} P_{ij} = \sum_{(h,i)\in E} \lambda_{(h,i)} p_{h,i,j} ,\end{equation*}
that is,
 $P_{ij}$
is a convex combinations of the numbers
 $p_{h,i,j}$
. Consequently, the Markov condition holds true if and only if the second-order transition probabilities (3.1) are independent of the oldest state, in which case
 $\{X_n\}$
is trivially a Markov chain.
Actually, the construction of P from
 $\widehat P$
is reminiscent of a so-called lumping of
 $\{W_n\}$
, see e.g., [Reference Rubino and Sericola38] and [Reference Kemeny and Snell21, Sec. 6.3-4]. Lumping methods are known to allow the construction of Markov chains with a reduced number of states from certain finite Markov chains with a larger states set. The corresponding transition matrices are related by an identity similar to the one defining P from
 $\widehat P$
in Theorem 5.1. However, the process
 $\{X_n\}$
is not a lumping of
 $\{W_n\}$
since it is not a Markov chain, even when at equilibrium. This is the reason why second-order mean hitting times differ ostensibly from mean hitting times corresponding to P, as shown in various numerical experiments in Section 6.
Example 5.3. Let
 $\mathcal{G}$
be undirected and (strongly) connected, with adjacency matrix A, and let
 $\widehat{\mathcal{G}}$
be its line graph. Consider the random walk on
 $\widehat{\mathcal{G}}$
defined as in Example 3.1, with transition matrix
 $\widehat P$
. It is not hard to verify that the pullback of
 $\widehat P$
on
 $\mathcal{G}$
coincides with the transition matrix of the standard random walk on
 $\mathcal{G}$
. The same conclusion is true also for the matrix
 $\widehat P$
considered in Example 3.2. Indeed, if
 $A_{ij} = 0$
then
 \begin{equation*} (L\widehat PR)_{ij} = \sum_{e\in\mathcal{I}_i} \sum_{f\in\mathcal{I}_j} \lambda_e \widehat P_{ef} = 0,\end{equation*}
because the condition
 ${\tt S}(f) = {\tt T}(e)$
is always false. On the other hand, if
 $A_{ij} = 1$
then
 \begin{align*} (L\widehat PR)_{ij} & = \frac{1}{\sum_{e\in\mathcal{I}_i}} \sum_{f\in\mathcal{I}_j} \lambda_e \widehat P_{ef} \\[5pt] & = \sum_{e\in\mathcal{I}_i} \sum_{f\in\mathcal{I}_j} \frac{\lambda_e}{d^+_{{\tt S}(f)} - 1} \\[5pt] & = (|\mathcal{I}_i| -1) \frac{1/d^-_i}{d^+_i - 1} = \frac{1}{d_i} ,\end{align*}
since
 $|\mathcal{I}_i| = d^-_i = d^+_i = d_i$
. By linearity, also the pullback of the backtrack-downweighted random walk in Example 3.3 coincides with the standard random walk on
 $\mathcal{G}$
. Consequently, also the invariant vectors of these two processes coincide. This result generalises the one for the non-backtracking walk shown in Theorem 2 of [Reference Kempton22].
5.1 Hitting and return times at equilibrium
Due to Theorem 5.1, it is convenient to assume that the initial probabilities of the second-order stochastic process under consideration (3.2) are equal to
 $\lambda_{(i,j)}$
. Hence, from here onward, we consider the ‘equilibrium assumption’
 $\mathbb{P}(X_0 = i) = \pi_i$
together with (5.5). With this assumption, the presentation of the mean hitting and return times introduced in the previous section can be carried out with greater clarity and simplicity. To begin with, we derive an algebraic expression for the second-order hitting times matrix
 $\widetilde T = (\widetilde\tau_{i\to j})$
of a very different nature from that at the basis of equation (4.2).
Theorem 5.4. Let
 $\widetilde T = (\widetilde\tau_{i\to j})_{i,j\in V}$
and
 $\widehat T = (\widehat{\tau}_{e\to f})_{e,f\in E}$
. There exists a vector
 $a = (\alpha_e)_{e\in E}$
and a vector
 $b = (\beta_i)_{i\in V}$
such that
 \begin{equation*} \widetilde T = L \widehat T \, {Diag}(a) R - \mathbb{1} b^T ,\end{equation*}
Proof. Introduce the matrix
 $C\in\mathbb{R}^{|E|\times|V|}$
such that
 $C_{ei} = \widehat{\tau}_{e\to \mathcal{I}_i}$
is defined as in Section 4.1. From the identity
 \begin{align*} \widetilde\tau_{i\to j} = \mathbb{E}(\widetilde T_j | X_0 = i) & = \mathbb{E}(\widehat T_{\mathcal{I}_j} | W_0 \in\mathcal{I}_i) \\[5pt] & = \sum_{e\in\mathcal{I}_i} \mathbb{P}(W_0 = e \vert W_0\in\mathcal{I}_i) \, \mathbb{E}(\widehat T_{\mathcal{I}_j} | W_0 = e) = \sum_{e\in\mathcal{I}_i} \lambda_e \widehat{\tau}_{e\to\mathcal{I}_j}\end{align*}
it follows that
 $\widetilde T = LC$
. Using the technical Lemma 2.6, for every
 $e\in E$
and
 $i\in V$
there exist coefficients
 $\alpha_e$
and
 $\beta_{i}$
such that
 $\widehat{\tau}_{e\to \mathcal{I}_i} = \sum_{f\in\mathcal{I}_i} \alpha_f \widehat{\tau}_{e\to f} - \beta_i$
. The latter identity can be expressed in matrix terms as
 \begin{equation*} C = \widehat T \, \textrm{Diag}(a) R - \mathbb{1} b^T .\end{equation*}
Finally, as
 $L\mathbb{1} = \mathbb{1}$
, we conclude.
The previous theorem yields a formula for the matrix
 $\widetilde T$
that is amenable to numerical computations, once the matrix
 $\widehat T$
has been computed by standard methods via, e.g., (2.7). The next result proves that second-order mean return times defined in Section 4.2 coincide with the usual return times of the random walk associated with the pullback of
 $\widehat P$
on
 $\mathcal{G}$
.
Theorem 5.5. Let
 $\pi$
be the stationary density of the pullback of
 $\widehat P$
on
 $\mathcal{G}$
. For every
 $S\subset V$
it holds
 $\widetilde\tau_S = 1/\sum_{i\in S}\pi_i$
. In particular,
 $\widetilde\tau_i = 1/\pi_i$
for
 $i\in V$
.
Proof. Let
 $\widehat S = \cup_{i\in S} \mathcal{I}_i$
. Then,
 $\widetilde\tau_S$
can be reformulated as the mean return time in
 $\widehat S$
of the chain
 $\{W_n\}$
. From Lemma 2.4 and (5.6), we get
 \begin{equation*} \widetilde\tau_{S} = \mathbb{E}\left(\widehat T^+_{\widehat S} | W_0 \in \widehat S\right) = \frac{1}{\sum_{i\in S}\sum_{e\in \mathcal{I}_i} \widehat\pi_e} = \frac{1}{\sum_{i\in S}\pi_i} ,\end{equation*}
and we have the claim.
Example 5.6. Let
 $\mathcal{G} = (V,E)$
be finite and undirected. For
 $\alpha\in [0,1]$
, the stationary density
 $\widehat\pi$
of the matrix
 $\widehat P^{(\alpha)}$
in Example 3.3 is a constant vector,
 $\widehat\pi_e = 1/|E|$
, as the transition matrix is bi-stochastic. Consequently, the second-order mean return times coincides with the mean return times of the uniform random walk on
 $\mathcal{G}$
, namely,
 $\widetilde\tau_i = (\sum_j d_j)/d_i$
, independently of
 $\alpha$
and the topology of
 $\mathcal{G}$
. Moreover, in this example Equation (5.5) becomes
 $\lambda_{(i,j)} = 1/d_i$
being
 $\mathcal{G}$
undirected, i.e., the first step in the second-order process coincides with one step of a standard uniform random walk on
 $\mathcal{G}$
.
Theorem 5.5 yields a second-order analogous to Kac’s Lemma, see Lemma 2.4. For a family of networks that exhibit some specific symmetries, Lemma 2.5 can also be extended to second-order random walks, as shown in the sequel.
The coefficients
 $\alpha_e$
appearing in the proof of Theorem 5.4 come from Lemma 2.6 and, according to (2.8), can be expressed as
 $\alpha_e = \widehat{\pi}_e\widehat{\tau}^+_{e\to\mathcal{I}_i}$
where
 $i = {\tt T}(e)$
and
 $\widehat{\tau}^+_{e\to\mathcal{I}_i}$
represents the mean return time to
 $\mathcal{I}_i$
of
 $\{W_n\}$
, after leaving it from
 $e\in\mathcal{I}_i$
, as defined in (4.6). Suppose that these return times depend on i but not on
 $e\in\mathcal{I}_i$
. This assumption is clearly verified if for every
 $e,f\in\mathcal{I}_i$
there is an automorphism of
 $\widehat{\mathcal{G}}$
that exchanges e and f, i.e., the nodes e and f in
 $\widehat{\mathcal{G}}$
can be exchanged without altering the topology of
 $\widehat{\mathcal{G}}$
. The latter condition is satisfied if, for example,
 $\{W_n\}$
is a uniform random walk on a bipartite regular graph, that is, an undirected, bipartite graph whose adjacency matrix has the form
 \begin{equation*} \begin{pmatrix} O & \mathbb{1}\mathbb{1}^T \\[5pt] \mathbb{1} \mathbb{1}^T & O \end{pmatrix} ,\end{equation*}
in which the diagonal blocks can have different sizes.
For notational simplicity, denote by
 $\rho_i = \widehat{\tau}^+_{e\to\mathcal{I}_i}$
that common value. Then, from Theorem 5.1 we have
 \begin{equation*} 1 = \sum_{e\in\mathcal{I}_i} \alpha_e = \sum_{e\in\mathcal{I}_i} \widehat\pi_e\widehat{\tau}^+_{e\to\mathcal{I}_i} = \rho_i \sum_{e\in\mathcal{I}_i} \widehat\pi_e = \rho_i \pi_i .\end{equation*}
Thus
 $\rho_i = 1/\pi_i$
. Moreover, for
 $e\in\mathcal{I}_i$
we obtain
 \begin{equation*} \alpha_e = \widehat\pi_e \rho_i = \widehat\pi_e / \pi_i .\end{equation*}
Hence, in the notation of Theorem 5.4, we have that
 $\textrm{Diag}(a) R \pi = \widehat\pi$
, and thus
 \begin{equation*} \widetilde T\pi = L\widehat T \, \textrm{Diag}(a) R \pi - \mathbb{1} b^T\pi = L\widehat T \widehat\pi - \mathbb{1} b^T\pi ,\end{equation*}
where
 $b = (\beta_i)_{i\in V}$
is the coefficient vector defined in Theorem 5.4. By Lemma 2.5, we have
 $\widehat T \widehat\pi = \kappa \mathbb{1}$
where
 $\kappa$
is the Kemeny’s constant of
 $\widehat T$
, and we eventually obtain:
 \begin{equation*} \widetilde T\pi = \kappa L \mathbb{1} - \mathbb{1} b^T\pi = \mathbb{1} \left(\kappa - b^T\pi\right) .\end{equation*}
Combining all the observations above, we obtain the following second-order equivalent of the Random Target Lemma:
Corollary 5.7. Let
 $\pi$
be the stationary density given in Theorem 5.1. In the equilibrium assumption discussed at the beginning of Section 5.1 and using the previous notation, we have that, if for every
 $i\in V$
the return time
 $\widehat{\tau}^+_{e\to\mathcal{I}_i}$
depends on i but not on
 $e\in\mathcal{I}_i$
, then
 \begin{equation*} \sum_{j\in V} \pi_j \widetilde\tau_{i\to j} = \widetilde\kappa ,\end{equation*}
independently on i, where
 $\widetilde\kappa = \kappa - b^T\pi$
.
A different Kemeny constant has been considered for the case of non-backtracking random walks in [Reference Breen, Faught, Glover, Kempton, Knudson and Oveson8], which is shown to be smaller than the standard Kemeny constant of random walks, at least for certain families of graphs. However, no relation with hitting and return times for that constant is known. Our second-order version of the Random Target Lemma above provides a different notion of Kemeny constant for general second-order random walks which is directly related to hitting times of the process, as in the standard first-order case.
6 Numerical experiments on real-world networks
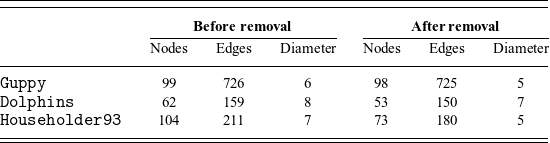
In this section, we present numerical results on the computation of second-order mean hitting times on some real-world networks. We consider three undirected and unweighted networks: Guppy [Reference Croft, Krause and James11], that represents the social interactions of a population of free-ranging guppies (Poecilia reticulata), Dolphins [Reference Lusseau, Schneider, Boisseau, Haase, Slooten and Dawson27], that represents the social structure of a group of dolphins, and Householder93 [Reference Moler30], that represents a collaboration network of a group of mathematicians. Since these graphs contain dangling edges, we remove in sequence all the nodes of degree 1 until each vertex has degree greater or equal to 2. Table 1 shows the dimension of these networks before and after removing such leaf nodes. Our experiments illustrate various statistics on the second-order hitting times
 $\widehat{\tau}_{i\to j}$
for non-backtracking random walks in these graphs. Note that hitting times computed with the pullback transition matrix coincide with the hitting times
 $\tau_{i\to j}$
for the standard random walk, see Example 5.6.
Dimension of the networks used in our experiments before and after leaf node removal

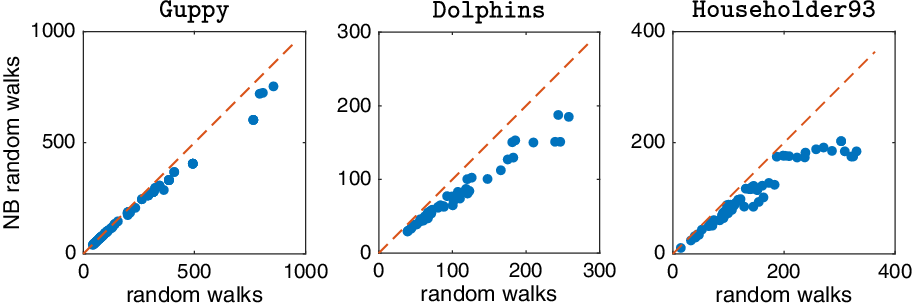
In Figure 1, we scatter plot the average non-backtracking mean hitting times
 $\widehat{m}_j = \sum_{i\in V} \widehat{\tau}_{i\to j}/|V|$
against the average traditional mean hitting times
 $m_j = \sum_{i\in V} \tau_{i\to j}/|V|$
. The dotted red line is the bisector of the first quadrant. We observe that, in all these networks, the ratio between
 $m_j$
and
 $\widehat{m}_j$
is always smaller than 1. Intuitively, this means that, on average, non-backtracking random walks are shorter than classical random walks.
Scatter plot of the average non-backtracking mean hitting times against the average traditional mean hitting times for the networks Guppy, Dolphins and Householder93. The dotted lines represent the bisectors.

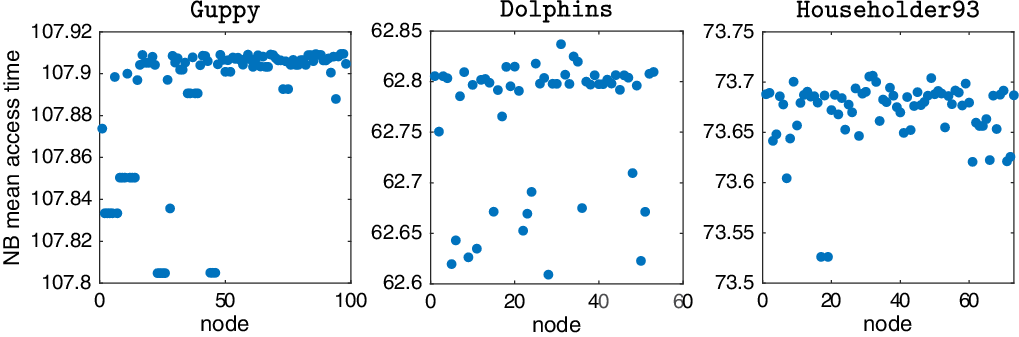
Figure 2 displays the value of the non-backtracking mean access time
 \begin{equation} a_i = \sum_{j\in V} \pi_j \widehat{\tau}_{i\to j}\end{equation}
with respect to the node index
 $i\in V$
. Recall that these values for the standard random walks are all equal to the Kemeny constant of the graph, see Lemma 2.5. Remarkably, the values for non-backtracking walks have a very narrow range, as shown by the small variation of the values in the y-axes. This experiment shows that in these graphs the claim of Corollary 4.4 is approximately valid, even though the assumptions about the structure of the graph are not satisfied.
Plot of the non-backtracking mean access times (6.1) for the networks Guppy, Dolphins and Householder93.

Finally, we computed mean hitting times for the backtrack-downweighted random walks introduced in Example 3.3, with varying
 $\alpha\in[0,1]$
. The corresponding stochastic processes interpolate between the standard random walk (
 $\alpha = 1$
) and the non-backtracking variant (
 $\alpha = 0$
). Nevertheless, the pullback matrix does not depend on
 $\alpha$
, as noted in Example 5.3. Let
 $\tau^{(\alpha)}_{i\to j}$
denote second-order mean hitting times associated with the transition matrix
 $\widehat P^{(\alpha)}$
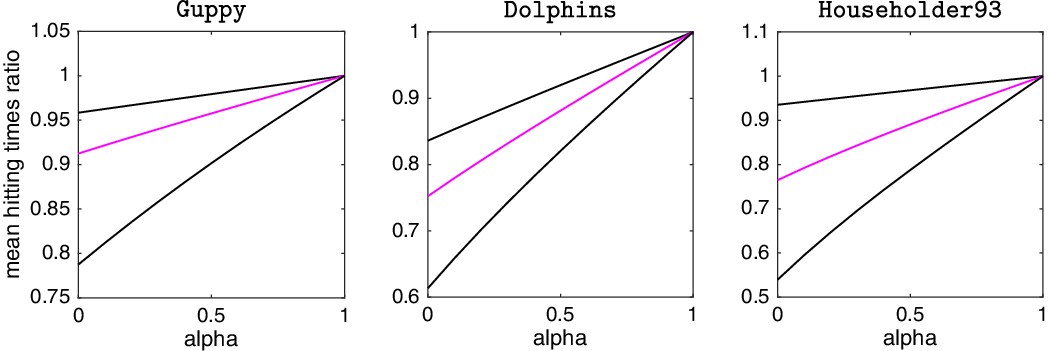
. To better illustrate the effect of penalising backtracking steps, we measure the mean hitting times ratio
 \begin{equation} r^{(\alpha)}_j = \frac{\sum_{i\in V} \tau^{(\alpha)}_{i\to j}}{\sum_{i\in V}\tau^{(1)}_{i\to j}} .\end{equation}
The curves in Figure 3 illustrate the behaviour of the average value (magenta line), along with the maximum and the minimum value (black lines) of these ratios. The values for
 $\alpha = 0$
correspond to the results shown in Figure 1 as
 $\tau^{(0)}_{i\to j} = \widehat \tau_{i\to j}$
. Clearly,
 $r^{(1)}_j = 1$
for every
 $j\in V$
. The mean hitting time
 $(\sum_{i\in V} \tau^{(\alpha)}_{i\to j})/|V|$
quantifies the average time to reach node j by backtrack-penalised random walks, and the coefficient
 $r^{(\alpha)}_j$
in (6.2) measures how much this accessibility index is modified by gradually disallowing backtracking steps. The pictures show that decreasing the amount of backtracking allowed steadily improves average accessibility while increasing the differences between individual nodes. However, the overall effect of disallowing backtracking steps varies greatly from network to network. These observations confirm that second-order random walks can describe navigation or diffusion dynamics on graphs and networks that are significantly different from their first-order counterparts.
Behaviour of the mean hitting time ratios (6.2) for the backtrack-penalised random walks. The solid lines represent maximum, average and minimum values of the mean hitting time ratios, respectively, as
 $\alpha$
varies in [0,1].

7 Conclusions
Second-order random walks, which include non-backtracking random walks as a particular case, provide stochastic models for navigation and diffusion processes on networks that can offer improved modelling capacity with respect to classical random-walks, and thus allow us to better capture real-world dynamics on networks. In this paper, we propose a very general framework to properly define mean hitting times and mean return times for second-order random walks for directed graphs with finite or countably many nodes. Our approach is based on the correspondence between the second-order random walk and a standard random walk obtained by first lifting the second-random walk to the directed line graph and then pulling back onto the original graph. The ‘pullback’ Markov chain obtained this way has the same stationary density as the initial second-order random process and allow us to transfer several well-known results for standard random walks to the second-order case. For example, we prove that second-order mean return times coincide with the mean return times of the corresponding pullback Markov chain and we show how to extend the Kac’s and Random Target Lemmas to second-order random walks.
These results prompt us to further investigations concerning computational issues as well as theoretical properties of second-order random walks. For instance, it is certainly interesting to devise more efficient numerical methods to compute second-order hitting times than the one based on Corollary 4.4 and Theorem 5.4. Furthermore, numerical experiments show that non-backtracking hitting times are consistently smaller than their corresponding classical, backtracking versions. In fact, reducing the probability of backtracking results in a reduction of the mean hitting times. However, a formal explanation of this fact, at the best of our knowledge, is still missing.
Acknowledgement
The work of Dario Fasino and Arianna Tonetto has been carried out in the framework of the departmental research project ‘ICON: Innovative Combinatorial Optimisation in Networks’, Department of Mathematics, Computer Science and Physics (PRID 2017), University of Udine, Italy. The work of Dario Fasino and Francesco Tudisco has been partly supported by Istituto Nazionale di Alta Matematica, INdAM-GNCS, Italy.
Conflicts of interest
The authors declare no conflict of interest.