


The California Grape Crush Report (Crush Report) is a useful compendium of data published annually by the California Department of Agriculture (CDFA) in cooperation with the U.S. Department of Agriculture (USDA) National Agricultural Statistics Service (NASS). The Crush Report includes summaries of quantities produced and estimates of the average prices and value of wine grapes crushed in California, by district and variety (for a total of 107 varieties across seventeen crush districts) and for the state as a whole.Footnote 1 For example, the most recent Crush Report states that the “2016 grape crush totaled 4,227,110 tons, up 9.3 percent from the 2015 crush of 3,868,459 tons” and the “2016 average price of all grape varieties was $762.84, up 13.6 percent from 2015” (CDFA, 2017a, p. 1). These estimates imply a total crush value of $3.22 billion in 2016.
The Crush Report serves as an authoritative source of information. The USDA/NASS uses its estimates of average prices per ton to calculate the total value of wine grape production, as reported in the annual Agricultural Statistics reports (USDA/NASS, 2017a), California Agricultural Statistics reports (USDA/NASS, 2017b), and major industry publications (e.g., Wine Institute, 2015). As we show below, these estimates may have understated the true total value of the crush by 14 to 20 percent in recent years, depending on the year. In addition, the estimates of average prices by variety and crush district in the Crush Report are used in economic studies of the California wine grape industry (see, for example, Alston, Anderson, and Sambucci, Reference Alston, Anderson and Sambucci2015; Fuller and Alston, Reference Fuller and Alston2012; Goodhue et al., Reference Goodhue, Green, Heien and Martin2008; Volpe et al., Reference Volpe, Green, Heien and Howitt2010), and some findings from these studies might contain errors as a result.
The prices of wine grapes vary systematically across varieties and among regions where they are grown, and prices are directly observed only for those wine grapes that are sold, not for those used in winemaking by the grower (i.e., crushed to growers’ accounts). The procedures used to compute the statewide averages have to account for these features appropriately. In this article, we show how the current practice results in a distorted estimate of the average price and value of wine grapes, and how a small change in procedure would provide more accurate estimates. According to our estimates using this revised procedure, the value of wine grapes produced in California in 2016 was $3.6 billion, 15.8 percent higher than the official measure.
The mechanism for this understatement is straightforward. A greater proportion of higher-valued wine grapes are crushed to growers’ accounts; consequently, the average value of all wine grapes is greater than the average value of wine grapes that are sold. Currently, the CDFA applies the average value of wine grapes that are sold to the total volume, resulting in an underestimate of the total value. A more accurate estimate of the total value and average price could be obtained if the (observed) prices of the wine grapes that were sold were used to infer the (unobserved) prices of wine grapes that were not sold before computing the weighted averages.
I. The Challenge of Missing Data
The total quantity of wine grapes crushed (in tons), Q, includes grapes that are sold, Qs , and grapes that are not sold, Qn (i.e., grapes that are “crushed to growers’ accounts”): Q = Qs + Qn . Likewise, the total revenue or value of wine grapes crushed, R (in $), is equal to the sum of the value of wine grapes that are sold, Rs , and the value of grapes that are not sold, Rn : R = Rs + Rn . The challenge is to measure the statewide annual average price per ton for all wine grapes, defined as P = R/Q (in $/ton), when we do not directly observe Rn .
The 2016 Crush Report (CDFA, 2017a) includes details regarding “[t]ons of grapes crushed by California processors from the 2016 crop by type, variety, and reporting district where grown, with comparisons” (Crush Report Table 2), “[t]ons of grapes purchased for wine, concentrate, juice, vinegar, and beverage brandy, by California processors from the 2016 crop by type, variety, and reporting district where grown, with comparisons” (Crush Report Table 4), and “[t]ons of grapes crushed to growers’ accounts by California processors from the 2016 crop by type, variety, and reporting district where grown, with comparisons” (Crush Report Table 9). Crush Report Table 2 refers to the total quantity crushed, whether sold or not; Crush Report Table 4 refers to tons of grapes crushed that were sold from the 2016 crop; and Crush Report Table 9 refers to the part of the total in Crush Report Table 2 that was crushed to growers’ accounts.
Prices are more complicated. The 2016 Crush Report (CDFA, 2017a) includes details regarding the “[b]ase price paid to growers for grapes crushed and delivered to California processors, from the 2016 crop, with Brix factors and purchased tonnage, by type, variety, reporting district where grown, and weighted average base price” (Crush Report Table 8). Each entry in this table refers to a “lot” of grapes sold for crush, organized by district and variety within district, and then ranked by price from lowest to highest. Details are included regarding the base price, tonnage in the lot, and Brix adjustment factors. Lots may vary in size, quality, or other characteristics that affect price, and may represent several transactions. As these data reveal, even within a season, prices for the same variety in the same crush district can vary considerably. For example, in Crush District 4 (Napa), the price of Cabernet Sauvignon ranged from a low of less than $1,000/ton for a total of 70.2 tons in four lots up to a high of more than $40,000/ton for a total of 25.8 tons in two lots. Comparable measures of unit value are not observed for grapes crushed to growers’ accounts (i.e., not sold) and must be inferred.
II. “True” Measures of Statewide Average Prices and Total Value
In what follows, we denote varieties by v and districts by d. (We do not include an indicator for time, because all the computations refer to a particular vintage year.) For any variety v (v = 1, …, V) from district d (d = 1, …, 17), of the total number of lots, I, a subset S (S < I) is sold, and the rest are crushed to growers’ accounts. The total value ($) of the wine grapes sold for crush, Rs , is equal to
 $$R^s = \mathop \sum \limits_{d = 1}^{17} \mathop \sum \limits_{v = 1}^V \mathop \sum \limits_{i = 1}^{S \lt I} P_{vdi}Q_{vdi}.$$
Alternately, we can write
 $$R^s = \mathop \sum \limits_{d = 1}^{17} \mathop \sum \limits_{v = 1}^V P_{vd}^s Q_{vd}^s,$$
where
 $P_{vd}^s $
is the average return ($/ton) for tons sold of variety v from district d—i.e.,
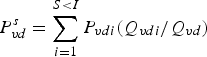 $P_{vd}^s = \sum\limits_{i = 1}^{S \lt I} {P_{vdi}(Q_{vdi}/Q_{vd})} $
, as observed in Crush Report Table 6—and
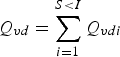 $Q_{vd} = \sum\limits_{i = 1}^{S \lt I} {Q_{vdi}} $
is the total quantity (tons) sold of variety v from district d, as observed in Crush Report Table 4.
Similarly, corresponding to equation (1), the total value of wine grapes crushed to growers’ accounts (and not sold) is equal to
 $$R^n = \mathop \sum \limits_{d = 1}^{17} \mathop \sum \limits_{v = 1}^V \mathop \sum \limits_{i = S + 1}^I P_{vdi}Q_{vdi};$$
corresponding to equation (2), we can simplify this expression to
 $$R^n = \mathop \sum \limits_{d = 1}^{17} \mathop \sum \limits_{v = 1}^V P_{vd}^n Q_{vd}^n, $$
where
 $P_{vd}^n $
is the average unit value of wine grapes of variety v from district d crushed to growers’ accounts (i.e., not sold), and
 $Q_{vd}^n $
is the corresponding quantity. We do not observe
 $P_{vd}^n $
, but
 $Q_{vd}^n $
is provided in Crush Report Table 9.
Combining equations (2) and (2′), the total value of all wine grapes at crush is equal to
 $$R = \mathop \sum \limits_{d = 1}^{17} \mathop \sum \limits_{v = 1}^V P_{vd}^s Q_{vd}^s + \mathop \sum \limits_{d = 1}^{17} \mathop \sum \limits_{v = 1}^V P_{vd}^n Q_{vd}^n. $$
Given that we have defined P = R/Q, where Q = Qs + Qn is the sum of all quantities over varieties and districts, the statewide average return per ton of wine grapes is equal to
 $$\eqalign{& P = \mathop \sum \limits_{d = 1}^{17} \mathop \sum \limits_{v = 1}^V P_{vd}^s \left( {\displaystyle{{Q_{vd}^s} \over Q}} \right) + \mathop \sum \limits_{d = 1}^{17} \mathop \sum \limits_{v = 1}^V P_{vd}^n \left( {\displaystyle{{Q_{vd}^n} \over Q}} \right) \cr & \quad = \left( {\displaystyle{{Q^s} \over Q}} \right)\mathop \sum \limits_{d = 1}^{17} \mathop \sum \limits_{v = 1}^V P_{vd}^s \left( {\displaystyle{{Q_{vd}^s} \over {Q^s}}} \right) + \left( {1 - \displaystyle{{Q^s} \over Q}} \right)\mathop \sum \limits_{d = 1}^{17} \mathop \sum \limits_{v = 1}^V P_{vd}^n \left( {\displaystyle{{Q_{vd}^n} \over {Q^n}}} \right) \cr & \quad = k^s\mathop \sum \limits_{d = 1}^{17} \mathop \sum \limits_{v = 1}^V P_{vd}^s k_{vd}^s + (1 - k^s)\mathop \sum \limits_{d = 1}^{17} \mathop \sum \limits_{v = 1}^V P_{vd}^n k_{vd}^n \cr & \quad = k^sP^s + (1 - k^s)P^n,} $$
where, for wine grapes of variety v, of the statewide quantity sold,
 $k_{vd}^s $
is the proportion coming from crush district d, and, of the statewide quantity crushed to growers’ accounts,
 $k_{vd}^n $
is the proportion coming from crush district d. Aggregating across all varieties and crush districts, k
s
is the proportion of all wine grapes that are sold, and 1 − k
s is the proportion crushed to growers’ accounts and not sold.
The average return per ton for all wine grapes (across all varieties and districts and whether sold or not) is therefore a weighted average of (a) the average return across all varieties and districts for wine grapes that are sold (the first part of each line of equation (4), denoted by superscript “s”) and (b) the average return across all varieties and districts for wine grapes that are crushed to growers’ accounts and are not sold (the second part of each line of equation (4), denoted by superscript “n”). The corresponding estimate of the statewide total value of production is R = P × Q.
III. Estimates of Statewide Average Prices and Values in the Crush Report
In the Crush Report, the average return per ton of wine grapes sold is used as a measure of the average return for all wine grapes:
 $$\hat P\, = \,P^s\, = \,\sum\limits_{d = 1}^{17} {\sum\limits_{v = 1}^V {P_{vd}^s k_{vd}^s.}}$$
The corresponding estimate of the statewide total value of production is
 $\hat R\, = \hat P \times Q$
.
The difference between the “true” average return per ton and the return per ton calculated in the crush reports is equal to
 $$P - \hat P\, = \,P - P^s\, = \,(1 - k^s)(P^n - P^s).$$
The error in the estimate of the statewide average price is equal to the product of (a) the proportion of the crush that is crushed to growers’ accounts and hence for which prices are unobserved (i.e., 1 – ks ), and (b) the difference between the average price per ton for grapes crushed to growers’ accounts (i.e., Pn ), which is not observed, and the observed average price per ton for grapes sold to others (i.e., Ps ). If there is little or no difference between the average value per ton of grapes that are sold and grapes that are crushed to growers’ accounts, or if the fraction crushed to growers’ accounts is very small, then the discrepancy will be negligible.
We do not observe the value per ton of grapes that are crushed to growers’ accounts, but we do observe the proportion of the crush that is sold for each variety and crush district. The general pattern is that the districts with higher-priced grapes (e.g., Districts 3 and 4 in the North Coast region) also have greater shares of grapes crushed to growers’ accounts. Consequently, the statewide average value of grapes crushed to growers’ accounts (i.e., Pn
) will be greater than average price per ton for grapes sold to others (i.e., Ps
); hence, the true average return per ton, P, will be larger than the return per ton in the Crush Report,
 $\hat P = P^s$
. Estimates of the total value of the crush using this downward-biased estimate of the average value per ton will be biased down accordingly.
IV. Alternate Estimates of Statewide Average Prices and Values
An alternate method, which we describe next, may provide more accurate estimates of the true average value per ton and the total value of the California grape crush. For this calculation, we apply the average value per ton for grapes that are crushed to growers’ accounts as an estimate of the average value per ton for grapes of the same variety in the same district that are sold to others—i.e., assuming
 $P_{vd}^n = P_{vd}^s $
for all varieties v and districts d. Making this substitution in equation (4) yields
 $$\eqalign{\tilde P &= k^s\sum\limits_{d = 1}^{17} {\sum\limits_{v = 1}^V {P_{vd}^s}} k_{vd}^s + (1 - k^s)\sum\limits_{d = 1}^{17} {\sum\limits_{v = 1}^V {P_{vd}^s}} k_{vd}^n \cr &= \sum\limits_{d = 1}^{17} {\sum\limits_{v = 1}^V {P_{vd}^s}} \left[ {k^sk_{vd}^s + (1 - k^s)k_{vd}^n} \right] \cr &= \sum\limits_{d = 1}^{17} {\sum\limits_{v = 1}^V {P_{vd}^s}} \left[ {k_{vd}^s + (1 - k^s)\left( {k_{vd}^n - k_{vd}^s} \right)} \right].} $$
In this case, the error in the estimate of the true average return per ton is
 $$P - \tilde P = (1 - k^s)\sum\limits_{d = 1}^{17} {\sum\limits_{v = 1}^V {\left( {P_{vd}^n - P_{vd}^s} \right)}} k_{vd}^n. $$
Here, the discrepancy depends on the difference between the average value of grapes crushed to growers’ accounts and the average price per ton of grapes sold to others, but now at the level of varieties within districts rather than at the level of the statewide overall average. If grapes of the same variety within any crush district have similar unit values per ton, regardless of whether they are sold or crushed to growers’ accounts, this difference will be small or close to zero. However, if districts exist for which this difference is large, and these districts account for a sizable share of tonnage crushed to growers’ accounts for the state, the discrepancy could be significant.
Which method of estimating the statewide average value per ton is more accurate? Consider the difference between equations (6) and (7):
 $$\eqalign{\left( {P - \hat P} \right) - \left( {P - \tilde P} \right) &= (1 - k^s)\left( {P^n - P^s} \right) - (1 - k^s)\sum\limits_{d = 1}^{17} {\sum\limits_{v = 1}^V {\left( {P_{vd}^n - P_{vd}^s} \right)}} k_{vd}^n \cr &= (1 - k^s)\left[ {\left( {P^n - P^s} \right) - \sum\limits_{d = 1}^{17} {\sum\limits_{v = 1}^V {\left( {P_{vd}^n - P_{vd}^s} \right)}} k_{vd}^n} \right] \cr &= (1 - k^s)\sum\limits_{d = 1}^{17} {\sum\limits_{v = 1}^V {P_{vd}^s}} \left( {k_{vd}^n - k_{vd}^s} \right).} $$
The term in square brackets in the second line of equation (8) can be seen as a difference between two terms. The first term is the difference between the statewide average prices of wine grapes that are sold and those that are crushed to growers’ accounts, a difference between two means; the second term is the weighted average of the differences between variety-cum-district average prices of wine grapes that are sold and those that are crushed to growers’ accounts, the mean of differences. Intuitively, the latter is likely to be smaller.
The third line of equation (8) can be seen as a weighted average (within the summation) of observed variety-cum-district-specific prices. The weight for each price (for a given variety in a given crush district) is equal to the difference between (a) the crush district's share of the statewide quantity of that variety crushed to growers’ accounts and (b) the crush district's share of the statewide quantity of that variety sold to others. As discussed above, a greater proportion of tonnage is crushed to growers’ accounts in crush districts with higher variety-specific prices, so the expression in equation (8) is likely to take a positive sign, which means
 $\tilde P$
provides a better approximation of true statewide average return per ton, P, than the estimate in the Crush Report,
 $\hat P$
.
V. Numerical Illustration
Table 1 includes estimates of district-level and statewide average prices for wine grapes in 2016 calculated using observed district-specific average prices for wine grapes that were sold applied to (a) just the quantities sold (i.e.,
 $\hat P$
from equation (5)) in column (3), as in the Crush Report, and (b) the total quantities crushed (i.e.,
 $\tilde P$
from equation (4′)) in column (4), our suggested alternative measure. The implied district-level and statewide total value of wine grapes crushed is also reported, in columns (5) and (6). Within crush districts, the differences in the estimated prices between columns (3) and (4) are generally modest. However, when we aggregate up to regions, and to the state as a whole, the bias becomes greater. The statewide average value of wine grapes calculated using
 $\hat P$
(as in the Crush Report) is $780/ton, while the value per ton calculated using
 $\tilde P$
is $903/ton. Applying these average unit values to the total volume of wine grapes produced, the implied estimates of the total value of production in 2016 differ by about $0.5 billion in 2016, 13.6 percent of the larger estimate (15.8 percent of the smaller estimate).
Alternative Estimates of Average Wine Grape Values, 2016 Data
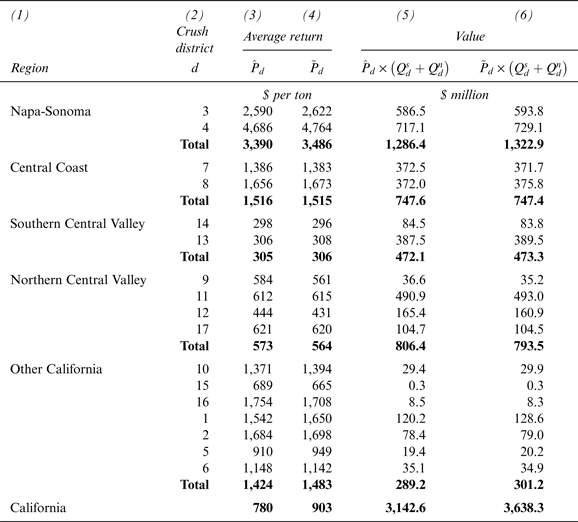
Sources: District-level prices were calculated using data from the Crush Report's (CDFA, 2017a) district-level detail by variety.
Table 2 provides information on the differences in production patterns among crush districts that account for these discrepancies. While providing district-level detail, we have organized the data by production regions, defined such that each district fits entirely into one region. Production regions differ in terms of their terrains, climates, soil types, mixtures of varieties grown, and qualities of grapes and wines produced. The unit of analysis relevant for our purposes is a crush district, but crush districts within each major region have similar characteristics, and it is helpful to look at data for particular crush districts in the context of the regions to which they belong.
Characteristics of Grape-Growing Regions in California, 2016
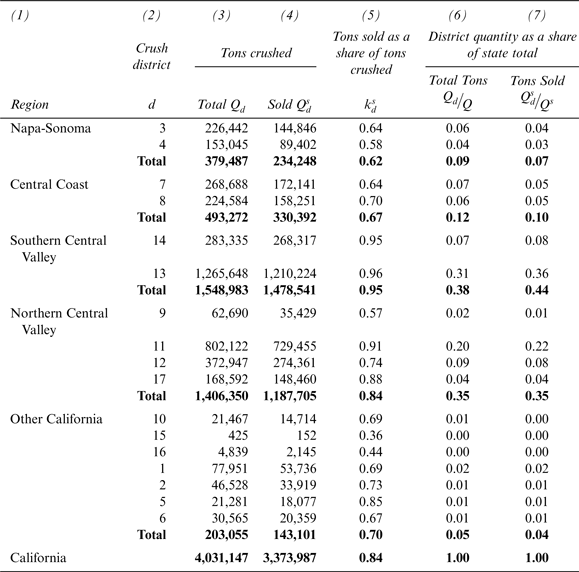
Sources: Alston, Anderson, and Sambucci Reference Alston, Anderson and Sambucci2015; authors’ calculations using data from CDFA 2017a.
In general, the share of production crushed to growers’ accounts is greater for Napa-Sonoma and the Central Coast, where average prices per ton are generally higher, and smaller for the Northern and Southern Central Valley regions, where average prices per ton are much lower, but the volume of production is large. Columns (3) and (4) of Table 2 include two measures of production for each district d: total tons crushed, denoted by Q
d
, and tons sold, denoted by
 $Q_d^s $
. The ratio
 $k_d^s $
is the district-specific measure of the share of production that is sold rather than crushed to growers’ accounts. Among regions, these shares differ appreciably, from 95 percent in the Southern Central Valley to less than 60 percent in Crush District 4 (Napa). The crush districts also differ in terms of their relative importance as producers. The last two columns show the district-specific shares of total tons crushed and of the total quantity that is sold rather than crushed to growers’ accounts. Among regions, these shares differ appreciably, too—the Central Valley regions account for 73 percent of the total volume and 79 percent of the volume sold.
The average district-level prices per ton do not differ significantly between the two methods of calculation: As shown in detail in Table 1, the difference is at most 7 percent, and it is between 0 and 3 percent for crush districts where most of the volume is produced. However, when the average weighted return is calculated for the state, the difference between the two methods of calculation becomes quite large. Given the information in Table 1 and Table 2, and informed by equations (5)–(8), it is easy to see why. Weighting the average return per ton by tons sold underrepresents the districts in the coastal valleys where larger shares of production are crushed to growers’ accounts—in particular, Districts 3, 4, 7, and 8 in the Napa-Sonoma and Central Coast regions. These districts produce comparatively high-priced wine grapes. Conversely, disproportionate weight is given to prices from districts where nearly all wine grapes are sold, in particular those in the Southern and Northern Central Valley regions that produce a very large volume of lower-priced grapes.
The estimated average value per ton of wine grapes crushed for each district is calculated using the same method and therefore is susceptible to the same type of error. However, each variety's share of the total tons crushed within a district is usually similar to its share of the purchased tons within the same district (i.e., the share of production crushed to growers’ accounts is similar across varieties within a district). In columns (3) and (4) of Table 1, we see small district-level differences between the two estimates of average prices.
Therefore, the difference between the two methods of calculating state-level prices is mainly attributable to the difference in district-level shares of total state production compared with the district-level shares of state production that are sold (comparing columns (6) and (7) of Table 2). In equation (5), to compute the statewide average price,
 $\hat P$
, for the Crush Report, the district-level price per ton for wine grapes is weighted by the district-specific share of tons sold statewide, which is generally smaller than the share of tons produced for districts with higher-priced grapes. Returns per ton in districts with lower-valued grapes are given disproportionately greater weight in calculating the average statewide price per ton for wine grapes, because the district-specific share of tons sold statewide tends to be closer to the share of production in those districts.
VI. Conclusion
The difference between the two methods of calculating average weighted returns per ton of California wine grapes at crush stems directly from differences among crush districts in the shares of production crushed to growers’ accounts. Generally, regions producing higher-priced grapes have a larger share of production crushed to growers’ accounts and a smaller share sold compared with regions producing lower-priced grapes. The share of production crushed to growers’ accounts ranges from only 5 to 20 percent of volume in the Central Valley regions but represents 35 to 40 percent of the volume crushed in the premium Coastal regions. Regions also vary in how much they contribute to the state's total production. The Napa-Sonoma and Central Coast regions together account for 21 percent of the state's total crush but only 17 percent of the quantity sold. Conversely, the Central Valley regions account for 73 percent of the state's total crush and 79 percent of the quantity sold. The remaining crush districts grouped under “Other” account for 5 percent of the state's total crush and 4 percent of the quantity sold.
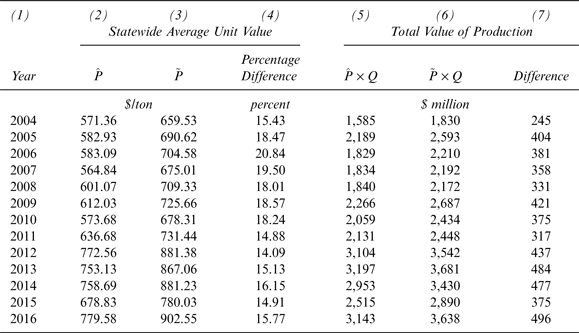
The composition of the crush varies from year to year, and, consequently, so does the discrepancy between the alternative methods of estimating the district, regional, and statewide average prices. Table 3 shows the difference between the estimated average statewide return per ton calculated using the two methods described above for each year during the period 2004 to 2016. The average difference in price is about 17 percent of the lower value, with 2006 having the largest difference, just over 20 percent. The average difference in price of 17 percent over the past ten years implies estimates of value that understate the value of wine grape production by about $400 million per year compared with our preferred method. Errors of this magnitude may have led USDA/NASS to incorrectly report grapes as the second-largest agricultural crop by value in California (after almonds) when, in fact, grapes were the largest crop in 2011, 2013, and 2015.
Statewide Average Price and Total Value of Wine Grape Production, 2004–2016
Source: Calculated by the authors using data from the Crush Reports, 2004–2016 (CDFA, 2017b).



