

Electoral competition is the standard measure for the quality of representative democracy within American states (Hogan Reference Hogan2003: Holbrook and Van Dunk, Reference Holbrook and Van Dunk1993; Shufeldt and Flavin, Reference Shotts2012). Without sufficient competition for elected office, the career ambitions of office seekers and holders would not be efficiently harnessed to reflect the true desires of the polis (Aldrich Reference Aldrich2011). The vast majority of scholars believe that competitive elections produce higher quality candidates and ensure substantive representation. Yet research has shown that incumbent politicians have gained an ever increasing electoral advantage over challengers, a fact which negatively affects competition and the quality of representation (Abramowitz Reference Abramowitz1975; Cox and Katz, Reference Cox and Katz1996; Erikson Reference Erikson1971; Fiorina Reference Fiorina1977; Jacobson Reference Jacobson1981; Tufte Reference Thernstrom1973). Thomas Brunell (Reference Brunell2010), on the other hand, argued that competition is bad for Americans because it maximizes the number of voters who will be dissatisfied with the results. He suggests packing districts to the hilt with ideologically like-minded voters. I disagree—heavily partisan districts are prone to produce more ideologically extreme candidates (Brady et al., Reference Brady, Han and Pope2007) and research on ideology has found that even co-partisans hold inconsistent ideological beliefs (Ellis and Stimson, Reference Ellis and Stimson2012; Feldman and Johnston, Reference Feldman and Johnston2013). Lastly, competitive races produce higher quality candidates. While these candidates may not please every voter, overall they will be more effective representatives for their districts.
The incumbency advantage is defined as the average gain in the proportion of the district vote that the incumbent receives if she runs for reelection (King and Gelman, Reference King and Gelman1991). It is the most frequently studied variable in the literature on electoral competition (Gelman and King, Reference Gelman and King1990). Alford and Hibbing (Reference Alford and Hibbing1981) described it as the central thread in electoral competition. Robert Erikson (Reference Erikson1971) was the first to measure the incumbency advantage. He found that incumbents benefited from being more recognizable and visible. Andrew Gelman and Gary King (Reference Gelman and King1990) improved upon the measure by including constituency service, fund-raising, and other institutional resources. Incumbents, on average, are not of higher quality but are, through their institutional advantages, able to deter high-quality challengers (Levitt and Wolfram, Reference Levitt and Wolfram1997). First-term incumbents and veterans alike both benefit from incumbency (Butler Reference Butler2009; Praino and Stockemer, Reference Praino and Stockemer2012). It has been found to be an advantage most of the time and in most political districts (Cox and Morgenstern, 1993), and the electoral benefits are unaffected by declines in partisanship (Cover Reference Cover1977). James Garand and Donald Gross (Reference Garand and Gross1984) found incumbent winners have larger margins of victory than non-incumbent winners.
My central argument is that racial gerrymandering is producing a distinct and substantial incumbency advantage within Majority Minority Districts. I agree with David Lublin and D. Voss (Reference Lublin and Stephen Voss2000) to the extent that Majority Minority Districts are a necessary tool for achieving descriptive representation, and I also agree with Charles Cameron and colleagues (1996), Kimball Brace and colleagues (1995), and Carol Swain (Reference Shufeldt and Flavin1993) in that over-packing Black districts adversely affects competition and adds to the incumbency advantage within Majority Minority Districts. Cameron and colleagues (1996) argued that Black districts need only be packed to a maximum of forty-seven percent Black voting age population to ensure descriptive representation. I suggest that Majority Minority Districts are unique in that: 1) both parties use them to their political advantage (Petrocik and Desposato, Reference Petrocik and Desposato1998; Shotts 2001), and 2) most are packed well-beyond what is needed to ensure descriptive representation. My paper purports that Majority Minority Districts are necessary in achieving descriptive representation but that over-packing reduces competition and thereby substantive representation. This is important because, as David Canon (Reference Canon1999a) stated, the “central problem of representative democracy is to provide a voice for minority interests in a system that is dominated by the votes of the majority. The legitimacy and stability of any democracy depends, in part, on its ability to accomplish that difficult aim” (p. 339). The key takeaway is that gerrymandering—political or racial—is a process in which the legislature picks its constituents. It is a process in which the supply of voters is artificially manipulated but not necessarily to the benefit of the constituency created, and which produces contention between descriptive and substantive representation.
I estimate the level of competition within Majority Minority Districts as compared to majority White Democrat and Republican districts in general elections in the state legislature of Alabama from 1994 to 2003. Robert Hogan (Reference Hogan2003) found there was a scarcity of research examining intraparty competition. My contribution addresses this gap in the literature. Theoretically there should not be a substantial difference in competitiveness between majority White Democrat districts and majority Black (also Democrat) districts within the same state. Essentially, both districts consist of Alabamians and are equally as partisan (Democrat), racially compact, and have an equal chance of achieving descriptive representation. Using three separate measures of competitiveness—the margin of victory, the total votes cast, and the number of candidates running—I find competition in Majority Minority Districts is significantly lower compared to majority White Democrat and Republican districts. I also find evidence that over-packing Black districts beyond what is necessary to elect a Black representative creates a significant and sui generis incumbency advantage compared to majority White districts.
The first section of this paper focuses on redistricting and its effects on electoral competition. The next section examines the tradeoffs between descriptive and substantive representation. Thirdly, I discuss candidate emergence and the supply-side theory of racial redistricting. The fourth section presents the data used in the study and my estimation techniques. My results are presented in the fifth section. I conclude by relating my findings to the larger debate surrounding electoral competition, minority representation, and representative democracy. Ultimately, scholars of state and local politics, political behavior, African American Politics, and American political development must consider the long-term effects packing will have on minority participation and representation.
Redistricting: Partisan and Racial Gerrymandering
Scholars have found redistricting, more specifically gerrymandering, has added to the incumbency advantage and thereby its own centrality to representative democracy by making districts ever safer for incumbents (Cox and Katz, Reference Cox and Katz2002). Political gerrymandering is manipulating district lines in a way that benefits one political party over another (Swain Reference Shufeldt and Flavin1993). Bruce Cain (Reference Cain1985) and Thomas Wyrick (1991) found that the key to political gerrymandering was increasing the efficiency of majority party strength, and that could only be realized by the capture of more seats (by making opposition party districts more competitive) or by making their existing districts more safe for incumbents, but not both. The current literature suggests politicians are doing the latter. In January 2018, a federal appeals court struck down North Carolina’s congressional redistricting plan as unconstitutional because it believed Republicans were seeking political advantage in violation of the Fourteenth Amendment’s guarantee of equal protection (Blinder and Wines, Reference Blinder and Wines2018). Federal appeals courts have also ruled against Republicans in Wisconsin and Democrats in Maryland for invidious political gerrymandering, calling into question the legality of such practices (Blinder and Wines, Reference Blinder and Wines2018). Most recently the Supreme Court declined to address the central question of gerrymandering put forth in the Wisconsin and Maryland cases (NPR 2018). The Supreme Court sent the Wisconsin case back to the trial court to allow plaintiffs the ability to prove their voting power had been directly affected, and in the Maryland case the court unanimously ruled against Republicans citing that they took too long to seek an injunction (Liptak Reference Liptak2018).
Bruce Oppenheimer (Reference Oppenheimer2005), Alan Abramowitz and colleagues (2006), and Goerge Hawley (Reference Hawley2013) are among the scholars that support the idea that population movements are behind the increase in uncompetitive races. Hawley (Reference Hawley2013) posited that politically motivated migration is a part of America’s foundational myth. The Puritans migrated for religious freedom, the Mormons moved west for the same, and African Americans moved north to evade Black Codes and Jim Crow segregation. These scholars argue people are voting with their feet and physically moving to like-minded areas, thereby creating more and more homogenous districts—a phenomenon which is, in turn, responsible for the increasing electoral advantages incumbents receive. Although this argument is partially persuasive, on average, people would not have the economic resources or the knowledge of where to relocate if homogenous districts had not been established beforehand to give them a destination. I am not suggesting that people do not move for political reasons, thus adding to the incumbency advantage; rather, I offer that citizens would need substantial personal resources, cues from a political party, and a known co-partisan district. Research on the so-called ‘race to the bottom’ examined whether poor single mothers move in response to higher welfare benefits, with the results largely supporting the position that residents do not move for benefits, even if those benefits are economic (Bailey Reference Bailey2005; Berry et al., Reference Berry, Fording and Hanson2003). Therefore, I suggest redistricting, and more specifically gerrymandering, remains a root cause of the growing incumbency advantage.
Racial gerrymandering is manipulating districts to increase or reduce the representation of a minority population. Minority populations have been ‘cracked,’ with large populations of minorities split between various districts, and ‘packed’ into single super majority districts; both tactics are intended to dilute Black political power. Swain (Reference Shufeldt and Flavin1993) said “the evidence suggests that the present pattern of drawing district lines to force Blacks into overwhelmingly Black districts wastes their votes and influence [and] place[s] them in districts where their policy preferences can become separated from the majority in their state” (p. 235). This is important because in states with significant African American populations, such as Alabama and other Deep South states, partisan gerrymandering is tantamount to racial gerrymandering.
According to the Pew Research Center, Alabama is only 52% Republican (Pew Research Center n.d.). The other Deep South states, Louisiana, Mississippi, Georgia, and South Carolina, are a slight majority Democrat or equally split, yet their state legislatures are all controlled by Republicans (National Conference of State Legislatures 2018; Pew Research Center n.d.). In the past three presidential elections, roughly 800,000 votes in Alabama have been cast for the Democratic candidate, compared to roughly 1.2 million for the Republican candidate (New York Times 2017). The voter turnout in Alabama does not reflect the state house being 70% Republican, the state senate being 74% Republican, and the congressional delegation, U.S. House and Senate, being 78% Republican (Ballotpedia 2018a, 2018b, 2018c). Over half a million White Democrats (of roughly 700,000 total) voted in the 2017 Alabama U.S. Senatorial special election, and yet White Democrats make up only 0.05% of the Alabama legislature (Alabama Legislature; Sewell Reference Schwindt-Bayer and Mishler2018; Washington Post (2018). Blacks, roughly 30% of the state’s population, represent 14% of the congressional delegation and 23% of the state legislature (Alabama Legislature). Alabama is a case in point for Swain’s argument about wasted influence and the separation of policy preferences from the majority of the state. In Alabama, as in similar Deep South states, Majority Minority Districts have been used successfully to box-out White Democrats and reduce overall Black representation. In doing so, the Republican Parties of Deep South states have by default made every legislative issue a racial issue—White Republicans versus Black Democrats. Much like with voter ID laws, limits on early voting, registration restrictions, disenfranchisement, and voter roll purges, racial gerrymandering has become an additional systemic barrier to participatory behavior (Hajnal Reference Hajnal2009; Hajnal et al., Reference Hajnal, Lajevardi and Nielson2017; Wang Reference Walton2012).
Majority Minority Districts: Tradeoffs in Descriptive and Substantive Representation
Any discussion of Black representation must first acknowledge the immense hurdles African Americans have had to overcome to exercise their right to vote prior to the passage of the Voting Rights Act of 1965 and the creation of Majority Minority Districts (Voting Rights Act 1965). On paper, the Fifteenth Amendment gave African Americans the right to vote, but states quickly countered the amendment with the passage of poll taxes, literacy tests, and grandfather clauses. The effect of the Voting Rights Act cannot be overstated. From 1965 to 1970, the number of Blacks registered to vote rose by one million. Yet even with the Voting Rights Act, African Americans still had a hard time getting elected to public office, even in areas where Blacks were the majority (Salamon and Van Evera, Reference Salamon and Van Evera1973). Only two African Americans have even been elected to a governorship. Currently, African Americans hold 8.6% of state legislature seats, 10.6% or forty-six U.S. House seats, and three U.S. Senate seats (National Conference of State Legislatures 2018). February 1, 2013 marked the first time in history that two African Americans served in the U.S. Senate concurrently (United States Senate).
The Supreme Court’s invalidation of Section 4(b), or the formula determining which jurisdictions would be subject to the preclearance provision (Section 5) of the Voting Rights Act, has eliminated an important tool in ensuring descriptive representation (Shah et al., Reference Sewell2013; Shelby v. Holder 2013). This is critically important because even with preclearance, the majority of Black voters end up on the losing side in presidential, senate, gubernatorial, and mayoral elections (Hajnal Reference Hajnal2009). The mayoral losses are occurring in cities where Blacks are a much larger share of the electorate than the national average. 41% of Black voters are what Zoltan Hajnal termed ‘super-losers,’ meaning they vote for losing candidates in federal, state, and local elections as compared to only 9% of Whites.
The Voting Rights Act was passed so that Blacks could vote uninhibited and also run for office uninhibited, providing them with a chance for descriptive, but most importantly substantive, representation. Descriptive representation is the ability to elect a representative with similar traits. Substantial representation means having a representative with congruent policy views acting in the interest of the represented, in a manner responsive to them (Pitkin Reference Pitkin1967). Descriptive representation has been shown to have a positive effect on Black voter turnout at the state and federal level (Bhatti and Hansen, Reference Bhatti and Hansen2016; Clark Reference Clark2014; Fairdosi and Rogowski, Reference Fairdosi and Rogowski2015; Fraga Reference Fraga2016; Rocha et al., Reference Rocha, Tolbert, Bowen and Clark2010), specifically among liberal Blacks (Democrats) (Griffin and Keane, Reference Griffin and Keane2006). At the local level, each additional Black city council member corresponds to a 1% increase in the likelihood of electing a Black mayor (Marschall and Ruhil, Reference Marschall2006), and Black mayors are associated with increased descriptive representation within the local bureaucracy (Hopkins and McCabe, Reference Hopkins and McCabe2012). Christopher Clark (Reference Clark2014) argues that Blacks in states with increased descriptive representation are more likely to be contacted by their representative, and Blacks who are contacted are 8% more likely to vote than those who are not (Philpot et al., Reference Philpot, Shaw and McGowen2009). Hanes Walton (1985) said that “…the distribution of goods and services and scarce resources are made on the basis of race or sometimes such variables as equality. Racial participation in the distribution system is specified to ensure a fair distribution of goods and services” (p. 29–30). Descriptive representation is intended to ensure Blacks have access to the distribution system.
Descriptive representation has also been associated with more substantive representation, or greater policy responsiveness (Juenke and Preuhs, Reference Juenke and Preuhs2012; Minta Reference Minta2009; Preuhs Reference Preuhs2006). Race and ethnicity have been found to increase the likelihood of support for minority interest legislation (Canon Reference Canon1999a; Lublin Reference Lublin1997; Tate Reference Tate1994). Research on the Congressional Black Caucus (CBC) and Congressional Hispanic Caucus (CHC) has found that compared to Whites, minority legislators participate more on racial and ethnic issues (Minta Reference Minta2009). The CBC “…plays an important role within the Democratic Party in Congress, and several moderates within the CBC continue to shape issues like welfare reform, tax policies, and crime policy” (Canon Reference Canon1999a, p. 148). Yet the research has focused on congressional roll-call voting (Minta Reference Minta2009). My research is focused on the effects of redistricting on legislative competition at the state level.
The problem is that descriptive and substantive representation are not necessarily correlated. Safe districts or districts with low electoral competition have the effect of decreasing the responsiveness of Black representatives (Gay Reference Gay2001; Swain Reference Shufeldt and Flavin1993; Thernstrom Reference Tate1987). A focus on descriptive representation almost inevitably leads to an ill-placed concern about the composition of a political institution as opposed to its activities or policy outcomes. Hanna Pitkin (Reference Pitkin1967) argued that this is problematic because representatives cannot be held accountable for their descriptive characteristics, and at the same time the descriptive characteristics that warrant representation are not always clear or self-evident. Mere descriptive representation also does not account for variations in interest within the larger group and between individual group members. It assumes that only a descriptive member can and/or will advocate for group interest. For African Americans this means a belief that only Blacks will advocate for Black issues, not accounting for the intersectionality invested within the Black community. Should a Black transwoman feel that she will be equally represented by an evangelical Black man solely based on him being Black? Substantive representation is about enacting laws and implementing policies that are responsive to their constituents’ needs (Schwindt-Bayer and Mishler, 2005). The most important question is: does a representative have to be descriptive to be supportive of substantive policy? Simply put, no. I suggest that representation is multidimensional and Majority Minority Districts are not designed to account for all the nuances associated with such a dynamic concept as representation. Therefore, still acknowledging the importance of descriptive representation, I suggest that states should move away from a control model approach to Majority Minority Districts and towards an influence model when designing minority districts.
As the demographic makeup of a district changes, so too does the level of competition within it. Brace and colleagues (1995) and Katherine Tate (Reference Swain1991) found evidence that turnout was affected by the type of district that minority voters found themselves in. Over-packing districts is associated with decreased turnout, and the effects are amplified for Blacks as their population size increases (Hayes and McKee, Reference Hayes and McKee2012). Descriptive representation is an important tool in gaining access to government; yet, the evidence suggests that over-packing Blacks into supermajority districts should be avoided. Andrew Hacker (Reference Hacker1986) said that “winning by an over comfortable majority is a luxury that a party can well do without” (p. 47). A Black candidate who wins by a supermajority of votes in a Black district has votes in surplus of what is needed to secure descriptive representation and aids in the dilution of Black political power. Over-packed Majority Minority Districts are pockets of wasted votes, interest, and representation. The negative externalities of over-packing are seen as a less harmful externality of achieving descriptive representation without concern for substantive representation.
I find that the presence of so many surplus votes creates a Majority Minority District-specific incumbency advantage, which is substantial and distinct from the incumbency advantage we observe in other similarly gerrymandered districts. This advantage is substantial because in states such as Alabama such districts represent or encapsulate all the Black interest within the state. It is distinct because both Democrats and Republicans used Majority Minority Districts to their party’s political advantage without concern for multidimensionality of representation. The supply of Black voters within a district has a significant effect on competition within said district, namely candidate emergence. Contextual and district factors are strong determinants of the likelihood of a challenger emerging (Carey et al., Reference Carey, Niemi and Powell2000; Hogan Reference Hogan2003).
Candidate Emergence and the Supply-Side Theory of Racial Redistricting
There is ample research that suggests incumbents deter political challengers (Hogan Reference Hogan2003; Jacobson Reference Jacobson1981; Levitt and Wolfram, Reference Levitt and Wolfram1997). Many qualified challengers wait for open seats rather than challenge incumbents (Maestas et al., Reference Maestas, Fulton, Maisel and Stone2006). Understanding why people challenge incumbents is central to understanding representation. There are three theoretical approaches to understanding candidate emergence. A sociological approach is based on the premise that socioeconomic factors such as reputation, occupation, education and income/wealth determine one’s eligibility for public office. Psychological approaches have a more individual focus highlighting attitudes, predispositions, and behaviors and not institutional factors and social groups. Lastly, a rational choice perspective argues candidates behave rationally, assessing the cost and benefit of alternative courses of action, and choose what they perceive as the most utility-maximizing option (Kazee Reference Kazee1994).
Contextual or district-specific factors also play an important role in candidate emergence. More importantly these district-level factors are largely fixed. Highly ambitious and qualified candidates can do little to change the opportunity structure within a district. Of these contextual factors the racial composition and the geographic compactness of a district play key roles in candidate emergence. In addition, David Cannon and colleagues found that “the redistricting process provided both the most significant structural constraint and the largest source of uncertainty” for challengers (Kazee Reference Kazee1994, p. 34). If redistricting, racial composition, and geographical compactness are substantial contextual constraints linked to candidate emergence, then Majority Minority Districts—those designed to be racially compact and utilize questionable geographical compactness—would be the type of districts, contextually, most likely to deter political challengers.
The literature seems to support both the supply-side theory of racial redistricting and my argument that the adverse effects are more pronounced in Majority Minority Districts because they are, by definition and design, packed with Blacks to ensure descriptive representation. The supply-side theory of racial redistricting theorizes that ambitious office seekers respond to changes in the electoral environment (the district) caused by redistricting and the district composition shapes their electoral decisions (to challenge or not) and outcomes (competition and who wins). Supply-side theory posits that all outcomes depend on the calculations of potential candidates. Ambitious office seekers and holders are assumed to be acting in their own self-interest and not challenging incumbents they perceive cannot be beaten (Canon Reference Canon1999b; Canon et al., Reference Canon, Schousen and Sellers1996). I argue, moreover, that, as the number of Blacks (the supply) within a district increases beyond what is necessary to ensure descriptive representation, the increase changes the district’s environment and negatively affects the decisions of potential challengers to run. Without high-quality candidates challenging incumbents, the level of competition decreases. In other words, the margins of victory increase and total votes cast decrease, causing a decrease in the quality of representation.
DATA AND METHODS
I propose two hypotheses. First, due to the unique contextual environment within Majority Minority Districts, they will be less competitive than majority White Democrat and Republican districts. Second, as the percent Black increases within a district, Majority Minority Districts become less competitive compared to majority White districts. I examine the Alabama state legislature for three reasons. First, Malcolm Jewell and David Breaux (1988) discovered that incumbent reelection success in state legislatures was already high in the late 1960’s even before it started increasing. Less than one fifth of all state primary elections are challenged (Hogan Reference Hogan2003). Second, there are more Majority Minority Districts at the state level than the federal level. Third, at the state level I am better able to examine intraparty competition, adding an additional level of understating as to how racial gerrymandering is affecting competition. Lastly, the Inter-University Consortium for Political and Social Research (ICPSR) has a data set that includes state elections from 1967 to 2003, which therefore can track the effect of the Voting Rights Act of 1965 on voting trends. Similarly, before 2013, the department of Justice required all redistricting plans for bad actors (mostly southern states) to go through preclearance (Voting Rights Act 1965; Shelby v. Holder 2013).
My data is distinctive in that I utilized the available ICPSR dataset of state legislative elections 1967–2003, but I also collected data from the Alabama Legislative Reapportionment Office and the Alabama Department of Archives and History, thereby creating a unique data set. The time frame of 1994 to 2003 yielded 832 observations. Using random-effects generalized least squares (GLS) regression with year fixed effects, I compare competition between three different types of state legislative districts utilizing three separate measures of competitiveness. The dependent variables I use to measure competitiveness are the margin of victory, number of candidates, and total votes. The margin of victory is the percentage of total votes that separated the winner and the second-place finisher. Margin of victory, total votes cast, and number of candidates are generally accepted measures for the level of competition within a district. In Alabama the mean margin of victory is 49.3, the mean number of candidates in a race is 2.3, the mean number of total votes cast in a lower chamber race is 11,261 and in an upper chamber race is 34,650. A district is either a majority White Democrat district (0), a Majority Minority District (MMD) (1), or a majority White Republican district (2). From 1994 to 2003 there were a total of 368 races in majority White Democrat districts, 280 in majority White Republican districts, and 184 in MMDs. Prior to 2010 the Alabama legislature was majority Democrat. The Republican realignment had not yet occurred. Total population controls for variations in population within and between like districts. The percent rural is used to account for differences in the amount of resources and media salience between urban versus rural districts. Chamber controls for the differences in upper (1) and lower chamber (0) districts. Incumbency is used to control for whether there is an incumbent (1) in the race or not (0). The percent Black is the percent of the population within the district that is African American. The percent White is the percent of the district that is White.
RESULTS
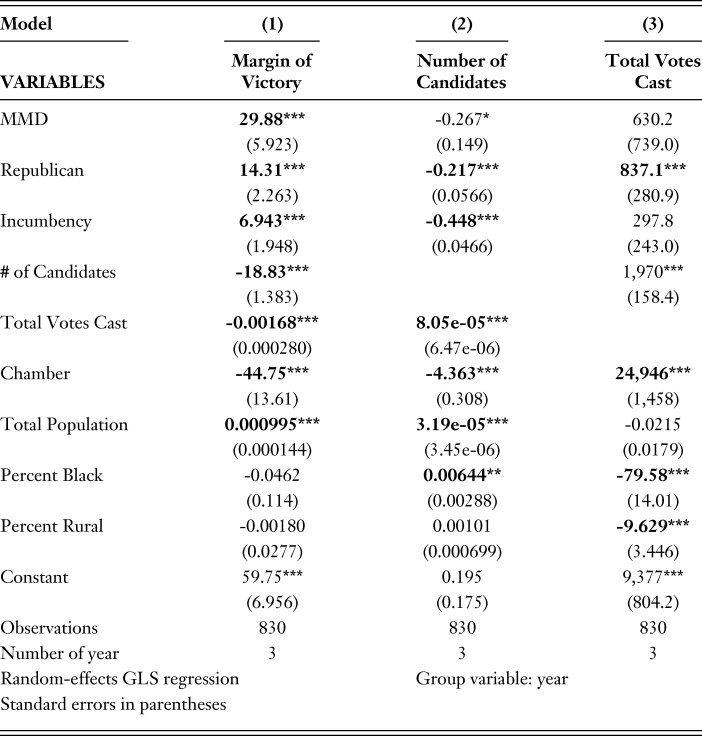
In Model 1 both Majority Minority Districts and Republican districts are significant and positively associated with the margin of victory. The coefficient for Majority Minority Districts is significant and distinct from that of majority White Democratic districts, and roughly thirty points larger. The average margin of victory in Alabama is 49.3, making the margin of victory in MMDs roughly 79.2.Footnote 1 Republican districts are also significant and distinct from majority White Democratic districts, but by only 14.3 points. As expected, incumbency is significant and positively associated with the margin of victory and negatively associated with the number of candidates. Consistent with the literature, incumbents are deterring high-quality challengers and increasing their own vote share. The fact that incumbency is not significant in relation to the total votes cast suggests that incumbency is an advantage irrespective of district size, which also supports existing literature. Incumbency has been found to be an advantage in most districts most of the time (Cox and Morgenstern, Reference Cox and Scott1993). In Model 1, the coefficient for incumbency is two times smaller than that of the Republican coefficient and four times smaller than the coefficient for Majority Minority Districts, suggesting incumbency is an advantage, but contextual factors have a larger effect on competition within the district.
Competition in Majority Minority Districts

*** p<0.01, ** p<0.05, * p<0.1
In Model 1, the number of candidates is significant and negatively associated with the margin of victory. The more challengers, the more competitive the race. The percent Black is not significant and is negatively associated with margin of victory, suggesting the percent Black is positively associated with competition. Alone the results would seem counter-intuitive, but I also find that the coefficients for the percent Black in Models 2 and 3, number of candidates and total votes cast, are significant and negative. These results have two major implications. First, the results suggest that the challengers in MMDs are of lower quality. Second, having significantly fewer votes cast within a district has two consequences: 1) the district with fewer votes cast relative to another is less competitive, and 2) with fewer votes being cast there is a stronger likelihood that the margin of victory will also be smaller. As the percentage of Blacks increases, both the number of votes cast and the margin of victory decrease. As the percent Black increases, there are simply not enough votes being cast to create large margins of victory compared to those seen in majority White Democrat and Republican districts.
Controlling for the upper chamber—senate districts—I find they are negatively associated with margin of victory and the number of candidates and positively associated with total votes cast. My results support existing research that upper chamber districts are less competitive than lower chamber districts—house districts. It takes more political and financial resources to run a campaign in the larger upper chamber districts. In Alabama, the senatorial districts (137,000 voters) are over three times as large as house districts (40,000 voters) (Alabama Legislature). Upper chamber districts are positively associated with total votes cast because the districts consist of significantly more voters. Districts are designed to be as close as possible to a set number, although the actual number of voters within each district does fluctuate. The size of the total population within a district is significant and positively associated with the margin of victory and the number of candidates but the coefficients are exceedingly small. The more people there are in a district, upper or lower, the larger the margin of victory and the more candidates there are running. This suggest that these candidates are of lower quality and are being beaten by large margins. As is consistent with existing literature, the percent of the population that is rural has a significant negative effect on total votes cast.
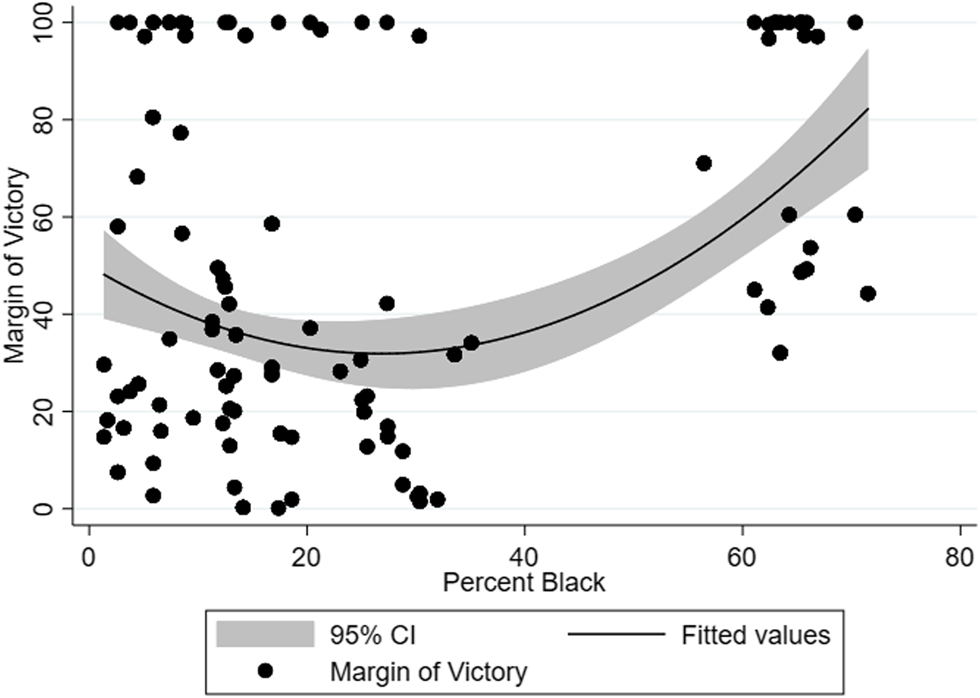
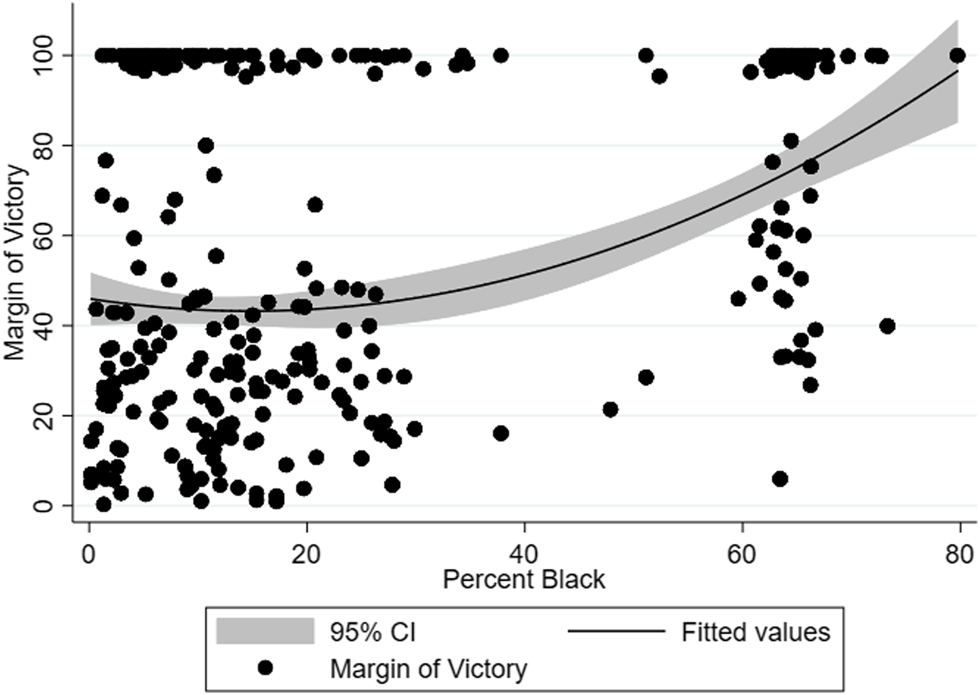
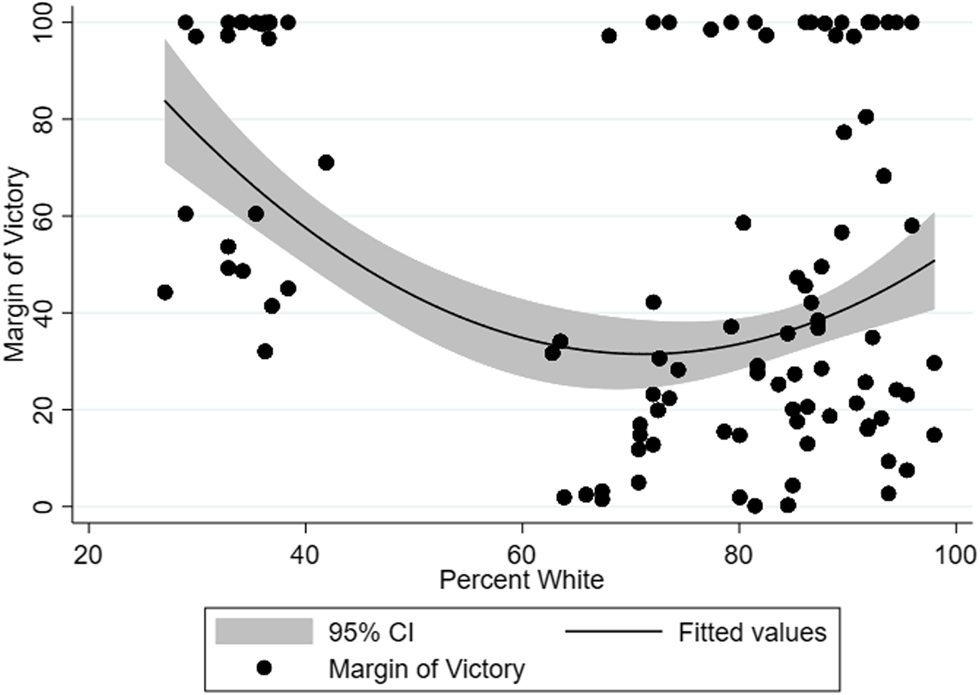
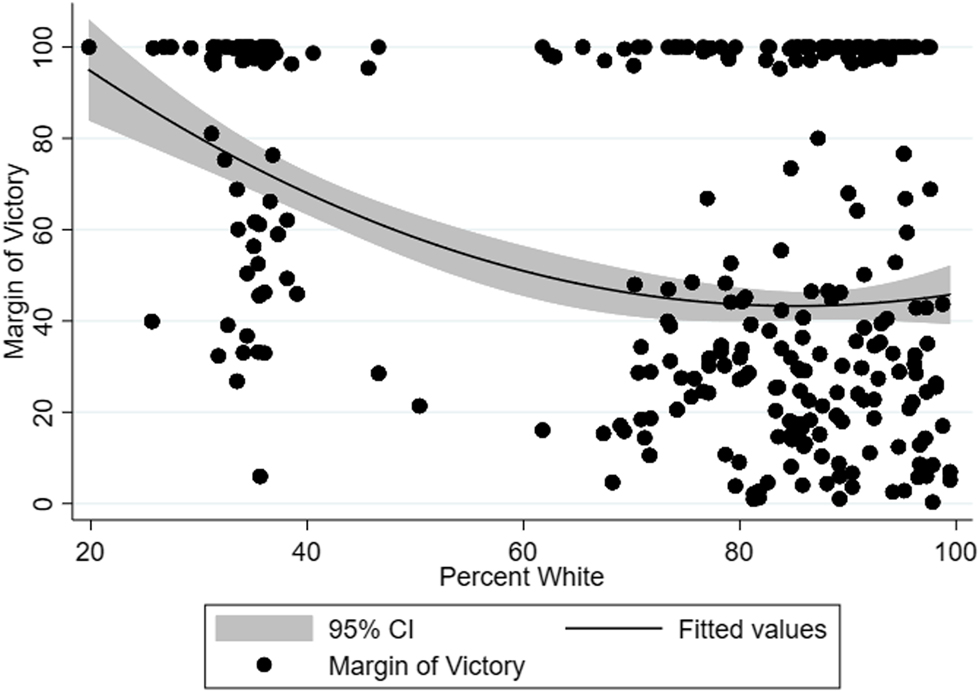
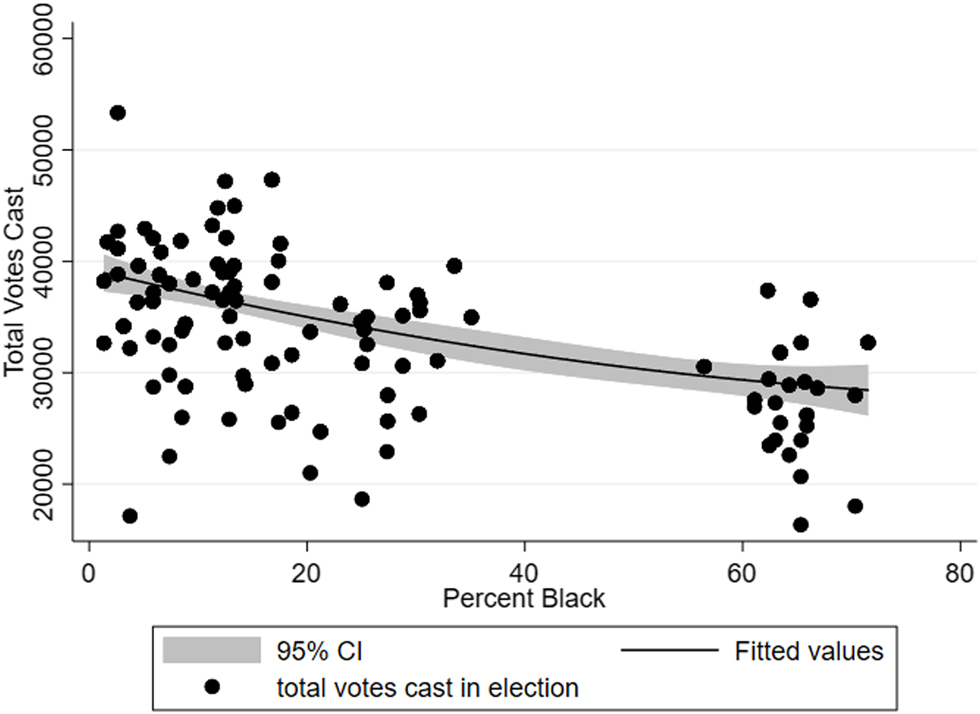
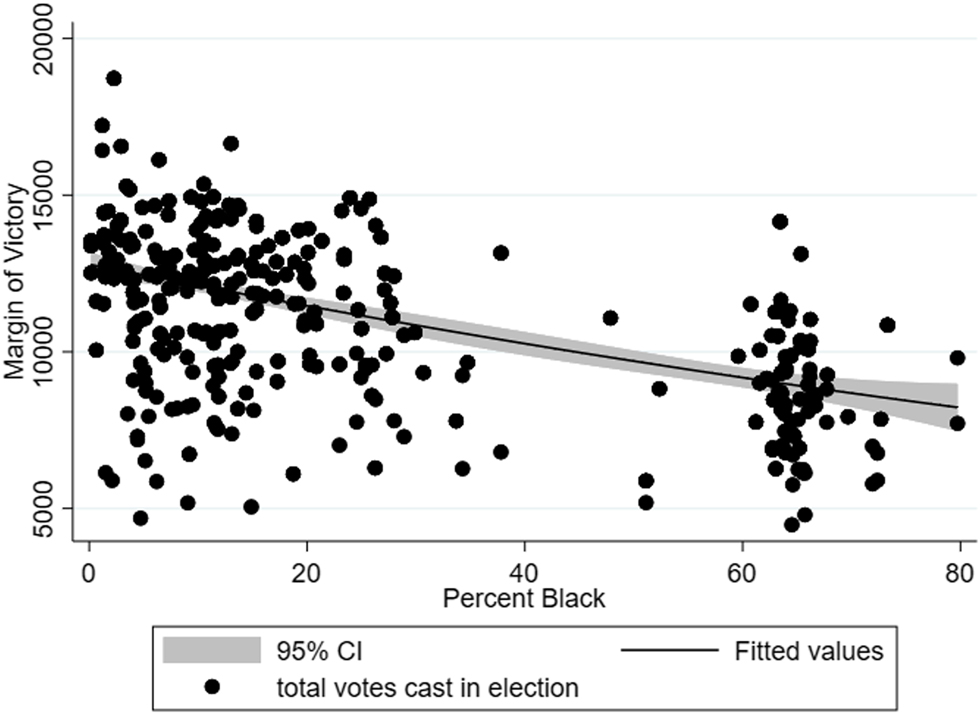
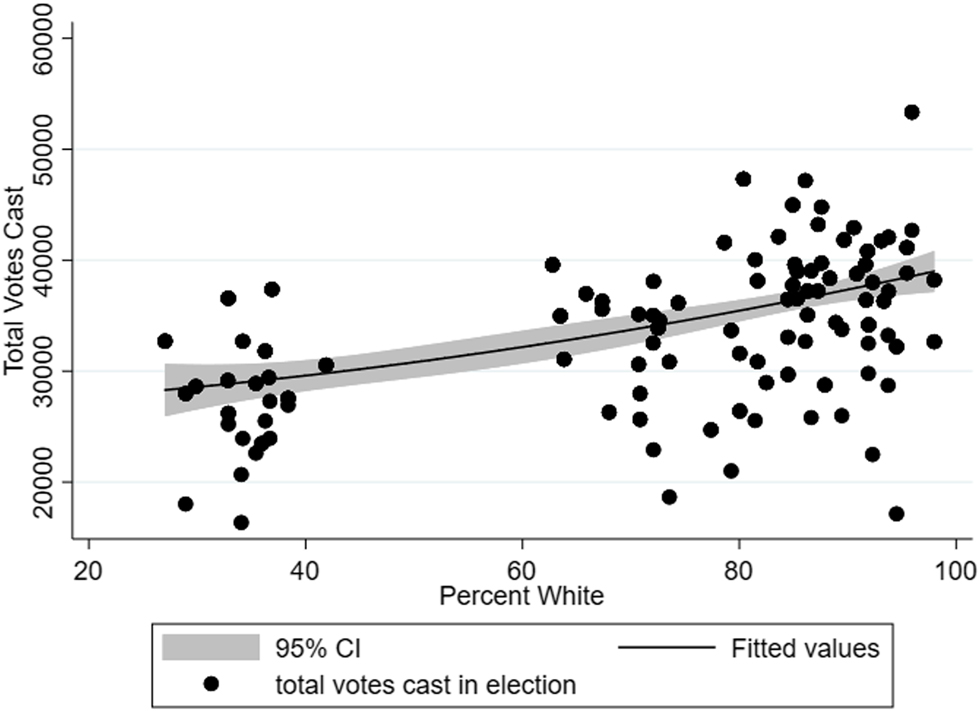
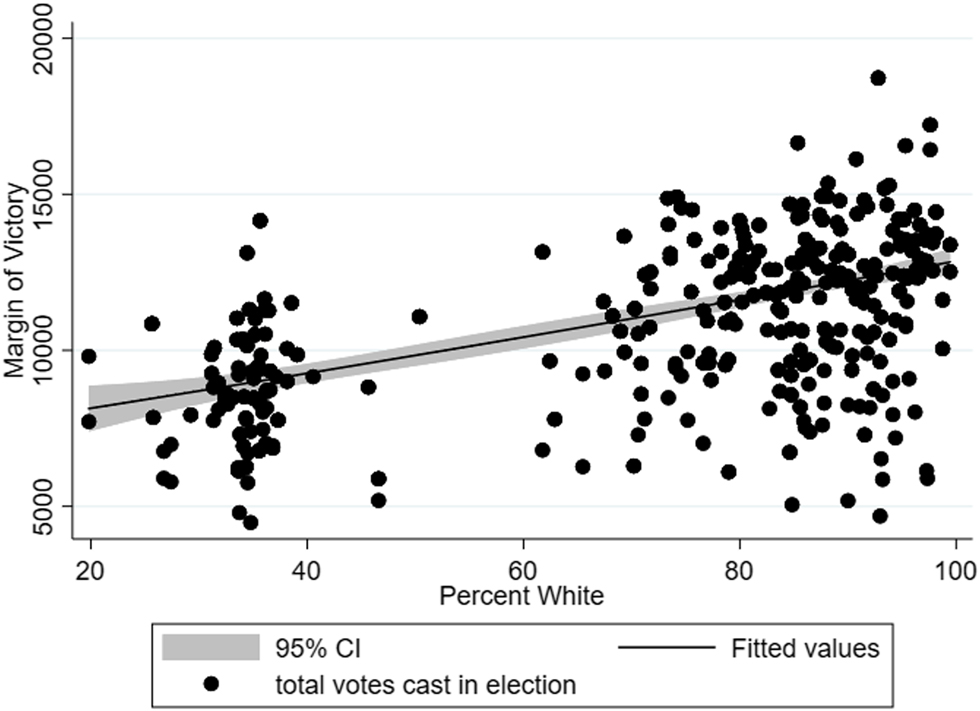
These findings validate the usage of multiple measures of competition to examine district-level inter- and intraparty competition. In Model 1, measuring margin of victory, and the number of candidates and total votes cast are both significant and in their predicted direction. Both measures are inversely related to the margin of victory. Increases in the number of votes cast and candidates running are associated with more competitive races which have smaller margins of victory. Utilizing multiple dependent variables with the understanding that competition measures are correlated with one another aids in the interpretation of the results. To examine the results further, I look specifically at the quadratic fit with confidence intervals for margin of victory and total votes cast across the racial composition of majority minority and majority White districts in Figures 1 through 8.
Margin of Victory in Majority Minority Upper Chamber Districts

Margin of Victory in Majority Minority Lower Chamber Districts

Margin of Victory in Majority White Upper Chamber Districts

Margin of Victory in Majority White Lower Chamber Districts

Total Votes Cast in Majority Minority Upper Chamber Districts

Total Votes Cast in Majority Minority Lower Chamber Districts

Total Votes Cast in Majority White Upper Chamber Districts

Total Votes Cast in Majority White Lower Chamber Districts

The graphs with quadratic fit calculate a prediction for the dependent variable from a linear regression of it on the independent variable and the independent variable squared and plots the resulting curve along with confidence intervals. The confidence intervals are of the predicted mean. Figures 1 and 2 show that as the percent Black goes from zero to roughly forty, competition actually increases. Yet past the 40% Black mark the margin of victory begins to increase rapidly, representing a sharp decline in competition in upper and lower chamber races. In Figures 3 and 4, I find that as the percent of Whites within a district increases, the level of competition also increases, leveling off at roughly the 60% White mark in lower chamber races, and in upper chamber districts, increasing rapidly at roughly the eighty-percent mark. Looking at total votes cast and the percent Black, in Figures 5 and 6, I find similar results. From 0 to 40% Black the number of votes cast remains relatively constant. After the 40% Black mark the number of total votes cast decreases slightly in both upper and lower chambers. Figures 7 and 8 show a positive correlation between the total votes cast and the percent White. As the percent White increases the number of votes cast also increases and becomes relatively stable after the 60% White mark. This nonlinear relationship supports the theory that over-packing Black districts has a negative effect on electoral competition and that there is a percent Black electoral tipping point. As the percent of Blacks within a district increases, so too does the likelihood of electing a Democratic candidate. This has two major implications: 1) Majority Minority Districts are effective in producing descriptive and quite possibly substantive representation, and 2) a medium-sized Black population within a district has an effect of increasing electoral competition. The latter point supports the creation of MMDs and influence districts in which Blacks would have a significant influence on their representation.
In Republican districts, I find a curvilinear fit. Republican districts become more uncompetitive as the White population rises from seventy to 90% White and then become slightly more competitive after the 90% mark. Yet the total votes cast remains relatively constant. This suggests that challengers are entering as the percent White increase but turnout is remaining constant. The graphs for Republican districts are in the appendix.
DISCUSSION
My results support the supply-side theory of racial redistricting. The data shows that redistricting and more specifically racial gerrymandering has a significant sui generis effect on electoral competition within Majority Minority Districts, supporting the literature arguing that Majority Minority Districts are less competitive (Brace et al. Reference Brace, Handley, Niemi and Stanley1995; Cameron et al., Reference Cameron, Epstein and O’Halloran1996; Holbrook and Van Dunk Reference Holbrook and Van Dunk1993; Lublin Reference Lublin1999; Swain Reference Shufeldt and Flavin1993). My findings add to the literature on competition by providing an analysis of intraparty competition between equally partisan Majority Minority Districts and majority White Democrat districts. I find some support for Cameron and colleagues (1996) argument that 47% Black is the optimal level needed to pack a Majority Minority District. My results also seem to lend some credence to Brunell’s (Reference Brunell2010) argument for homogenous districts but not on ideological or competitive grounds. My results show that homogenous White districts are more competitive than racially gerrymandered homogenous Black districts. As the percent White increases the level of competition increases and appears to stabilize after the 60% mark. I find a consistent decrease in competitiveness as the percent Black passes roughly the 40 to 45% mark.
The supply of voters and the design of a legislative district has important implications for democratic representation. Packing Blacks into supermajority Black districts reduces overall competition within these districts, which has serious implications for the quality of their representation and for Black political power as a whole. Theoretically there should be no difference between a 60% White Democrat district and a 60% Black (also Democrat) district. Both are equally as racially homogenous, equally as partisan, and have the same likelihood of electing a descriptive representative. Yet the artificial packing of Blacks into supermajority Black districts has a distinct and unique depressing effect on competition. As aforementioned, this effect works in conjunction with voter ID laws, limits on early voting, registration restrictions, disenfranchisement, and voter roll purges, creating an additional systemic barrier to participatory behavior.
Some possible reasons could be that Majority Minority Districts are not generally geographically consistent. Creating some Majority Minority Districts requires the grouping together of African Americans from non-geographically consistent areas to be able to have enough Blacks to form these majority Black districts. Packing lumps together groups of African Americans with possibly distinct political interests. These varied interests make it easy for incumbents to get entrenched, particularly if what is needed for reelection is only a small dedicated voting base. Secondly, Majority Minority Districts were created to ensure descriptive representation not substantive representation. In Majority Minority Districts that are 60%, 70%, or 80% Black there is no perceived threat to obtaining descriptive representation and therefore an equally decreased sense of urgency to turnout. It could also be a mechanism through which competition is reduced. I argue for the redrawing of over-packed Majority Minority Districts from 60% to 80% Black, to 40% to 45% Black voting age population and the placing of the remaining 30% to 35% of the Black voting age population into another district, thereby creating influence districts. In these districts Blacks may not be the majority but will either: 1) cast or are expected to cast a decisive vote, or 2) cast enough votes or are expected to cast enough votes to constitute at least half of the margin of victory. The Blacks within influence districts alone could not elect a Black representative, but whoever did run for elected office would need Black support. The need for Black electoral support would have the effect of making the districts more competitive, and the representation more responsive to Black interest, thereby increasing Black substantive representation.
CONCLUSION
My results show that the supply of voters within a district does have an effect on turnout and that gerrymandering has serious implications for representative democracy. What my results show is that incumbents in MMDs are benefiting from a significantly larger and unique incumbency advantage compared to White districts. As the percent Black increases, the level of competition decreases. This effect is working in conjunction with other purposeful techniques used by Republicans such as voter ID laws, limits on early voting, registration restrictions, disenfranchisement, and voter roll purges, adding an additional systemic barrier to participatory behavior and formal and substantive representation. I maintain that future research needs to focus directly on the effects of gerrymandering on participation, competition, and representation. I show gerrymandering has major implications for representative democracy in Alabama. In this new era of extreme technologically sophisticated and hyper-partisan gerrymandering, we are witnessing the end of formalistic representation. Constituents are no longer picking their representatives, the representatives are picking their constituents, and stripping African Americans of descriptive and substantive representation to achieve it.