Introduction
How well do corruption perception measures reflect actual levels of public sector corruption? Corruption is a highly relevant problem that has garnered a wealth of recent scholarly attention. Studies have shown that it is related as a major problem for development worldwide, creating economic (Kruegar, 1975; Shleifer and Vishny, Reference Shleifer and Vishny1993; Mauro, Reference Mauro1995) as well as social consequences (Uslaner, 2002; Holmberg et al., Reference Holmberg, Nasiritousi and Rothstein2009). However, a major debate within this topic has become the nature of the corruption data itself – how much can we measure the extent to which corruption persists in a given country, and how can this be best captured? Valid and reliable measures are critical for our understanding of corruption and for assessing possible causes and solutions to this persistent problem.
Corruption data, although proliferating widely in their use across disciplines, have come under intensive scholarly critique (Ardnt and Oman, Reference Arndt and Oman2006; Thomas Reference Thomas2009; Pollitt Reference Pollitt2011). One problem with such data is that it is very difficult to directly observe due to the illegal and clandestine nature of the activity itself; thus, perceptions are often employed as a substitute for a ‘hard measure’ such as conviction rates. The issue of the use of perceptions (most often expert assessments) has been a core critique against leading measures such as Transparency International’s Corruption Perceptions Index (CPI) and World Bank’s World Governance Index (WGI).Footnote 1 For example, several scholars have claimed that such perceptions do not necessarily reflect ‘actual’ corruption experienced by residents of the particular country in question (Donchev and Ujhelyi, Reference Donchev and Ujhelyi2009; Ko and Samajdar, 2010). Moreover, some empirical studies have in fact tested this distinction in single countries (Olken, Reference Olken2009; Morris and Klesner, Reference Morris and Klesner2010; Rose and Mishler, Reference Rose and Mishler2010) or among several countries in a particular geographic region such as Latin America (Seligson, Reference Seligson2006) or Sub-Saharan Africa (Razafindrakoto and Roubaud, Reference Razafindrakoto and Roubaud2010), and have found weak-to-no statistical relationship between the two. Such little consistency between expert perceptions and actual citizen experience offers a pessimistic view of the existing mainstream corruption measures.
These findings clearly put into question the validity of perception measures in capturing actual levels of country-wide corruption and lead to several critical questions – do corruption perception measures capture corruption, or something else? If such measures are biased in a systematic way, are cross-country comparisons rendered meaningless? This study addresses this salient debate in two ways. First, although much attention has gone to the developing parts of the world, recent studies have shown that corruption is also a problem present in more developed areas such as Europe (Charron et al., Reference Charron, Dijkstra and Lapuente2014a). Thus, the extent to which corruption perceptions match the corruption experience of actual citizens in an under-investigated area in corruption studies – Europe – using novel data collected by the author, is investigated. In addition, the extent to which potential outside socio-economic factors might sway citizen perceptions away from actual levels of experience is explored. Second, the study tests the empirical relationship and relative rankings between citizen and expert assessments of corruption. Novel data that were used to capture citizen perceptions and experiences with corruption are presented – free for scholarly use – based on one of the largest surveys to date on corruption and governance. Undertaken in 2013, the survey employed here contains 24 European countries, and inquires about experiences and perceptions of corruption (among other things) with several public services.Footnote 2
In doing so, this study makes several contributions to the literature. First, as testing the relationship between experiences and perceptions has largely been done in single-case countries or in less economically developed regions of the world, this study is, therefore, the first to elucidate this relationship in an oftentimes considered ‘low-corrupt’ region of the world, Europe, presenting novel, citizen-based data from a survey of roughly 85,000 respondents. Further, of all current cross-national measures, Europe offers the widest variation in corruption of any continent (Kaufman et al., 2010), making it an excellent test case. In addition, as one of the most transparent and highly democratic areas of the world, if the relationship between perceptions and experiences is insufficiently strong in this region, then the validity of corruption perception measures would be severely weakened. However, it is important to note that finding consistency between perceptions and experience with corruption in Europe would not rebuke previous findings of a weak relationship in more developing areas.Footnote 3 The second contribution is that the relationship between corruption perceptions and experiences is tested here at two levels: country and sub-national/regional level. Although there have been previous empirical studies looking at the first level mentioned above, the second – regions within countries – has been largely overlooked, particularly in a multi-country analysis, largely due to data limitations. It is argued here that, when regional perceptions and experiences vary significantly within countries as they have been shown to do (Seligson, Reference Seligson2006; Gingrich, Reference Gingerich2013; Charron et al., Reference Charron, Dijkstra and Lapuente2014a), examining the relationship at the sub-national level may in fact be the most appropriate test, giving stronger causal inferences if relationships are consistent with national-level comparisons (Snyder, Reference Snyder2001). In sum, this study compares the corruption perceptions of respondents who have direct experience with those who do not have this experience in two mutually exclusive samples, and tests are conducted with original data from 2010 and 2013.
Third, although often questioned, several tests are presented here comparing citizens and expert assessments of corruption in Europe at the national level. A key claim by several critics is that expert/outside perception measures are biased in a systematic way, most likely toward a less regulatory state rather than a low-corrupt, quality public administration (Kurtz and Schrank, Reference Kurtz and Schrank2007). Thus, a wide gap in the experiences and perceptions of citizens vs. the experts would lend support to the claims by critics that outside experts and firm risk-assessment groups have a skewed view of governance and corruption relative to the ‘actual’ state of the public administration. Although strong consistency between expert perceptions and citizen perceptions and experiences would render such concerns less plausible, in a sense, Europe offers the toughest test for the critics of perception measures.
The findings of this study are as follows. First, at the regional/sub-national level and country level, strong evidence is found that the perceptions of citizens, with and without experience, produce strikingly similar rankings of regions and countries throughout the European sample. The study also tests whether outside factors are related to the residuals from bivariate regressions between perceptions of the corruption-experience and non-experience samples, such as gross domestic product (GDP) per capita, income inequality, unemployment, political and ethnic fractionalization and geographical factors, using both modes with country fixed effects and hierarchical specification. Little evidence is found that the corruption perceptions of citizens without direct experience with petty corruption are skewed toward outside factors relative to the perceptions of citizens with personal experience of corruption.
Finally, citizen-based measures are compared with three widely used sources of corruption – the CPI, the ‘control of corruption’ from the World Governance Indicators (Kaufman et al., 2010) and the International Country Risk Guide’s (ICRG) corruption measure. This study finds that the three largely expert-based perception measures correlate highly with the two citizen-based measures used here in both bivariate and multivariate analyses, and produce strikingly similar country rankings. These findings contrast with several recent studies that show a weak/non-relationship between citizen and expert perceptions. At least for European countries, citizens and experts tend to be in agreement on the issue of corruption, and these perceptions are highly consistent with actual levels of reported corruption, which it is argued is critical for the legitimacy and validity of the expert measures. It is also found that taking into account outside factors, such as economic performance, the size of government or partisanship, which critics warn drive expert perceptions, does not sway the strong statistical consistency among perceptions of citizens and experts.
This study is organized as follows. First, previous literature that critiques perception corruption data and, in particular, those recent studies that take up the disparity between experience and perception measures are presented. Second, the key concepts in question are defined and the data used to operationalize the said concepts as well as the methods and sample employed in the study are presented. Third, a simple bivariate analysis for the regional to national level is given, and then checked to see whether perceptions are biased by outside factors. Next, the citizen-based data are compared with the three measures of corruption named above at the national level. A summary and discussion of future research concludes the study.
Relevant literature
While the cross-country empirical literature on corruption studies has grown sizably in recent years, so have critiques of the data employed. In general, most critics charge that the widely used sources of dataFootnote 4 have significant problems and should generally avoid being used by scholars. For example, Pollitt (Reference Pollitt2011) argues that governance indicators such as the CoC are overly complex and are too often imprecisely interpreted. He critiques such data as being overly reliant on perceptions and suggests that the field employ a ‘hard measure’ of performance. Others find that the definition of corruption on which the data are based is either too vague or too biased toward a Western understanding of the concept (Thomas, Reference Thomas2009). Further, some scholars have critiqued the data for their methodology, in particular, comparing countries that have different underlying sources of expert, non-governmental organization (NGO) and citizen perceptions.Footnote 5 Other critiques argue that the measures of corruption currently do not allow accurate comparisons of countries over time and that methods such as yearly standardization render states to be ‘stuck’ in roughly the same position from year to year (Andersson and Heywood, Reference Andersson and Heywood2009). Finally, and most relevant to this study, there is a wide and consistent critique among scholars that there is an underlying problem in using perceptions data to capture corruption across countries.
There are several related strands of critique involved with the idea that perceptions data are problematic. First, it is argued that these measures are systematically biased toward corporate interests. In a debate with Kaufmann et al. (Reference Kaufmann, Kraay and Mastruzzi2007), the authors of the WGI data (Kurtz and Schrank (Reference Kurtz and Schrank2007) argued that measures such as risk-assessment data, which are built mostly on perceptions of experts, were in fact by nature biased toward commercial interests, and thus countries with more ‘red tape’ and/or higher taxes would be judged as having inferior governance and higher corruption.
Second, some argue that the perceptions of citizens and experts are inconsistent. Moreover, it is claimed that too often experts are based outside the country that they are assessing, and it is such expert data that are most often used by scholars in contemporary studies. For example, Razafindrakoto and Roubaud (Reference Razafindrakoto and Roubaud2010) compared the perceptions of experts to reported bribery among average citizens in eight sub-Saharan African countries and found that outside experts consistently overestimated actual corruption levels and that their opinions were ideologically biased. Moreover, they found that in the least developed countries (and/or those with highest reported corruption) the highest degree of measurement error in expert perception relative to experience corruption was apparent
On a related third point, perceptions do not accurately reflect the actual level of corruption, and are thus driven by other factors such as individual characteristics or macro-economic conditions. Several scholars have recently tested this notion between corruption perceptions and ‘actual’ corruption experienced with a more objective measure, usually operationalized as petty corruption among citizens or reported bribes that firms pay to do business. In a cross-country survey of variations in perceptions and experience measures, Seligson (Reference Seligson2006: 391) shows that among six Latin American countries aggregated level individual perceptions and actual ‘victimization’ were only very weakly correlated. His study concludes that perceptions data may be misleading and driven by noise or bias. Moreover, he argues that experiences can vary significantly from region to region within countries, which is also supported by Gingerich (Reference Gingerich2013). In a study comparing individuals within villages in Indonesia, Olken (Reference Olken2009) found that perceptions of corruption were only weakly correlated with observed corruption in infrastructure projects. Rose and Mishler (Reference Rose and Mishler2010) found that individual experiences do not explain the high perceptions of public sector corruption among ordinary citizen in Russia. Morris and Klesner (Reference Morris and Klesner2010) examined experiences vs. perceptions in Mexico, and found that measures of actual experience are negligible in explaining variations in perceptions when accounting for levels of social trust. Even when comparing experiences of bribery across different types of firms, studies have shown discrepancies in estimating corruption costs (Clarke, Reference Clarke2011). On the other hand, Boylan and Long (2003) found a robust relationship when looking at the relationship between corruption perceptions of political reporters and corruption prosecutions in the US states.
The scholarship cited here highlights two potential problems in contemporary corruption data. First, whether perceptions and experiences are in fact correlated, or whether the former is driven largely by outside factors – either ‘noise’ or systematic bias (Melgar et al., 2010; Kurtz and Schrank, Reference Kurtz and Schrank2007). This leads to the following question: are perceptions measures based on survey data picking up ‘actual’ corruption, or something else, and, if so, are they too ‘noisy’ to be used as valid cross-national/regional metrics? Second, are expert and citizen assessments of corruption consistent across countries? As expert perceptions are often used as a proxy for corruption in a given country, it therefore punctures the validity of popular measures when studies show that citizens and experts are in disagreement, or that perceptions do not in fact follow experiences (or both). These two primary critiques mentioned above are used here to address the European case in the subsequent sections.
Working definition of corruption
The key concept in question is corruption – both perceptions and experience. For this study, a commonly used definition is used from the literature of public sector corruption, which emphasizes ‘the misuse of public office for private gain’ (Rose-Ackerman, Reference Rose-Ackerman1999; Treisman, 2000), or as put by Shleifer and Vishny (Reference Shleifer and Vishny1993: 2) ‘the sale by government officials of government property for personal gain’. With respect to ‘actual corruption’, many past studies have pointed out that this phenomenon can take many different forms – from high-level state capture to low-level so-called ‘petty corruption’ in various public sector services (Lambsdorff, Reference Lambsdorff2007; Heidenheimer et al., Reference Heidenheimer, Johnston and LeVine1989). It can also vary from service to service, with certain public services within countries being more corrupt than others (Tanzi, 1998; Gingerich, Reference Gingerich2013). The measure of experience used here is the extent to which average citizens use bribery in dealing with or obtaining public services. Thus, the definition of ‘experience’ within corruption admittedly has its limits, and does not cover the so-called ‘high-level’ corruption among elites, state contracts or behind the scenes political corruption among party members. However, although it is acknowledged that both the general concept of corruption and expert assessments of it are broader than the bureaucratic corruption captured here, it is argued that, despite these drawbacks, the measure used in this study is far from irrelevant in that it focuses on how experience with corruption affects average citizens in their daily lives.
With respect to perceptions, to be as consistent with the empirical measures as possible, the study focuses on the extent to which average citizens (as opposed to outside country experts, firms or NGO’s) believe that corruption takes place in their daily public services.
Research design and empirical tests
Several different designs have been put forth in testing the relationship between perceptions and experiences. Some have elected to compare perceptions with some measure of ‘actual’ corruption in some sector (Olken, Reference Olken2009), whereas others have aggregated individual experiences and corruption perceptions of citizens and compared them cross-nationally (Siegelson, Reference Seligson2006).
This study is observational and offers a similar design to previous studies; yet, due to newly available data, it is possible to carry out several novel tests. Three primary empirical investigations regarding country and regional rankings in corruption perceptions are conducted. First, there is a comparison of country and/or sub-national regional rankings in perceptions between people who have direct experience with corruption and those who do not. The key point here is that mainstream measures of corruption used to compare countries across space and time are mainly based on subjectivity, which implies that the rank order of observations in the sample (and the relative distance between observations) is more salient than any ‘actual levels’ according to the scale of the data, which is the primary concern in this study. Using two large and recent surveys that inquire about public sector institutional quality and corruption in Europe, these two mutually exclusive groups are created from the survey data, and a comparison of their aggregated corruption perceptions by country and region is made. These comparison of the two mutually exclusive groups are at two aggregated levels using simple statistical analysis and at regional and country levels – the former of which offers a unique contribution and strengthens (or calls into question) any inferences that are made when using national-level comparisons.
Second, an attempt is made to investigate the extent to which corruption perceptions of citizens without direct corruption experience (the majority of the sample) are driven by other structural factors such as a country or a region’s level of development, economic inequality, unemployment %, population density, etc., as many of the critics often claim. To test this, the bivariate ordinary least square regressions of corruption perceptions between the experience and non-experience samples are taken and the residuals are saved. A host of outside factors are then regressed on the residuals to see whether they are statistically related to any differences in perceptions between the experience and non-experience samples by country or region.
Third, the study investigates the extent to which citizen perceptions and experiences match the assessments of expert measures. In this section, the citizen measures are compared with three leading measures of corruption perceptions, comparing country-level rankings and examining the statistical relationship between the citizen and expert measures with a parsimonious regression analysis, controlling for economic performance, size of government, trends in government partisanship and population.
Data and sample
The data on experiences and perceptions with corruption are taken from the largest, multi-country survey specifically focusing on matters of governance and corruption, collected and conducted by the author of this study for 2 years – 2010 and 2013. The questions are aimed at the consumers of everyday public services – randomly selected European residents – to which over 400 respondents per NUTS 1 or 2 regions (Nomenclature of territorial units for statistics) have responded.Footnote 6 With a total sample of over 85,000 respondents, in 212 regions within 24 countries, it is currently the largest multi-country governance survey aimed at capturing both national and sub-national/regional variation and its correlates, which provides an appropriate source to test three different levels of analysis. Questions focus not only on perceptions but also on the experiences of citizens with several specific services and their level of satisfaction, as well as on individual assessments of quality of public services, media, elections, social trust and the perceived and experienced meritocracy of the public and private sector. A similar survey conducted in 2010 contained 34,000 respondents in 18 countries, or about 200 per NUTS region.Footnote 7 As far as the data used here are concerned, the two surveys have identical questions taken for the analysis. A more in depth discussion of the survey, its methodology, percentage of respondents by landline and home phone, as well as response/refusal rate by country can be found in Appendix 3.
Several questions are of interest in this study. First, in capturing experience with corruption, this study follows the standard in the literature by operationalizing ‘self-reported experience’ with corruption.Footnote 8 The following questions were used:
In the past 12 months have you or anyone living in your household paid a bribe in any form to:
-
a. Education services? (1 yes/0 no)
-
b. Health or medical services? (1 yes/0 no)
-
c. Police? (1 yes/0 no)
-
d. Any other government-run agency? (1 yes/0 no)
The sample is divided into two mutually exclusive categories – the first are the individual respondents who said ‘yes’ to any of the four questions as ‘1’ for the measure ‘experience’, and the second answered ‘no’ to all four. For regional- and national-level comparisons, these individual-level responses are aggregated to each level, generating a percentage measure of the occurrence of petty corruption, both by the given individual sectors listed above as well as by the combined whole.Footnote 9 The countries and regions with the sample size for each category are found in the Appendix.
With respect to corruption perceptions in the public sector, the following four questionsFootnote 10 are taken and aggregated (equal weighting) into a single indexFootnote 11 : The result is a perceptions index from 0 to 10, with higher scores indicating greater perceived corruption.
‘Corruption is prevalent in my area’s local public school system’ (0 ‘strongly disagree’ − 10 ‘strongly agree’)
‘Corruption is prevalent in the public health care system in my area’ (0 ‘strongly disagree’ − 10 ‘strongly agree’)
‘Corruption is prevalent in the police force in my area’ (0 ‘strongly disagree’ − 10 ‘strongly agree’)
‘In your opinion, how often do you think other people in your area use bribery to obtain other special advantages that they are not entitled to?’ (0 never − 10 Very frequently)
Empirical analysis: bivariate regional and country comparisons
Based on the structure of most contemporary corruption data, it is argued that the following question is possibly most salient – do aggregated citizens’ perceptions produce similar corruption rankings when comparing those with, and without, corruption experience?
The analysis begins by showing the basic bivariate relationship between the perceptions of the two mutually exclusive aggregated samples of individuals – those with and without personal experience with corruption for the countries used in the sample. It is important to note that when aggregating the responses for ‘experience’ that these vary significantly from region to region and country to country, and respondents with corruption experiences in low-corrupt regions and countries receive a great deal of weight in the regressions. Therefore, sampling weights were used in the regression to give greater weight to regions with greater observations in the ‘experience’ sample in order to avoid giving equal weight of the aggregated perceptions to only a handful of individuals vs. several hundred.Footnote 12 It is acknowledged that this gives greater weight to more corrupt regions or countries (as they have a greater number of observations). However, it is argued that this presents an even more difficult test for the validity of the data, as previous studies have shown that the relationship between perceptions of and experiences with corruption become weaker as a function of the level of corruption in a country (Razafindrakoto and Roubaud, Reference Razafindrakoto and Roubaud2010). If the relationship falls apart when reducing the impact of the lowest corrupt countries, then the validity of perception-based measures becomes highly questionable.
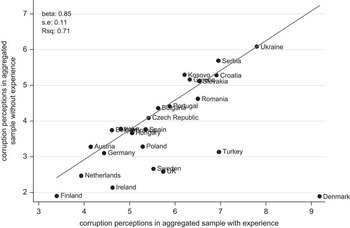
The analysis finds that when aggregating the data to the country level, several observations are worth noting. First, not surprisingly, on average, those with direct corruption experience tend to perceive corruption higher in absolute terms than those without direct experience. Bivariate regression shows that the intercept is 2.65 (if their perceptions were perfectly equal, it would be ‘0’, with a slope of ‘1’), and that a one unit increase in perceptions from the experience group results in a 0.85 increase in perceptions from the without-experience group. Therefore, it can be seen that the perceptions of the ‘with experience’ group perceive higher corruption on average than the group without direct experience. This should suggest to scholars interested in using or building citizen-based perceptions measures that weighting for those with experience might be appropriate to account for this discrepancy.
Second, when comparing the corruption perceptions of the respondents with and without direct experience in corruption, the groups produce a rank order of countries that is strikingly similar, and the perceptions of those with experience explains 71% of the country-level variation of the perceptions of those without experience. For example, despite having recent experience with public sector corruption, the respondents in Finland, the Netherlands, Ireland, Germany, and Austria still collectively ranked their countries as relatively ‘clean’; more or less the same extent to which people without direct experience would rank them within the sample. Further, even those without direct experience in Ukraine, Serbia, Greece, Croatia, Slovakia, and Kosovo, on the other end of the rank order, collectively ranked their public sectors as relatively more corrupt. However, two countries stand out – Denmark and Turkey. The former is ranked as the cleanest among those without direct experience and the most corrupt among those with experience. We assume that in the case of Denmark this is because Denmark has less than a handful of experienced cases, and these three cases out of 2025 respondents are most likely outliers and should be treated with much caution. The case of Turkey lends credence to the null hypothesis that the gap is sizeable in perceptions between those who have experienced corruption and those who have not, with the difference between the ‘experience’ sample ranking and the non-experience sample ranking being nine places. One explanation for this inconsistency could be that it is ranked lowest in terms of press freedomFootnote 13 in the sample, and thus those without direct experience might be clouded from inaccurate press reports. This issue will be taken up in the discussion section.
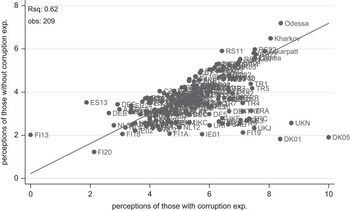
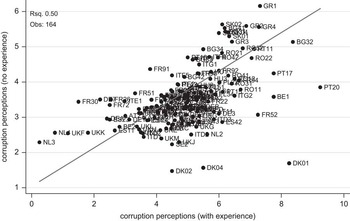
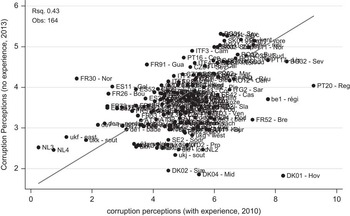
Turing to the regional level, the analysis finds quite strong evidence that the perceptions of citizens by region is not random when comparing these two samples – in both years there is a strong and positive bivariate correlation between the two samples with respect to perceptions. In Figure 2, it can be seen that the perceptions of the experience sample explain 62% of the perceptions of the non-experience sample (P<0.0000). The few noticeable outliers from Denmark, United Kingdom and Finland have less than five observations in the experience sample, and are thus weighted relatively less. In Figure 2, for the 2010 sample, a slightly weaker relationship than in Figure 1 can be observed, yet the correlation is highly significant (P<0.0000), explaining roughly one-half of the variation in perceptions among the non-experience sample. Moreover, Figure 4 shows that ~43% of the regional variation in perceptions of those with no experience in 2013 is explained by perceptions of those with corruption experience from 2010. A noticeable feature among the four figures is that the largest divergence in perceptions is most often observed in low-corrupt regions.
Potential biasing factors of citizen perceptions: comparing outside factors’ relationship with the bivariate residuals
Next a check was carried out to see whether any outside additional factor(s) influenced the perceptions of those without direct experience, when accounting for the level of direct experience – for example, how susceptible the perceptions are to outside ‘noise’. Here, it is investigated, for example, whether poorer regions with relatively high unemployment are ‘punished’ in that citizens might ‘over-perceive’ corruption relative to the region’s actual level of experienced corruption. For this section, a parsimonious test was undertaken. Based on a wealth of literature, it would of course be expected that corruption measures would be statistically correlated with economic factors such as GDP, levels of human capital, etc. Therefore, the analysis begins by taking the residuals instead from the bivariate regressions shown in Figures 1–4.Footnote 14 A test was then carried out to see whether any outside factors, such as economic, social or geographic conditions, influence the residuals in one way or another, which would indicate cases of structural bias. If perceptions of citizens without personal experience are swayed by certain structural factors, a significant relationship would be expected with the residuals from the bivariate regression and said factors, thus placing further doubt that perceptions measures based on citizen assessments are in fact capturing actual corruption levels (and not other factors). At the country level, several factors are investigated that could potentially bias corruption perceptions, creating a larger gap in perceptions between those with and without corruption experience.Footnote 15
Perceptions of corruption in European countries.

Perceptions of corruptions in European regions. Note: regression line calculated with regional weights for the number of individual observations per region with experience.

Corruption perceptions in European regions: 2010

Corruption perceptions in European regions.

Although certainly not an exhaustive list, the following factors at the country levelFootnote 16 are examined:
-
1. Structural economic factors: purchasing power parity (PPP) per capita (log), unemployment % (2010–2012 average), economic inequality (Gini Index), gender inequality (pay gap).
-
2. Political factors: democracy (political rights, Freedom House), press freedom, alternative corruption measure (CPI).
-
3. Demographic factors: population density (log), ethno-linguistic fractionalization, life expectancy.
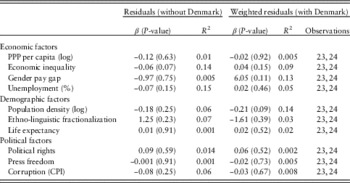
Looking at the results from Table 1, very little evidence is found that any of the outside factors, which had been tested for, impact the residuals from the bivariate regression shown in Figure 1. In the analysis that excludes Denmark (due to so few observations in the ‘experience’ sample), none of the factors have a significant relationship with the residuals, with the closest being the Gini index of income inequality (P<0.07). Surprisingly, factors such as economic development, press freedom, gender pay inequality and democracy or population density have no relationship with the residuals from Figure 1. When including Denmark and comparing the weighted residuals, the impact of income inequality is found to be less significantly related to the residuals.
Relationship of outside factors with residuals from bivariate estimates (from OLS regression of perceptions between sample with and without corruption experience)

OLS=ordinary least square; PPP=purchasing power parity; CPI=Corruption Perceptions Index.
A summary of all variables and source is found in the appendix. Data from the 2013 survey. Residuals from Figure 1, predicting the level of corruption perceptions of those without experience with the perceptions of those with experience.
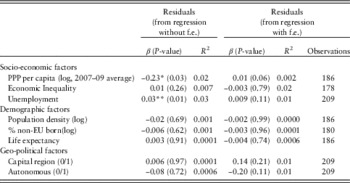
In Table 2, the relationship between the residuals from the regression results in Figure 2 and several outside structural factors is shown. Although certainly not an exhaustive list, the following factors at the regional level are examined:
-
1. Structural economic factors: PPP per capita (log), unemployment % (2010–2012 average), economic inequality (% poverty risk).
-
2. Geographic factors: capital region (0/1), autonomous region (0/1).
-
3. Demographic factors: population density (log), % of non-EU born population, life expectancy.
Correlations with residuals from bivariate estimates (perceptions with and without corruption experience)

f.e.=fixed effects; PPP=purchasing power parity.
A summary of all variables and source is found in the appendix. Data from the 2013 survey. Residuals from Figure 2, predicting the level of corruption perceptions of those without experience with the perceptions of those with experience.
**P<0.01, *P<0.05.
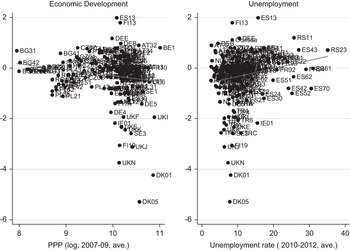
The findings reveal that at the regional level (in particular when looking at the residuals from the fixed effects models) none of the factors significantly correlate with the residuals at the 95% threshold. Thus, none of the factors tested here point to citizens either ‘over perceiving’ or ‘under perceiving’ corruption among regions within countries. When considering the standardized residuals without country fixed effects, two factors have a significant relationship with the residuals below the threshold of 0.05 – economic development (PPP) and economic inequality. In Figure 5, the relationships are shown visually – a positive (negative) residual implies that the sample with experience perceives less (more) corruption than the model predicted from Figure 2. For PPP, it can be seen that there is a slight negative correlation with the residuals, meaning that there are several regions in which the non-experience sample tended to ‘under perceive’ corruption relative to the sample with direct experience. These regions, found in the United Kingdom, Denmark, and Finland, tend on average to be very ‘clean’ of corruption. However, all the regions below the mean of PPP for the sample are roughly within one standard deviation of the residuals. It is also observed that there is a slight positive effect at the higher values of unemployment, whereby these regions are associated with a slight ‘over perception’ of corruption relative to the perceptions of those in regions with direct experience. Again, this is mainly driven by a handful of regions that score (relatively) low on unemployment, who have a relatively large gap in corruption perceptions between those with and without corruption experience.
Scatterplots of PPP and unemployment with residuals (from non-fixed effects model).

Although the evidence in this section points to the fact that country and regional rankings based on citizen perceptions are highly consistent with corruption experience – and, moreover, mostly devoid of outside noise – some of the findings here highlight the importance of controlling for such factors in cross-country/regional statistical models.
How closely do citizen perceptions and experience with corruption match expert corruption data for European countries?
In the final section of this empirical analysis, the aggregated measure of citizen perceptions and experience data for the 24 European countries is taken and compared with three of the most popular measures in the field of comparative corruption research – the WGI, CPI, and ICRGFootnote 17 measures. The first two are composite indicators, whereas the third measure is an expert assessment of risk for international business. The most recent years are taken for all three measures.
Following the previous literature, two relatively parsimonious tests were performed here. One, do citizens and experts produce similar rankings with respect to country level corruption? Although scales that measures use are different, it would nonetheless be expected that if citizen and expert assessments are closely related, then the relative rankings that their respective measures produce would be similar. Second, do variations of citizen assessments significantly correlate with variations of expert assessments, controlling for factors that critics suggest might bias expert opinions? To address the second question, each country’s economic performance (recent and long-term growth rates and current PPP per capita), the size of government, recent government partisanship and country size (population) were accounted for.
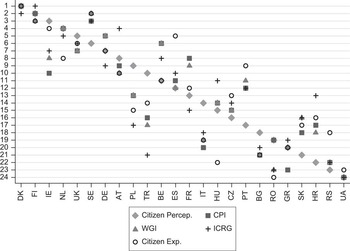
Figure 6 shows a plot distribution of the five measures – the two citizen measures (perceptions and experiences) and the three standard expert-driven measures. Countries are ranked on the x-axis by the citizen perceptions measure, against which all other measures are compared. Rankings (1–24) are placed on the y-axis. Our results show that the rankings are strikingly similar in the majority of cases – most of the rankings produced by expert assessments are within roughly five places of the rankings produced by citizen perceptions. For example, Denmark and Finland are in the top two to three places for all measures, whereas the United Kingdom ranks between 5th and 7th. Germany ranks 7th according to citizen perceptions and citizen experiences, 5th according to WGI and CPI and 9th in the ICRG measure. Ukraine and Serbia are in the bottom two to three places for all measures (except citizen experiences in Serbia, for which it is ranked 18th). There are, however, some discrepancies between experts and citizens. In Turkey, Poland, Italy and Ireland, the citizens perceive corruption to be less pervasive than do the expert assessments. In relation to expert rankings (and even direct citizen experience measures), citizens tend to ‘over-perceive’ corruption in Croatia, Portugal and, to some extent, in Belgium. The largest difference is between citizen perceptions and ICRG in the case of Turkey – in the former, Turkey is ranked 10th, in the latter, it is ranked 21st. A full table with each country’s rank by measure can be found in Appendix 4.
Rankings of 24 European countries for five measure of corruption. Note: CPI=Corruption Perceptions Index; WGI=World Governance Index; ICRG=International Country Risk Guide.

The second part of this analysis tests the extent to which the various measures correlate, their relationship as seen in Figure 6 is possibly spurious, and both citizens and experts are simply ranked according to recent economic performance (Chong and Calderon, Reference Chong and Calderon2000; Seligson, Reference Seligson2006), or some other latent factor. If the critics are correct and perceptions of experts are mainly driven by factors other than corruption, insignificant relationships would be observed (or noticeably weakened relationships) between the citizen and expert measures when accounting for factors such as economic performance, size of government or measures of government partisanship. If strong correlations are observed between experts’ and citizens perceptions, despite accounting for these factors, then some counter-evidence of claims of bias are provided.
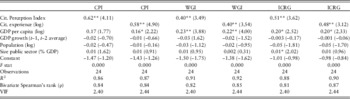
Table 3 shows each of the three (largely) expert measures as a function of citizen corruption measures, and builds on the baseline model from Kurtz and Schrank (Reference Kurtz and Schrank2007), whereby GDP per capita (logged), economic growth (GDP lagged change) and population (logged)Footnote 18 are included. In addition, the analysis also attempts to parsimoniously capture other common critiques that expert perception measures are biased toward ‘state interventionism’ (see overview from Hopkin and Rodriguez‐Pose, Reference Hopkin and Rodriguez‐Pose2007) with the size of the public sector (total government consumption, % GDP, from World Development Indicators).Footnote 19 The results show that even when controlling for these factors, citizen perceptions significantly explain a significant proportion of the variation in all three leading corruption measures, with the P-value being <0.01 in all cases. Moreover, it is shown that when accounting for citizen perceptions and experiences, factors such as recent GDP growth, population, size of the government or partisanship play mostly a negligible role in explaining expert perceptions of corruption. The models have a high degree of explanatory power – in all cases the three confounders account for 86–92% of the variation in each of the expert corruption measures. In addition to the regression results, the bivariate Spearman’s rank coefficient (ρ) between the citizen and expert measures is highlighted, which is 0.81 or greater in all cases.
Relationship between citizen and expert assessments of corruption: OLS regression results

OLS=ordinary least square; CPI=Corruption Perceptions Index; WGI=World Governance Index; ICRG=International Country Risk Guide; VIF=variation inflation factor.
T-scores in parentheses from robust standard errors. All corruption variables have been normalized so that they range from 0 to 1, with higher values indicating less corruption for purposes of comparison.
**P<0.01, *P<0.05.
The results, therefore, demonstrate that citizen and expert assessments of country-wide corruption are highly related, despite accounting for several factors that critics claim might drive expert perceptions. That experts’ and citizens’ assessment of corruption correspond, thus, offers some counter-evidence to the recent literature. However, based on the underlying nature of the measures, it would not be expected to be a ‘perfect’ relationship. For example, in the national data, there are several other aspects of corruption that are captured (in particular in the broad, composite indicators CPI and WGI) such as in the courts or immigration that the measures of citizen experience and perceptions with specific public-sector services do not capture, thus it is not to be expected to be a ‘perfect’ correlation, but one that is highly related within the sample of European countries, despite accounting for several outside factors.
Discussion and conclusions
This paper has addressed several large questions that have drawn a wide debate in this field of research, which relates all the critiques regarding the validity of corruption perception measures. Given that most of the existing data are based on perceptions, thorough analyses and evaluation are critical. First, what is the empirical relationship between experiences and perceptions of corruption in the public sector among citizens? Second, are these perceptions biased by factors other than actual corruption? Third, are expert perceptions related to citizen perceptions and experiences with corruption? Such questions are of great importance for establishing the reliability and validity of the data used in contemporary corruption studies and for addressing a number of relevant contemporary critiques. Several conclusions and contributions based on the empirical findings of this study, which presents some of the most comprehensive survey data on this topic to date with a sample of roughly 85,000, can be highlighted.
First, in general, the results show that there is wide variation among countries in Europe with respect to both perceptions and actual experience with corruption. The findings elucidate that even in so-called ‘developed’ areas of the world, this issue is highly relevant, and that problems associated with corruption should not be overlooked in this region.
Second, in the sample of European states used here, the perceptions of how much one’s public sector is plagued by corruption are highly consistent when comparing samples of those who have and those who have not recently experienced public-sector corruption. The results also hold good for the 2010 data. Moreover, this is the first study to systematically test this relationship at the sub-national level within multiple countries, which helps to strengthen inferences made at the national level. The findings here show that the sub-national level (in many cases) is highly relevant in terms of spatial variations of public-sector performance, which lends support to the findings of Gingrich (Reference Gingerich2013) at the sub-national level in three South American states. The fact that perceptions of citizens who have not experienced corruption match closely to those with personal experience and corresponded so closely – at two levels of analysis – demonstrates a degree of external validity for citizen-based perception measures.
Third, little evidence is found in support of critics’ claims that corruption perceptions are driven by outside noise, at least in the sample European countries and regions. One, very few outside factors were found to be influencing the corruption perceptions of the ‘non-experience’ sample. Although economic development and unemployment were statistically related to the residuals, their effects were relatively weak and driven by a handful of low-corrupt regions. Two, it would have been expected that if those who actually experience corruption report a similar corruption perception level as those without firsthand experience (either experts or other citizens), then perception surveys really do capture ‘true’ levels of corruption. By looking at country rankings produced by expert measures compared with the perceptions of our citizen sample, this study finds that perceptions of citizens in Europe are highly correlated with expert perceptions, even when accounting for country economic performance, size of government, partisanship and population, which – at least with respect to this sample – provides counter-evidence to the claims of critics that expert perceptions are driven by factors other than corruption (Kurtz and Schrank, Reference Kurtz and Schrank2007). Given the consistency of corruption perceptions between experts and citizens, as well as actual reported citizen experiences, this study offers a much less pessimistic view of existing measures than the prevailing literature, and also offers empirical support for existing measures in this region due to the high degree of correspondence found between perceptions (both expert and citizen) and experience with corruption, at both the national and regional levels of analysis explored here. A key point from this study is also that perceptions indictors – despite showing strong validity within Europe – are most likely best treated as ordinal measures, used to compare how states or regions rank relative to one another, rather than being used as hard ‘benchmarks’ to assess actual levels of corruption.
Based on these findings, one might ask, relative to more developing areas of the world, why these results find a comparatively high consistency between expert and citizen perceptions when others have not? One insight could be found in Razafindrakoto and Roubaud (Reference Razafindrakoto and Roubaud2010), who show that the distance between citizen and expert corruption perceptions decreases as a function of country-level development, which could help in explaining the discrepancies that were found in one country in particular – Turkey. Another explanation here is, of course, a high degree of transparency in how these systems function in Europe, and a perhaps a wider understanding of the extent of corruption that actually persists in this area of the world compared with others, which bears out in the data. It is also plausible that citizens in poor, corrupt places view corruption as more ‘normal’ and under-report it. A third explanation is simply that there are more experts with sufficient knowledge states in Europe than there are for developing countries, with the argument here being that the greater the levels of expertise, the more valid the assessments. One of the main inferences from this study is that the research field’s ‘experiment’ with perceptions measures to track corruption does in fact ‘work’ to the extent that perceptions track closely with actual experiences in producing country and regional rankings. Yet, the validity of the method of measurement via perception might only hold under certain sample conditions. This discrepancy is, therefore, left to future research.
However, this study is not without weaknesses and they should be addressed in future research. One, there is an admittedly somewhat narrow focus on petty corruption and perceived corruption largely in public-sector services, as opposed to ‘higher level’ corruption. This was due to the nature of the data and the inherent difficultly of directly observing high-level corruption. A second weakness is the generalizability of these findings. As noted earlier, previous studies have shown a weak link at best between experience measures and perceptions at the individual and national levels. This study does nothing to put into question those previous results due to the fact that different samples/world regions were analyzed. Although the finding that citizen and expert assessments of corruption strongly coincide and offers a challenge to much of the existing literature, it does not refute it entirely, and it is based on findings in developing areas (Seligson, Reference Seligson2006; Olken, Reference Olken2009; Razafindrakoto and Roubaud, Reference Razafindrakoto and Roubaud2010), which means that Europe might be an outlier. Europe, being viewed as having relatively good governance in general (yet not without problems associated with corruption) may be unique in this respect, with many shared norms and values driven by supranational organizations like the European Union and European Court of Justice producing a common understanding among citizens and experts of how one defines and recognizes public-sector corruption. It is of course relevant to demonstrate that this empirical relationship is strong for this part of the world, and this study is the first to do so. However, if data on perceptions and experiences only ‘work’ in certain regions (e.g. highly developed ones) then they might be the least valid where they are needed most – for example, in countries with the highest levels of corruption.
Finally, there is an inherent problem with tracking these two concepts of ‘perceptions’ and ‘experiences’ in that one’s own individual experience may be ‘zero’, yet he/she might know someone personally who has paid a bribe, or one might have been solicited to pay a bribe and refused. This will obviously influence a person’s perception, yet the measures of experience used here do not track these important nuances. Therefore, more nuanced questions of personal experience with corruption should be developed in future surveys to capture ‘experience’, which is implicitly used as the ‘true’ level baseline of comparison in most of these studies, in the context of a greater social network that extends beyond one’s own household.
Acknowledgements
I thank Bo Rothstein, Phil Keefer and the two anonymous reviewers at EPSR for their support, helpful suggestions and critique of this manuscript.
Supplementary material
To view supplementary materials for this article, please visit http://dx.doi.org/10.1017/S1755773914000447