I. INTRODUCTION
Titanate-based nanotubes may be prepared by three major methods: hydrothermal (alkaline conditions), chemical (template-assisted sol–gel synthesis), and electrochemical (anodic oxidation).Reference Bavykin, Walsh, O’Brien, Kroto and Craighead1 Among the preparation methods of the titania-/titanate-based nanotubes, the hydrothermal procedure is one of the mostly used methods. ChemicalReference Weng, Song, Hodgson, Baker and Yu2, Reference Zhao, Jin and Yang3 and physical modificationsReference Wu, Jiang, Ma, Fu and Shangguan4, Reference Zhang, Wang, Yang, Chen and Zhang5 of these methods were also used, most promising being the microwave-assisted hydrothermal treatment, by shortening the reaction time. Titanate-based nanotubes architecture, obtained by hydrothermal treatment, demonstrates that this single-step procedure, in a closed system, yields well-crystallized and single-phase structures.Reference Du, Chen, Che, Yuan and Peng6–Reference Wang, Varghese, Paulose and Grimes11
Literature records extensive data about the obtaining of titanate-based nanotubes and derived nanostructures, starting from various precursors, such as amorphous powder,Reference Yuan and Su12 anatase,Reference Morgado, de Abreu, Pravia, Marinkovic, Jardim, Rizzo and Araújo13 rutile,Reference Pavasupree, Suzuki, Yoshikawa and Kawahata14 anatase and rutile mixture,Reference Qian, Du, Yang and Jin15 Na2Ti3O7,Reference Kukovecz, Hodos, Horvath, Radnoczi, Konya and Kiricsi16 etc., and getting at different phases and compositions: monoclinic trititanates, H2Ti3O7,Reference Chen, Du, Zhang and Peng17 orthorhombic titanates, H2Ti2O4(OH)2,Reference Yang, Jin, Wang, Li, Zhang, Zhang, Guo and Zhang18 tetratitanates, H2Ti4O9,Reference Nakahira, Kato, Tamai, Isshiki and Nishio10 monoclinic TiO2-B,Reference Armstrong, Armstrong, Canales and Bruce19 or tetragonal anatase.Reference Poudel, Wang, Dames, Huang, Kunwar, Wang, Banerjee, Chen and Ren20
Because, many times, the reported results are not completely in agreement, it has to be investigated how the precursors, the hydrothermal treatment parameters, and posttreatment factors influence the formation mechanism of the nanostructures and to find out how to control these parameters to achieve different morphologies and chemical compositions. A common example is the P25 Aeroxide (Evonik Degussa GmbH, Rheinfelden, Germany), which, under very similar hydrothermal and posthydrothermal treatments, produces different structures and chemical compound, such as H2Ti4O9·H2OReference Xiao, Li, Liu and Gao21 or NaxH2−xTi3O7.Reference Sun and Li22
Potential applications of the TiO2-based nanotubes are in several fields, such as catalysis, biochemistry, separation science, sensors, immobilization, and stabilization of biologically active compounds like enzymes, antibodies, microorganisms, and drugs.Reference Ou and Lo23, Reference Bavykin and Walsh24
In many of these applications, titanates nanostructures are exposed to chemically aggressive media or at high temperature, which can affect their stability.Reference Bavykin, Friedrich and Walsh25 Therefore, it is important to understand the range of operational conditions under which nanotubes are stable and the transformations of nanotubes that occur outside these conditions. Transformations, occurring under various conditions, result in a change in morphology or crystal structure of titanate nanotubes. All transformations can be divided, according to the type of treatment: thermal, chemical, or mechanical.Reference Suzuki and Yoshikawa26, Reference Kubo, Nakahira and Yamasaki27 The thermal stability of the titanate-based nanotubes is of great interest for applications mainly in catalysis or as sensors.Reference Mor, Carvalho, Varghese, Pishko and Grimes28, Reference Shyue, Cochran and Padture29
The research in the present work was oriented mainly to the influence of the TiO2precursors on the formation, structure, and morphology of the obtained nanotubes and establishing their thermal stability.
II. EXPERIMENTAL
A. Sample preparation
The titanate nanotubes were prepared by hydrothermal method using different Ti precursors such as two commercial crystalline powders and two laboratory-made sol–gel powders, crystalline and amorphous. The sample notation shall be interpreted as follows: the letter comes from precursor type, where D comes from P25 Aeroxide (Evonik), A from anatase (Sigma-Aldrich Chemie GmbH, Steinheim, Germany), SG from laboratory-made sol–gel powders, thermally treated at 400 °C, SGA from laboratory-made sol–gel amorphous powder, and the number comes from the time of the hydrothermal reaction (number of hours).
The hydrothermal treatment realized the presence of 10 M NaOH solution at 140 °C for various times (from 24 to 72 h) depending on the precursor used. The mass ratio between TiO2and NaOH was 0.04. The reaction slurry was separated by centrifugation and washed alternately with distilled water and 0.1 N HCl solution, down to pH ∼ 6. The sample was dried at 110 °C, 12 h, in air.
B. Sample characterization
The obtained samples were characterized by the experimental methods presented below. Conventional transmission electron microscopy (TEM) studies were performed using a JEOL 200CX electron microscope and the high-resolution images using a JEOL ARM 200F instrument (JEOL Ltd., Tokyo, Japan). The TEM specimens were prepared by deposition the sample powders on holey carbon grids for TEM. Powder x-ray diffraction (XRD) patterns were recorded on a Rigaku Ultima IV diffractometer (Rigaku Corporation, Tokyo, Japan), with Cu Kα(λ = 1.5406 Å radiation), with a speed of 5°/min and a 0.02° scan step, at 40 kV and 30 mA.
The thermal experiments were performed on a Mettler Toledo TGA/SDTA 851e thermal analyzer, within the temperature range 25–600 °C, and a Mettler Toledo DSC 853edifferential scanning calorimeter (Mettler Toledo AG, Greifensee, Switzerland), within the temperature range 25–600 °C. The TG curves were recorded in air atmosphere with a flow rate of 50 mL/min and at a heating rate of 10 °C/min. The DSC curves were obtained under nitrogen atmosphere with 80 mL/min flow rates and 10 °C/min heating rate. The samples were analyzed using aluminum crucibles for DSC experiments and alumina crucibles for DTA/TG experiments. The DTA/TG and DSC curves were used to characterize the accompanying mass and heat changes during the linear heating.
III. RESULTS AND DISCUSSION
A. TiO2 precursor’s characterization
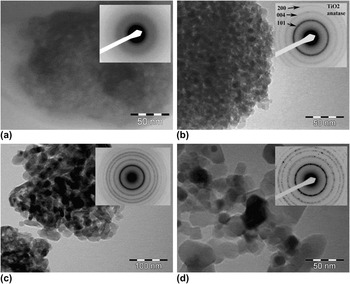
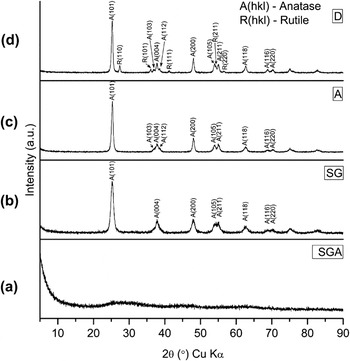
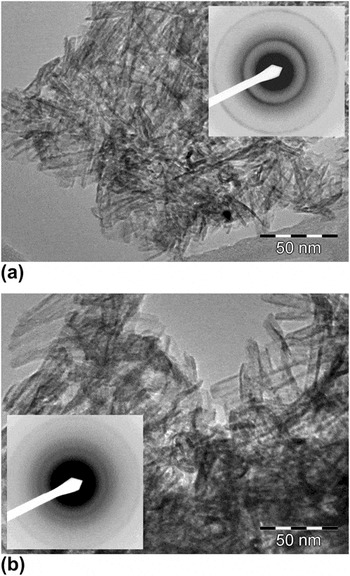
The structure and morphology of the different types of TiO2 used as precursors for nanotubes preparation, established by TEM and XRD, are presented in Figs. 1 and 2. The TEM and selected area electron diffraction (SAED) image results (see inserts in Fig. 1) have established that the structure of the TiO2 precursors differs significantly. The dried sol–gel powder is amorphous, the thermally treated sol–gel powder has a quasicrystalline anatase structure, and the commercial powder anatase (Aldrich) presents a pure anatase structure. The most complex structure and the higher degree of crystallization are shown by the anatase (Aldrich) commercial powder and P25 Aeroxide (Evonik), which also contain some rutile phase. It is expected that such differences in the TiO2precursor powders’ structure and morphology will influence the formation of the titanate-based nanotubes and their structure and properties.
TEM images with SAED inserted of the TiO2 powders used as precursors in titanate-based nanotubes preparation: (a) sol–gel powder, dried; (b) sol–gel powder, thermally treated at 400 °C; (c) TiO2commercial powder (Aldrich); and (d) P25 Aeroxide (Evonik), commercial powder.

XRD patterns of the TiO2 powders used as precursors in titanate-based nanotubes preparation: (a) sample SGA24 (sol?gel powder dried), (b) sample SG48 (sol?gel powder; thermally treated at 400 °C), (c) sample A48 (TiO2powder; Aldrich), and (d) sample D72 (P25 Aeroxide powder; Evonik).

B. Titanate nanotubes characterization
1. Structure and morphology
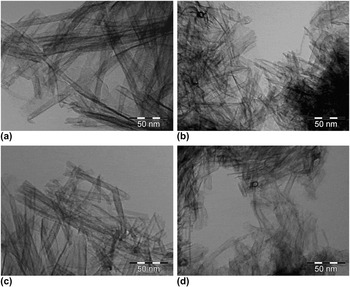
Starting with the rather different TiO2 precursors and in the experimental conditions described in Sec. II, in all cases, nanotubes were obtained, as determined by TEM investigations. The TEM results presented in Fig. 3 have also shown that in all cases, aggregates of nanotubes were obtained. Besides the nanotubes, flat nanosheets and/or strongly bended nanosheets, but not completely rolled up, could be observed as secondary phases.
TEM images of the titanate nanotubes prepared from different TiO2 precursors: (a) sol–gel powder, dried (sample SGA24); (b) sol–gel powder, thermally treated at 400 °C (sample SG48); (c) TiO2powder (Aldrich) (sample A48); and (d) P25 Aeroxide (Evonik) powder (sample D72).

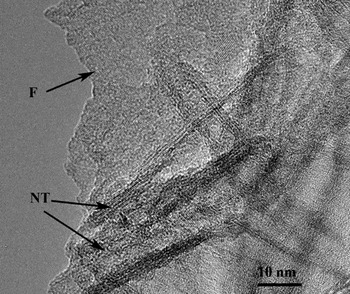
In Fig. 4, a high-resolution transmission electron microscopy (HRTEM) image is given, which shows very clearly the presence of the nanosheets together with nanotubes.
HRTEM image of the SG48 sample showing the presence of the unrolled titanate sheets (F) mixed with the titanate nanotubes (NT).

In all cases, the main features of the nanotubes are the followings: inner diameter 10–12 nm, wall thickness 3–4 nm, and length 50–200 nm. The diameter and the thickness of the walls are not significantly influenced by the type of TiO2used.
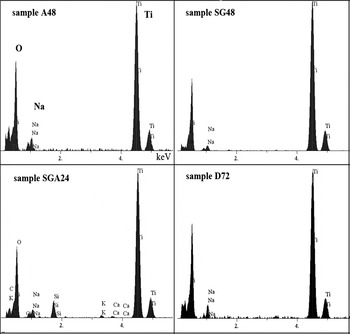
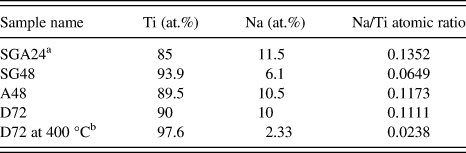
The amount of Na in the composition of the different type of synthesized titanate nanotubes, determined by energy dispersive x-ray spectroscopy (EDX), is presented in Fig. 5, and the results are summarized in Table I. The highest amount of Na was detected in the SGA24 sample, starting from amorphous precursor, while the lowest amount is identified in the SG48 sample, starting from sol–gel powder, thermally treated at 400 °C. For the nanotubes prepared from sol–gel precursors, strongest the crystallinity of the precursor and lowest amount of sodium was obtained. It should also be mentioned that in the case of SGA24 sample, traces of K and Ca are also detected. These traces were probably form the NaOH used for synthesis.
EDX spectra of titanate nanotubes prepared from different TiO2 precursors: sample A48 (TiO2powder, Aldrich), sample SG48 (sol–gel powder, thermally treated at 400 °C), sample SGA24 (sol–gel powder dried), and sample D72 (P25 Aeroxide powder, Evonik).

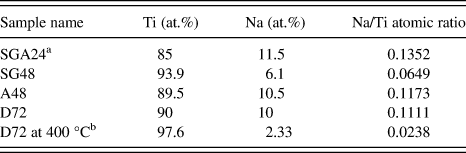
For the nanotubes obtained from commercial crystalline powders, the sodium amount is quite similar. The D72 nanotubes, thermally treated at 400 °C, present an unexpected behavior, containing the lower sodium amount then the similar dried sample. The evolution of sodium content from nanotubes by thermal treatment remains uncertain but it will not be discussed here.
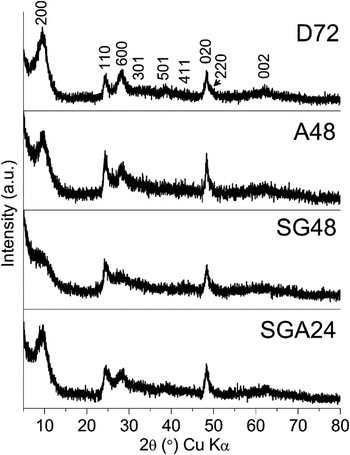
The XRD data presented in Fig. 6 have shown that in all cases, the same diffraction lines are obtained, but some differences occur regarding the intensity of the some lines. The diffraction line located around 2θ = 10°, with the Miller indices (200) (hkl), corresponds to the distance between layers,Reference Yang, Jin, Wang, Li, Zhang, Zhang, Guo and Zhang18 with a value of ∼0.8 nm, which was observed by HRTEM. The intensity of the (200) line for all as-synthesized samples varies in terms of sodium content, more sodium, higher intensity of the line, as confirmed by EDX values (see Table I).
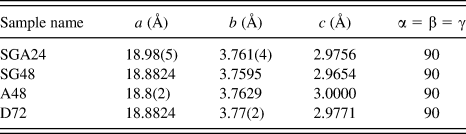
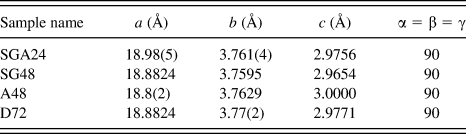
According to the XRD and EDX results, the chemical composition of the synthesized nanotubes may be assigned to the following Na2−xHxTi2O4(OH)2, where 0 < x < 2. This general chemical formula was assigned based on the best approximation from ICDD database, where the best fit was Na2Ti2O4(OH)2 (ICDD File No. 00-057-0123) and H2Ti2O4(OH)2 (ICDD File No. 00-047–0124). The unit cell of Na2−xHxTi2O4(OH)2 is orthorhombic, with space group Pmmm, with cell parameters of the synthesized titanate nanotubes, calculated with Rigaku’s PDXL software, as presented in Table II. It may be noticed that the values of cell parameters are between the cell parameters of Na2Ti2O4(OH)2 (with a = 19.2600 Å, b = 3.7800 Å, c = 3.0000 Å cell parameters) and H2Ti2O4(OH)2 (with a = 18.030 Å, b = 3.7800 Å, c = 2.9980 Å cell parameters).
XRD patterns of the titanate nanotubes prepared from different Ti precursors.

Unit cell parameters of the synthesized titanate nanotubes.
2. Thermal stability
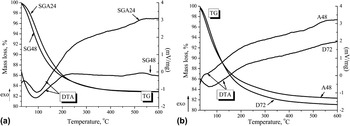
The DTA/TG curves of the synthesized samples are presented in Figs. 7(a) and 7(b). In Fig. 7(a), the comparative DTA/TG results for the nanotubes obtained form sol–gel precursors are shown, while in Fig. 7(b), the similar curves corresponding to the nanotubes obtained from commercial precursors are given. The thermal behavior of all samples is very similar. Beside the large endothermic effect at temperatures about 100 °C, up to 400 °C, no other specific endothermic or exothermic effects are noticed. Weight losses of the samples at different temperature ranges, as determined by TG analysis under airflow, are presented in the Table III.
DTA/TG curves of the titania-based nanotubes prepared from (a) TiO2 sol–gel powders, dried (sample SGA24), and TiO2sol–gel powders, thermally treated (sample SG48); (b) anatase, commercial powder (Aldrich) (sample A48), and P25 Aeroxide (Evonik) (sample D72).

Weight losses (%) of the samples at different temperature ranges, as measured by TG under airflow.

The weight loss and thermal processes that occur in the temperature range 25–600 °C are usually associated with the removal of adsorbed water and structural –OH. In the temperature range from 25 to 100 °C, desorption of water results in a loss of approximately 7–9 wt%. A further increase in the temperature up to 200 °C results in the removal of structural –OH water from titanate-based nanotubes. According to TG data, approximately 5–6 wt% of mass is lost during the dehydration of structural –OH water. No significant endothermic and exothermic effects were observed over the temperature range from 300 to 600 °C.
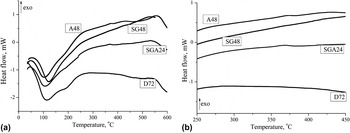
The DTA/TG studies are supported also by the DSC experiments [Figs. 8(a) and 8(b)]. In Fig. 8(a), the DSC curves in the 20–600 °C temperature range are presented for all nanotubes, while in Fig. 8(b), the temperatures range from 250 to 450 °C, which is of interest for structural transformation of nanotubes, was enlarged. The significant peak temperature and the corresponding enthalpies, from DSC curves, are shown in Table IV.
DSC curves of the titanate nanotubes obtained from different TiO2precursors (a) 25–600 °C temperature range, (b) enlarged 250–450 °C temperature range.

Results of thermal transformations of titanate nanotubes prepared from different TiO2precursors from DSC curves.

The endothermic processes, which appeared in the 25–200 °C temperature range, are associated with the dehydration and loss of structural –OH water. No significant exothermic effect could be detected by DSC [Fig. 8(b)] in the 300–600 °C temperature range. However, some very small and broad effects observed in the DSC curves from 300 to 400 °C could be assigned to the secondary phases (sheets or precursor traces) crystallization.
According to the literature data,Reference Umek, Korošec, Jančar, Dominko and Arčon30 at elevated temperatures, there are at least three processes occurring with titanate nanotubes, namely dehydration, crystal structure transformation, and a modification in morphology. All three processes occur simultaneously, and each has a characteristic range of temperatures related to their particular phase transition.
The total weight decrease was attributed entirely to water loss, and it was assumed that interlayer (H2O) and structural water (–OH) were only released at temperatures higher than 100 °C. The percentages of interlayer and structural water (weight loss in 100–600 °C range) in the studied nanotubes range from 8.8% to 11.0%, under airflow.
Smaller loss of structural water would be expected for titanate nanotubes whose compositions richer in sodium would have significantly less hydrogen available for dehydroxylation. Therefore, titanate nanotubes should have retained significant amount of interlayer water, being also released between 100 and 600 °C. As mentioned in the literature data,Reference Morgado, Jardim, Marinkovic, Rizzo, Abreu, Zotin and Araujo31 the important structural transformation takes place in the temperature range 300–600 °C, where no specific thermal effects were observed in our work.
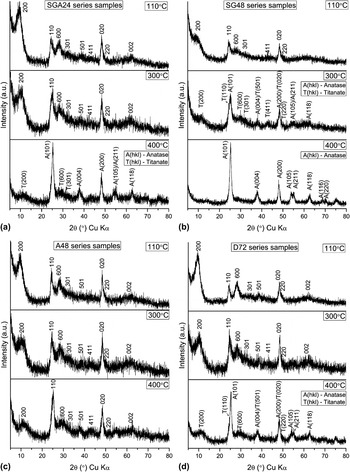
However, the XRD patterns of the samples thermally treated in the 100–400 °C temperature range have shown differences in the resulted crystalline structure. For all samples, the structure was preserved up to 300 °C and could be assigned to the as-prepared titanates with the chemical composition Na2−xHxTi2O4(OH)2. By thermal treatment, the nanotubes obtained from anatase (Aldrich), commercial precursors (sample A48), preserve the titanate structure up to 400 °C [Fig. 9(c)], while the sample starting from P25 Aeroxide presents a phase mixture of anatase and titanate [Fig. 9(d)]. The sample SGA24, obtained from amorphous precursor, is less thermally stable; the presence of anatase can be noticed by XRD [Fig. 9(a)], with titanate phase at 300 °C. At 400 °C, the ratio between anatase and titanate phase is strongly reversed, titanate phase being detected by XRD only as traces. For SG48 sample, starting from crystalline sol–gel powder, a similar behavior with SGA24 sample up to 300 °C can be noticed; at 400 °C, only anatase phase could be detected by XRD [Fig. 9(b)].
XRD patterns of the titanate nanotubes thermally treated at different temperatures.

A possible explanation of this low thermal stability of the titanate nanotubes resulted from the sol–gel TiO2precursors can be related to the defects present in the titanate sheets/foils formed from these precursors. In the case of crystalline precursors, the titanate sheets/foils are less defective because they are formed by crystalline anatase exfoliation. In the case of amorphous precursors, these sheets/foils are made by a growth mechanism and have many defects, which make rolling up more difficult. In this case, we also observed more nanosheets compared with the case of nanotubes resulted from crystalline precursors.
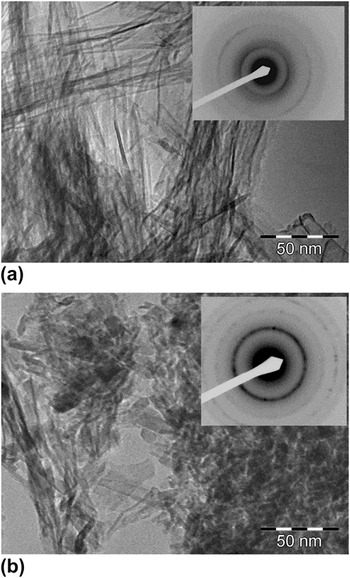
In Figs. 10 and 11, the TEM images of the thermally treated SG48 and D72 samples are presented, confirming their different behaviors.
TEM images (with SAED inserted) of SG48 titanate nanotubes, after thermal annealing: (a) nanotube structure is preserved after annealing at 300 °C, (b) titanate nanotube structure changes into anatase structure after annealing at 400 °C.

TEM images (with SAED inserted) of D72 titanate nanotubes, after thermal annealing: (a) nanotube structure is preserved after annealing at 300 °C, (b) titania nanotube structure is maintained but slightly changed after annealing at 400 °C.

TEM images (with SAED inserted) of SG48 titanate nanotubes show that after thermal annealing at 300 °C, they preserve their structure, but after annealing at 400 °C, the tubular aspect changes to a granular one.
TEM images (with SAED inserted) of D72 titanate nanotubes confirm their higher thermal stability. In this case, the tubular aspect is maintained but slightly changed also after annealing at 400 °C.
IV. CONCLUSIONS
The influence of different TiO2precursors, as laboratory-prepared sol–gel powders, dried and thermally treated at 400 °C, anatase (Aldrich) and P25 Aeroxide (Evonik), commercial powders, on the structure and morphology of the titanate nanotubes obtained by hydrothermal method was investigated.
In all cases, titanate-based nanotubes were obtained having similar structure and morphology. Thermal analyses of the nanotubes investigated by DTA/TG combined with DSC analysis have shown a similar behavior. No specific thermal effects assigned to phase transformation could be observed, but the important structural transformation takes place in the 200–500 °C temperature range. The different thermal behavior of the investigated samples was determined by XRD investigations of the samples thermally treated in the 100–400 °C temperature range. All samples undergo phase transformation but at different temperature.
The thermal phase transformation of the samples depends not only on the Na content in the composition of the nanotubes but also on the structure of the TiO2precursor used in their synthesis. The titanate nanotubes obtained starting from anatase (Aldrich) precursor presents the highest thermal stability.
ACKNOWLEDGMENTS
This paper was carried out within the research program “Physical Chemistry of Oxide Systems” of the “Ilie Murgulescu” Institute of Physical Chemistry, financed by the Romanian Academy. The financial support of the Romanian National Research Program PNII, project NANOTUBOX, contract 71-109/2005, as well as the support of the EU (ERDF) and Romanian Government that allowed for acquisition of the research infrastructure under POS-CCE O 2.2.1 project INFRANANOCHEM—Nr. 19/01.03.2009, is gratefully acknowledged.