Across the world, the dairy sector continues to intensify in response to increasing human populations, declining land per head of population and increasing demands for foods of animal origin (Duncan et al., Reference Duncan, Teufel, Mekonnen, Singh, Bitew and Gebremedhin2013; Adegbola and Dahl, Reference Adegbola and Dahl2020). The sector is important in ensuring food security in developing countries including India and is a promising livelihood option for poor households (Saxena et al., Reference Saxena, Choudhary and Joshi2019; Kumar et al., Reference Kumar, Sharma, Satyapriya, Govindasamy, Singh, Kumar, Halli, Choudhary and Bagavathiannan2022). Dairying not only triggers equal distribution of income among farm households (Choudhary and Singh, Reference Choudhary and Singh2019) but also is the best insurance against the vagaries of nature like drought, famine and other natural calamities. Therefore, prioritizing progress of the sector is crucial in meeting sustainable development goals.
India has the largest bovine population in the world, but the productivity potential of Indian animals is very low. This compromises the profitability of dairy farmers (Choudhary and Sirohi, Reference Choudhary and Sirohi2022). Green fodder deficit, especially during the dry season, has been widely recognized as one of the major factors for low animal productivity in the country (Ghosh et al., Reference Ghosh, Palsaniya and Srinivasan2016). In India, land allocation to cultivation of green fodder crops is limited and has hardly ever exceeded 5% of the gross cropped area. Therefore, the supply of feed and fodder has always remained short of requirement (Satyapriya et al., Reference Satyapriya, Sharma, Pandey, Biradar and Radotra2012), restricting realization of the true production potential of livestock (Sharma et al., Reference Sharma, Choudhary, Singh, Kumar, Gupta and Dev2021). Presently, the country faces a net deficit of 11.24% in green fodder, 23.4% dry crop residues and 28.9% concentrate feed ingredients (Roy et al., Reference Roy, Agrawal, Bhardwaj, Mishra, Mahanta, Roy, Agrawal and Bhardwaj2019). Regional and seasonal disparities in fodder production and availability exist, with most of the deficient regions lying in the climate exposed arid and semi-arid regions of the country. Therefore, bridging feed and fodder gaps in vulnerable landscapes is particularly important for sustaining livelihood of smallholder dairy farmers.
The scope for improving milk productivity and profitability also depends on the level of technical efficiency of dairy farmers. Technical efficiency implies the maximum attainable level of output that can result from best production practices and optimal resource allocations (Girma, Reference Girma2019). Measuring and evaluating farm performance in terms of efficiency is imperative for supporting the development of sustainable dairy farming systems. Estimates of technical efficiency are useful in emphasizing practices like changes to the management (balance feeding, education and training programs for dairy farmers) and structure of the farm for improving productivity levels (Bardhan and Sharma, Reference Bardhan and Sharma2013). A separate set of literature on technical efficiency of dairy farms across different regions of the world (Adane et al., Reference Adane, Shiferaw and Gebremedhin2015; Singh, Reference Singh2020) suggests that factors influencing efficiency of the farmers are region-specific.
Experimental field trials have indicated that improved fodder-based interventions have the potential to enhance livestock productivity (Sharma et al., Reference Sharma, Pandey, Meena and Singh2007; Ghosh et al., Reference Ghosh, Palsaniya and Srinivasan2016). However, studies examining the impact of adoption of improved green fodder practices by the farmers on their dairy farm efficiency have not been looked at. As the introduction of any technology often alters farm resource allocations by the farmers, it becomes important to investigate if there is a trade-off between improved fodder technologies and technical efficiency of dairy farmers who choose to adopt the fodder-based interventions.
The present study uses the example of the KISAN MITrA (Knowledge-based Integrated Sustainable Agriculture Network Mission India for Transforming Agriculture) project to assess the effect of green fodder based interventions on technical efficiency of smallholder dairy farmers in climatically vulnerable semi-arid tropics of central India. The KISAN MITrA project, funded by the government of Uttar Pradesh State, was started in the Bundelkhand region of Central India in 2017 by ICAR-Indian Grassland and Fodder Research Institute (IGFRI), Jhansi in consortia with ICRISAT Development Center (IDC), Hyderabad. One of the important objectives of the project was to implement improved forage technologies for ensuring year-round quality fodder for livestock. Under the KISAN MITrA project, a broad set of improved fodder cultivars and perennial fodder grasses along with improved production practices was introduced in cropping patterns of dairy farmers making it an ideal context for investigation of the technical efficiency of dairy enterprises. Our study, which to the best of our knowledge is the first to investigate this subject in a unique geographical context, could provide crucial findings for the effective adoption and successful implementation of fodder-based crop diversification for meeting green fodder shortages and improving milk productivity in semi-arid tropics across the globe, where crop diversification is encouraged as an adaptation strategy for climate change.
Material and methods
Sampling and data
This study was conducted in three districts namely Jhansi, Lalitpur and Jalaun located in Bundelkhand region of central India (online Supplementary File figure S1). The prevalent undulating topography, hard rock geology, low soil fertility, scarce groundwater resources along with poor and erratic rainfall all predispose to frequent droughts and crop failure in the region. Livestock-based mixed farming is a common adaptive strategy against climate-related risks to crop production in Bundelkhand. The study site typically represents traditional smallholder dairying areas within the semi-arid tropics in India (Sharma et al., Reference Sharma, Choudhary, Singh, Kumar, Gupta and Dev2021).
The study used both purposive and random sampling approaches for drawing sampled respondents. The first stage of the sampling approach involved purposively selecting three villages in each district where all the project activities were focused (hereafter called treated villages) and randomly selecting contiguous villages in each district with no forage based interventions but having by and large close similarity with treated villages in their agro-climatic, infrastructural and socio-economic set up (hereafter called control villages). The second stage involved randomly selecting dairy households within the physical boundary of these villages. A total of 700 respondents, 250 from treated and 450 from control villages, were surveyed in 2 visits per farmer from June 2021 to March 2022. During each visit, information about the farmer's ongoing production and feeding practices was recorded to minimize recall bias.
Conceptual framework
Reviewing earlier literature suggests that stochastic production frontier (SPF) analysis, an econometric assessment to analyse production relationships, is the best methodology in measuring efficiency (Ma et al., Reference Ma, Renwick, Yuan and Ratna2018; Girma, Reference Girma2019; Singh, Reference Singh2020). A few studies have also employed non-parametric approaches like data envelope analysis (DEA; Gelan and Muriithi, Reference Gelan and Muriithi2012). However, the DEA method, due to its strong assumption of no sampling errors, is sensitive to outliers and attributes all deviation from the production frontier to inefficiency (Diagne et al., Reference Diagne, Demont, Seck and Diaw2013). This reduces its relevance in agricultural studies where output is highly sensitive to random weather conditions (Koirala et al., Reference Koirala, Mishra and Mohanty2016). Therefore, in this study, to estimate farm level technical efficiency scores, we employed SPF model and specified as follows:
 $$Y_i = f( X_i, \;d_i) + v_i-u_i \ldots $$
where, Yi indicate output of our interest for the i th farmer; X representing vector of input variables in the production frontier; d is dummy that captures the treatment status of the farmers under the project activities (1 = treated, 0 = control); vi is stochastic error term [v ~ N (0, σv2)] and ui is positive (one-sided; ui ≥ 0) random error accounting for technical inefficiency in production. Among various possible distribution framework of ui i.e., half-normal, truncated normal, exponential or gamma, we assumed the commonly used truncated-normal distribution for the inefficiency component (u ~ N [0, σu 2).
The decision by the farmer to adopt any technology (fodder interventions in our case) depends on various observed and unobserved factors (Bravo-Ureta et al., Reference Bravo-Ureta, Greene and Solís2012) that may lead to self-selection in adoption. This biasness (self-selection) may change the production frontiers for adopters (treated) and non-adopters (control) such that the variable representing treatment status of the farmers (di in Eq. 1) is not exogenously determined (Ma et al., Reference Ma, Renwick, Yuan and Ratna2018). This necessitates the following definition for the sample selection equation for adoption decision of farmers:
 $$d_i = {\rm \alpha }_iZ_i + {\rm \varepsilon }_i \ldots $$
where, expression of d is similar as eq. (1); Zi is a vector of covariates (demographic and social characteristics explaining the adoption decision); αi are unknown parameters to be estimated and; ɛi is the normally distributed error term.
Propensity score matching (PSM) is a well acknowledged method in literature to address potential selection bias due to observable factors (Imbens and Wooldridge, Reference Imbens and Wooldridge2008; Sharma et al., Reference Sharma, Choudhary, Singh, Kumar, Gupta and Dev2021). In the PSM framework, predicted probability values of adopting improved fodder practices by the farmers (i.e. propensity scores) can be estimated from eq. (2) using a binary probit model. Based on propensity score, a control group with similar observed characteristics as those for the treated group can be generated, which is an essential condition to get a precise estimate of impact.
To deal with selectivity biases due to unobserved factors (risk attitude, managerial ability, motivation of the farmers etc.) within a SPF framework, we followed the model proposed by Greene (Reference Greene2010), which has been reported as superior to Heckman's self-selection specification for the linear regression model (Bravo-Ureta et al., Reference Bravo-Ureta, Greene and Solís2012; Ma et al., Reference Ma, Renwick, Yuan and Ratna2018). The model of Greene (Reference Greene2010) assumes that the error term in the selection equation (ɛi) is correlated with the noise (vi) in the stochastic frontier model. The error structures of Greene (Reference Greene2010) can be expressed as:
 $$\eqalign{& u_i = \vert { {\rm \sigma}_uU_i} \vert = {\rm\sigma} _u\vert {U_i} \vert ; \;\;\;U_i\sim N[ 0, \;1] \cr & v_i = {\rm \sigma} _vV_i; \;V_i\sim N[ 0, \;1] \cr & ( {{\rm \varepsilon }_{i, }v_i} ) \sim N_2[ ( 0, \;1) , \;( 1, \;{\rm \rho}\; {\rm \sigma} _{v, }{\rm \sigma} ^2_v ) ] \ldots } $$
In the above equation, ρ is selectivity correction term and its statistically significant coefficient indicates the presence of selectivity bias due unobservable factors.
Empirical techniques
As previously mentioned, we used both PSM and selectivity bias corrected SPF model proposed by Greene (Reference Greene2010) to address biases from observed and unobserved factors. In PSM, various matching algorithms (nearest neighbour matching, kernel-based matching and radius matching) can be used in creating the counterfactuals. In this study, we used kernel based matching (KBM) with bandwidth 0.01 as it is reported to reduce biases by comparing the mean difference of the selected variables between treated and control group obtained from different matching algorithms (Ma et al., Reference Ma, Renwick, Yuan and Ratna2018). The KBM yielded a total of 676 matched observations, comprising 250 farmers from treated and 426 from control villages. Further, using t tests before and after matching (Leuven and Sianesi, Reference Leuven and Sianesi2003), we tested the null hypotheses that the means of observed characteristics of beneficiaries and non-beneficiaries are equal. Based on the propensity scores, the selectivity correction term (ρ) can be estimated and included in SPF framework (Abdulai and Abdulai, Reference Abdulai and Abdulai2017).
For estimating the production frontier, initially both the Cobb–Douglas and translog functional forms were compared by likelihood ratio test. Based on the test result, Cobb–Douglas function was used and specified as follows:
 $${\rm ln}( {{\rm ADM}{\rm P}_i} ) = {\rm \beta }_{0\;} + \mathop \sum \limits_{i = 1}^6 {\rm \beta }_ilnX_i + {\rm \vartheta }_id_i + {\rm \varepsilon }_i \ldots $$
where, the dependent variable ln(ADMPi) is log transformation of average daily milk productivity (in litres) of the animals of i th household. Independent variable ln(Xi) is log-transformed value of inputs (Table 1). βi s are the production elasticity parameters to be estimated and  ${\rm \varepsilon }_i$ is random error which represents stochastic variations in milk output.Further, based on results from Bravo-Ureta et al. (Reference Bravo-Ureta, Greene and Solís2012) and Ma et al. (Reference Ma, Renwick, Yuan and Ratna2018), the likelihood ratio (LR) test was conducted for the both unmatched and matched samples to check whether technology differences exist between treated and control group, as follows:
 $${\rm LR} = {-}2^\ast ( {lnL_P\;-( {lnL_T + lnL_C} ) } ) \ldots $$
where, lnLP, lnLT and lnLC are log-likelihood function values estimated from pooled sample, treated and control subsample, respectively. The rejection of the null hypothesis for equality by estimated LR test would suggest that the parameters for the production frontiers differ for treated and control farmers. The SPF for the beneficiaries and non-beneficiaries can be then estimated with following empirical specifications:
 $$\eqalign{{\rm Beneficiaries\colon }\ln ( {Y_i} ) = \emptyset _{0\;} + \mathop \sum \limits_{i = 1}^4 \emptyset _i{\rm ln}X_i + ( {1-{\rm \varphi }} ) {\rm \delta }_i{\rm \rho }_{\rm i} + e_i \ldots $$
 $${\rm Non}-{\rm beneficiaries}\;\ln ( {Y_i} ) = {\rm \theta }_{0\;} + \mathop \sum \limits_{i = 1}^4 {\rm \theta }_i{\rm ln}X_i + ( {1-{\rm \varphi }} ) {\rm \tau }_i{\rm \rho }_i + {\rm \omega }_i \ldots $$
where Yi and Xi are as previously defined; ρi is correction term,  $\emptyset _{0\;}$ and θ0 are constant terms,
 $\emptyset _i, \;\;{\rm \delta }_i, \;\;{\rm \theta }_i\;{\rm and}\;\tau _i$ are parameters to be estimated; and φ being a selectivity-correction term inclusion rule, takes value zero (φ = 0) when unobserved selection bias issue is considered and one (φ = 1) if not considered in estimating the SPF.
Summary statistics of the selected variables

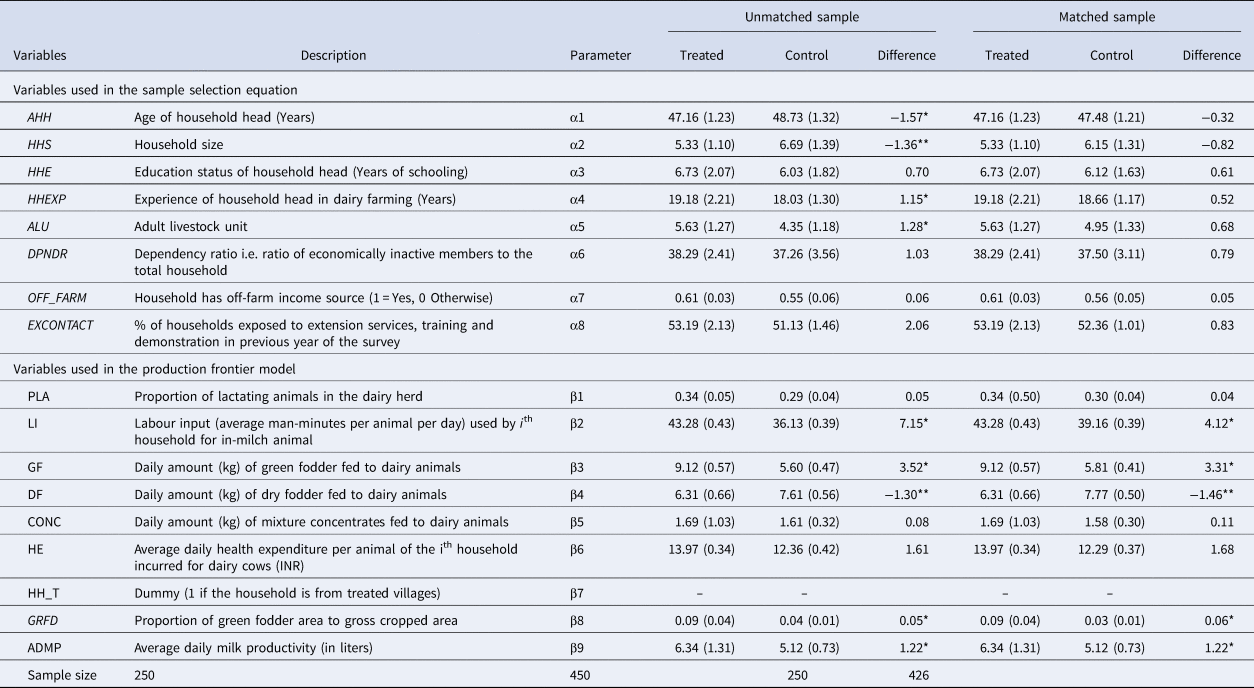
Standard deviations are presented within parentheses.
* P < 0.01, ** P < 0.05.
Results and discussion
A summary of definitions for the variables used in sample selection equation and production frontier model and their descriptive statistics for the overall sample are depicted in Table 1. It is important to note that, before matching, the households from treated and control villages are systematically different in terms of few observed characteristics. For instance, relative to control villages, age of household head and family size in the treated villages are on higher side. Further, farmers of the treated villages are more experience and have a larger livestock holding (ALU).
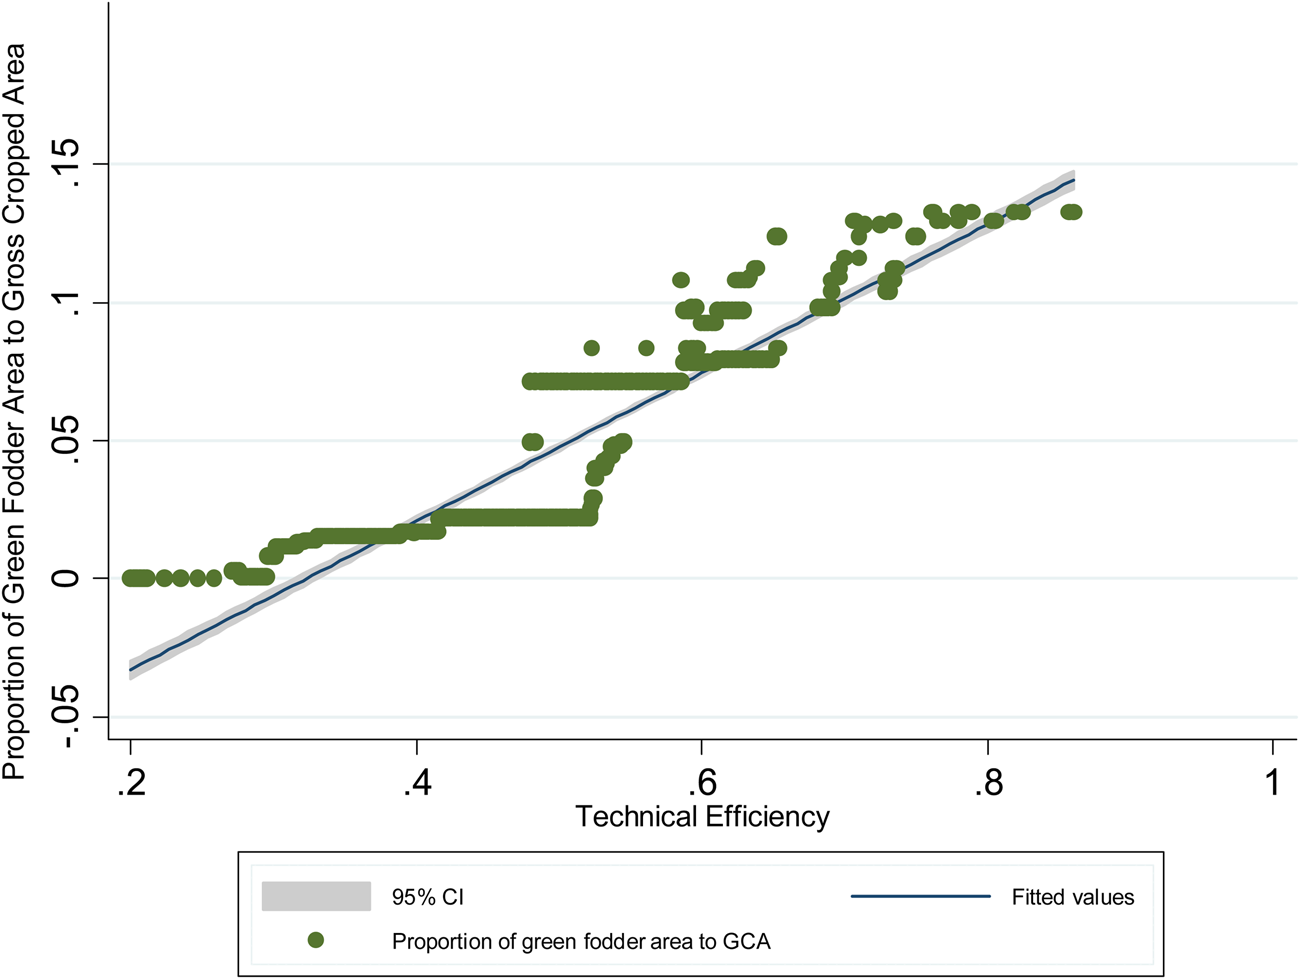
Table 1 also provides the mean differences of input and output variables used in production frontier analysis. Most importantly, fodder acreage as a proportion of gross cropped area (GCA) in the treated villages is significantly higher than that of control. Therefore, treated households offer more green fodder to their animals and invest more labour compared to their control counterparts. Conversely, use of dry fodder in the control villages is significantly higher than the treated villages. The test of means also indicates that milk productivity of dairy animals in the treated villages is significantly higher than that of control. Graphical examination of the relationship between the technical efficiency of dairy farmers and proportion of green fodder area to gross cropped area (GCA) at their farm (Fig. 1) suggests a positive relationship between the two, implying that farmers who diversified their farms with green fodder also tend to be more technically efficient. Since these findings are graphical and descriptive and only suggestive of the potential relationship between these variables, we provide more plausible empirical results estimated through robust econometric framework. Further, as the effects of confounders have not been controlled for, it would be inappropriate to categorically equate adoption of green fodder-based interventions with the productivity performance of dairy animals. This further necessitates matching through PSM to analyse actual difference of technical efficiency between adopters and non-adopters.
Scatter graph relating proportion of available fodder acreage to calculated technical efficiency (TE) of the dairy farmers.

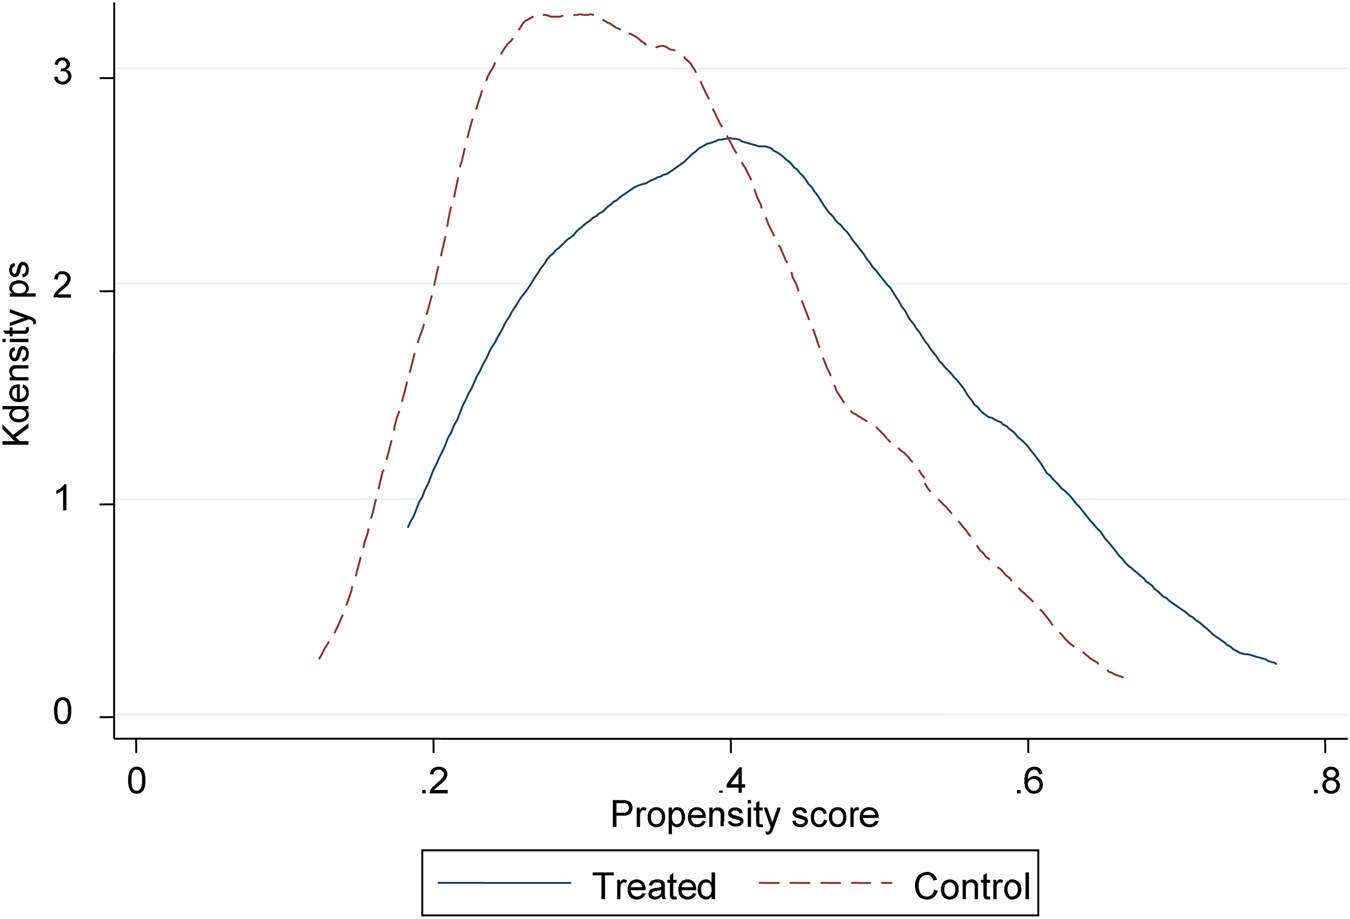
Matching procedure created a clean counterfactual as none of the mean differences of the selected variables of sample selection equation between treated and control group are statistically significant (Table 1). Conforming to the requirement of balancing test (Rosenbaum and Rubin, Reference Rosenbaum and Rubin1983), the Pseudo R 2 drops significantly to 7% from around 37% before matching (online Supplementary File Table S1). Further, insignificant P-values of the likelihood-ratio (LR) test and low Mean Standardized Bias (MSB) (below 20%) suggest that the specification of propensity is successful in terms of balancing the distribution of covariates between treated and control groups. Visual observation of Fig. 2 clearly indicates that there is considerable overlap of the distributions of the propensity scores for adopters and non-adopters after matching, suggesting that the assumption of common support holds firmly.
Relationship between the propensity score distribution and common support.

Production frontier results
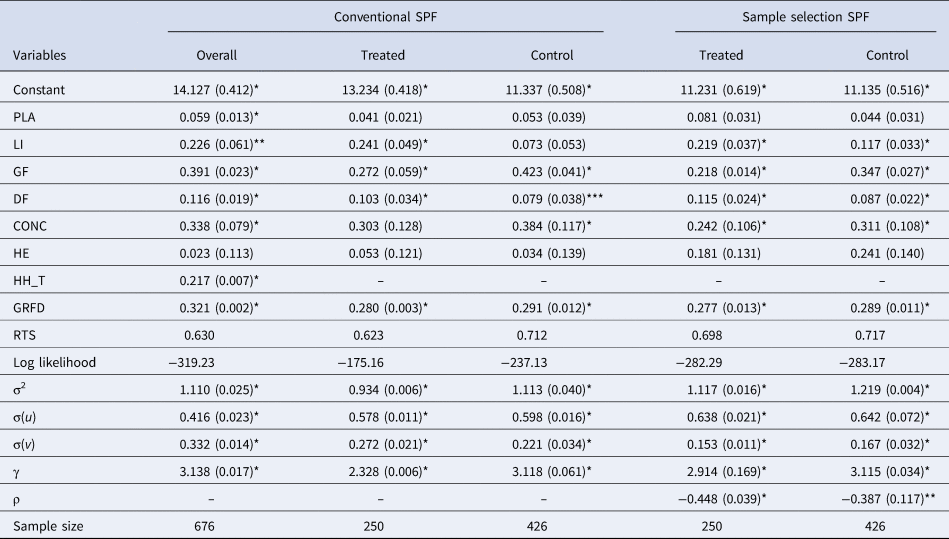
Table 2 provides the maximum likelihood estimates of the conventional and selectivity-corrected SPF models on the PSM subsample. We estimated separate frontiers for treated and control group because likelihood ratio test (Eq. 5) statistic of 81.43(P = 0.000) rejected the null hypothesis for technical homogeneity between beneficiaries and non-beneficiaries.
Parameter estimates of SPF model for matched sample

Note: Figures within the parentheses are standard errors.
 ${\rm \gamma } = {\rm \sigma }_{\rm u}^2 /( {{\rm \sigma }_{\rm u}^2 + {\rm \;\sigma }_{\rm v}^2 } ) $.
*P < 0.01, ** P < 0.05, *** P < 0.10.
Most of the estimated production elasticities coefficients were positive, though with varying magnitudes and significance level. The coefficient for the variable representing HH_T for the overall sample under conventional SPF indicates that fodder based project activities had direct and significance influence on milk productivity. In all the estimated models, green fodder and concentrate feeding and fodder acreage (GRFD) have highest elasticity value, indicating that their contribution in milk production efficiency is prominent. However, use of more concentrate also accentuates cost of feeding, therefore ensuring timely availability of sufficient quantity of green fodder is a cost effective way to enhance milk production efficiency, especially for small livestock holders.
The return to scale obtained by summing up all the partial production elasticities is consistently less than one for all the SPF models. This suggests that upward adjustments in the input usage by farmers will not result in the proportionate increase in milk productivity. The statistical significance of σ2 in all the cases indicates goodness of fit of the model. The gamma coefficients (γ) are also significantly different from zero at the 1% level, suggesting that technical inefficiency is indeed stochastic and that inefficiency causes variability in the observed output.
The coefficients of the correction term (ρ) in the sample selection SPF models are statistically different from zero for both the treated and control group, confirming the presence of selection bias due to unobservable factors (Villano et al., Reference Villano, Bravo-Ureta, Solís and Fleming2015; Abdulai and Abdulai, Reference Abdulai and Abdulai2017). Thus, frontier estimates from the conventional SPF models would be inconsistent and would in turn provide biased results for technical efficiency scores (Ma et al., Reference Ma, Renwick, Yuan and Ratna2018). Therefore, the estimation of separate SFPs for treated and control group under sample selection framework is justified in our case.
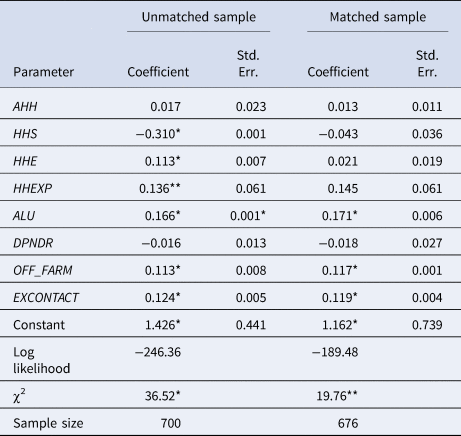
The empirical estimates of probit sample selection for both the unmatched and the matched samples are presented in Table 3. We rejected the null hypothesis of simultaneous zero value for all coefficients in both the matched and unmatched samples, therefore, the estimated coefficients of these two probit models are comparable. The lower numbers of statistically significant parameters in the case of matched samples are justified as PSM reduces the variability between the two groups (treated and control farmers) which affects the significance of the estimates. Table 1 clearly shows that after matching, treated and control groups are not systematically different in observed characteristics. Further, Table 3 shows that as the adult livestock unit increases by 1%, technical efficiency increases by about 0.17%. This could be because of economies of scale which implies that as the cattle size increases, a lower cost per production unit is obtained and better distribution of resources is gained. Off-farm income and exposure to extension and training activities have significant positive effect on efficiency of dairy farmers. Off-farm income relaxes liquidity constraints faced by the livestock keepers and helps in economizing the production. Contact with extension and training agencies facilitates the exchange of knowledge and experiences, highlights the availability of suitable technologies and also assists in efficient use of resources, which play decisive roles in improving efficiency. Our findings are in congruence with the results of Girma (Reference Girma2019).
Parameter estimates of the probit sample selection equation

*P < 0.01, ** P < 0.05.
Table 4 provides mean technical efficiency (TE) scores for all estimated models in Table 2 along with TE estimates from conventional SPF for unmatched sample. The average TE for treated group ranged from 55% to 59% and is higher than that of control group in all cases. The statistical difference in means indicates the prevalence of efficiency gap between beneficiaries and non-beneficiaries of the fodder-centered project activities. However, this gap expectedly narrows down after implementing matching technique as PSM controls for selection bias stemming from observable variables. Moreover, the sample selection SPF for the matched sample decreases the TE gap even further. These empirical estimates show that without the appropriate corrections for selection bias, technical efficiency tends to be underestimated and the gap in performance between treated farmers and their control counterparts would be overestimated. Our findings corroborate those of Bravo-Ureta et al. (Reference Bravo-Ureta, Greene and Solís2012) and Ma et al. (Reference Ma, Renwick, Yuan and Ratna2018), who also reported the parallel evidence of bias correction on TE differentials between treated and control groups.
Mean technical efficiency levels across SPF models

Note: Standard errors are in parentheses.
a t- test is used to determine if TE means are significantly different between the treated and control groups
b We also estimated mean TE for unmatched samples to present comparative results in Table 4.
*P < 0.01.
In conclusion, the empirical estimates of stochastic production frontier models show consistently higher average technical efficiency for beneficiary farmers than their control counterparts, though the presence of selectivity bias cannot be rejected. Technical efficiency ranges from 0.55 to 0.59 for beneficiaries group and from 0.41 to 0.48 for non-beneficiaries, depending on how biases were controlled. It is noteworthy that the average technical efficiency has increased for both the treated and control farmers and the gap between their mean TE scores narrowed down after correcting for selection bias stemming from observable and/or unobservable variables. Therefore, based on our results, we emphasize that unbiased estimation of the impact of development projects on technical efficiency of dairy production must take selection bias effects into account. The evidence of a significant and positive relationship between project activities in treated villages and daily milk productivity suggest that intensifying the dissemination of improved fodder-based activities would be highly beneficial in improving the livelihood of dairy farmers of semi-arid regions. Our finding that the households with more exposure to training and demonstrations and having more contact with extension agencies have greater efficiency provides crucial policy insights. Strengthening the extension services and training facilities, and increasing their outreach will go a long way in improving dairy production efficiency. Besides, mainstreaming practically oriented, participatory and interactive models like the farmer field school (FFS) program and encouraging frontline demonstrations by local research institutes, to impart training to the farmers on improved fodder production and conservation practices, would help to achieve the overall objective of inclusive economic growth in ecologically fragile regions like arid and semi-arid tropics.
Supplementary material
The supplementary material for this article can be found at https://doi.org/10.1017/S0022029922000759.
Acknowledgements
We express our sincere thanks to ICRISAT Development Center (IDC), Hyderabad for their support during implementation of the project.