Introduction
Rice is the world's leading food crop, playing a key role in food and nutrition security. The human population is growing at a rapid rate and expected to cross the margin of 9 billion by the middle of the twenty-first century (FAO, 2017). However, in recent years, there has been a decline in rice yield due to the influence of numerous biotic and abiotic stresses, which not only reduce crop yields but also have a negative impact on the livelihoods of farmers (Brar and Khush, Reference Brar, Khush, Tapan Kumar and Robert2018).
Phosphorous (P) is a major macronutrient required for plant growth and development as it is a major component of Adenosine triphosphate, the energy currency of the cell. Phosphorous deficiency in soil is recognized as an emerging global problem. According to an estimate, around 5.8 billion hectares of cultivable land worldwide are reported to be P deficient (Deng et al., Reference Deng, Luo, Chen, Zhou, Zhang, Hu and Xie2018). In India, 49.3, 48.8 and 1.9% of Indian soil have low, medium and high levels of available P (Hasan, Reference Hasan1996; Tiwari, Reference Tiwari2001). This might be attributed to the fact that major areas under rice cultivation, such as uplands and acidic soils, have a high P-fixing ability, resulting in decreased P availability in soils and hence, lower yields (Vance et al., Reference Vance, Uhde-Stone and Allan2003; Mahadeva swamy et al., Reference Mahadeva swamy, Anila, Ravindra, Bhadana, Anantha, Brajendra, Hajira, Balachiranjeevi, Laxmi Prasanna, Pranathi, Dilip, Bhaskar, Abhilash Kumar, Kousik, Harika, Swapnil, Rekha, Cheralu, Gouri Shankar, Reddy, Kumar, Balachandran, Madhav, Mahendra Kumar and Sundaram2019).
Phosphorous deficiency in the soil can be managed by adding P fertilizers to the soil. However, they add extra cost to the production and are responsible for environmental hazards. Thus, the development and deployment of rice cultivars that grow well even under low soil P conditions would be the most competent, reasonable and environmentally safe alternative for effective management of low soil P levels (Cordell et al., Reference Cordell, Drangert and White2009; Rose and Wissuwa, Reference Rose and Wissuwa2012; Mahadeva swamy et al., Reference Mahadeva swamy, Anila, Ravindra, Bhadana, Anantha, Brajendra, Hajira, Balachiranjeevi, Laxmi Prasanna, Pranathi, Dilip, Bhaskar, Abhilash Kumar, Kousik, Harika, Swapnil, Rekha, Cheralu, Gouri Shankar, Reddy, Kumar, Balachandran, Madhav, Mahendra Kumar and Sundaram2019).
Genetic variability for low soil P tolerance and P use efficiency has been well documented among different rice genotypes, including landraces and wild species (Fageria et al., Reference Fageria, Wright and Baligar1988; Fageria and Baligar, Reference Fageria and Baligar1997; Akinrinde and Gaizer, Reference Akinrinde and Gaizer2006; Mahadeva swamy et al., Reference Mahadeva swamy, Anila, Ravindra, Bhadana, Anantha, Brajendra, Hajira, Balachiranjeevi, Laxmi Prasanna, Pranathi, Dilip, Bhaskar, Abhilash Kumar, Kousik, Harika, Swapnil, Rekha, Cheralu, Gouri Shankar, Reddy, Kumar, Balachandran, Madhav, Mahendra Kumar and Sundaram2019). Progenitor of cultivated rice, O. rufipogon, is a potential source of genes and traits for low P tolerance (Lang and Buu, Reference Lang and Buu2006; Chen et al., Reference Chen, Chen, He, Zhu, Peng, He, Fu and Ouyang2011; Neelam et al., Reference Neelam, Thakur, Neha, Kumar, Dhaliwal and Singh2017). The exploitation of genetic variability present in wild Oryza to enhance the phosphorus acquisition efficiency and phosphorus use efficiency of modern rice cultivars is one of the plausible strategies to improve P deficiency tolerance of rice cultivars (Gamuyao et al., Reference Gamuyao, Chin, Tanaka, Pesaresi, Catausan, Dalid, Loedin, Mendoza, Wissuwa and Heuer2012).
A common method of identifying and selecting genotypes for stress tolerance is to grow breeding materials in a targeted stress environment and selecting individuals with greater yield potential (Ehlers and Hall, Reference Ehlers and Hall1998; Kamrani et al., Reference Kamrani, Hoseini and Ebadollahi2017). Nevertheless, it is necessary to test breeding materials under both stress and normal conditions for the identification of lines that perform relatively well under stress and normal conditions. Different selection criteria have been proposed for the identification of the best genotypes for stress and normal conditions. One such criterion was based on the use of selection indices (Clarke et al., Reference Clarke, De-Pauw and Townley-Smith1992). Different stress indices, such as stress tolerance index (STI), tolerance index (TOL), yield reduction ratio (YR), stress susceptibility index (SSI), yield stability index (YSI), yield index (YI), per cent yield reduction (PYR) and geometric mean productivity (GMP) were previously utilized by Mollasadeghi et al. (Reference Mollasadeghi, Valizadeh, Shahryariand and Imani2011). Ashraf et al. (Reference Ashraf, El-Mohsen, Abd El-Shfi, Gheith and Suleiman2015) performed drought tolerance assessment using these indices in different crops. Singh et al. (Reference Singh, Sengar, Kulshreshtha, Datta, Tomar, Rao, Garg and Ojha2015) used these indices for the assessment of salinity tolerance in durum wheat. Rameeh (Reference Rameeh2015) deployed these indices for the identification of nitrogen deficiency tolerant genotypes in rapeseed. Khan and Mohammad (Reference Khan and Mohammad2016) utilized these indices in wheat to assess nitrogen tolerance. However, the number of studies involving the deployment of stress tolerance indices for the identification of low P tolerant rice cultivars is rather limited (Li et al., Reference Li, Luo, Wang, Yang and Yang2005, Reference Li, Xu, Li, Guo, Wang and Yang2015; Mahadeva swamy et al., Reference Mahadeva swamy, Anila, Ravindra, Bhadana, Anantha, Brajendra, Hajira, Balachiranjeevi, Laxmi Prasanna, Pranathi, Dilip, Bhaskar, Abhilash Kumar, Kousik, Harika, Swapnil, Rekha, Cheralu, Gouri Shankar, Reddy, Kumar, Balachandran, Madhav, Mahendra Kumar and Sundaram2019). With this background, in the present study, we developed introgression lines of O. rufipogon in the background of the popular rice cultivar of southern India, Samba Mahsuri, and systematically screened these populations in the low soil P plot and normal soil P plot at the Indian Council of Agricultural Research-Indian Institute Rice Research (ICAR-IIRR), Hyderabad, India, to identify ideal selection indices for selection of best introgression lines, which perform relatively well under low soil P condition, normal condition or both.
Materials and methods
Plant material
A BC2F3 population containing 40 introgression lines, derived from a cross between low P sensitive cultivar (Samba Mahsuri) as the recipient parent and O. rufipogon (Acc. IR72046-B-R-3-2-1) as the donor parent, was used in the present study.
Screening for low soil P tolerance
The experiment was carried out at ICAR-IIRR, Hyderabad, India, which is located at an altitude of 542.3 m above mean sea level, 17°19′ North and 78°23′ East, and positioned in the southern zone of Telangana state, India. The experiment was performed during two growing seasons, that is, wet season 2019 (June–November) and dry season 2019 (December–May) [hereafter WS-2019 and DS-2019, respectively] in a specialized experimental plot of the ICAR-IIRR, Hyderabad, which has graded levels of P (online Supplementary Table S1). The low P plot at ICAR-IIRR was developed by not applying P for a quite long time (>20 years). At present, the available P (that is, Olsen P) in this plot is estimated to be <2 kg/ha.
The seeds were sown in a nursery bed and 21-day old seedlings were transplanted to the main field. The seeds were planted following a spacing of 20 cm × 10 cm in a Randomized Complete Block Design with two replications. No P fertilizer was applied to the low soil P plot. However, the recommended dose of P fertilizer was applied to a normal soil P plot (P: 60 kg/ha). Other essential nutrients like nitrogen (100 kg/ha) and potash (40 kg/ha) were applied as per recommended agronomic practices to raise a good crop.
The yield per plant (g) was recorded by taking an average of five individual plants in each introgression line in each replication. The grain yield per plant from stress condition (YS) and normal condition (YP) was used to estimate P stress indices.
1. Stress Tolerance Index -
 ${\rm STI} = {\rm Y}_{\rm P}{\rm Y}_{\rm S}/( {\overline {{\rm Y}_{\rm P}} } ) ^2$ (Fernandez, Reference Fernandez1992)
2. Tolerance Index- TOL = YP − YS (Rosielle and Hamblin, Reference Rosielle and Hamblin1981)
3. Stress Susceptibility Index-
${\rm SSI} = ( {1-{\rm Y}_{\rm S}/{\rm Y}_{\rm P}} ) / ( {1-{\bar{{\rm Y}}}_{\rm S}/{\bar{{\rm Y}}}_{\rm P}} ) $ (Fischer and Maurer, Reference Fischer and Maurer1978)4. Yield Stability Index- YSI = YS/YP (Bouslama and Schapaugh, Reference Bouslama and Schapaugh1984)
5. Yield Reduction Ratio - YR = 1 − (YS/YP) (Golestani-Araghi and Assad, Reference Golestani-Araghi and Assad1998)
6. Yield Index -
${\rm YI} = {\rm Y}_{\rm S}/\bar{{\rm Y}}_{\rm S}$ (Gavuzzi et al., Reference Gavuzzi, Rizza, Palumbo, Campaline, Ricciardi and Borghi1997)7. Per cent yield reduction- PYR = ((YP − YS)/YP) × 100 (Yaseen and Malhi, Reference Yaseen and Malhi2009)
8. GMP = (YP × Ys) 0.5 (Fernandez, Reference Fernandez1992)


Where, YS is the grain yield of genotypes under low soil P condition, YP is the grain yield of genotypes under normal soil P condition,  $\bar{{\rm Y}}_{\rm S}$ and
 $\bar{{\rm Y}}_{\rm P}$ are the mean grain yield of all genotypes under low soil P and normal soil P conditions.
Statistical analysis
Stress indices were estimated for each season. Genotype × season interaction effect and combined analysis of variance (ANOVA) were calculated between stress indices and grain yield using SAS 9.2 (SAS version 9.2 software package, SAS Institute, Inc.; Cary, NC). Correlation coefficients were estimated between stress tolerance indices and grain yield using Past 4.0 (Hammer et al., Reference Hammer, Harper and Ryan2001). The biplots of principal component analysis (PCA) were analysed using Past 4.0 (Hammer et al., Reference Hammer, Harper and Ryan2001). The introgression lines were then grouped into low P tolerant and sensitive type through cluster analysis (DARwin6; Perrier and Jacquemoud-Collet Reference Perrier and Jacquemoud-Collet2006) using Euclidean distance, with Unweighted Pair Group Method using Arithmetic means (UPGMA) based on stress tolerance indices and yield. Box plots were drawn to visualize variability for different stress indices among introgression lines using Past 4.0 (Hammer et al., Reference Hammer, Harper and Ryan2001).
Results
The study of combined ANOVA revealed significant consequences of P stress on grain yield in rice (online Supplementary Table S2). The mean sum of squares due to genotypes was significant for all the stress indices for grain yield under stress and normal conditions. Significant variation in grain yield and all other stress indices was observed across growing seasons, except for YI. Significant genotype × season interaction was observed for grain yield and all the indices, except STI, YSI, YR and YI. The variability for different stress indices was exemplified through box plots (online Supplementary Fig. S1), where all the nine stress tolerance indices exhibited high variability in both seasons. Introgression lines showed a wide range of variation for stress indices like YP, STI, TOL and YSI.
P stress tolerance indices
In the present study, different stress indices, such as STI, TOL, SSI, YSI, YR, YI, PYR and GMP, were computed based on yield under low P condition and normal condition (Tables 1 and 2). The highest and the lowest values for STI was recorded for IL-24 (0.98) and IL-13 (0.07), respectively. Sensitive check Samba Mahsuri and tolerant check Swarna recorded STI values of 0.18 and 0.61, respectively, during WS-2019. Similarly, during DS-2019, maximum and minimum values for STI were recorded by IL-24 (0.76) and IL-13 (0.06), respectively. Furthermore, sensitive check Samba Mahsuri and tolerant check Swarna recorded STI values of 0.12 and 0.33, respectively, during DS-2019. Minimum and maximum values for TOL were observed for IL-27 (3.57) and IL-21 (22.38), respectively. Tolerant check Swarna and sensitive check Samba Mahsuri recorded TOL values of 20.19 and 18.08, respectively, during WS-2019. IL-11 (1.19) and IL-14 (34.39) recorded the lowest and highest TOL values, respectively, during DS-2019. Susceptible check Samba Mahsuri and tolerant check Swarna recorded TOL values of 17.76 and 18.92, respectively, during DS-2019. Lower and higher values for SSI were recorded for IL-27 (0.36) and IL-21 (1.5), respectively, whereas checks Samba Mahsuri and Swarna recorded SSI values for 1.42 and 1.10, respectively. On the other hand, IL-11 (0.2) and IL-14 (1.41) recorded the highest and lowest TOL values during DS-2019. YSI values were lowest and highest for IL-21 (0.13) and IL-27 (0.79), respectively. Check Samba Mahsuri and Swarna recorded YSI values of 0.16 and 0.35, respectively, during WS-2019. IL-14 (0.11) and IL-11 (0.88) recorded minimum and maximum values for YSI, respectively. Samba Mahsuri and Swarna recorded YSI values of 0.12 and 0.33, respectively, during DS-2019. The yield reduction (YR) was lowest and highest for IL-27 (0.21) and IL-21 (0.87), respectively. YR values of 0.83 and 0.65 were noted for Samba Mahsuri and Swarna checks, respectively, during WS-2019. The YI value was highest and lowest for IL-29 (1.8) and IL-16 (0.32), respectively. Check Samba Mahsuri and Swarna recorded YI values of 0.41 and 1.15, respectively, during WS-2019. IL-11 (0.12) and IL-14 (0.89) recorded maximum and minimum YI values, respectively, during DS-2019. The lowest and highest values of PYR index were recorded for IL-27 (21.04) and IL-21 (86.81), respectively, during WS-2019, whereas IL-11 (12.42) and IL-14 (89.05) recorded minimum and maximum values for PYR, respectively, in DS-2019. IL-24 exhibited high GMP index values during both WS-2019 and DS-2019, whereas IL-13 and IL-16 recorded the lowest GMP values during both WS-2019 and DS-2019.
Low P tolerance indices and grain yield of introgression lines under non-stress and stress conditions during wet season 2019

Low P tolerance indices and grain yield of introgression lines under non-stress and stress conditions during dry season 2019

Association between grain yield and stress tolerance indices
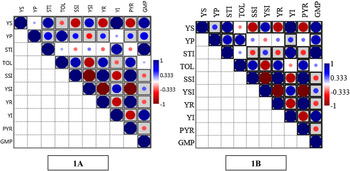
Correlation coefficients between grain yield and P stress indices were analysed for both the seasons (Table 3; Fig. 1(A) and (B)). Grain yield under stress (Ys) was positively associated with YP (r = 0.39* and r = 0.41**), STI (r = 0.89** and r = 0.86**), YSI (r = 0.77** and r = 0.74**), YI (r = 1.0** and r = 1.0**) and GMP (r = 0.88** and r = 0.86**) and negatively associated with SSI (r = −0.77** and r = −0.74**), YR (r = −0.77** and r = −0.73**) and PYR (r = −0.77** and r = −0.74**) in both WS-2019 and DS-2019, respectively. YS and TOL had negative and non-significant association (r = −0.25 and r = −0.33) in both WS-2019 and DS-2019, respectively. Similarly, grain yield under normal condition (YP) exhibited positive significant association with STI (r = 0.74** and r = 0.60**), TOL (r = 0.79** and r = 0.87**), SSI (r = 0.41** and r = 0.44**) and YI (r = 0.39* and r = 0.41**). YP exhibited a positive non-significant association with YR (r = 0.26 and r = 0.28) and PYR (r = 0.26 and r = 0.28). YP exhibited a negative non-significant association with YSI (r = −0.26 and r = −0.28) in both WS-2019 and DS-2019, respectively.
Correlation coefficient between grain yield of introgression lines under non-stress (Yp) and stress (Ys) conditions and low P tolerance indices

Note: WS-2019, wet season 2019; DS-2019, dry season 2019; Ys, yield under stress; YP, yield under non-stress; STI, stress tolerance index; SSI, stress susceptibility index; YR, yield reduction ratio; YI, yield index; PYR, per cent yield reduction; GMP, geometric mean productivity.
*Significant at 0.05 levels of probability, **Significant at 0.01 levels of probability, NS, non-significant.
(A) Correlogram depicting the association between grain yield under phosphorus stress (Ys), normal (Yp) conditions and stress tolerance indices during WS-2019, (B) Correlogram depicting association between grain yield under phosphorus stress (Ys), normal (Yp) conditions and stress tolerance indices during DS-2019. Size of circle indicates the strength of association, bigger the circle stronger the association Vice versa, Circle with boxes indicates a significant association, circle without boxes is non-significant. Note: YS, yield under low soil P condition; YP, yield under normal soil P condition; STI, stress tolerance index; TOL, tolerance index; SSI, stress susceptibility index; YSI, yield stability index; YR, yield reduction ratio; YI, yield index; PYR, per cent yield reduction; GMP, geometric mean productivity.

Principal component analysis
PCA was performed to discern the per cent contribution of major components and indices towards the total variance using grain yield under both conditions and P stress tolerance indices (Table 4). The first two (PC1 and PC2) components were considered based on the eigenvalues that are greater than or equal to 1. In WS-2019, both PC1 and PC2 together explained 99.99% of the total variation. While in DS-2019, PC1 and PC2 together accounted for 99.6% of the total variation (online Supplementary Tables S3 and S4). The first principal component (PC1) exhibited a high positive correlation with GMP (0.75 and 0.77) in both WS-2019 and DS-2019, respectively. Among all the stress indices, GMP accounted for the highest variation in both WS-2019 and DS-2019, respectively.
Results of principal component analysis for grain yield of introgression lines under non-stress (Yp) and stress (Ys) conditions and low P tolerance indices

Note: PC, principal component; YS, yield under low soil P (Stress) condition; YP, yield under normal/sufficient soil P condition; STI, stress tolerance index; TOL, tolerance index; SSI, stress susceptibility index; YSI, yield stability index; YR, yield reduction ratio; YI, yield index; PYR, per cent yield reduction; WS-2019, wet season 2019; DS-2019, dry season 2019.
Clustering of introgression lines along with tolerant and sensitive checks
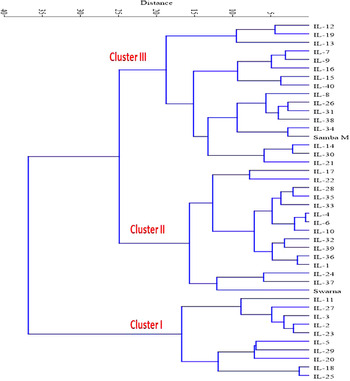
Cluster analysis was carried out to group the introgression lines based on yield under both conditions and all other stress tolerance indices. A dissimilarity matrix was constructed using Euclidean distance and the clustering was carried out following the UPGMA employing DARwin6.0 (Fig. 2). The lines were clustered into three clusters. Cluster-I comprised ten introgression lines (IL-11, IL-27, IL-3, IL-2, IL-2, IL-5, IL-29, IL-20, IL-18, and IL-25). Cluster-II comprised 14 introgression lines and a tolerant check Swarna, while cluster-III contained 15 introgression lines (IL-21, IL-30, IL-14, IL-34, IL-38, IL-31, IL-26, IL-8, IL-40, IL-15, IL-16, IL-9, IL-7, IL-13, IL-19 and IL-12) and sensitive check Samba Mahsuri, which are intolerant to low soil P.
Clustering of introgression lines and check genotypes based on stress tolerance indices. Cluster-I comprised ten introgression lines, cluster-II comprised 14 introgression lines and tolerant check Swarna and cluster III contained 16 introgression lines and sensitive check Samba Mahsuri.

Discussion
Phosphorus (P) is a key macronutrient indispensable for normal growth and all metabolic functions. Furthermore, it plays a significant role in energy transfer, signalling process, photosynthesis, and respiration. The deficiency of P is a widespread problem. Globally, about 5.8 billion hectares of cultivable lands are deficient in P (Deng et al., Reference Deng, Luo, Chen, Zhou, Zhang, Hu and Xie2018). Thus, breeding rice tolerance to low soil P has assumed great significance across the world including India.
During domestication and selection from wild rice to cultivated rice, the number of alleles of cultivated rice reduced by 50–60% compared to wild rice (Deng et al., Reference Deng, Luo, Chen, Zhou, Zhang, Hu and Xie2018) and further genetic diversity reduced by the practice of elite × elite crosses in most of the rice breeding programmes (Basavaraj et al., Reference Basavaraj, Gireesh, Muralidhara, Manoj, Anantha and Damodar Raju2020, Reference Basavaraj, Muralidhara, Manoj, Anantha, Rathod, Damodar Raju, Senguttuvel, Madhav, Srinivasprasad, Prakasham, Basavaraj, Badri, Subbarao, Sundaram and Gireesh2021).
ANOVA revealed significant consequences of P stress on grain yield in rice. Mean sum of squares for all the stress indices for grain yield were significant for all genotypes under stress and normal conditions, demonstrating the diverse nature of low soil P tolerance in the introgression lines. Significant variation across growing seasons for grain yield and all other stress indices, except for YI, revealed that season effect (photoperiod, relative humidity, temperature, and precipitation) on plant growth and development. Significant genotype × season interaction was observed for grain yield and all the indices studied, except STI, YSI, YR and YI.
One of the main tasks for any plant breeder is the identification and selection of genotypes that perform well under the stress conditions from the available variability in the germplasm. Several criteria have previously been developed and used by breeders to aid the selection process. One such criterion is based on their performance under stress and normal conditions with the help of selection indices (Kamrani et al., Reference Kamrani, Hoseini and Ebadollahi2017).
TOL is the difference in grain yield under stress (YS) and normal (YP) conditions (Rosielle and Hamblin, Reference Rosielle and Hamblin1981). In our study IL-27, IL-2, IL-3 and IL-11 recorded low TOL values. A low TOL index indicates a higher level of tolerance to stress. However, selection based on TOL alone leads to the selection of genotypes with low yield potential under non-stress and high yield potential under stress conditions (Fernandez, Reference Fernandez1992). Low TOL does not imply a high yielding genotype. Grain yield should be taken into consideration along with these indices.
Based on SSI and YSI, IL-27 was found to be tolerant to low soil P. IL-27 performed well under both conditions, while IL-11 exhibited relatively high yield under stress condition and intermediate yield under normal condition. This finding suggested that SSI and YSI were able to identify genotypes with higher yields under soil P stress conditions rather than under normal conditions. According to Guttieri et al. (Reference Guttieri, Stark, Brien and Souza2001), SSI greater than one indicates above-average susceptibility, whereas SSI less than one indicates below-average susceptibility. GMP is another index that is often used for evaluating stress-tolerant genotypes by breeders interested in relative performance. STI is an advanced index used to identify high-yielding genotypes under stress and normal conditions based on YP, YS and ῩP (Fernandez, Reference Fernandez1992). Hence, STI and GMP are better indices than TOL and SSI in discriminating sensitive and tolerant genotypes (Ramirez and Kelly, Reference Ramirez and Kelly1998). IL-24, IL-29 and IL-32 recorded the highest values for STI and GMP. Thus, they were identified as the most stable and productive genotypes among the introgression lines under both conditions.
It is expected that genotypes/lines with high STI values are more tolerant to stress conditions (Fernandez, Reference Fernandez1992; Ashraf et al., Reference Ashraf, El-Mohsen, Abd El-Shfi, Gheith and Suleiman2015). In our study, tolerant check Swarna, IL-24, IL-29, IL-32 and IL-37 recorded higher STI than sensitive check Samba Mahsuri (Tables 1 and 2).
TOL values assist in selecting the genotypes under stress and normal conditions; rice genotypes with a lower value of this index are expected to be more stable performers under both P deficient and P sufficient conditions (Rosielle and Hamblin, Reference Rosielle and Hamblin1981; Singh et al., Reference Singh, Sengar, Kulshreshtha, Datta, Tomar, Rao, Garg and Ojha2015). A high value of YI for ILs indicated that these lines were tolerant to stress conditions (Gavuzzi et al., Reference Gavuzzi, Rizza, Palumbo, Campaline, Ricciardi and Borghi1997; Ashraf et al., Reference Ashraf, El-Mohsen, Abd El-Shfi, Gheith and Suleiman2015; Singh et al., Reference Singh, Sengar, Kulshreshtha, Datta, Tomar, Rao, Garg and Ojha2015). Higher values of YI were noticed for IL-29, IL-5, IL-32, IL-27, IL-3, IL-24, IL-10, IL-39, IL-20 and tolerant check Swarna compared to sensitive check Samba Mahsuri. IL-11, IL-27, IL-3, IL-2, IL-23, IL-5, IL-18, IL-29 and IL-25 registered lower PYR (<41%), whereas tolerant check Swarna recorded 51.98% PYR. Hence, these ILs were more tolerant of low soil P than lines with a higher PYR. Yaseen and Malhi (Reference Yaseen and Malhi2009) recorded 0–32% per cent yield loss in low soil stress compared to normal soil P conditions in rice.
The diverse stress indices resulted in the identification of different lines as tolerant and susceptible to low soil phosphorous stress, which created confusion in the selection of genotypes based on a single criterion. Thus, to determine the most appropriate stress indices, correlation co-efficient between grain yields under both conditions and P stress indices were analysed for both the seasons (Table 3; Fig. 1(A) and (B)). A positive significant association was observed between YS and YP, which indicated that high yielding and tolerant genotypes can be selected based on their performance under both stress and normal conditions. Genotypes with high yield potential will be more productive under P stress condition. Similar findings were previously reported in wheat by Aghaei-Sarbarze et al. (Reference Aghaei-Sarbarze, Mohammadi, Haghparast and Rajabi2009) and Kamrani et al. (Reference Kamrani, Farzi and Ebadi2015). A significant positive correlation was noticed between STI and grain yields indices under stress condition and normal condition in both seasons, revealing the significance of STI as a vital criterion for the selection of lines with good yield under both soil P stress and normal conditions. TOL had a non-significant negative association with grain yield under P stress condition and a positive significant association with grain yield under the normal condition. Hence, selection based on SSI and TOL will increase grain yield under normal soil P conditions but reduce it under low soil P conditions. These results were analogous to those described by Mohammadi et al. (Reference Mohammadi, Armion, Kahrizi and Amri2010) and Kamrani et al. (Reference Kamrani, Farzi and Ebadi2015) in wheat.
PCA was computed using the stress tolerance indices and grain yield under both conditions, which resulted in several linear combinations of these indices that accounted for most of the variability in the data (Table 4). Taking into account eigenvalues higher than or equal to 1.0, the first two components together explained more than 99.99% of the variation in the low soil P tolerance indices. The first component (PC1) explained 90.80% and 89.6% of the total variation and exhibited a high positive correlation with YS, STI, GMP, and YSI in both WS-2019 and DS-2019, respectively. Therefore, PC1 was considered as a high yield potential and low soil P tolerance component. The second component (PC2) explained 9.2% and 10.4% of the total variation and had a positive correlation with YP, TOL and SSI. Hence, it was named as a soil P stress susceptibility component. Bahrami et al. (Reference Bahrami, Arzani and Karimi2014) and Dorostkar et al. (Reference Dorostkar, Dadkhodaie and Heidari2015) followed a similar approach to categorize PC1 and PC2 based on their correlation with YS, YP and stress tolerance indices. Kaya et al. (Reference Kaya, Palta and Taner2002) suggested that stable genotypes possess higher PC1 and lower PC2 values. Based on the first two principal components (PC1 and PC2), a biplot was drawn to compare genotypes as well as the interrelationships among stress tolerance indices (online Supplementary Figs. S2 and S3). Thus, the genotypes that possess high PC1 and low PC2 are suitable for both stress and non-stress conditions. Therefore, IL-24, IL-29 and IL-32 were superior for both conditions. Conversely, IL-13 and IL-16 possessed low PC1 and high PC2 values and were identified as susceptible genotypes. Cluster analysis grouped introgression lines into three clusters based on yield under stress condition, yield under normal condition, and stress tolerance indices. The first cluster contained ten introgression lines (which exhibited <43 PYR, low SSI, low YR and high YI values). Group II consisted of 14 introgression lines and tolerant check Swarna. These lines showed 51–68% YR under low soil P. Similarly, cluster III contained 13 introgression lines and sensitive check Samba Mahsuri, which were intolerant to low soil P (Fig. 2). A similar approach of classification of rice germplasm to low soil P was previously employed by Mahadeva swamy et al. (Reference Mahadeva swamy, Anila, Ravindra, Bhadana, Anantha, Brajendra, Hajira, Balachiranjeevi, Laxmi Prasanna, Pranathi, Dilip, Bhaskar, Abhilash Kumar, Kousik, Harika, Swapnil, Rekha, Cheralu, Gouri Shankar, Reddy, Kumar, Balachandran, Madhav, Mahendra Kumar and Sundaram2019).
Conclusion
Phosphorus (P) is an essential macronutrient required for the normal growth and development of rice. Phosphorus deficiency results in a significant decline in productivity. One of the best and viable eco-friendly approach to rectify P deficiency is the development and deployment of low P tolerant rice genotypes. In breeding programs, for the development of cultivars having low soil P tolerance, selection should be based on the tolerance indices calculated from the grain yield under both conditions. According to the results of multivariate analysis (correlation, PCA, and clustering analysis), STI, YSI and GMP exhibited strong correlation with YP and YS. Therefore, they appear to be the most effective stress indices for the selection of genotypes with good yield potential under stress and normal conditions. These indices serve as valuable selection criteria for the identification of low P tolerant cultivars from both stress and normal conditions. Based on these indices, introgression lines IL-24, IL-29 and IL-32 were identified as promising lines for both environments. These introgression lines were more tolerant because of low grain yield loss under stress conditions and were identified as low soil P tolerant lines. Hence, these pre-breeding introgression lines can be used for the genetic improvement of rice cultivars to enhance their low soil P tolerance across the world.
Supplementary material
The supplementary material for this article can be found at https://doi.org/10.1017/S1479262121000381.
Acknowledgements
Authors are grateful to the Indian Council of Agricultural Research and ICAR-Indian Institute of Rice Research.
Author contributions
BPS, MB, MCA, IVG, HM and AV carried out research and prepared manuscript; GC and MSA conceptualized, guided and edited the manuscript; SP and RMS edited the manuscript. All authors read and approved the final manuscript.
Conflict of interest
The authors declare no potential conflicts of interests.