1. Introduction
Birds have evolved to efficiently transfer energy from the surrounding environment to improve their flight performance and manoeuvrability. An albatross exploits energy from the velocity gradients of the oceanic boundary layer through dynamic soaring (Denny Reference Denny2009), and numerous kinds of birds take advantage of the spatial and temporal gradients of the atmospheric gust to remain aloft without flapping their wings. Thermals and the upward draft created by the topology provide additional sources of energy (Weimerskirch et al. Reference Weimerskirch, Chastel, Barbraud and Tostain2003). Recently, there have been several attempts to understand the coupling between the flight mechanics and the underlying fluid dynamics to improve unsteady flight performance of unmanned or micro air vehicles (MAVs). Lissaman (Reference Lissaman2005) considered small vehicles whose flight speed is comparable to atmospheric wind variations. The lift-to-drag ratio was found to be the primary parameter for achieving neutral energy cycles for a vehicle flying through a sinusoidal vertical gust (Lissaman & Patel Reference Lissaman and Patel2007), and a state feedback controller that measures current wind speed and its gradient has shown energy gains for both sinusoidal and turbulent gusts (Langelaan Reference Langelaan2009). However, in each of these studies, the models were based on quasi-steady flow approximations where the forces are determined by the instantaneous state of the flow through a static map. Recent studies, discussed more fully below, cast doubt upon this approximation.
While classical unsteady potential flow models effectively describe the dynamical effects on fluid forces through the added mass and trailing-edge Kutta condition (Theodorsen Reference Theodorsen1935; von Karman & Sears Reference von Karman and Sears1938; Greenberg Reference Greenberg1947; Tchieu & Leonard Reference Tchieu and Leonard2011), these cases are restricted to small changes in velocity at low angle of attack (
 ${\it\alpha}$
) and high Reynolds number (
 $\mathit{Re}$
), and no comprehensive theory is available for higher angles when the flow separates. MAVs, in particular, are vulnerable to flow separation since laminar boundary layers are less resistant than turbulent boundary layers to the adverse pressure gradient, and small-scaled vehicles would experience separations more frequently than conventional aircraft.
Unsteadiness in conventional air vehicles is considered a defect since the unsteady motion can lead to separation, instabilities, and flow–structure interactions that are difficult to control. However, with clear understanding of the flow, unsteady effects associated with separations can be utilized to improve manoeuvrability and performance of MAVs (Pesavento & Wang Reference Pesavento and Wang2009). The unsteady motion associated with flapping flight of insects and birds produces much higher lift than the corresponding steady case (Ellington et al. Reference Ellington, Van Den Berg, Willmott and Thomas1996), and a number of studies have focused on this topic to understand the corresponding flow structures (Dickinson & Gotz Reference Dickinson and Gotz1993; Ellington et al. Reference Ellington, Van Den Berg, Willmott and Thomas1996; Wang Reference Wang2005; Pesavento & Wang Reference Pesavento and Wang2009), which could be potentially useful for MAVs. The presence of a leading-edge vortex (LEV) was found to be essential for providing sufficient lift in insect flight (Dickinson & Gotz Reference Dickinson and Gotz1993; Ellington et al. Reference Ellington, Van Den Berg, Willmott and Thomas1996) and the aerodynamic power required in flapping motions was reduced by capturing its own wake that was generated in the previous stroke cycle (Pesavento & Wang Reference Pesavento and Wang2009). The interaction between the wing and the previously shed vortices, sometimes termed ‘wake capture’ when the wing exploits energy from the shed vortices, is also a mechanism to enhance lift during its occurrence. The shed LEV may immediately move far from the wing without causing any notable changes to the force history, or stay close to the airfoil so that the airfoil can take advantage of the low-pressure region induced by the LEV.
LEV growth and shedding alters the mean and fluctuating forces. Gursul & Ho (Reference Gursul and Ho1992) and Gursul, Lin & Ho (Reference Gursul, Lin and Ho1994) examined a NACA 0012 airfoil immersed in a temporally varying free-stream, and the peak time-averaged lift occurred at a frequency associated with the shed LEV, inducing high pressure gradients normal to the wing during the retreating portion of the cycle. A similar time-averaged behaviour of lift has been investigated for transverse airfoil motions (Andro & Jacquin Reference Andro and Jacquin2009; Cleaver et al.
Reference Cleaver, Wang, Gursul and Visbal2011; Calderon, Wang & Gursul Reference Calderon, Wang and Gursul2013; Cleaver, Wang & Gursul Reference Cleaver, Wang and Gursul2013), and the peak occurred at a frequency where the shed LEV remained close to the airfoil during its convection. Less attention has been given to the fluctuating forces for harmonic airfoil motions. Choi, Colonius & Williams (Reference Choi, Colonius and Williams2013) numerically investigated the unsteady flow structures that are associated with the amplification and attenuation of the fluctuating lift at low Reynolds number, and similar flow structures have also been observed at a higher
 $\mathit{Re}$
(Granlund et al.
Reference Granlund, Monnier, Ol and Williams2014).
In this paper, we numerically investigate the flow structures and mean and fluctuating lift for streamwise (surging) and transverse (plunging) oscillating airfoils at low Reynolds number. Two-dimensional flows are simulated using the immersed boundary fractional step method (Taira & Colonius Reference Taira and Colonius2007; Colonius & Taira Reference Colonius and Taira2008) and we restrict the Reynolds number to
 $\mathit{Re}=O(10^{2})$
, such that, depending on the specific values of
 ${\it\alpha}$
and
 $\mathit{Re}$
, the flow can be subcritical, steady or supercritical, with respect to the usual wake instability associated with a bluff body. We understand that, even for an infinite-aspect-ratio wing, the two-dimensional flow assumption is not adequate to describe the transition of the wake that would occur at some of the supercritical values of
 $\mathit{Re}$
we consider. However, a complete description of the bifurcations to three-dimensional flow in this geometry, especially in unsteady flow, is lacking and, despite the simplifications, the qualitative agreement between our results and experiments at much higher
 $\mathit{Re}$
leads us to believe that the mechanisms are the same.
2. Problem set-up and numerical method
The immersed boundary fractional-step method (IBFS) (Taira & Colonius Reference Taira and Colonius2007; Colonius & Taira Reference Colonius and Taira2008) has been implemented to solve a two-dimensional incompressible flow in the (non-inertial) reference frame of the body. The method solves the vorticity–stream function formulation of the Navier–Stokes equations and the body is represented by a discrete set of forces that are in turn regularized on a Cartesian grid to enforce the no-slip condition. The computational domain extends to 32 and 48 chord lengths in the transverse and streamwise directions, respectively, and truncates the vorticity field with zero Dirichlet boundary conditions. Multiple grid resolutions are used for computational efficiency, and convergence tests were performed on a
 $480\times 320$
and
 $960\times 640$
grid resolution over the finest grid level. The
 $240\times 160$
grid resolution was sufficient for most of the cases reported. For the highest
 $\mathit{Re}$
we used the finer grid. The time steps were chosen based on the CFL condition, which we set to be less than 0.5.
We model the airfoil as a thin flat plate; the IBFS method regularizes (smears) the thickness of the plate to a few grid cells. We have also investigated the response of a NACA 0006 airfoil; the results were substantially the same for both airfoils and in what follows, we only present results for the thin flat plate. The angle of attack of the airfoil (
 ${\it\alpha}$
) is varied between
 ${\it\alpha}=5^{\circ }$
and 20°. For the thin airfoil at low Reynolds number, the flow separates at the leading edge at
 ${\it\alpha}=15^{\circ }$
and 20°, but remains attached for the 5° case.
The
 $x$
and
 $y$
components of the motion of the body are specified as
 $$\begin{eqnarray}\displaystyle & u=U\left(1+{\it\sigma}_{x}\sin \left({\it\omega}t\right)\right)=U\left(1+{\it\sigma}_{x}\sin \left(2ktU/c\right)\right), & \displaystyle\end{eqnarray}$$
 $$\begin{eqnarray}\displaystyle & v=U{\it\sigma}_{y}\sin \left({\it\omega}t+{\it\theta}\right)=U{\it\sigma}_{y}\sin \left(2ktU/c+{\it\theta}\right), & \displaystyle\end{eqnarray}$$
 $k$
is the reduced frequency
 $(={\rm\pi}\,f\,c/U)$
,
 $U$
is the mean velocity of the vehicle in the streamwise direction,
 $U{\it\sigma}_{x}$
and
 $U{\it\sigma}_{y}$
are the fluctuating velocities in the
 $x$
(streamwise, surging) and
 $y$
(transverse, plunging) directions, respectively, and
 ${\it\theta}$
is the phase between plunge and surge. In this paper, we consider surging and plunging separately, so
 ${\it\theta}$
is not used. The normalized velocity amplitude,
 ${\it\sigma}$
, is set to a constant as we increase the frequency, and, as a result, the amplitude of the motion decreases with increasing reduced frequency. We also note that when (typically plunging) motions are characterized by a peak-to-peak displacement,
 $A$
, then the Strouhal number
 $\mathit{St}_{A}$
is related to
 ${\it\sigma}$
by
 $\mathit{St}_{A}={\it\sigma}/{\rm\pi}$
. Plunging involves oscillations in both the speed and the effective angle of attack,
 ${\it\alpha}_{e}$
, given by
 $$\begin{eqnarray}{\it\alpha}_{e}={\it\alpha}+\tan ^{-1}\left(\frac{{\it\sigma}_{y}U\sin {\it\omega}t}{U}\right)={\it\alpha}+\tan ^{-1}({\it\sigma}_{y}\sin {\it\omega}t),\end{eqnarray}$$
and the variation of
 ${\it\alpha}_{e}$
is bounded by
 ${\it\sigma}_{y}$
.
These unsteady airfoil motions can, in the present case, be reinterpreted as a temporally varying free-stream velocity, representing a uniform stream with an oscillatory gust in the streamwise and transverse directions. This is because the apparent buoyancy force,
 ${\it\rho}\dot{\boldsymbol{u}}V_{b}$
, where
 ${\it\rho}$
is the density of fluid and
 $V_{b}$
the volume of the body, is negligible for a thin airfoil in air for the range of reduced frequencies considered here.
To measure the resulting time-periodic forces on the plate, it was sufficient to compute approximately 10 periods of oscillation to eliminate the transient part of the time history, and the data reported below were collected after this time. When the oscillation frequency was close to the wake instability, we needed more than 80 cycles to capture the low (beating) spectrum of the flow; however, in most cases, 20 periods were long enough to capture the response spectrum.
The reduced frequency was varied from zero to almost twice the value of the natural vortex shedding frequency (which was computed for steady motion of the plate independently) and amplitude,
 ${\it\sigma}_{x}$
and
 ${\it\sigma}_{y}$
, was varied to up to 80 % of the mean velocity,
 $U$
.
Before examining the surging and plunging cases, it is informative to document the natural flow over the range of
 $\mathit{Re}$
and
 ${\it\alpha}$
considered. The Reynolds number,
 $\mathit{Re}=Uc/{\it\nu}$
, is defined based on the mean streamwise velocity,
 $U$
, the chord length,
 $c$
, and the kinematic viscosity,
 ${\it\nu}$
. At each
 ${\it\alpha}$
, there is a critical Reynolds number,
 $\mathit{Re}_{crit}$
, below which a steady, separated flow is obtained. At
 $\mathit{Re}_{crit}$
, there is a supercritical Hopf bifurcation (Sreenivasan, Strykowski & Olinger Reference Sreenivasan, Strykowski and Olinger1987) resulting in an oscillatory wake and, at sufficiently high
 $\mathit{Re}$
, vortex shedding. Hopf bifurcation at
 $\mathit{Re}_{crit}$
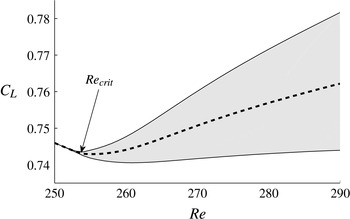
is shown in figure 1 for
 ${\it\alpha}=15^{\circ }$
.
Hopf bifurcation at
 $\mathit{Re}_{crit}=254$
. Fluctuating ranges (grey area) and mean values (dashed line) are shown for
 $250<\mathit{Re}<290$
. Flat plate,
 ${\it\alpha}=15^{\circ }$
.

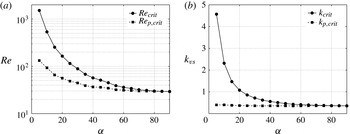
Both
 $\mathit{Re}_{crit}$
and the initial instability frequency
 $k_{vs}$
are plotted versus
 ${\it\alpha}$
in figure 2. Most of the variation in
 $\mathit{Re}_{crit}$
and
 $k_{vs}$
can be understood as resulting from the varying projected area of the plate in the direction of flow, i.e. bluff-body scaling (Fage & Johansen Reference Fage and Johansen1927). Here
 $\mathit{Re}_{p,crit}$
and, particularly,
 $k_{p,crit}$
, both defined using the projected chord length,
 $c\sin {\it\alpha}$
, are more nearly constant with
 ${\it\alpha}$
. The nearly constant value of
 $k_{p,crit}$
corresponds to a Strouhal number of 0.13, and according to Huang & Lin (Reference Huang and Lin1995), this value increases up to 0.2 at higher
 $\mathit{Re}$
. The supercritical flows considered in this paper fall into the category of laminar vortex shedding in Huang & Lin (Reference Huang and Lin1995), where boundary layers are separated from the upper surface without any shear-layer instability or turbulence. For reference below, the oscillatory flows we consider in the following sections have
 ${\it\alpha}=5^{\circ }$
, 15° and 20°, where the critical Reynolds numbers are
 $\mathit{Re}_{crit}=1519$
, 254 and 164, respectively.
Critical Reynolds numbers (
 $\mathit{Re}_{crit}$
) and corresponding vortex shedding reduced frequencies (
 $k_{vs,crit}$
) at different angles of attack. The subscript
 $p$
refers to quantities made dimensionless by the projected chord length,
 $c\sin {\it\alpha}$
.

3. Surging
Since most of the past work related to unsteady airfoil motions were focused on plunging (Jones, Dohring & Platzer Reference Jones, Dohring and Platzer1996; Lewin & Haj-Hariri Reference Lewin and Haj-Hariri2003; Young & Lai Reference Young and Lai2007; Andro & Jacquin Reference Andro and Jacquin2009; Cleaver et al. Reference Cleaver, Wang, Gursul and Visbal2011; Cleaver, Wang & Gursul Reference Cleaver, Wang and Gursul2012; Calderon et al. Reference Calderon, Wang and Gursul2013; Cleaver et al. Reference Cleaver, Wang and Gursul2013), surging is first considered in greater detail. We compare the results to plunging in § 4.
3.1. Vortex lock-in and time-averaged lift
Here we consider
 ${\it\alpha}=15^{\circ }$
and
 $\mathit{Re}=300>\mathit{Re}_{crit}$
, and investigate lock-in regions with
 ${\it\sigma}_{x}$
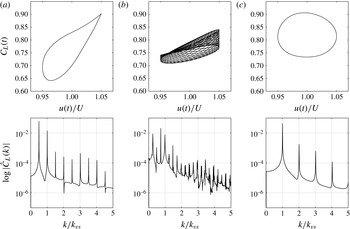
as the bifurcation parameter. Previous researchers characterized the flow as locked-in when the natural wake instability synchronized its frequency to the forcing frequency (Karniadakis & Triantafyllou Reference Karniadakis and Triantafyllou1989; Young & Lai Reference Young and Lai2007). We thus define vortex lock-in as when the dominant peaks in the lift spectrum only occur at harmonic frequencies of the motion. Representative phase-space plots (
 $C_{L}(t)$
versus
 $U(t)$
), and frequency spectra of
 $C_{L}$
are shown in figure 3. Trajectories in the lift-velocity phase space collapse onto a single curve for the lock-in cases (a,c) with dominant peaks occurring at the harmonic frequencies of the motion. However, for the quasi-periodic case (b), there is a phase shift with multiple peaks appearing in the lift spectrum that correspond to the sum and difference of the natural wake instability,
 $k_{vs}$
, and the oscillating motion.
Representative cases, (a,c) with and (b) without lock-in. Surging amplitude is
 ${\it\sigma}_{x}=0.05$
and the phase plot of lift coefficient and
 $x$
-velocity are shown with the frequency spectra for 50 periods of surging frequency,
 $k$
. Flat plate,
 $\mathit{Re}=300$
,
 ${\it\alpha}=15^{\circ }$
and
 $k_{vs}=1.62$
. (a)
 $k/k_{vs}=0.5$
; (b)
 $k/k_{vs}=0.74$
; (c)
 $k/k_{vs}=1.01$
.

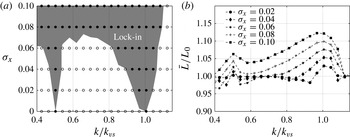
Lock-in regions, are shown over a continuous range of reduced frequencies in figure 4 for relatively low velocity amplitudes,
 $0<{\it\sigma}_{x}<0.1$
. We observe two independent branches at
 $k/k_{vs}=1/2$
and
 $k/k_{vs}=1$
. The lock-in regions grow with increasing surging amplitude, representing a V-shaped region that is known as the Arnol’d tongue or the resonance horn for parametric oscillators (Boyland Reference Boyland1986). A clear correlation between the lift increment region of
 $\bar{L}/L_{0}>1$
(
 $\bar{L}$
is the averaged lift for the surging airfoil, and
 $L_{0}$
the mean lift for the base flow) and lock-in state of the flow reveals that the time-averaged lift increases when the flow is locked-in. This type of resonance has also been previously investigated by Munday & Taira (Reference Munday and Taira2013) for a two-dimensional circular cylinder with actuators on the rear part of the body, and only one tongue near
 $k/k_{vs}=1$
appeared compared to two for a flat plate. Drag forces are also excited at these lock-in regions; it is primarily the force normal to the flat plate that is enhanced during lock-in.
(a) Lock-in regions and (b) mean lift force for a surging airfoil at
 $\mathit{Re}=300$
and
 ${\it\alpha}=15^{\circ }$
. Lock-in regions are defined where
 ${\it\gamma}<10^{-2}$
;
 $L_{0}$
is the mean lift for
 ${\it\sigma}_{x}=0$
.

For the reduced frequencies considered in this paper, almost all flows above
 ${\it\sigma}_{x}=0.1$
are locked-in, and, with increasing
 ${\it\sigma}_{x}$
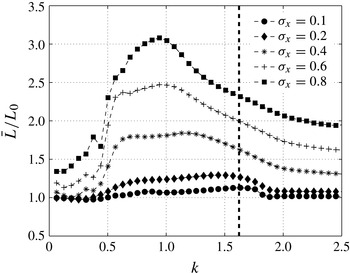
, the time-averaged peak occurs at a frequency near
 $k=1$
, which is far from the natural shedding frequency,
 $k_{vs}=1.62$
(figure 5). This frequency is instead related to an optimal phase of the LEV convecting along the upper surface during the retreating portion of the cycle (Gursul & Ho Reference Gursul and Ho1992). For high-amplitude motions, the flow experiences large variation of
 $\mathit{Re}$
, and the natural wake instability is no longer apparent in the wake.
Time-averaged lift for
 $0.1<{\it\sigma}_{x}<0.8$
. Vertical line indicates the vortex shedding frequency of steady flow (
 ${\it\sigma}_{x}=0$
). Flat plate,
 ${\it\alpha}=15^{\circ }$
,
 $\mathit{Re}=300$
.

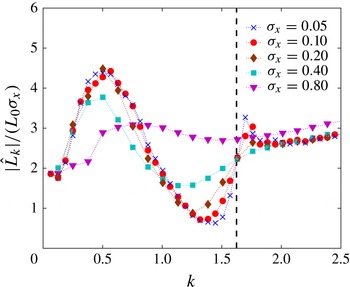
Fluctuating amplitude of lift. Aerodynamic response is nearly independent for
 ${\it\sigma}_{x}=0.2$
. Vertical line indicates the vortex shedding frequency of steady flow (
 ${\it\sigma}_{x}=0$
). Flat plate,
 ${\it\alpha}=15^{\circ }$
,
 $\mathit{Re}=300$
.

3.2. The leading-edge vortex and fluctuating lift
The fluctuating lift is now examined via a Fourier transform of the lift, from which the amplitude and phase are evaluated at each surging frequency. Following the unsteady potential model (Greenberg Reference Greenberg1947) we consider the quantity
 $|\hat{L}_{k}|/(L_{0}{\it\sigma}_{x})$
, where
 $\hat{L}_{k}$
is the Fourier component of the fluctuating lift at the corresponding surging frequency,
 $k$
, and where we normalize, in our case, by the base-flow mean lift,
 $L_{0}$
. Figure 6 shows that at
 $\mathit{Re}=300$
and
 ${\it\alpha}=15^{\circ }$
, the normalized lift fluctuation is nearly independent of velocity fluctuation amplitude for
 ${\it\sigma}_{x}<0.2$
; the same is true for other values of
 $\mathit{Re}$
and
 ${\it\alpha}$
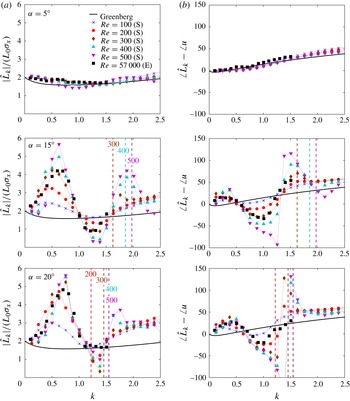
considered here. Figure 7 shows the lift fluctuations and their phase as a function of
 $k$
for a range of angles of attack, and includes data from companion experiments at a higher
 $\mathit{Re}$
of 57 000 conducted in an unsteady wind tunnel at the Illinois Institute of Technology (Granlund et al.
Reference Granlund, Monnier, Ol and Williams2014). Also plotted are the theoretical (potential flow) results; note that when scaled this way, the theoretical fluctuating lift normalized by
 $L_{0}$
and
 ${\it\sigma}_{x}$
is independent of angle of attack.
(a) Amplitude (b) and phase of the fluctuating lift at various
 $\mathit{Re}$
and
 ${\it\alpha}$
. Simulation results (S),
 $\mathit{Re}\in [100,500]$
, are compared with the experiment results (E),
 $\mathit{Re}=57\,000$
. Also shown are the theoretical potential flow results of Greenberg (Reference Greenberg1947). Vertical lines indicate the vortex shedding frequency of steady flow (
 ${\it\sigma}_{x}=0$
) at the corresponding
 $\mathit{Re}$
. Airfoil is a flat plate for the simulations and NACA 0006 for experiments. Here
 ${\it\sigma}_{x}$
was set to 0.1 for all cases.

Numerical and experimental results follow the general trend of the potential flow result when the flow is attached (at
 ${\it\alpha}=5^{\circ }$
). At higher
 ${\it\alpha}$
, where the flow is separated, unsteady flow structures drastically alter this behaviour (at
 ${\it\alpha}=15^{\circ }$
and 20°). As
 ${\it\alpha}$
is increased, two frequency bands emerge where the fluctuations are amplified and attenuated, respectively. For example, at
 ${\it\alpha}=15^{\circ }$
,
 $\mathit{Re}=500$
, the fluctuating magnitude of lift at
 $k=0.6$
is more than twice the amplitude at
 $k=0$
(the quasi-steady limit value) and at
 $k=1.2$
, it is less than half. In the simulations, these trends are more pronounced with increasing
 $\mathit{Re}$
. Near
 $k_{vs}$
, a second maximum in fluctuations occurs which is related to the aforementioned lock-in phenomena. However, it is important to note that, by contrast, the
 $k$
values where the first amplification and attenuation of fluctuations occur do not shift with the shifting vortex shedding frequency associated with the differing Reynolds numbers (see the vertical lines on figure 7). This suggests that these regimes are not associated with the wake instability, a conclusion that is further supported by the fact that, for
 ${\it\alpha}=15^{\circ }$
and 20°, the amplification and attenuation behaviour occurs at both sub- and supercritical values of
 $\mathit{Re}$
.
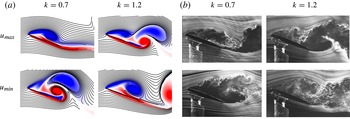
The amplification and attenuation regimes are related to the formation and convection of an LEV, and now we examine the corresponding flow structures. Flow visualizations at the amplification (
 $k=0.7$
) and attenuation (
 $k=1.2$
) frequencies examined at
 $\mathit{Re}=500$
(simulations) and
 $\mathit{Re}=57\,000$
(experiments) are shown in figure 8 for
 ${\it\alpha}=20^{\circ }$
. Streaklines from the simulations are compared to the smoke-wire images from the experiments at two phases of oscillation velocity, namely the maximum,
 $u_{max}=U(1+{\it\sigma}_{x})$
and the minimum,
 $u_{min}=U(1-{\it\sigma}_{x})$
. For the frequencies where the fluctuations are amplified (
 $k=0.7$
), the lift enhancement attributed to the LEV occurs at the advancing portion of the cycle. A strong LEV is formed above the airfoil at
 $u_{max}$
, and the low-pressure regions induced by the LEV enhance the lift more than the quasi-steady case. At
 $u_{min}$
, on the other hand, the shear layer is deflected from the airfoil and the lift is reduced with the larger separation region. The LEV forms a dipole with the trailing-edge vortex (TEV), and because of the positioning and orientation of these two vortices their induced velocity is directed upstream, broadening the separated region (Calderon et al.
Reference Calderon, Wang and Gursul2013). In this case, the incremental lift from the LEV is occurring in phase with the maximum quasi-static lift, and lift reduction due to flow separation is occurring at the minimum velocity. The lift fluctuations are thus amplified.
Snapshots of flow field from (a) simulation at
 $\mathit{Re}=500$
and (b) experiments at
 $\mathit{Re}=57\,000$
, for
 ${\it\alpha}=20^{\circ }$
and
 ${\it\sigma}_{x}=0.1$
. Top and bottom rows correspond to the flow field at the maximum
 $u=U(1+{\it\sigma}_{x})$
and minimum
 $u=U(1-{\it\sigma}_{x})$
velocity, respectively. Reduced frequencies are chosen to reveal flow fields when the fluctuations are amplified (
 $k=0.7$
) and attenuated (
 $k=1.2$
). For the simulations, streaklines are depicted on top of the colour contours of vorticity,
 ${\it\omega}c/U\in [-10,10]$
.

At
 $k=1.2$
, the situation is different. The LEV is still inducing low-pressure regions above the airfoil; however, over the advancing portion of the cycle, the phase of its growth is delayed and at
 $u_{max}$
, the LEV has grown only to the half-length of the chord. The LEV achieves its full extent at a later phase of the motion and is shed during the retreating portion of the oscillation cycle. However, as this shed vortex advects, it remains close to the airfoil, compared to the amplification case, and also produces a positive lift during the retreating portion of the cycle. Since the incremental lift by the LEV occurs at a later phase of the motion, and the shed LEV offsets the negative quasi-steady component of lift, the fluctuations are suppressed. Despite the vast difference in
 $\mathit{Re}$
, the behaviour is qualitatively similar in experiment and simulation.
The increasing amplification and attenuation of the fluctuating forces with increasing
 $\mathit{Re}$
appears to be related to an increased circulation of the LEV. At least for the low
 $\mathit{Re}$
considered in the simulations, the LEV structure becomes more distinct from the broad separated region, and the incremental lift by the LEV increases with increasing
 $\mathit{Re}$
. We interpret the trend with
 $\mathit{Re}$
as suggesting that at higher
 $\mathit{Re}$
,
 $\mathit{Re}>500$
, viscous effects are becoming increasingly independent of
 $\mathit{Re}$
. However, as we have mentioned before, two-dimensional simulations at higher
 $\mathit{Re}$
are unrealistic due to three-dimensional instabilities, and a firm conclusion must await future three-dimensional simulations and experiments in the intermediate range of
 $\mathit{Re}$
.
The added mass of the oscillating airfoil also contributes to the fluctuation lift. However, for the range of reduced frequencies considered, the contribution is not large enough to change the overall behaviour of the fluctuating amplitude. In potential flow, the added-mass lift of a surging flat plate normalized by
 $L_{0}$
and
 ${\it\sigma}_{x}$
is close to
 $k/2$
(Greenberg Reference Greenberg1947), and the amplitude linearly increases with the reduced frequency. Thus, in higher frequency regimes (not shown in this paper), the fluctuations are dominated by the added mass, and the curves in figure 7 asymptotically reach the slope of
 $k=1/2$
with the phase of lift leading velocity by 90°. For the reduced frequencies considered in this paper, the fluctuations caused by the circulatory forces are much larger than the added mass, and the amplification/attenuation of the fluctuating forces can be solely described by the generation of LEVs acting in or out of phase with the oscillations.
For extremely low
 $k$
values, the normalized amplitudes asymptotically reach a value of 2 for all cases, and the phase difference between lift and velocity disappears. In this low-frequency regime, all dynamical effects are negligible, and lift is determined by the quasi-steady circulatory lift. This behaviour was also discussed in Andro & Jacquin (Reference Andro and Jacquin2009).
3.3. LEV growth and detachment
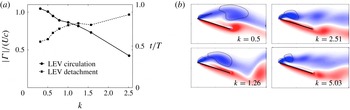
In this section, we quantify growth and detachment of LEVs by applying vortex identification methods and tracking the reattachment point along the upper surface of the airfoil. Figure 9 plots the circulation and phase of the LEV at the moment it is shed. Circulation,
 ${\it\Gamma}/(Uc)$
, was measured based on the the vortex identification method proposed by Graftieaux, Michard & Grosjean (Reference Graftieaux, Michard and Grosjean2001), which captures the coherent swirling pattern in the velocity field. A vortex is defined as a region where
 $|{\it\Gamma}_{2}|$
is larger than
 $2/{\rm\pi}$
and we state the occurrence of LEV detachment as the time when the level set of
 $|{\it\Gamma}_{2}|=2/{\rm\pi}$
separates into two closed contours near the leading edge. Measured circulations in figure 9 also represent the maximal circulation of the LEV; its strength continuously decreases as it convects downstream after shedding. The vortex strength measurement and its phase of detachment are consistent with what Baik et al. (Reference Baik, Bernal, Granlund and Ol2012) have observed experimentally over the range of
 $\mathit{Re}=5000{-}20\,000$
with their plunging and pitching airfoil. The size and strength of the LEV that is formed decreases with increased reduced frequency, and it also separates later during the phase of velocity. The flow topology is mostly determined by the reduced frequency,
 $k$
, but to a lesser degree by Strouhal number,
 $\mathit{St}_{A}={\it\sigma}_{x}/{\rm\pi}$
. This implies that the reduced frequency, which is the ratio of convective time scale to the surging period, determines the characteristic time for the LEV to develop and separate.
(a) Strength of maximum shed LEV and its phase. (b) Snapshots reveal the strength and size decreasing with increasing
 $k$
. Flat plate,
 ${\it\alpha}=15^{\circ }$
,
 $\mathit{Re}=300$
and
 ${\it\sigma}_{x}=0.2$
;
 ${\it\omega}c/U\in [-10,10]$
.

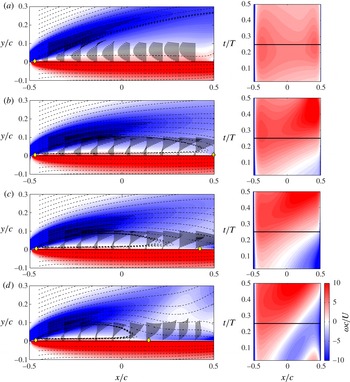
The growth of the LEV before separation can also be investigated by the location of the reattachment point on the upper surface. Rival et al. (Reference Rival, Kriegseis, Schaub, Widmann and Tropea2013) defined the occurrence of LEV detachment as the instant at which the rear stagnation point arrives at the trailing edge, since after its arrival, vortices that are generated from the trailing edge are rapidly fed to cut off the LEV and limit its growth. Figure 10 plots the stagnation points at the upper surface of the airfoil for
 $k=0.25,0.5,0.78$
and 1.26 at
 ${\it\alpha}=15^{\circ }$
. Vorticity values are measured at the upper surface, and the reattachment point is assumed to occur at the position where the vorticity changes from positive to negative (Rival et al.
Reference Rival, Kriegseis, Schaub, Widmann and Tropea2013). Although this is not a rigorous definition of a reattachment point for the unsteady flow, the reattachment point is evolving slowly enough such that the stagnation points evaluated by the instantaneous vorticity field can provide useful information about the regions where the flow converges or diverges. An examination of the flow fields reveals that, at about
 $k=0.5$
, the flow reattaches to the surface (there is no reattachment point for
 $k=0.25$
), and forms a laminar separation bubble that remains for a certain portion of the cycle. This bubble grows until the reattachment point reaches the trailing edge, and the growth of LEV and its detachment coincide with its arrival to the trailing edge. In figure 10, the rear stagnation point can be traced by the white line in the contour plot during the advance portion of the cycle,
 $0<t/T<0.5$
. The reattachment point has reached the trailing edge at
 $t/T=0.25$
for
 $k=0.5$
. However, for
 $k=1.26$
the LEV length extends to only half of the chord length. LEV detaches after the arrival of the reattachment point at
 $t/T=0.25$
for
 $k=0.5$
, while, on the other hand, for
 $k=0.78$
and 1.26, it is delayed until
 $t/T=0.3$
and 0.5.
Streamlines (dashed lines), streaklines (solid lines), and stagnation points (diamond symbols) on the upper surface are plotted on top of vorticity contours at the maximum velocity,
 $u=U(1+{\it\sigma}_{x})$
, for (a)
 $k=0.25$
, (b) 0.5, (c) 0.78 and (d) 1.26. For each case, vorticity values on the upper surface during the advancing portion of the motion are plotted on the right. Flat plate,
 $\mathit{Re}=300,{\it\alpha}=15^{\circ }$
, and
 ${\it\sigma}_{x}=0.2$
;
 ${\it\omega}c/U\in [-10,10]$
. Flat plate is rotated 15° to align its chord with the
 $x$
-axis.

4. Plunging
We now compare the aerodynamic forces for plunging and surging oscillations, and show that they are qualitatively similar. Quantitatively, for the same unsteady velocity amplitude,
 ${\it\sigma}_{x}={\it\sigma}_{y}$
, plunging generally produces a higher fluctuating amplitude of lift than surging, which seems natural as it has a larger added-mass lift and the effective angle of attack now also changes with the oscillating velocity. For plunging, lock-in still occurs near the vortex shedding frequency and its subharmonic, and there is an increment of the time-averaged forces within these regions. Fluctuating forces, moreover, show the same amplification and attenuation regimes depending on the LEV acting constructively or destructively with the phase of velocity.
4.1. Vortex lock-in and time-averaged lift
For plunging motions, unsteady flows with wake instability can also lock-in to the harmonic components of the oscillating motion when the reduced frequency of plunging is close to the vortex shedding frequency,
 $k_{vs}$
, or to its half,
 $k_{vs}/2$
. These phenomena have been described above for the surging case, and previous studies (Young & Lai Reference Young and Lai2007; Calderon et al.
Reference Calderon, Wang and Gursul2013; Cleaver et al.
Reference Cleaver, Wang, Gursul and Visbal2011, Reference Cleaver, Wang and Gursul2013) have investigated the time-averaged lift and lock-in regions for plunging at a higher
 $\mathit{Re}$
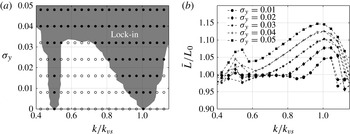
. Lock-in leads to local maximum lift coefficients near the wake instability and its sub- or superharmonics. Figure 11 compares the time-averaged lift and lock-in regions for plunging at
 $\mathit{Re}=300$
. We look at phase plots and frequency spectra of lift, and define lock-in as was discussed for the surging case above.
(a) Lock-in regions and (b) mean lift force (plunging), for
 $\mathit{Re}=300$
and
 ${\it\alpha}=15^{\circ }$
;
 $L_{0}$
is the mean lift for
 ${\it\sigma}_{y}=0$
.

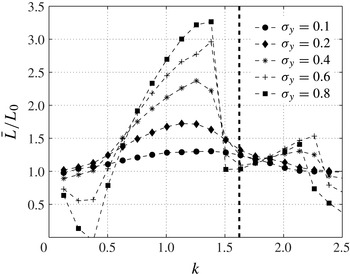
Time-averaged lift for
 $0.1<{\it\sigma}_{y}<0.8$
. Vertical line indicates the vortex shedding frequency of steady flow (
 ${\it\sigma}_{y}=0$
). Flat plate,
 ${\it\alpha}=15^{\circ }$
,
 $\mathit{Re}=300$
.

In figure 11, there is an increment of the time-averaged lift when the wake instability locks on to the frequencies of the motion. Lock-in regions, that originate from
 $k_{vs}/2$
and
 $k_{vs}$
, respectively, widen with increasing
 ${\it\sigma}_{y}$
, and merge at a value near
 ${\it\sigma}_{y}=0.035$
for plunging. Comparing lock-in regions with surging (figure 4), the width grows much faster for the plunging case. The resonance regions near the natural vortex shedding frequency and its subharmonic seem to persist over a large range of
 $\mathit{Re}$
. For example, they have been observed at
 $\mathit{Re}=10\,000$
by Cleaver et al. (Reference Cleaver, Wang, Gursul and Visbal2011, Reference Cleaver, Wang and Gursul2013).
The time-averaged lift for plunging at higher amplitudes is investigated and shown in figure 12. Flows are locked-in at most of the frequencies above
 ${\it\sigma}_{y}=0.1$
, and a peak occurs at a frequency near
 $k=1.38$
. As with surging, this peak is not related to the natural wake instability, but rather to the optimal phase of the LEV convecting along the upper surface during the upward motion (known as the ‘wake capture’ phenomenon). This phenomenon has been observed and widely addressed in previous works (Andro & Jacquin Reference Andro and Jacquin2009; Calderon et al.
Reference Calderon, Wang and Gursul2013; Cleaver et al.
Reference Cleaver, Wang, Gursul and Visbal2011, Reference Cleaver, Wang and Gursul2013).
4.2. The leading-edge vortex and fluctuating lift
For surging, the amplification or attenuation were results of LEV acting on different phases of the velocity, which became more pronounced with increasing
 $\mathit{Re}$
. These phenomena also apply to the plunging case, and are presented in figure 13. Here
 $\hat{L}_{k}$
is the Fourier component of the fluctuating lift at the corresponding frequency of the motion,
 $k$
, and the vertical lines indicate vortex shedding frequencies,
 $k_{vs}$
, for the supercritical flows at
 ${\it\sigma}_{y}=0$
. For both surging and plunging, amplitudes are amplified and attenuated near the same frequency regime; however, for plunging there is a much larger fluctuating amplitude than for the surging case. The LEV is formed when the airfoil is moving downwards, and separation occurs at a later phase of the cycle with increasing
 $k$
.
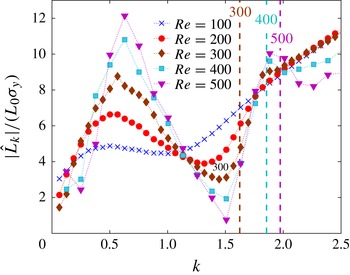
Fluctuating amplitude of lift at various reduced frequencies,
 $k$
. Flat plate,
 ${\it\alpha}=15^{\circ }$
and
 ${\it\sigma}_{y}=0.05$
.

At
 $k=0.6$
, the low-pressure region produced by the LEV enhances lift during the advancing (downward) portion of the cycle, and lift at the maximum velocity is much higher than the quasi-steady case. During the retreating (upward) motion, on the other hand, the flow encounters a large separation region that reduces lift, and the fluctuations are amplified. For
 $k=1.2$
, where the fluctuations are attenuated, the LEV induces low-pressure regions above the airfoil for a longer portion of the cycle and stays close to the airfoil after it sheds. Since the shed LEV produces positive lift during the retreating (upward) portion of the oscillation, it offsets the negative quasi-steady component of lift and suppresses the fluctuations. At
 $k$
values near
 $k_{vs}$
, a local maximum in fluctuations can also be observed for
 $\mathit{Re}=400$
and
 $\mathit{Re}=500$
, where we expect resonance with the wake instability (lock-in).
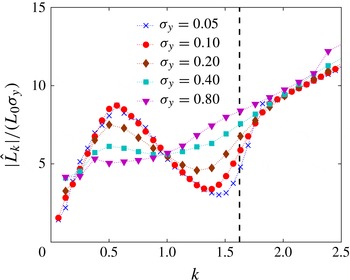
Finally, in figure 14, fluctuating amplitudes of lift are presented with the variation of
 ${\it\sigma}_{y}$
. Amplification and attenuation behaviours of the fluctuating lift, that were present for low-amplitude motions, are no longer obtained for high-amplitude motions, but are preserved for a certain range of amplitudes. Here
 $\hat{L}_{k}$
increases almost linearly until
 ${\it\sigma}_{y}=0.2$
(for surging refer to figure 6), preserving the low-amplitude flow structures that are associated with the phase of LEV development at various reduced frequencies. For
 ${\it\sigma}_{y}$
above these values, strong interactions between the vortices and the body alter the topological structure of the flow that can be associated with high-amplitude motions.
Fluctuating amplitude of lift (plunging). Aerodynamic response is nearly linear for
 ${\it\sigma}_{y}=0.2$
. Vertical lines indicate the vortex shedding frequency of steady flow (
 ${\it\sigma}_{y}=0$
). Flat plate,
 ${\it\alpha}=15^{\circ }$
,
 $\mathit{Re}=300$
.

5. Conclusions
In this study, we have investigated the unsteady aerodynamic forces and flow structures associated with harmonic oscillations superposed in the streamwise and transverse directions on a steady flow. Flows were limited to low Reynolds number near
 $\mathit{Re}_{crit}$
, where the baseline flow first displays wake instability, and the angle of the airfoil was sufficiently high so that the flows are fully separated. As the reduced frequency was varied, a number of interesting features that involve vortex lock-in and synchronization of the LEV with the oscillatory motion occurred.
For surging motions with relatively low amplitude, the wake instability with vortex shedding locked-in to the harmonic motion of the airfoil when the reduced frequencies were close to the vortex shedding frequency or its subharmonic. These lock-in regions occurred within a continuous range of reduced frequencies and widened with increasing amplitude,
 ${\it\sigma}_{x}$
, consistent with the resonance regions of a generic nonlinear oscillation known as the Arnol’d tongue or resonance horn. Also, there existed a correlation with the time-averaged forces and lock-in regions, due to enhanced force in the direction normal to the flat plate. For higher velocity amplitudes,
 $0.1<{\it\sigma}_{x}<0.8$
, the time-averaged peak occurred at a frequency that is not related to the natural wake instability, but rather to the optimal phase of the LEV convecting along the upper surface.
While the time-averaged forces were related to lock-in of vortex shedding, the formation of the LEV was found to account for the amplification and attenuation of the fluctuating forces. There existed frequency regimes near
 $k=0.6$
and
 $k=1.2$
where the fluctuations were amplified and attenuated, and this behaviour did not seem to be fundamentally related to wake instability, since the associated frequencies showed no significant dependence on the Reynolds number. Analysis of the flow structure revealed that fluctuating forces amplified when the incremental force due to the LEV was in phase with the quasi-component of velocity, and attenuated when it was out of phase. At the
 $k$
value associated with amplification, the LEV formed during the advancing portion of the cycle, extended to its full strength at the maximum velocity, and separated before the retreating portion of the cycle. On the other hand, at the higher
 $k$
value associated with attenuation, the LEV developed for a much longer period of the cycle and separated during the retreating portion of the cycle. After this separation, it remained close to the airfoil and produced additional lift that cancels out the negative component of quasi-static lift and, therefore, suppressed the fluctuations.
The reduced frequency,
 $k$
, was identified as a parameter that controls the arrival of the reattachment point at the trailing edge, which in turn governs the growth of the LEV and also its detachment. Applying a vortex identification method and tracking the reattachment points on the upper surface, we have shown that the strength of the LEV diminishes and its phase of detachment is delayed with increasing reduced frequency. For the range of parameters concerned, the structures of the flow were mostly governed by the reduced frequency, and this parameter, which represents the ratio of the convective time scale to the surging period, is believed to determine the characteristic time for the LEV to develop. A detailed study of the flow, including snapshots of streamlines and vorticity fields, revealed that the arrival of the rear stagnation point is delayed with increasing reduced frequency.
The aerodynamic forces that are associated with plunging motions were shown to produce similar behaviour to the surging case, where lock-in occurred near the vortex shedding frequency and its subharmonic, and fluctuations were amplified or attenuated depending on the phase of LEV acting constructively or destructively with the quasi-steady component of the forces. These amplification/attenuation frequency regimes coincided with those for surging.
Acknowledgement
This work was supported by the Air Force Office of Scientific Research (FA950-09-1-0189).