


I. INTRODUCTION
Ni-base superalloy single crystals (SXs) are cast materials that are utilized to make the first-stage blades for gas turbines in power plants and jet engines. Reference Meetham1–Reference Reed5 Their microstructure consists of small γ′ cuboids (L12 ordered phase, volume fraction ≈70%, edge length ≈0.5 µm) separated by thin γ channels (fcc crystal lattice, volume fraction ≈30%, width: ≈50 nm). SXs operate in the creep range where they must withstand mechanical loads at elevated temperatures. Creep, the time dependent accumulation of irreversible plastic strain, shows a strong stress and temperature dependence. Reference Bürgel, Maier and Niendorf6–Reference Kassner12 In the present study, we investigate specimens that are subjected to shear creep loading. The stress and temperature dependence of the minimum or secondary creep rate in a shear experiment can be described by the equation
 $${\dot \gamma _{\rm{s}}} = {c_n} \cdot {\tau ^n} \cdot \exp \left( { - {{{Q_{{\rm{app}}}}} \over {RT}}} \right)\quad ,$$
where
 ${\dot \gamma _{\rm{s}}}$
is the secondary creep rate, c
n
is a constant, τ is the shear stress, n is the stress exponent, Q
app is the apparent activation energy for creep, and R and T have their usual meanings. Most published creep data represent results from uniaxial creep experiments (σ1 > 0, σ2 = σ3 = 0) [e.g., Refs. Reference Pollock and Argon13–Reference Dirand, Cormier, Jacques, Chateau-Cornu, Schenk, Ferry and Bastie18]. Shear creep testing has received limited attention in the literature, even though it also represents an interesting loading case, which yields useful information for geo and material scientists,
Reference Bardet19,Reference Anderson, Hirth and Lothe20
as well as for mechanical engineers.
Reference Dieter21
From a fundamental materials science point of view, shear testing allows for a direct activation of specific microscopic crystallographic slip systems. On the other hand, from an engineering point of view shear testing represents a simple case of multiaxial loading (σ1 = −σ3, σ2 = 0) and can help to validate reference stress procedures. Mayer et al.
Reference Mayr, Eggeler, Dlouhy, Oikawa, Maruyama, Takeuchi and Yamaguchi22–Reference Mayr, Eggeler and Dlouhy25
developed a double shear creep test. It was used to demonstrate that under conditions of high-temperature and low-stress creep, one cannot exclusively activate one specific microscopic crystallographic slip system.
Reference Mayr, Eggeler and Dlouhy25
Several fundamental dislocation processes, such as the formation of dislocation networks around the γ′ phase,
Reference Mayr, Eggeler and Dlouhy25
the formation of grooves and ledges at γ/γ′ interfaces,
Reference Kolbe, Dlouhy and Eggeler26
and the cutting of γ′ particles by dislocations,
Reference Eggeler and Dlouhy27
have been investigated by combining transmission electron microscopy (TEM) with interrupted shear creep testing. Moreover, it has been shown how the stress state in a real shear specimen, which can deviate from pure shear in the outer parts of the shear zone, affects rafting, the directional coarsening of the γ′ phase.
Reference Kamaraj, Mayr, Kolbe and Eggeler28,Reference Serin, Göbenli and Eggeler29
Previous shear creep work focused on the evolution of the microstructure in the superalloy single crystals CMSX-4 and CMSX-6. In the case of CMSX-4, high-temperature and low-stress creep of the macroscopic crystallographic shear systems (MCSSs) {001}〈110〉, {100}〈010〉, {011}
 $\left\langle {01\bar 1} \right\rangle$
and {111}
 $\left\langle {01\bar 1} \right\rangle$
was investigated.
Reference Kamaraj, Serin, Kolbe, Neuking and Eggeler30
In the MCSS {011}
 $\left\langle {01\bar 1} \right\rangle$
, dislocation substructures have not yet been analyzed. Therefore, in the present work, we combine high-temperature, low-stress shear creep testing with TEM to investigate the microstructural dependence. We investigate the single crystal superalloy LEK 94
Reference Glatzel, Mack, Wöllmer and Wortmann31,Reference Wöllmer, Mack and Glatzel32
to find out how the choice of another Ni-base SX superalloy affects the creep behavior and the microstructural evolution. In the present work, the evolution of the dislocation substructure and the directional coarsening of the γ′ phase (rafting) will be investigated, with special emphasis placed on the processes that govern high-temperature shear creep plasticity in the secondary creep regime.
II. EXPERIMENTS
A. Material
LEK 94 is a negative-misfit Reference Reed5 Ni-base single crystal superalloy developed by MTU Aero Engines AG, Munich, Germany. Reference Glatzel, Mack, Wöllmer and Wortmann31,Reference Wöllmer, Mack and Glatzel32 Its specific chemical composition is listed in the corresponding patent. Reference Glatzel, Mack, Wöllmer and Wortmann31 It was received in form of cylindrical 19 mm diameter rods oriented in a nominal [001] direction. The heat treatment consisted of solution annealing, followed by aging for 5 h at 1080 °C and 8 h at 900 °C. Reference Mälzer, Hayes, Mack and Eggeler33 Further details on the microstructure of the as-received material are reported elsewhere. Reference Mälzer, Hayes, Mack and Eggeler33,Reference Nörtershäuser, Frenzel, Ludwig, Neuking and Eggeler34
B. Shear creep testing
We used the double shear creep test technique, which is documented in the literature.
Reference Mayr, Eggeler, Dlouhy, Oikawa, Maruyama, Takeuchi and Yamaguchi22–Reference Kamaraj, Serin, Kolbe, Neuking and Eggeler30
A schematic drawing of the specimen is shown in Fig. 1. The size of the double shear specimen is 15 × 8 × 10 mm3 [Fig. 1(a)]. The specimen has two outer loading wings (which are pulled up by applying loads to the two outer loading sections: 2 × F/2). This force is counteracted by the central loading section (which is pushed down by a force F). The two gray regions represent shear zones with volumes of 8 × 2 × 3 mm3. The areas of the two shear zones are 3 × 8 mm2. The shear stress τ in one shear zone is obtained by dividing half of the force F by this area. The widths of the two shear zones are L = 2 mm. Figure 1(a) shows that our shear specimens are loaded on the MCSS (011)
 $\left[ {01\bar 1} \right]$
. Figure 1(b) schematically illustrates that the plastic deformation results in a shear displacement Δ (central loading grip moves downward) and that the shear strain γ can be obtained from Δ and from the shear zones width L as
 $$\gamma = {\Delta \over L}\quad .$$
Shear creep specimen and shear geometry. (a) Schematic 3D view. (b) 2D section through shear specimen perpendicular to the shear plane (011) after a shear creep displacement of Δ in
 $\left[ {0\bar11/01\bar 1} \right]$
direction. For details see text.

Shear creep testing was performed between 980 and 1050 °C at stresses ranging between 50 and 140 MPa. All shear creep tests considered in the present study were interrupted well behind the creep rate minimum at total strains between 6 and 28%.
C. Transmission electron microscopy
TEM imaging was performed using the bright field detector of a JEM-2200FS (JEOL Ltd., Tokyo, Japan), operating at 200 kV in the scanning transmission mode (BF STEM). Scanning transmission electron microscopy (STEM) tilt experiments were performed to measure the sizes of γ and γ′ phase regions, to determine the crystallographic nature and density of superdislocations in the γ′ phase, and to characterize dislocation networks at γ/γ′ interfaces. Details describing the TEM procedures applied in the present study can be found elsewhere. Reference Agudo Jácome, Eggeler and Dlouhý35–Reference Agudo Jácome, Nörtershäuser, Somsen, Dlouhý and Eggeler37 TEM specimens were extracted from materials where rafting had taken place. When the right shear zone was investigated, rafting studies were performed on (010) cross sections, while dislocation networks were studied on (001) foils and vice versa for the left shear zone (for crystallographic directions see Fig. 1). Note that for the present shear loading condition, the two parallel shear zones of our double shear specimen showed different γ′ raft directions, as illustrated in the lower part of Fig. 1(b). The relationship between raft direction and shear loading has been explained by Kamaraj et al. Reference Kamaraj, Mayr, Kolbe and Eggeler28 Thin TEM specimens were cut out with a diamond saw from the center of the shear zones. The slices were ground to a thickness of 100 µm, after which 3 mm discs were punched out from the central shear zone regions. Electron-transparent foils were prepared by electrochemical double-jet thinning at −20 °C and 11.5 V with an electrolyte consisting of 70 cm3/dm3 methanol, 20 cm3/dm3 glycerin, and 10 cm3/dm3 perchloric acid. Three material states were investigated in the TEM, as will be described in Sec. III. For our quantitative evaluation, we considered between 4 and 20 STEM micrographs per material state with 50 µm2 fields of view each, and evaluated between 190 and 330 individual measurements of γ channel width w and γ′ size s (expressed by γ′ raft thickness). In our evaluation of the parameters describing the γ/γ′ microstructure (w and s values), we follow the procedure developed by Serin, Göbenli, and co-workers, Reference Serin, Göbenli and Eggeler29,Reference Serin38–Reference Serin, Neuser, Eggeler, Kamaraj, Kolbe and Heitmaier40 where a line intersection method was used and individual γ and γ′ segment lengths along reference lines were measured. To characterize dislocation substructures, results obtained from several micrographs were considered. Two parameters that characterize the dislocation substructure were measured. First, the average spacing d MESH of a dislocation network in the γ phase close to the γ/γ′ interface. This average spacing was obtained by applying a line intersection method (like the one used for measuring s and w) to five TEM micrographs per material state. Second, the free spacing between superdislocations in the γ′ phase was determined. For this purpose, the superdislocation density in the γ′ phase ρSD was determined by measuring the projected line length of superdislocations, normalizing it by the volume of the TEM foil region and considering correction factors, which account for the measured γ′ volume fraction and for the spatial distribution of dislocation segments, as described in Ref. Reference Agudo Jácome, Nörtershäuser, Heyer, Lahni, Frenzel, Dlouhý, Somsen and Eggeler36. From this superdislocation density ρSD, an average free spacing d SD between superdislocations in the γ′ phase was estimated as
 $${d_{{\rm{SD}}}} = {1 \mathord{\left/ {\vphantom {1 {\sqrt {{\rho _{{\rm{SD}}}}} }}} \right. \kern-\nulldelimiterspace} {\sqrt {{\rho _{{\rm{SD}}}}} }}\quad .$$
Between seven and ten micrographs were evaluated on a total projected area >200 µm2. Additionally, tilt experiments were performed to determine the Burgers vectors of the dislocations in the networks in the γ phase close to γ/γ′ interfaces and of the superdislocations in the γ′ phase. Tilt series were performed by setting one multibeam and eight two-beam cases, for which the effective visibilities/invisibilities were evaluated as described in Ref. Reference Agudo Jácome, Nörtershäuser, Somsen, Dlouhý and Eggeler37. Finally, by following the method described in Ref. Reference Agudo Jácome, Eggeler and Dlouhý35, stereo-pairs were acquired and visualized (not shown here) to gain a three-dimensional impression of dislocation substructures where needed.
III. RESULTS
A. Creep behavior
Figures 2(a) and 2(b) show eight (011)
 $\left[ {01\bar 1} \right]$
shear creep curves presented as logarithmic creep rates versus strain. The corresponding test parameters are listed in Table I. Figure 2(a) shows how the temperature affects creep rate at a constant shear stress of 80 MPa. Figure 2(b) shows the stress dependence of creep at 1050 °C. All creep curves exhibit extended primary creep stages. Four out of six tests reach an early creep rate minimum at strains below 3%. Only in one case (1050 °C and 140 MPa), where high-temperature deformation is fast, primary creep is followed by an extended secondary creep range in the absence of a sharp minimum [curve with number 3 in Fig. 2(b)]. For larger accumulated creep strains (γ > 5%), the
 $\log \dot \gamma \left( \gamma \right)$
creep curves show only a weak (e.g., curves marked with 1 and 2 in Fig. 2) or negligible (e.g., curve marked with 3 in Fig. 2) creep rate increase. The results presented in Fig. 2(b) suggest that for higher stresses, higher creep strains are required to reach the secondary creep regime. Three interrupted creep tests (marked with “b” in Table I) are numbered as 1, 2, and 3, representing different material states with different sets of temperature and stress in Figs. 2(a) and 2(b). The associated creep states were investigated in the TEM. To qualitatively compare microstructures that evolved at different temperatures during different exposure times, we use the phenomenological Larson–Miller parameter, which represents a temperature-compensated time
Reference Larson and Miller41
 $${P_{{\rm{LM}}}} = T \cdot \left( {{C_{{\rm{LM}}}} + \log t} \right)\quad ,$$
where T is the temperature in K, C LM = 20, and t is the exposure or creep time in hours.
(011)
 $\left[ {011/01\bar 1} \right]$
shear creep curves from experiments that were taken through to different strains, plotted as log-linear plots of creep rate
 $\dot \gamma$
versus shear strain γ. (a) τ = 80 MPa = const., T = 980, 1020, and 1050 °C. (b) T = 1050 °C = const., τ = 50, 80, and 140 MPa.

Creep experiments and material states considered in the present work. No., creep experiment/material state; T, temperature; τ, shear stress; γ, shear strain; t, time; P
LM, Larson–Miller parameter;
 ${\dot \gamma _{3\% }}$
, creep rate after 3% strain; FIG., figure number of image showing specific material state in present work.

a As-received material.
b Crept material for microstructural characterization.
Figure 2 shows that minimum creep rates were not always reached at the same strain level. Therefore, to describe the stress and temperature dependence of creep at a comparable deformation stage, creep rates were determined after a constant creep strain γ = 3%. The corresponding data are presented in Fig. 3. Figure 3(a) represents an Arrhenius plot, where the natural logarithm of the creep rate is plotted as a function of the inverse temperature in K. The four data points can be fitted on one common line. The slope of this line yields an apparent activation energy for creep of Q app = 466 kJ/mol for temperatures between 980 and 1050 °C (stress: 80 MPa). Figure 3(b) represents the 3% shear creep rate data in a Norton plot, where strain rates are plotted and fitted as a function of stress in a log–log plot (decimal logarithms). A stress exponent n = 6 can be derived from the slope of the resulting line for creep stresses between 50 and 140 MPa at 1050 °C.
Temperature and stress dependence of shear creep rates recorded for 3% strain. (a) Arrhenius plot of shear creep rate
 $\dot \gamma$
versus the inverse absolute temperature 1/T (T in K). (b) Double logarithmic plot of shear creep rate
 $\dot \gamma$
versus shear stress τ (Norton plot).

B. TEM overview micrographs
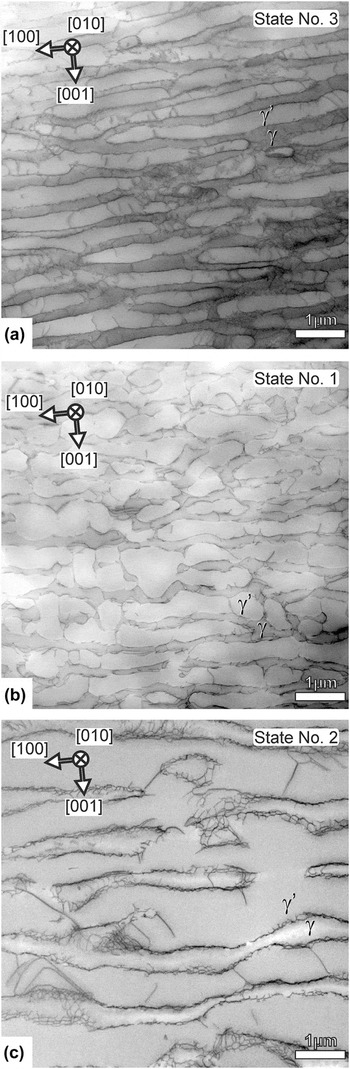
Figure 4 shows overview STEM micrographs that represent the microstructures after three different creep loading conditions. The three micrographs appear in order of increasing Larson–Miller parameter P LM and were taken under multiple-beam conditions for the same magnification and the same foil orientation ([010] beam direction). For all material states, one can see elongated rafts orthogonal to the image plane (edge-on). The gray level for the γ′ rafts is slightly brighter than for the γ channels, as these are bright field micrographs. It is clear from Fig. 4 that the γ/γ′ microstructure of all material states has considerably coarsened as compared to the initial state (material state 0, which is documented in Fig. 1 of Ref. Reference Agudo Jácome, Nörtershäuser, Heyer, Lahni, Frenzel, Dlouhý, Somsen and Eggeler36). The microstructure for material state 3 is shown in Fig. 4(a) and formed at 1050 °C. The shear stress was 140 MPa and a large strain of 36% accumulated in a short time of 4 h [creep curve 3 in Fig. 2(b)]. Thin rafts have developed in the microstructure and the γ channel network is still continuous. The material states shown in Figs. 4(b) and 4(c) have evolved during more intense creep exposure [higher P LM values than for material state 3 in Fig. 4(a), see Table I]. Figure 4(b) shows the material state 1, after 980 °C and 80 MPa creep, having reached a strain of 6% in 147 h. Rafting has advanced, but there is still an interconnected γ channel network with many open horizontal γ channels and some remaining narrow vertical γ channel segments. The γ channels contain dislocations and a few γ′ cutting events can be observed. The microstructure of the material state 2, shown in Fig. 4(c) (highest P LM value), has suffered topological inversion, Reference Epishin, Link, Portella and Brückner42 i.e., the γ channel network is no longer continuous. The TEM micrographs in Figs. 4(a)–4(c) allow distinguishing between dislocations in the γ phase (channel dislocations) and dislocations cutting the γ′ phase (superdislocations).
TEM micrographs taken from TEM foils parallel to (010) under multiple-beam contrast conditions. (a) P LM = 27.3, material state 3 (1050 °C, 140 MPa, and 36%/4 h). (b) P LM = 27.8, material state 1 (980 °C, 80 MPa, and 6%/147 h). (c) P LM = 28.2, material state 2 (1050 °C, 80 MPa, and 14%/22 h).

C. Morphology of the γ/γ′ microstructure
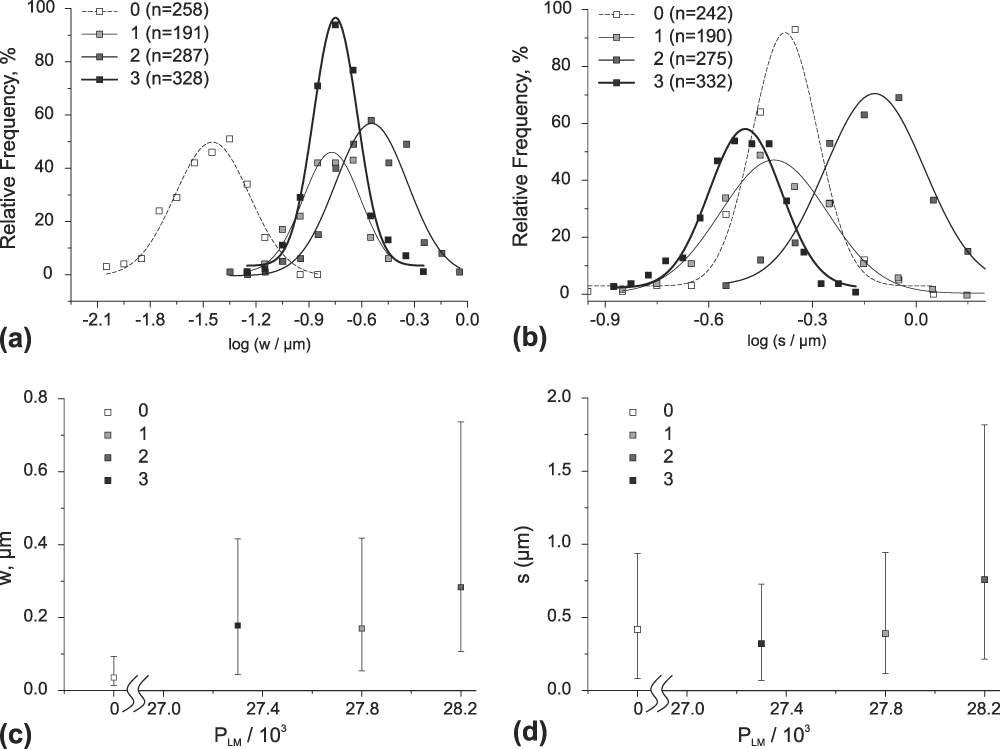
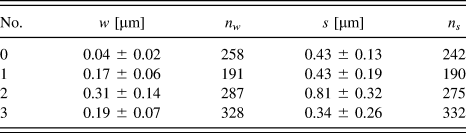
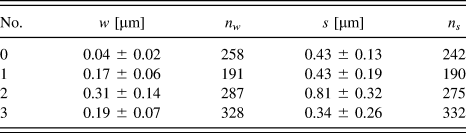
Figure 5 shows quantitative microstructural data on γ channel widths w and γ′ raft thicknesses s. As can be seen in the histograms of Figs. 5(a) and 5(b), w and s follow log-normal size distributions. In Figs. 5(a) and 5(b), the relative frequencies of logarithmic s and w values are plotted for appropriately chosen logarithmic size classes. Table II indicates that between 190 and 330 individual measurements were performed for each material state. Table II also shows the mean values together with their standard deviations. In Figs. 5(c) and 5(d), we show that w and s tend to increase with increasing P LM values. The trends are clear even though, as expected, γ channel widths w and γ′ raft thicknesses s show large microstructural scatter [Figs. 5(a) and 5(b)].
Comparison and scatter of the microstructural parameters that describe the γ/γ′ microstructure for the different material states after shear creep deformation. (a) Histograms showing the distribution of γ channel widths w. (b) Histograms showing the evolution of the distribution of γ′ phase thicknesses s. (c) Increase of w with P LM. (d) Increase of s with P LM. Error bars in (c) and (d) show the standard deviation given at FWHM in (a) and (b), respectively.

Material states (No.), mean values for γ channel width w and γ′ particle size s (together with corresponding standard deviations), and number of individual measurements for w and s (n w and n s , respectively). For details see text.
D. Dislocation substructures
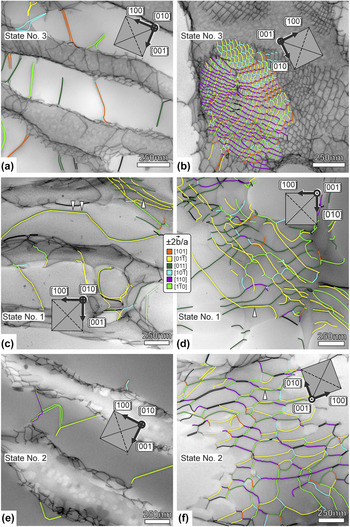
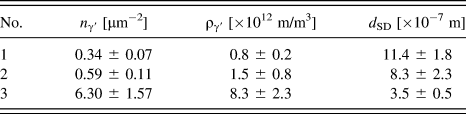
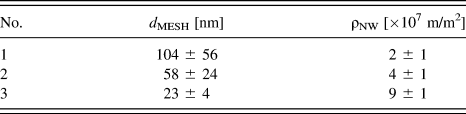
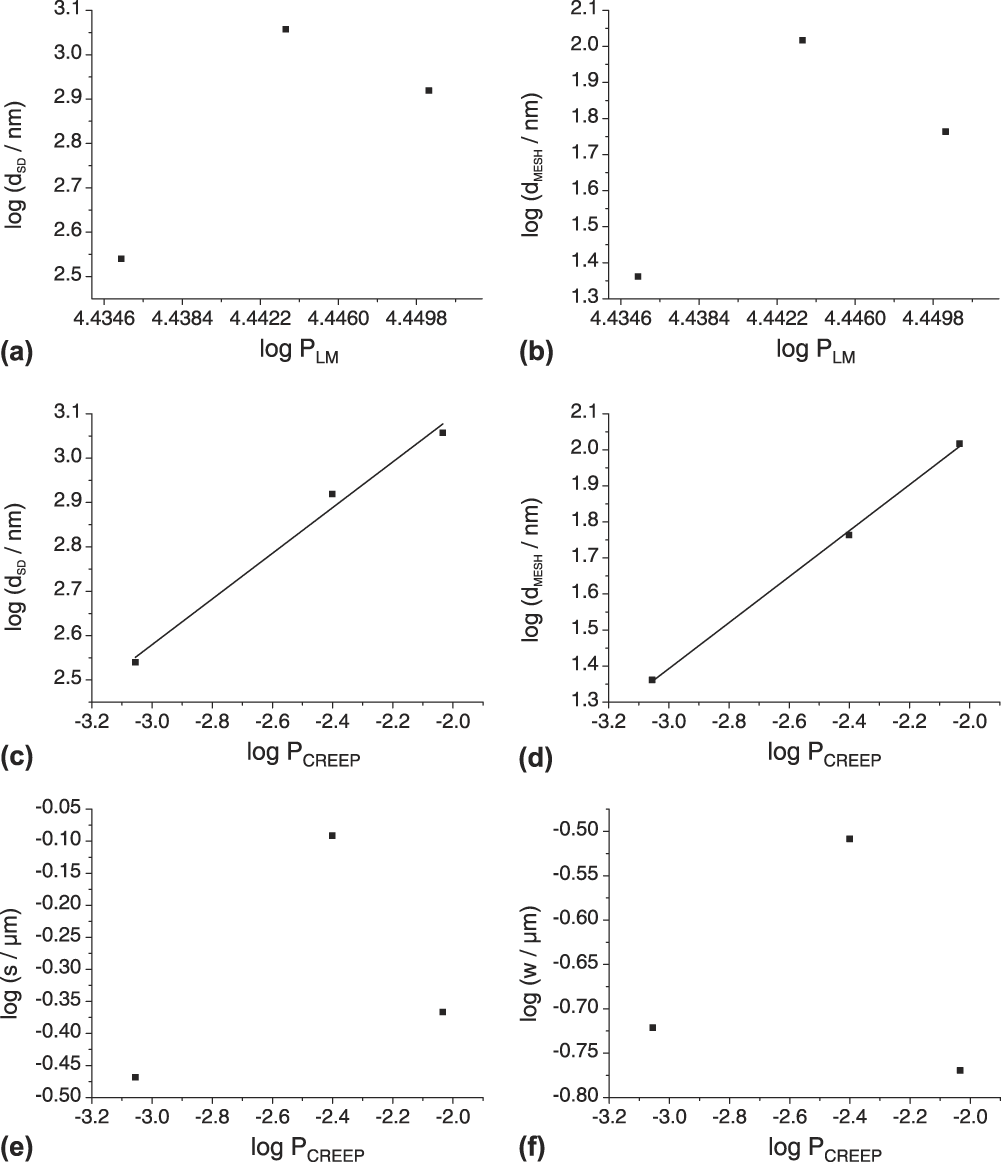
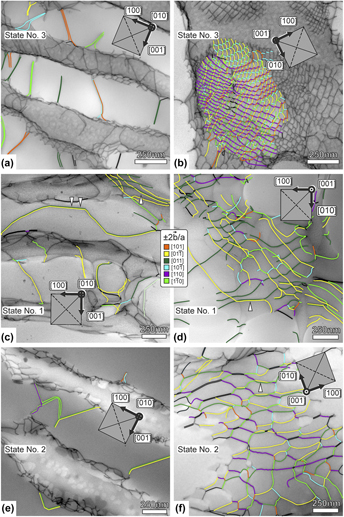
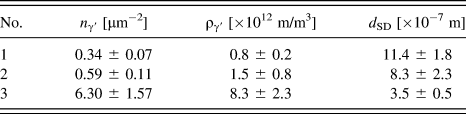
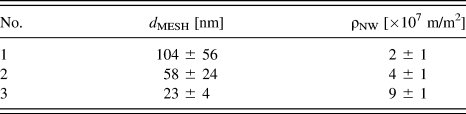
Figure 6 shows STEM micrographs taken with higher magnifications than in Fig. 4. The images in Fig. 6 are also presented in the order of increasing P LM. Two micrographs are shown for each of the three material states. The micrographs on the left [Fig. 6(a)—material state (m. s.) 3, (c)—m. s. 1, and (e)—m. s. 2; [010] beam direction; reference system in Fig. 1] allow appreciating γ′ cutting processes. Table III compiles the results of the quantitative evaluation associated with γ′ cutting as described above. Table III lists the number of cutting events n γ′ and the associated density of superdislocations in the γ′ phase ργ′, together with the corresponding spacing between superdislocations in the γ′ phase d SD [see Eq. (3)]. The micrographs on the right [Fig. 6(b)—m. s. 3, (d)—m. s. 1, and (f)—m. s. 2; [001] beam direction; reference system in Fig. 1] were taken perpendicular to the γ/γ′ interfaces and allow for the study of dislocation network spacings. The quantitative results associated to γ/γ′ interface dislocations are presented in Table IV. The table lists the measured mesh size d MESH and the resulting planar network dislocation density ρNW. Figures 6(a)–6(f) contain color coded information on the types of Burgers vectors of the dislocation segments that are present in the microstructures. Figures 7(a) and 7(b) show how d SD (superdislocation spacing in the γ′ phase) and d MESH (spacings of dislocations in the networks) scale with P LM. Both parameters follow the same trend, yet the conventional Larson–Miller parameter does not rationalize these data.
TEM micrographs with color coded information on Burgers vectors. Material states 1 to 3 from Table I: (a, b) P LM = 27.3; material state 3. (c, d) P LM = 27.8; material state 1. (e, f) P LM = 28.2; material state 2. (a, c, e) TEM foils parallel to (010) (for reference see Fig. 1) for investigation of γ′ cutting events. (b, d, f) TEM foils parallel to (001) (for reference see Fig. 1) for investigation of interface dislocation networks.

Material states, number of cutting events n γ′ per projected foil area, dislocation density ργ′, and corresponding dislocation spacing d SD in the γ′ phase.
Material states, mesh size d MESH, and planar density of dislocations in network ρNW.
Microstructural parameters as functions of conventional and modified Larson–Miller parameters. (a) d SD versus P LM. (b) d MESH versus P LM. (c) d SD versus P CREEP. (d) d MESH versus P CREEP. (e) s versus P CREEP. (f) w versus P CREEP. For details see text.

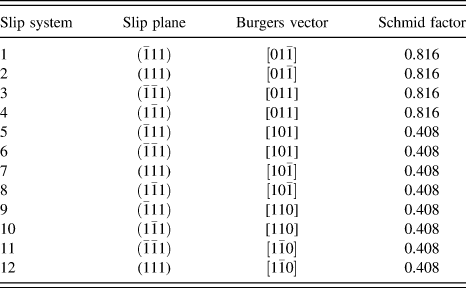
The Burgers vectors of the dislocations that are found in the networks are mainly of type a/2〈110〉. In Table V, the twelve octahedral slip systems of an fcc lattice are numbered from 1 to 12, with their corresponding Schmid factors associated with the external shear loading. Our loading case results in four microscopic crystallographic slip systems with high Schmid factors of 0.816 and eight with lower Schmid factors of 0.408. Figure 6(d) (material state 1) reveals that most network dislocations have long segments that can be assigned to slip systems 2 and 4, both of which have the highest expected external Schmid factor of 0.816. At this low external stress, it appears to be difficult to activate slip systems with 0.408 Schmid factors. The white arrows pointing up in Figs. 6(c) and 6(d) highlight two dislocations, one in dark green (
b
= ±a/2[011]) and one in yellow (
b
= ±a/2
 $\left[ {01\bar 1} \right]$
). We interpret this local scenario such that these two dislocations combine to form an a[001] dislocation and are ready to enter the γ′ phase. Indeed, a long superdislocation consisting of just these two superpartials is observed to jointly shear the γ′ phase, as highlighted with white double arrows pointing down in Fig. 6(c). The latter type of superdislocation was observed several times.
External Schmid factors for 12 {111}〈110〉 microscopic crystallographic slip systems in a fcc crystal lattice.
At higher temperature, material state 2 in Figs. 6(e) and 6(f) climb allows for a faster formation of reaction products as compared to the material state shown in Figs. 6(c) and 6(d). Consequently, instead of observing long parallel segments at the γ/γ′ interfaces, we find regular networks. In Fig. 6(f), many dislocation segments are highlighted by a light green (
b
= ±a/2
 $\left[ {1\bar 10} \right]$
) or purple (
b
= ±a/2[110]) color. These light green and purple segments mostly represent edge dislocations and therefore probably form as reaction products because they cannot form during glide-controlled γ channel filling.
In the network, these segments meet at junctions, where pairs of dark green and yellow dislocations are again present [see white arrow pointing up in Fig. 6(f)], resembling the situation seen for material state 1. The Burgers vector
b
of segment pairs marked black could not be unequivocally identified. Nonetheless, many of these have similar characteristics to those of the dark green/yellow segment pairs. In material state 3 [Figs. 6(a) and 6(b)], with the same temperature and an increased external stress as compared to material state 2, and having a similar γ channel width w compared to material state 1, further slip systems are observed (e.g., systems 6 and 8–12 in Table V). With an increased accumulated strain, a refinement of the dislocation mesh is observed [Fig. 6(b)]. In passing we note that most ±a/2[110] (light green) and ±a/2
 $\left[ {1\bar 10} \right]$
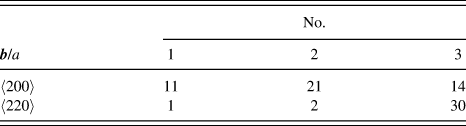
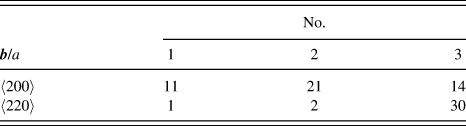
(purple) dislocations found in the networks of material state 3 have screw character. This situation contrasts dislocations with the same Burgers vectors found in Fig. 6(f) for material state 2. For two-thirds of the superdislocations of the fast creep test sample (30 out of 44, creep curve 3 in Fig. 2),
b
= a〈220〉. Material states 1 and 2, for which the microstructures evolved at lower creep rates (lower stresses), showed mostly a〈200〉 dislocations. The results of the superdislocation
b
analysis are listed in Table VI.
Number of cutting events involving a〈200〉 and a〈220〉 superdislocations observed in materials states Nos. 1, 2, and 3.
IV. DISCUSSION
A. Creep behavior
The shear creep behavior of the material investigated in the present work is shown in the
 $\log \dot \gamma \left( \gamma \right)$
creep curves in Fig. 2. In agreement with previous shear creep work on CMSX-6
Reference Mayr, Eggeler, Dlouhy, Oikawa, Maruyama, Takeuchi and Yamaguchi22–Reference Mayr, Eggeler and Dlouhy25
(macroscopic shear systems: {111}〈110〉 and {100}〈010〉) and CMSX-4
Reference Kamaraj, Serin, Kolbe, Neuking and Eggeler30
({001}〈110〉, {100}〈010〉, {011}
 $\left\langle {01\bar 1} \right\rangle$
and {111}
 $\left\langle {01\bar 1} \right\rangle$
), there are pronounced primary creep stages where the creep rate strongly decreases over at least 2% strain. The sharp decrease of creep rate during primary creep, which characterizes high symmetry 〈100〉 tensile creep testing,
Reference Wollgramm, Bürger, Parsa, Neuking and Eggeler43
is not observed. Kamaraj et al.
Reference Kamaraj, Serin, Kolbe, Neuking and Eggeler30
considered the same MCSS that we investigate in the present study. For {011}
 $\left\langle {01\bar 1} \right\rangle$
shear creep deformation of CMSX-4 at 1020 °C, they found a Norton-law stress exponent of 6.6, which is close to the value of 6 that we find at 1050 °C for LEK 94 [Fig. 3(b)]. Kamaraj et al.
Reference Kamaraj, Serin, Kolbe, Neuking and Eggeler30
reported an apparent activation energy for creep of 549 kJ/mol for CMSX-4, which is higher than our LEK 94 value of 466 kJ/mol [Fig. 3(a)]. The stronger temperature dependence in CMSX-4 may be related to the higher Re content close to 3 wt% (> 2.4 in LEK 94), as is suggested by the work of Wollgramm et al.
Reference Wollgram, Buck, Neuking, Parsa, Schuwalow, Rogal, Drautz and Eggeler44
Further work is required to clarify this point. All shear creep data (present work and Refs. Reference Mayr, Eggeler, Dlouhy, Oikawa, Maruyama, Takeuchi and Yamaguchi22–Reference Mayr, Eggeler and Dlouhy25 and Reference Kamaraj, Serin, Kolbe, Neuking and Eggeler30) have in common that the creep rate minimum is not followed by a sharp increase of creep rate in the later stages of tertiary creep.
B. Coarsening of the γ/γ′ microstructure
During high-temperature and low-stress shear creep exposure, the γ/γ′ microstructure evolves with time. It undergoes coupled rafting and coarsening [Figs. 4(a)–4(c)]. This was documented by measuring a statistically relevant number of γ channel widths (w > 150) and γ′ raft thicknesses (s > 150). It is not easy to monitor this trend because the parameters w (γ channel width) and s (γ channel width) show a large microstructural scatter [Figs. 5(a) and 5(b)]. Figures 5(c) and 5(d) indicate that the mean values of w and s evolve with the Larson–Miller parameter P LM. This suggests that both temperature and exposure time are important for the widening of γ channels and for the increasing thickness of γ′ rafts. The present work confirms the findings of Serin et al., Reference Serin, Göbenli and Eggeler29 who reported that the thickness s of γ′ rafts perpendicular to the direction of the maximum principal stress σ1 decreases early on [Figs. 5(b) and 5(d)], because γ′ material is required to fill the γ channels parallel to σ1 [see Fig. 1(b)]. Obviously, the Larson–Miller approach cannot capture this detail. This is not necessary in the case of the γ channels oriented perpendicular to σ1, as they widen from the beginning on.
C. Dislocation substructure
The evolution of the dislocation substructures [shown in Figs. 6(a)–6(f)] cannot be rationalized by simply using the Larson–Miller approach [Figs. 7(a) and 7(b)]. This is not surprising; the parameters that characterize a dislocation substructure are not only dependent on temperature and time of creep exposure but also on stress and strain [e.g., Refs. Reference Eggeler and Blum45 and Reference Blum and Mughrabi46]. It appears reasonable to assume that dislocation spacings should decrease with increasing stress and it has been shown that dislocation network spacings decrease with increasing strain during [110] tensile creep of the superalloy single crystal LEK 94. Reference Agudo Jácome, Nörtershäuser, Somsen, Dlouhý and Eggeler37 In an attempt to account for the influence of stress and strain, we consider a modified Larson–Miller parameter P CREEP, which we simply define as
 $${P_{{\rm{CREEP}}}} = {{{P_{{\rm{LM}}}}} \mathord{\left/ {\vphantom {{{P_{{\rm{LM}}}}} {\left( {\tau \cdot {\varepsilon _{{\rm{END}}}}} \right)}}} \right. \kern-\nulldelimiterspace} {\left( {\tau \cdot {\varepsilon _{{\rm{END}}}}} \right)}}\quad .$$
In Eq. (5), P LM is the classical Larson–Miller parameter as defined in Eq. (4), τ is the applied stress of the shear creep experiment and εEND represents the strain where the creep experiment was interrupted. We are fully aware of the fact that this is only a crude adjustment and that a more detailed analysis may lead to better results. However, for the present work, we wanted to keep things simple and consider our approach as a first step in the right direction. The dislocation network spacing d SD and the free dislocation spacing in the γ′ phase d MESH are plotted as a function of this parameter P CREEP in Figs. 7(c) and 7(d), respectively. The trend lines in Figs. 7(c) and 7(d) show that this simple extension succeeds surprisingly well in rationalizing the dislocation data for the material states investigated. Unfortunately, P CREEP does not describe the coarsening of the γ/γ′ microstructure clearly [Figs. 7(e) and 7(f)], mainly because microstructural coarsening depends more strongly on diffusion (time/temperature) than on dislocation plasticity (stress/strain). Further work is required to clarify this point. The promising results shown in Figs. 7(c) and 7(d) suggest that it is certainly worth investing more work to find out whether these are parameters that can rationalize all microstructural features.
The Burgers vector analysis performed in the present work can be briefly summarized as follows: the observed network dislocation segments can be traced back to normal octahedral dislocations that enter the γ channels by glide on {111} planes and their reaction products. The results of the present study suggest that regular networks form faster at higher temperatures, and more microscopic crystallographic slip systems can be activated at higher stresses. As far as the superdislocations in the γ′ phase are concerned, we find that dislocations with a〈200〉 Burgers vectors can only form when there is enough time for the climb processes, which are required in the underlying type of pairwise cutting. Reference Eggeler and Dlouhy27 In fast high-stress creep experiments, we mostly find superdislocations with a〈220〉 Burgers vectors, which directly originate from glide-controlled reactions between γ channel dislocations as was recently reported for [110] loading. Reference Agudo Jácome, Nörtershäuser, Somsen, Dlouhý and Eggeler37
V. SUMMARY AND CONCLUSIONS
The shear creep behavior of the Ni-base single crystal superalloy LEK 94 in the MCSS (011)
 $\left[ {01\bar 1} \right]$
was investigated at temperatures between 980 and 1050 °C and shear stresses ranging from 50 to 140 MPa. Creep rates were recorded, from which the stress and temperature dependencies of the creep rates established after 3% creep strain were determined. STEM was implemented on creep samples of interrupted experiments to document the evolution of the γ/γ′ microstructure in terms of γ channel width w and γ′ raft thickness s. Moreover, the spacings of superdislocations in the γ′ phase d
SD and the average spacings of dislocation segments in the networks at γ/γ′ interfaces d
MESH were measured. Form the results obtained in the present work, the following conclusions can be drawn:
-
(1) All (011)
 $\left[ {01\bar 1} \right]$
shear creep curves show pronounced primary creep stages, where creep rates decrease by one order of magnitude. Clear creep rate minima were observed in four of six creep tests. In the other two tests the onset of a strain rate plateau defines the end of primary creep.
-
(2) The Creep rate dependence on temperature and stress was assessed at 3% creep strain, well after the creep rate minima. Data measured at 1050 °C at three different stresses and at 80 MPa at three different temperatures yield a power-law stress exponent of n = 6 and an Arrhenius-type temperature dependence with an apparent creep activation energy of Q app = 466 kJ/mol. These findings are in good agreement with data previously reported in the literature for similar Ni-base single crystal superalloys subjected to other types of crystallographic loading conditions in the high-temperature and low-stress creep regime.
-
(3) The γ channel widths w and the γ′ raft thicknesses s show large microstructural scatter and follow log-normal size distributions. The logarithmic mean values of w and s increase with an increase of the phenomenological Larson–Miller parameter P LM. The latter represents a temperature-compensated time and provides useful information on the intensity of creep exposure about the coarsening of the γ/γ′ microstructure.
-
(4) The conventional Larson–Miller parameter P LM cannot describe the evolution of the spacings between dislocations in the networks that form in the γ phase close to the γ/γ′ interfaces. The physical nature of dislocation substructures is strongly affected by stress levels (higher stresses are associated with higher dislocation densities, a thermodynamic factor) and imposed strain intervals (dislocation substructures evolve with strain, a kinetic aspect). A modified Larson–Miller parameter P CREP = P LM/(τ·εEND) is better suited to address the evolution of the dislocation substructure in the regime studied. However, the coarsening behavior is less well captured and further work is required to find a parameter which can rationalize the evolution of all microstructural features.
-
(5) During high-temperature and low-stress (011)
$\left[ {01\bar 1} \right]$
shear creep testing of the Ni-base superalloy single crystal LEK 94, similar dislocations are observed as during tensile creep testing. Most importantly, all network dislocation segments can be traced back to normal octahedral dislocations which enter the γ channels. As far as the Burgers vectors of superdislocations is concerned, we find both a〈220〉 and a〈200〉 dislocations. However, at high stresses and fast creep rates, where the driving force for glide on octahedral systems is high and where there is not enough time for climb processes, one detects more a〈220〉 superdislocations. Only long creep tests yield to the formation of a〈200〉 superdislocations in the γ′ phase, which move by a combined process of glide and climb.


ACKNOWLEDGMENTS
The authors dedicate this work to Haël Mughrabi on the occasion of his 80th birthday. LAJ acknowledges funding by the German Research Foundation (DFG) through the research grant AG 191/1-1 and by the Adolf Martens Fellowship Programme of the BAM Berlin. GE acknowledges funding by the DFG through projects A1 and A2 of the collaborative research center SFB/TR 103.