Why do democratic governments emphasize some policies and not others? This question is surprisingly hard to answer. It is axiomatic that governments wish to remain in office and get re-elected; and that they use the discretion of office accordingly, responding to crises and acknowledging public concerns with timely policy decisions. At the same time, governments do not respond to every problem they encounter. They must steer a steady course to achieve their goal of survival. If governments changed their plans with each new issue demanding their attention, they would probably not achieve very much during their terms of office and get voted out. The challenge for political leaders in a representative democracy is to find a way to address the concerns of the public, but also to manage the amount of risk they bear from choosing to stress some policy issues more than others.
We believe that it is possible to theorize about as well as measure the risk and return that governments accumulate when prioritizing public policies. In this way, government is like an investment manager making choices that yield return through the public's valuation of policies.Footnote 1 We claim that the public provides signals about expected policy capital, or returns for government policies. Whilst always approximate, these signals are sometimes noisier than at other times. The amount of attention that a government gives to a policy domain, or what we call its investment level in a policy asset, generates return to policy capital. But investment also attracts risk due to the variance of each asset value and the covariances among them. The nub of our theory is that, in managing their policy capital, governments consider aspects of risk and return in their policy portfolios and do so amid uncertainty in the public's valuations of policy assets.Footnote 2 Not only does the framework capture the complexity and political subtlety of contemporary policy making, it provides an explanation of why governments highlight particular public policies.
We address the following set of questions in the pages that follow. Do the public reward returns to policy capital? Do they punish risky policy investments? How do the returns to policy investment guide political management and statecraft? To answer these questions, we employ time-series and seemingly unrelated regression techniques to analyse data about the British government and its policy-making environment between 1971 and 2000. Our findings reveal that risk and return predict electoral success, and that returns, risk profiles and uncertainty in public signals about the value of prioritizing policies influence the amount of attention that governments pay towards each policy domain.
In what follows, we locate our claims about policy investment within scholarly thought on the question of policy prioritization. Then we set out a theoretical method of pricing policy assets, explain our data in the context of policy making in British government, and introduce our methods. Subsequently, we analyse data over an important period of recent British political history, test the impact of investment on governments’ electoral performance and assess government statecraft by explaining the content of the Speech from the Throne. We conclude with some reflections on how our theory of public policy investment has more general application to executive decision making in contemporary democracies.
Public Policy Investment in the Study of Comparative Politics
In spite of the conventional wisdoms about political strategy, political scientists do not understand enough about how politicians in office, such as prime ministers, arrive at the policies that they hope will benefit them and their parties. How do they respond to public problems on a day-to-day basis but also maintain the reputations of their governments? Almost all approaches to the study of policy making treat this problem too straightforwardly. We review four groups of study that we believe are deficient in this respect.
Analyses of the responsiveness of policy to public opinion provide evidence that governments follow the concerns of the public, adjusting the amount of attention they pay to each policy area accordingly.Footnote 3 Whilst such findings help to correct claims about unaccountable executive government, especially in Westminster systems,Footnote 4 they leave crucial questions unanswered. In particular, these accounts do not posit how much responsiveness should occur; nor do they consider situations when politicians decide that it is in their best interests not to respond to the demands of public opinion. These studies do not operationalize a link between policy making and the tactical concerns of incumbents.
In models of the political business cycle, governments need only attend to one policy area to get re-elected.Footnote 5 If politicians manage the economy effectively, voters reward them for the resulting stream of material benefits, and incumbents stay in power as a result. As with the opinion-responsiveness literature, there is a large amount of evidence to back up this claim. Voters take the performance of the economy into account in their evaluations.Footnote 6 Governments that perform badly on the economy tend to get voted out of office.Footnote 7 Yet researchers are divided on the extent of the link between economic policy decisions and electoral outcomes, reporting a mixed set of results with regard to fiscal and tax policies.Footnote 8 Studies of the political business cycle provide a conditional and inconclusive set of findings about the electoral impact of the political control of the economy.Footnote 9 Given the state of current knowledge, we argue for a broader approach in which attention to the economy is one aspect of decision making by governments.
In another influential argument, endogenous pressures for policy-agenda change drive the attention of governments.Footnote 10 Even though decision makers have an incentive to reproduce the same policy outputs, new agenda items sometimes gain disproportionate attention from the media and other sources. This surge in attention forces decision makers to change their priorities. Whilst policy makers gain an advantage from following the agenda, these studies do not posit a mechanism to temper responsiveness to electoral advantage.Footnote 11 In fact, the occurrence of policy shocks could indicate that governments over-respond to public problems, making it harder for them to stay the course and maintain their reputation for responsible stewardship.
A similar kind of reactive politician appears in the literature on party positions. Here policy making by incumbent governments reflects competition among parties for the median voter's support, with the implication that when the median shifts so does attention to policies.Footnote 12 In particular, government policies incorporate the manifesto programmes of political parties, which structure the transmission between elections and policy outcomes.Footnote 13 Some studies reduce the dimensionality of policy to a left–right ideological continuum and array parties – and thus governments – along it. Other accounts uncover the specific issues with which parties are associated and show how that issue ownership has helped them gain advantage over the opposition.Footnote 14 Valence models of campaign politics provide a mechanism by which candidates downplay the spatial aspect of policy issues.Footnote 15 Evidence shows that such strategies, in contrast to those based on party positions, can resonate with voters.Footnote 16
The literature on comparative executive government gets closer to the kind of argument we advance. One claim is about the existence of a negative incumbency effect:Footnote 17 there is a cost of governing which occurs because of the inevitable mistakes governments make and for which they shoulder blame.Footnote 18 For example, US presidents suffer from swift declines in approbation from the electorate after entering office.Footnote 19 To replenish their capital, executives desire policy successes,Footnote 20 exploiting their power and the prestige of their offices.Footnote 21 In particular, they court public opinion on specific issues.Footnote 22 They pander to core constituents but also follow – when they can – their conception of the public interest.Footnote 23 In this way, the executive uses the resources at its disposal to sustain itself in office as part of a political strategy that builds supporters, but which also creates a programme for the executive to implement.
Some scholars of British politics make this kind of argument too. Of course, there is much written on British government that says the opposite, such as the claim that decision making lurches as governments over-respond to crises and create policy disasters.Footnote 24 In these accounts, governments cannot control the entrepreneurial acts of ambitious ministers who are keen to advance their careers by risking new policies. A picture emerges of an unresponsive and risk-taking cadre of office holders. However, an alternative literature, originating from an older tradition of study, suggests that governments and their leaders are much cannier. They aim to be both responsive, adapting policies in the light of events, but also avoid risk by staying the course and acting responsibly.Footnote 25 Governments do not simply desire to produce popular policies; they practise statecraft, which Bulpitt defined as ‘the art of winning elections and achieving some necessary degree of governing competence in office’.Footnote 26 Political leaders seek to discover a governing formula or a political code, which sustains over time, protects the government from external risk and produces successive election victories.Footnote 27
Recent work on British politics returns to these classic themes of political calculation and strategy, as with Smith's study of election timing, whereby prime ministers use their discretion over the date of a general election to maximize incumbent electoral advantage in the light of anticipated economic conditions.Footnote 28 Other scholars find that governments minimize the risk of poor performance though the dismissal of ministers.Footnote 29 The approach we describe next extends this line of work by explaining how policy priorities are a component of statecraft.
A Theory of Public Policy Investment
Our public-policy investment approach can be summarized in the following way. We first claim that a higher stock of policy capital increases the likelihood that government will be re-elected. We then treat the emphasis of particular substantive policy areas by governments like investment by a fund manager who seeks greater returns to policy capital investment but considers risk in developing a strategy for buying and selling stocks. The government is the agent of the people, investing attention to prioritize policies on their behalf. Each substantive policy to which a government can allocate attention is known as a policy asset. The government establishes an initial portfolio of policy assets in its election manifesto. Proportions of attention to policy assets in the manifesto are called initial investment weights. The annual Speech from the Throne permits the government to rebalance its portfolio by choosing new investment weights. The public reveals a relative weighting of the importance of the policy assets, providing a price signal for the government in its investment decisions.Footnote 30 This weighting and re-weighting of policy assets – given the information incorporated in price signals – yields gains and losses to the government's stock of policy capital that affect electoral outcomes and reveal an important component of its strategy of statecraft.
Our framework for public valuation of policy assets relies on the arbitrage-pricing model from the financial economics literature.Footnote 31 To adapt this model to the political context, we explicitly consider its core assumptions in the context of the policy investment problem. Two assumptions are about how to characterize voters. First, we assume that voters have homogeneous expectations about policy outcomes. Each voter values some mix of policies in the same way as other voters, or that a characteristic voter, who wants a safe, quiet life, values a mix of policies she believes will achieve that objective.Footnote 32 Secondly, we assume that participation in the political process allows voters to acquire the information they need to know and reveals a relative weighting of the importance of a fundamental set of policy assets at a given time. But it does not imply that voters always clearly articulate this weighting, their policy price signal.Footnote 33 Governments endeavour to learn this importance metric and use it in their policy capital investment decisions.Footnote 34
Arbitrage pricing theory in financial markets assumes that the number of possible policy assets is large.Footnote 35 This would allow the government to eliminate idiosyncratic risk from its portfolio through diversification – that is, by holding a variety of policy assets. An important political constraint reduces the number of policy assets that politicians and publics can consider. Whilst it is certainly true that governments implement a range of more specific policies that change over time, whether out of rational apathy or cognitive limitations, voters have no hope of being able to understand each of these specific policies sufficiently to develop a relative weighting. In this light, we define policy assets as identifiable subsets of policies that voters cognitively collect and consider important across longer time periods.Footnote 36 This is a much smaller set of assets than the usual lists of the most important problem public opinion questions, or of other classifications. For instance, industrial policies relating to production, taxation, finance, trade and employment vary substantially over time, but we claim that they are incorporated into a single macro-economic policy asset that is valued by voters in each of the years of our study. What is more, policy commitments in legislation, the creation of independent agencies and devolution of powers to sub-national governments, such as Scotland, and the transfer of power to supra-national institutions, such as the European Union, make it more difficult for governments to ignore certain policy domains or to create new ones.Footnote 37 Combined with the limitations in voter engagement mentioned above, such commitments, we argue, create conditions that make the small number of assets stable over time.Footnote 38 Our approach to policy investment must respect these characteristics of policy attention.
Another key assumption of the arbitrage-pricing model is that returns are generated according to a linear factor model. Building a formal language for our argument, we claim that the government realizes policy capital returns vi for each of the n policy assets and each asset return has an idiosyncratic component ei that impacts that asset alone. By contrast, all assets are affected by a set of k competence factors that relate to the ability of the government to achieve return to policy capital investment. Competence factors are unexpected changes in conditions that affect government performance but are difficult for governments to influence significantly, at least in the near term. In financial markets, such factors have been estimated through measured innovations, or unexpected changes, in macro-economic variables – such as industrial production levels, unanticipated inflationary shocks and so forth – that a single firm, whose stock shares are priced in the market, cannot impact on its own.Footnote 39 Alternatively, other contributions have relied on factor-analytic methods to estimate reduced dimensional representations of these innovations.Footnote 40 Our empirical method takes the latter strategy and is explained in the following section. The main point at this stage is to note that competence factors help or hinder the government in raising policy capital from all policy assets. That is, an unexpected foreign crisis or scandal makes it hard to maintain competence in foreign as well as domestic policy, although the impact of changing factors may differ across policy domains. The difference can be measured in our framework and helps the understanding of aspects of government behaviour.
The small number of assets in our public policy context violates an assumption, rendering arbitrage pricing an approximation, rather than an exact rule for valuing policy assets. This does not render the method inappropriate.Footnote 41 The approximation in theory makes the government less able to understand the public valuation, creating what we have called price signal uncertainty that is more acute at some times than at others. This has two sources. First, when assets are characterized by high degrees of idiosyncratic as opposed to factor risk, the arbitrage-pricing rule is less accurate.Footnote 42 Secondly, the underlying model discussed below that relates competence factors to asset values may not be well understood by the government. The more returns to a policy asset depart from the policy asset pricing rule described in the next paragraph, the less accurate is the pricing mechanism. We say that periods of public-policy investment have varying levels of price-signal uncertainty, which refers to such departures. To understand the magnitude of such uncertainty and its effect on governments’ public-policy investment, we propose a Monte Carlo method for estimating it.
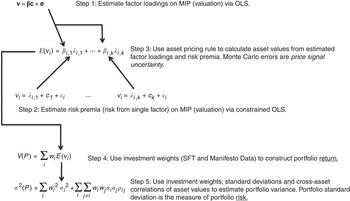
We now set out a more formal representation of our argument that reveals our estimation strategy. The policy-investment framework to studying policy attention is represented in a system of equations in the text below. Figure 1 is a visual display of links between the equations and the steps in our estimation strategy.
An overview of the party policy investment framework

The linear factor model through which assets are valued can be written in the following way:
 $${\bf {{v}}}\,{\rm{ = }}{\bf {{\brbeta c}}}\, + \,\bf e.$$
In Equation 1, v is an n × 1 vector of policy asset values, c is a k × 1 vector of competence factors; μ is an n × 1 vector of expected policy asset returns such that μ = E(v), e is an n × 1 vector of idiosyncratic influences on policy asset values and β is an n × k matrix of competence factor loadings. These estimable parameters capture the direction and magnitude of the impact of each factor on the asset returns; when factor k's loading is positive for asset i, shocks that increase k's value increase the return to i and vice versa. Competence factor loadings provide important information about the appeal of policy assets to government investors over time. For instance, the macro-economic policy asset can be differentially impacted by macro-economic, cost of living and even foreign-policy factors. This means that attending to the economy can be much riskier for some governments because of shocks that impact on all assets.
In the next step of our theoretical argument, we say that a policy asset can be priced as a function of the risk premium for each competence factor. To make the presentation clearer, we focus our notation on the individual policy asset and specify the relationship between the risk premium and asset i's value as follows:
 $${{{ {{ v}}}}_i}\, = \,{{{\rm{\lambda }}}_{i,k}}\, + \,{{{ {{c}}}}_k}\, + \,{{ \epsi }_i}.$$
We define the risk premium  $$${{{\rm{\lambda }}}_{i,k}}$$$ as the expected return on policy asset i when risk comes only from competence factor k, in other words, when the loading for factor k is 1 and the loadings for the remaining factors are zero value. This means that if we isolate risk to asset i to come only from factor k, the risk premium tells us what the expected return would be in that event. Having thus constructed the risk premia for each of the competence factors, expected return for asset i can be calculated according to the following asset pricing rule:
 $$E({{v}_i})\, = \,{{\mu }_i}\, = \,{\rm{0}}{{\lambda }_{\rm{0}}}\, + \,{{\beta }_{i,{\rm{1}}}}{{\lambda }_{i{\rm{,1}}}}\, + \, \cdots \, + \,{{\beta }_{i,k}}{{\lambda }_{i{\rm{,}}k}}.$$
The return for an asset bearing zero factor risk is given by  $$$ {{{\rm{\lambda }}}_{\rm{0}}} $$$. Because there is no such risk-free asset in the political market we analyse, its expected return is set to zero. The competence factor loadings βi ,1, … ,βi ,k are defined by Equation 1. Equation 2 states that the price of a policy asset is a linear combination of expected returns in the presence of each competence factor (the risk premia) and the weights of those factors in determining returns (the factor loadings).
The pricing rule described by Equation 3 is the key connection between policy attention and policy capital that lies at the heart of our framework. The price (expected value) of a policy asset is not simply a marginal response to public opinion about it. Equation 3 adjusts our opinion-based price signals by the consequence of each asset's exposure to innovations in factors that impact the government's ability to make policy in any domain. The pricing rule thus incorporates the consequences (via factor risk) of direct responsiveness within each and across all policy domains that comprise the assets and makes that information available to the government investor.
From Equation 3, we have the expected value (price) of each asset E(vi). The government's portfolio return can then be calculated as the following weighted sum:
 $$V(P)\, = \,\mathop{\sum}\limits_i {{{w}_i}} E({{v}_i}).$$
The investment weight wi is the percentage share of attention that the government gives to policy asset i. The government's policy portfolio value, then, is a linear combination of the investment weights government chooses for the i policy assets and the prices for the assets in which it invests as given by Equation 3. The portfolio is indicated by a dichotomous variable P ∈ [p,m] where m denotes the manifesto portfolio and p references the rebalanced portfolio in the Speech from the Throne. In the empirical context that follows, we calculate an initial portfolio value V(m) using investment weights from the government's manifesto and a rebalanced portfolio value V(p) using weights from the annual Speech from the Throne. Both measures are constructed according to the rule in Equation 4. The government's policy portfolio variance is then calculated as follows, where both i and j are policy assets:
 $${{\sigma }^{\rm{2}}} (P)\, = \,\mathop{\sum}\limits_i {w_{i}^{{\rm{2}}} \sigma _{i}^{{\rm{2}}} \, + \,\mathop{\sum}\limits_i {\mathop{\sum}\limits_{j\, \ne \,i} {{{w}_i}{{w}_j}{{\sigma }_i}{{\sigma }_j}{{\rho }_{ij}}.} } } $$
As in Equation 3, the investment weight wi is the percentage share of attention that the government gives to policy asset i. The standard deviation of prices for policy asset i is σi and ρij is the correlation coefficient between returns for assets i and j. The amount of risk in the government's rebalanced portfolio is measured by the portfolio standard deviation  $$$\sigma (\,p)\, = \,\sqrt {{{\sigma }^{\rm{2}}} (\,p)} $$$ and in the initial manifesto portfolio by
 $$$\sigma (m)\, = \,\sqrt {{{\sigma }^{\rm{2}}} (m)}$$$.Footnote 43 As specified, risk is reduced in the government's policy portfolio as the correlation between policy assets falls. To reduce risk, governments can rebalance their portfolios to decrease the correlation between the assets they hold and vice versa. This further illustrates the aforementioned difference from the method employed in the literature on opinion responsiveness. We do not treat the emphasis to each policy domain as independent of prioritizing other domains; we posit that attention to the environment can have consequences for government policy capital that are related to, say, attention to macro-economic policy. The acknowledgement of cross-asset correlations in risk calculations is thus a principal advantage of our theory.
Data and Methods
To apply our framework in the context of British politics requires the marshalling of a great deal of data from a wide variety of sources. We begin by describing why Britain in the period we study is an appealing context in which to implement our framework and test claims about the impact of risk and return on electoral outcomes. Then we discuss the measures, their sources and their analysis.
Case Selection
Between 1971 and 2000, policy making in Britain was concentrated in an executive led by the prime minister. There were no veto players at the national and subnational levels,Footnote 44 and centralized political parties – one being in government – controlled parliament.Footnote 45 Britain's first-past-the-post (single-member plurality) electoral system usually created a majority of seats for one party after a general election so that it could govern largely unchecked. The government determines the content of the policy agenda, which could be used to gain policy capital. These characteristics make the British setting a propitious, though by no means unique, context in which to apply our framework.
Within this system, the prime minister is very powerful, arguably more so than any other European premier.Footnote 46 She or he is leader of the governing party, may appoint and dismiss ministers,Footnote 47 chairs the Cabinet, is in charge of the bureaucracy and has the freedom to call elections. Consequently, any assessment of risk and return in British government must at the same time appraise the policy investment choices of prime ministers as well as parties in government. Even though the party in government alternated only three times in this period, six prime ministers held office.
The first decade of our study, the 1970s, has been considered a difficult period for political leadership for its three prime ministers: Edward Heath (1970–74), Harold Wilson (1974–76) and James Callaghan (1976–79). Many observers describe it as a period when the country became ungovernable, racked by internal dissent and militant trade unionism,Footnote 48 as well as suffering from instabilities in the domestic economy.Footnote 49 In contrast, the 1980s was a period of controversial, but powerful, leadership under Margaret Thatcher (1979–90). The final decade in the period saw John Major (1990–97) trying to keep a long-incumbent government on track,Footnote 50 followed by Tony Blair's premiership in its early phase. In short, we observe premiers with very distinct skills, strategies and reputations, who faced contrasting policy-making environments.
Policy Assets
Empirical categories of issues, which we call policy-asset classes to distinguish them from their theoretical counterparts, are developed from the coding schemes of the Policy Agendas in the United Kingdom project of the Manifesto Research Group.Footnote 51 We bridged the Policy Agendas and Manifesto Research Group substantive policy codes to facilitate comparisons between initial and rebalanced policy investments.Footnote 52 Table A1 of the Annex shows our reconciliation of these schemes and the formation of our policy asset classes. Manifestos are the source of a government's initial investment weights. We use the Speech from the Throne (often known as the Queen's Speech), an annual statement by the executive of forthcoming policies made at the start of the parliamentary session, to measure investment weights when governments rebalance their policy portfolios. It is widely agreed that the speech is an important indicator of the amount of emphasis the incumbent government gives to different policy areas.Footnote 53 We created five asset classes from Manifestos Research Group and Policy Agendas major topic codes to measure the policy assets. These asset classes are collections of specific policies that, as we have noted, the public understands and can process and are similar to those used in other work on macro-political trends.Footnote 54
The content of the policy asset classes is as follows. Social policy includes welfare state policies regarding services that government provides directly to the public, such as education and assistance for the underprivileged. Foreign affairs and defence encompasses international and territorial relations and includes foreign aid. Macro-economic policy includes all aspects of economic policy as well as substantive and industrial policies such as agriculture, labour and employment, banking, finance, international trade, domestic commerce, and transport. Environment and natural resources incorporates environmental and natural resources policy – for instance, energy, parks, pollution and water. Finally, law, order and civil rights consists of policies on freedom of speech and religion, privacy, immigration, crime and terrorism.
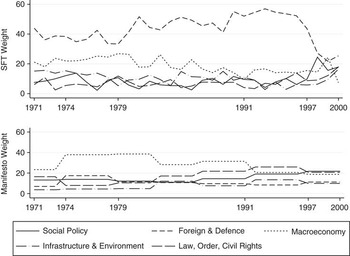
Similar to other treatments of the policy agenda and manifestos, we use percentages of the total number of quasi-sentences as our measures of the initial and rebalanced investment weights, wi from Equations 3 and 4.Footnote 55Figure 2 shows how investment weights drawn from the manifestos and speeches change over the period of our study. The vertical axes in each panel represent respectively the percentage of quasi-sentences in the Speech from the Throne and manifesto. These weights reflect government priorities over policy, which change over time. For example, the economic policy asset received lower investment from the early 1990s as economic conditions improved. There was also a decline in emphasis on foreign policy,Footnote 56 and a concomitant rise in attention to social policy and crime, a key part of Labour's policy programme when elected in 1997.Footnote 57 Such trends resemble other accounts of policy priorities in the United Kingdom in this period.Footnote 58
Investment weights, 1971–2000

Price Signals
In developing our theory, we claimed that the public constructs a relative weighting of the importance of the policy assets that provides a price signal to the government. These signals enter our theoretical framework as returns, v in Equation 1 (step 1 in Figure 1), and we measure them using mass surveys that gauge the public's view of the most important problem facing the country, Gallup's Most Important Problem (MIP). Whilst the MIP is not a perfect measure,Footnote 59 it is the primary and most widely available indicator of the mass public's relative prioritization of the focus of government attention and activities. It also exists in reliable form for a significant period of time, monthly between 1971 and 2000.Footnote 60 We developed a coding scheme (shown in Table A2 of the Annex) that relates MIP categories to the five policy assets introduced above. This scheme was used to develop our measures of returns, v in Equation 1.
Competence Factors
In our framework, competence factors, c in Equation 1, capture unanticipated volatility in political-economic conditions that influence the government's return on any policy asset. The competence factor loadings are estimates of the influence of each factor on each policy asset's returns, and this allows for different influences of the same factor on different assets at various points in time. These competence factors have an impact on all assets, albeit in different ways. When their values are favourable (positive loadings), factor realizations increase the value of assets. When they are unfavourable (negative loadings), they make the government's investment choices seem less competent to the public, lowering returns as the factors are realized.
To measure the competence factors, we implement the following procedure. We first select three observable economic indicators: inflation,Footnote 61 unemploymentFootnote 62 and stock market performance (the FT 30 Index).Footnote 63 Fluctuations in these indicators affect the well being of citizens through purchasing power and financial security. A fourth indicator captures cross-asset impact of foreign crises involving the United Kingdom, such as military actions and diplomatic dilemmas.Footnote 64 Voters’ sense of national security and stability is affected by events of this kind. The fifth observed indicator focuses on political crises within the government itself, namely, ministerial resignations. We indicate events caused by personal error, departmental error, sexual scandal, financial scandal, policy disagreement and personality clash.Footnote 65 Our claim is that these types of resignations could not have been fully anticipated by the prime minister and created shocks that had an impact on returns across assets. Such events make an impact on citizens’ trust and confidence in the government's ability to make policy. These observed indicators provide the data source for the competence factors.
The second step in our measurement strategy was to submit these observed indicators to a mixed factor analysis.Footnote 66 Four factors emerged and correlations suggested that they were associated with macro-economics, the cost of living, foreign policy and government personnel conditions.Footnote 67 Finally, because in theory the competence factors in Equation 1 indicate unexpected changes, the third step is to measure each factor named above with residuals from regressions of each estimated factor realization in month t on its value in month t – 1.Footnote 68 These residuals form our competence factor measures.
Risk, Return and Uncertainty
The estimation of risk and return in the government portfolio and uncertainty in public price signals for the policy assets proceeds in four stages. We begin by estimating loadings β on the competence factors through Equation 1. This procedure involves time-series regressions of asset i's returns vyi = MIPyi on the factors, where y ∈ [1971, 2000] indexes the year. Because each annual regression has a small number of observations (N = 12 months),Footnote 69 we estimate the coefficients via ordinary least squares (OLS) with bootstrapped standard errors based on 10,000 replications.Footnote 70 The bootstrapping procedure allows for calculating appropriate uncertainty estimates for the factor loadings that will be used in our measure of price signal uncertainty described below (Step 3 in Figure 1). We estimate a total of 600 competence factor loadings (k = 4 loadings for each i = 5 assets for y = 30 years).
To understand the second step of our estimation strategy, recall from Equation 2 that the risk premium  $$$ {{{\rm{\lambda }}}_{i,k}} $$$ is the expected return on policy asset i when risk comes only from competence factor k. We thus estimated risk premia via constrained OLS regression of returns to asset i, vyi = MIPyi, on factor k where the coefficient on factor k is constrained to unity. As before, we employ a similar bootstrapping routine of 10,000 draws because of the small sample (N = 12 months) and the need for uncertainty estimates for the risk premia when calculating a measure of price signal uncertainty (Step 3 in Figure 1). We estimate a total of 600 risk premia (k = 4 risk premia for each i = 5 assets for y = 30 years), the main difference from the preceding procedure being the number of estimating equations, k = 4 equations for each asset in each year (600 here versus 150 for estimating the factor loadings).
In the third step, we estimate uncertainty in price signals with a Monte Carlo procedure.Footnote 71 Specifically, we draw 1,000 observations from a multivariate normal distribution with means equal to parameter estimates for β and the  $$$ {{{\rm{\lambda }}}_{i,k}} $$$ and standard deviations equal to the bootstrapped standard errors on those quantities as given by the procedure described in the last two paragraphs. We then use the asset-pricing rule (Equation 4) to calculate returns for each of the policy assets using each of the 1,000 draws as data. The mean of value of the 1,000 resulting returns for asset i becomes our measure of i’s return, vi, and the standard deviation measures uncertainty in the price signal for asset i. When the standard deviation is larger, the price signal provides the government with more ambiguous information about the public's policy priorities.
In the fourth step, portfolio return is computed according to the formula in Equation 4. We calculate two values for portfolio return using the estimated v and investment weights, wi, drawn, (a) from the manifestos to calculate V(m) and (b) from the Speech from the Throne to calculate V(p).
In the fifth and final step, two values of portfolio risk are similarly calculated according to Equation 5 using the manifesto and Speech from the Throne investment weights. To permit useful visualizations of our data, we transform portfolio risk measures as the natural logarithm of the portfolio standard deviation using investment weights from manifestos to compute σ 2(m) and speeches from the throne to calculate σ 2(p). Portfolio return is monotonically transformed by adding its minimum to generate positive values over its range; the natural logarithm of those transformed data is our measure of return. In all, we generate 150 values each of asset-specific risk, asset-specific return, asset-specific price signal uncertainty, portfolio risk, portfolio return, and portfolio price signal uncertainty (one for each i = 5 assets in each of y = 30 years).
Results: Risk and Return, 1971–2000
We present our results in four stages.Footnote 72 First, we show a portrait of risk and return throughout the study period. Secondly, we examine asset-specific returns and associated competence factor loadings over time. Thirdly, we use regression analysis to examine the impact of risk and return on electoral rewards for the incumbent government party. Fourthly, we explore British statecraft by modelling attention to policy assets, which we have called investment weights, in the Speech from the Throne as a function of policy investment considerations and competing theoretical variables.
A Descriptive Look at Risk and Return
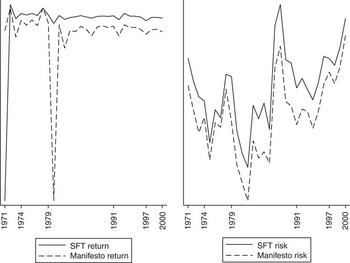
Policy portfolio risk and return over the study period are presented respectively in the two panels of Figure 3. The reader can examine these graphs and observe trends over time, which represent the content and impact of policy investment decisions. The left-hand panel shows the returns governments achieved from rebalancing their portfolios, V(p). The dashed line indicates a counterfactual – the return the government would have obtained had it stuck to attention levels in its manifesto V(m). Governments want to implement the contents of their manifestos and usually do so.Footnote 73 They prefer to avoid costly shifts in policy.Footnote 74 This is a manifestation of the dreaded U-turn that successive British prime ministers have learnt never to admit: consider Margaret Thatcher's 1980 party conference speech declaration, ‘The lady is not for turning.’Footnote 75
Return and risk in Speech from the Throne and manifesto investments, 1971–2000

The negative consequences of an ‘attention U-turn’ are illustrated early in Heath's premiership.Footnote 76Figure 3 shows the differences in the results he would have obtained from his manifesto and what risk and return his rebalancing achieved. His government generated a very low portfolio return in 1971, much lower than adherence to the manifesto would have yielded. But such U-turns can be beneficial to a premier. Had Thatcher stuck to the policy investment weights of her party's manifesto, the value of her government's portfolio would have dropped quite dramatically as Figure 3 illustrates. Negative shocks from every factor to the macro-economic asset were a principal culprit – as we shall see shortly. But by canny investment and, by implication, an attention U-turn – in the same year as her famous speech – Thatcher held a steady stock of policy capital throughout the 1980s. It is certainly ironic that the most successful example of an attention U-turn was from the prime minister who prided herself in not indulging in the practice. Yet this behaviour is consistent with accounts of Thatcher's leadership style. Whilst resolute and strident in public, especially when she needed to be,Footnote 77 in practice she was tactical, at least during her first two terms of office.Footnote 78 These examples show how our measure provides a unique test of the abilities of leadership by quantitatively distinguishing between promises and action.
A critical aspect of government leadership emerges by comparing trends in the left-hand and right-hand panels of Figure 3. It is straightforward to observe that manifesto risk and return is always lower than that from the rebalanced Speech from the Throne portfolio.Footnote 79 Risk acceptance in policy investment appears to be part of the overall strategy of statecraft. The result, nonetheless, is a remarkably stable set of returns, even in periods of high risk such as the late 1970s and late 1990s.Footnote 80 We argue that effective leadership can be found when governments are able to bear the costs of deviating from the investment strategy embedded in their manifestos in order to increase their returns. An active investment strategy emerges from our data as an element of statecraft; stability in returns is crucial and governments assume significant risk to maintain it.
Asset Specific Returns
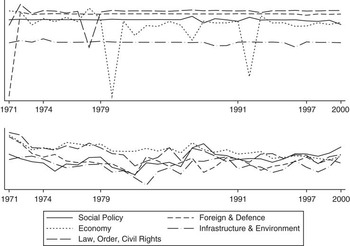
Assets are priced in environments of greater or lesser quality pricing information, and we develop a measure of price signal uncertainty. Figure 4 presents the returns and price signal uncertainty over the period. The top panel shows returns for each asset. The primary finding is that the macro-economy is by far the most volatile asset and over which the public has the most uncertainty in its price signal. Volatility in this asset shows why governments must adjust it nearly constantly over time and in ways that divert from the attention it is given in manifestos, as Figure 2 clearly illustrates through investment weights. The macro-economic asset gets the highest investment weights in manifestos until the early 1990s in our sample,Footnote 81 but it is constantly rebalanced in the Speech from the Throne.
Asset specific return and price signal uncertainty Note: Asset specific return appears in the upper panel. Price signal uncertainty is represented in the lower panel.

Whilst the macro-economic asset must be actively managed and the consequences are high, other assets appear less problematic for governments. Returns to social policy and environment and natural resources were flat in the period, whilst their investment weights (see Figure 1) were not. Foreign and defence policy as well as law and order experienced temporary large drops in 1971 and 1978 respectively, but were likewise rebalanced quickly. Governments seemed to be able to manipulate attention to those assets and achieve stable returns, but this was not the case with the economy. As the economic voting literature suggests, the economy is important, but our results suggest that it is difficult to attend only to it given fluctuating public uncertainty about its value. This happens at particular periods such as in 1978 before Labour's general election defeat amid industrial unrest, and in 1992 after the United Kingdom left the Exchange Rate Mechanism. Comparisons across assets permitted by our approach demonstrate a broad range of government strategies.
It becomes instructive for our account of policy investment that in some years policy portfolios performed poorly, partly for reasons in the prime ministers’ control (investment weights) and partly from those out of their control (for instance, price signal uncertainty). When price signal uncertainty is high, the public are not collectively clear about the ranking of policy assets or, in other words, the asset-pricing rule is more of an approximation, as discussed earlier. This varies substantially among the assets and over time. For example, foreign affairs and defence had the most ambiguous price in 1971, which may partly explain Heath's acquisition of it despite the low value of the asset in that year. Indeed, Heath faced significantly more uncertainty across assets than the rest of the premiers in our sample combined and compared to Thatcher specifically.Footnote 82 Thatcher's better outcome from U-turning may well have been affected by that difference in the uncertainty on the part of the voters. The approximation in the asset-pricing rule is much more problematic for some governments than for others.
Factor Risk
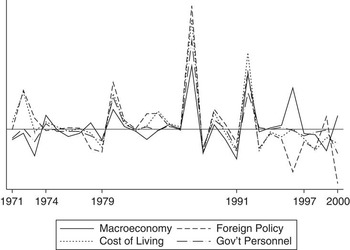
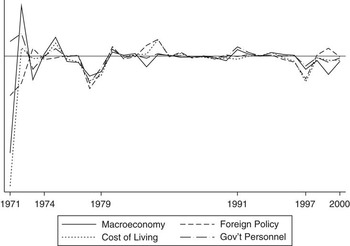
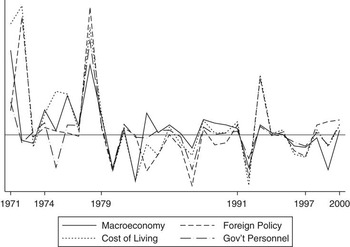
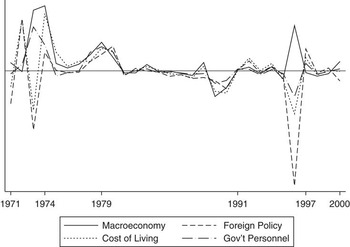
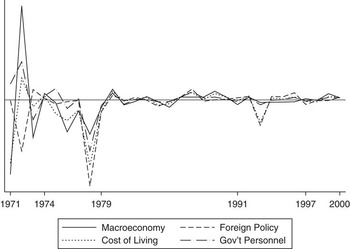
The asset-pricing rule (Equation 3) states that the price, or expected return, of an asset is a function of the factor loadings. It is useful, then, to examine the factor loadings to understand the factor risk profiles of the various policy assets at different points in time. Figures 5–9 depict the competence factor loadings for each asset over the period of study. When the factor loadings are positive, unexpected positive shocks increase returns; but when they are negative, such positive movements decrease returns.
Competence factor risk for social policy asset Note: Horizontal line represents zero impact from each competence factor on the policy asset.

The figures show considerable variation in loadings over time making this quite difficult for governments to predict. Figure 5 suggests it would have made sense for Thatcher to invest in social policy during the 1980s, but not towards the end of her premiership in 1990. On average, she faced lower, less favourable competence factor loadings from foreign policy and government personnel factors on social policy returns than all of her counterparts combined.Footnote 83 Surprisingly, given the Blair Government's interest (as shown by its investment levels in Figure 2) in social policy, factor loadings in terms of foreign policy and the cost of living suggest it was a courageous choice.Footnote 84
The loadings during the Blair years highlight a particular difficulty facing governments, namely competence factor volatility. This means that at a single time, shocks from different sources impact the same asset in different ways. Figure 6 shows little competence factor volatility in foreign policy, except in 1971 when Heath invested in it and was rewarded with a very low return. The only competence factor helping Heath in foreign and defence investments, compared to the other prime ministers in our sample, was the government personnel loading. In 1971, it seems clear that he took an unnecessary risk by investing in European Union policy promises when the returns for foreign and defence attention were negatively shocked by cost of living, foreign policy and macro-economic factors.Footnote 85
Competence factor risk for foreign affairs and defence asset Note: Horizontal line represents zero impact from each competence factor on the policy asset.

Consistent with our observations above, the macro-economic policy asset (Figure 7) is susceptible to substantial competence factor risk from all sources. This underlies the volatility in its overall performance. As noted previously, Thatcher faced a significant challenge in this area, specifically from the foreign policy and cost of living factors that made exposure to this asset toxic early on in her premiership;Footnote 86 in contrast, Heath was helped by greater loadings on the foreign policy and cost of living factors.Footnote 87
Competence factor risk for economy asset Note: Horizontal line represents zero impact from each competence factor on the policy asset.

Figure 8 provides evidence that the environment and natural resources asset saw very favourable competence factor shocks from some sources, but not from others. Major, for example, was hampered by foreign policy, cost of living and government personnel shocks.Footnote 88 Nonetheless, the return was consistent and low from that asset.
Competence factor risk for environment & natural resources asset Note: Horizontal line represents zero impact from each competence factor on the policy asset.

Finally, factor risk to the law, order and civil rights asset is examined in Figure 9. This asset also sees few periods of factor shocks for much of this period, but experienced dramatic negative factor shocks in the late 1970s. Figures 2 (investment weights) and 3 (portfolio returns) show able portfolio management by the Labour governments of Wilson and Callaghan to achieve stable portfolio returns by keeping attention to that asset low. All but the macro-economic factor created a more difficult environment for those prime ministers.Footnote 89
Competence factor risk for law, order, & civil rights asset Note: Horizontal line represents zero impact from each competence factor on the policy asset.

The Impact of Risk and Return on Electoral Outcomes
If policy portfolio risk and return matter to governments, they must matter to the citizens on whose behalf public policy investment is undertaken – that is, those characteristics must affect governments’ electoral prospects. Yet the risk-taking behaviour that we have revealed suggests that the timing of decisions to load on or shed risk must be important as well. Scholars of representation note differences in temporal impact as an aspect of concerted government-policy decision making. For instance, Manin, Przeworski and Stokes write, ‘if the incumbent believes that [a] less popular policy is sufficiently more effective than the one voters prefer, he or she anticipates that, having observed its effects, voters will become persuaded that the correct policy was chosen and vote to re-elect, so that the politician will be able to continue the policy that is in effect better for citizens.’Footnote 90 We refer to this argument as learning-in-representation. Some scholars of British politics have explored a lag structure in government popularity.Footnote 91 We test the claim that portfolio risk and return have contemporaneous and one year lagged effects on the electoral fortunes of the governments associated with them.
General election results are a very coarse measure in our sample. To address this problem, we have developed an annual measure of government electoral performance at by-elections, which occur throughout the course of parliament when an MP dies or resigns. One of the advantages of by-elections is their heterogeneity as they may occur in any part of the country at any time. They also attract high attention from the media, highlighting the record of the government against which voters may protest.Footnote 92 As such by-election results can be averaged for the period between speeches as a verdict on government performance. Other non-general election measures, such as opinion polls of local elections, are not so advantageous.
Our dependent variable, Government Reward (mean = −2.45, SD = 0.66), summarizes the results for government parties in by-elections between 1971 and 2000.Footnote 93 It is measured in two steps. First, we average the difference in vote percentage from the general election in each by-election in a given year to form the annual swing. Each of these swings is negative except for 1973, which is coded zero as no by-elections occurred and thus no swing from the general election was observed. Secondly, we calculate ln(1/(1 + |annual swing|)) to serve as our dependent variable. Higher values indicate more electoral support for the party in government.
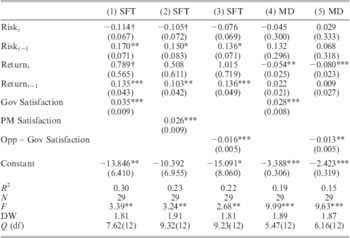
Two sets of models are estimated with results presented in Table 1. Models 1–3 in Table 1 use Risk (mean = 11.12, SD = 1.61) and Return (mean = 10.51, SD = 0.20) based on Speech from the Throne investment weights, that is, they employ values of V(p) and σ(p) respectively. Positive values show greater risk or return from Speech from the Throne investments. We anticipate that return will positively influence electoral reward, and that the public must accept risk such that it positively influences reward, at least at some time in the future. Thus, we do not expect a contemporaneous positive impact of risk as a result of the learning-in-representation claim discussed above, but we do anticipate a positive effect for lagged values when the electorate has become persuaded. We test these claims in the models presented in Table 2.
Government Reward as a Function of Risk and Return, 1971–2000

Notes: The first four rows of coefficients can be understood as follows. Models 1–3 employ risk and return measures based on investment levels the Speech from the Throne (SFT), that is σ(p), V(p) respectively. These are our core tests of the impact of risk and return on by-election outcomes. Models 4–5 use risk and return differentials due to manifesto departures (MD), that is σ(p) − σ(m) for risk and, V(p) − V(m) for return. Heteroscedasticity-robust standard errors are shown in parentheses. DW denotes the Durbin–Watson and Q the Ljung–Box Q statistics for the assessment of autocorrelation. †p < 0.10 one-tailed test, *p < 0.10, **p < 0.05, ***p < 0.01.
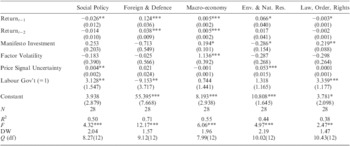
The Determinants of Investment Weights, 1971–2000

Notes: Heteroscedasticity-robust standard errors are shown in parentheses. DW denotes the Durbin–Watson and Q the Ljung–Box Q statistics for the assessment of autocorrelation. *p < 0.10, **p < 0.05, ***p < .01.
Beyond the popular stories about U-turns in British political lore, learning-in-representation claim can be seen to include a pertinent corollary: ‘Even changes of conditions that are endogenous to government policy, but were unforeseen by politicians before they reached office may be reasons to change course in the interest of citizens’ welfare.’Footnote 94 Model 4 tests the rebalanced reality against the manifesto-based counterfactual by examining the electoral impact of departures from the manifesto through portfolio rebalancing. Model 5 employs Departures of risk and return from manifesto values of risk, σ(p) −σ(m), and return, V(p) −V(m) respectively as the main independent variables. As we discussed in the preceding section, manifesto departures can be considered a measure of attention U-turns as they indicate changes in the magnitude of policy attention from manifesto levels. When these measures take negative values, less risk or return from the government portfolio is yielded by the Speech from the Throne than the manifesto, and relatively more from the manifesto when the measures are positive. In the case of return, positive values mean that the government's portfolio rebalancing yields more policy capital, which should be associated with higher electoral reward. For risk, positive values mean that rebalancing exposes its portfolio to more risk, which should be associated with negative rewards in the short term. Of course, these are attention-based U-Turns, which may not have the same degree of electoral impact as shifts from programme to policy choices, say, from manifestos to enacted laws. If departures negatively impact government electoral reward, one aspect of the conventional wisdom about U-turns would appear to be validated.
Our argument is that policy capital is managed as an element of statecraft. This implies that the fruits of this investment strategy must not be conflated with a general sense of popularity enjoyed by governments. As a proxy for such overall popularity, we employ Government satisfaction (mean = 31.59, SD = 9.22) and Prime ministerial (PM) satisfaction (mean = −40.92, SD = 9.94). These variables indicate the percentage of survey respondents expressing support for the government or for the prime minister in each year. Distinguishing prime ministerial from government satisfaction allows us to address the personal popularity of the prime minister, which at times is different than that of the government as a whole. These variables are, however, highly correlated (0.88) and are not included in the same model because multicollinearity would make their individual impacts difficult to disentangle. We also include the difference between opposition and government satisfaction (mean = 4.91, SD = 16.69) polls in separate models.Footnote 95 This differenced measure controls for opposition activity, which may gain advantage from not being in government as well as when it makes the opposition appear more moderate.Footnote 96 The opposition–government difference in popularity might also be seen to capture partisanship in the electorate, albeit crudely. This variable takes positive values when opposition exceeds government satisfaction, and vice versa. Models 1–3 examine the impact of risk and return in Speech from the Throne investments over and above that of baseline support from the public: Model 3 includes the opposition–government difference, Model 2 PM satisfaction, and Model 1 government satisfaction.
All models are estimated by OLS and do not display evidence of autocorrelation. We came to this conclusion based on an examination of residual plots as well as the Durbin and WatsonFootnote 97 and Ljung and BoxFootnote 98 portmanteau Q-statistic reported with the estimation results in Table 2.Footnote 99
Our results suggest that risk and return affect the government's electoral performance in interesting ways. Model 1 suggests that reducing portfolio risk contemporaneously helps the government in terms of electoral reward, but risk-taking does so in retrospect as the coefficient on the lag of risk is significantly greater than 0. The public seem willing to tolerate a riskier strategy from their government, but not immediately as suggested in the learning-in-representation argument above. As expected, Model 1 shows that greater performance is associated with greater returns; both contemporaneous and lagged returns help the government at the ballot box.
The bottom line is that both risk and return influence election outcomes, but the government must carefully consider the timing of risk-taking strategies because of the evidence of initial punishment we have uncovered. Government popularity and investment risk and return collectively explain about 30 per cent of the variance in our measure of electoral reward. The model including government popularity (Model 2) explains more of the variance in electoral performance than those relying on prime ministerial popularity (Model 3) and net opposition popularity (Model 4), but each measure produces results consistent with our expectations. Government and PM satisfaction are associated with better fortunes for the incumbent government as would be expected whilst greater net satisfaction with the opposition has the opposite effect.
Models 4 and 5 examine the impact of U-turns, with the former including government satisfaction and the latter the opposition–government popularity differential. These models show striking contemporaneous punishment of governments that make U-turns from their manifesto yield greater returns. Differences in risk resulting from U-turns, however, have no effect either contemporaneously or in one-year retrospect. Increased risk from the rebalanced portfolios constructed in the Speech from the Throne does not have negative electoral consequences according to our estimates.
Policy Investment and British Statecraft
We have made the argument that the investment decision is one way to understand government statecraft. In this section, we statistically examine how investment considerations from our approach as well as competing theories of a programme-to-policy connection and party issue ownership shape investment decisions.Footnote 100 The dependent variables for the models presented in Table 2 are the asset-specific investment weights (wi).Footnote 101 From our framework, we examine the role of past policy (namely, one-year and two-year lagged) successes in terms of the impact of the asset-specific return Footnote 102 on investment choice. We also examine the role of price signal uncertainty Footnote 103 in characterizing a particular asset in the year of the Speech from the Throne and its impact on investment weights. Finally, factor volatility can characterize the policy investment environment at the time of rebalancing. Our measure taps the cross-factor variance of the factor loadings depicted in Figures 5–9 (mean = 0.32, SD = 0.48). Factor volatility is computed as  $$${{\psi }_i}\,= \,\mathop{\sum}\nolimits_k {{{{({{\beta }_{i,k}}{\rm{ - }}{{{\bar{\beta }}}_i})}}^{\rm{2}}} }$$$ where βi ,k is the factor loading for factor k on the value of asset i and
 $$${{{\beta }}_i}$$$ is the average of the k factor loadings for asset i. Our measure of factor volatility for policy asset i is ln(ψi). Higher values of the variable indicate differential pressures (as in the late 1990s for social policy in Figure 6) while lower values indicate pressures in the same direction (as in the early 1990s for social policy) exerted by competence factors on asset values.Footnote 104 We test two-tailed hypotheses for each of these effects.
Competing theories are assessed along with those arising from our framework. We test whether manifesto commitment (as measured by the percentage of quasi-sentences in the manifesto related to each asset)Footnote 105 increases, as would be expected from accounts of the programme-to-policy connection, the amount of investment during Speech from the Throne portfolio rebalancing. Party issue ownership is indicated by the presence of a Labour government, which was the case in nine out of twenty-eight years in our estimation sample. Because we assert that the investment decision is a unified one – that balancing attention to competing policy areas is part of statecraft – our estimates are based on a seemingly unrelated regression model. A Breusch–Pagan test weakly suggests independence in the asset decisions (χ 2 (10 df) = 14.89, p = 0.14), but cross-asset error correlations are as high as 0.44 and the test is more inconclusive than persuasive.
Table 2 shows that lagged return plays a role in the investment decision regarding each of the five policy assets. Tests of joint significance across models further suggest that the investment considerations of factor instability (F = 2.14, p = 0.06) and price signal uncertainty (F = 4.11, p = 0.002) are important in the joint decision about which policies to emphasize. Moreover, competing theories of following manifesto commitments (F = 3.01, p = 0.01) and of party issue ownership (F = 4.09, p = 0.05) are also important in the investment decision. Our models explain between 38 and 71 per cent of the variance in Queen's Speech policy asset selection.
To illustrate the significant substantive effects, we simulated (N = 1,000) changes in the expected percentage of attention in the Speech from the Throne provide, allowing the significant independent variables to change from their minimum to maximum values in the estimation sample with other variables held at their means.Footnote 106 Moving from the minimum to maximum values of the lagged return effects is associated with a 7 per cent decrease for social policy, a full 39 per cent increase for foreign and defence policy, a 9 per cent increase for macro-economic policy, a 4 per cent increase in Environment and Natural Resources and a 6 per cent decrease in law, order and civil rights. Allowing factor volatility to increase through its sample range is associated with an 8 per cent increase in macro-economic policy investment. Increasing price signal uncertainty over its sample range increases social policy and Environment and Natural Resources policy investment by 6 and 8 per cent respectively.
Effects from competing theories are likewise important, but notably smaller than the past return values and each is smaller than all but one of the significant effects identified from our policy investment theory. Manifesto attention increases are associated, other things being equal, with a 4 per cent increase in macro-economic policy, a 3 per cent decrease in environment and natural resources and a 4 per cent increase in law, order and civil rights investment. To assess the size of the issue ownership effects, we simulate the effect of electing a different party into government. Changing to Labour from Conservative is associated with a 3 per cent increase in law, order and civil rights and a 4 per cent increase in social policy investment. An election that swings the government from Labour to Conservative is associated with a 9 per cent increase in foreign policy investment. Overall, these findings suggest that our theory substantially enhances what we know about what drives government policy emphasis.
Conclusion
To explain the prioritization of substantive policies, we have presented a novel account of government as an investment manager of policy assets. Rather than directly or strictly responding to concerns expressed by the public, governments carefully consider a policy's risk profile and expected return when determining whether to devote attention to topics, in addition to such other considerations from the literature as manifesto promises and party issue ownership. The core of our theory is derived from well-established work in financial economics, which we have adapted to a political context.
Such an account is novel because many existing approaches conclude that the prioritization of policies is determined by the external considerations of the government, whether public opinion itself, competition for the median voter or information processing by agenda setters. Studies also tend to focus only on one policy domain, such as economic policy, or reduce them into a summary metric such as a left–right scale. Complementary to these models, we show how outside factors affect the decisions of incumbent office holders; but that they also use their discretion to shore up policy capital. We believe this account of policy making corresponds to how office holders typically respond to day-to-day problems and seize opportunities. Indeed, we trust our account of the politicians in charge, such as the contrast between the management strategies of Heath and Thatcher, is recognizable to seasoned observers of British politics. Moreover, we believe our account of statecraft resonates with the conclusions found in older literatures on comparative executive government, in studies of the American president or accounts of the British prime minister and cabinet.
Our analysis uncovers several important elements of leadership by British governments. First, governments take more risk when investing in policy assets whilst in government than they do in their manifestos. We find no evidence that the voters punish this deviation from the government's electoral promises. Secondly, the timing of investment decisions is very important. Risk from unexpected shocks to factors affecting all policy assets – and thus the perceived competence of governments – can fluctuate dramatically over time and across policy domains. Return from a manifesto departure, or attention U-turn, hurts government performance in by-elections during the year it occurs and would make re-election difficult if done too close to a general election. That punishment fades after a year, however, and increasing returns do help performance generally, and the favourable climate created by good returns persists into the following year. Thirdly, macro-economic policy making faces the greatest volatility in factor risk of all policy assets. Fourthly, governments do plenty of rebalancing of their policy portfolio between elections to achieve stable returns to their policy capital and preserve the stock they had upon winning the election. Fifthly, some prime ministers face noisier signals about the value of policy assets from the voters than do others, and this makes their investment choices relatively more difficult.
We sought to understand how British prime ministers practised statecraft by using past risk and investment as determinants of the content of the Speech from the Throne and a range of other independent factors. We find that past investment return in a policy area increases current investment in that policy in Speeches in some cases, but not others. That is, a naïve model of investment in which governments invest where past gains have been realized does not fully describe policy attention. In foreign and defence policy, over the macro-economy, and environment and natural resource domains, prime ministers use the successes of past investments to guide their current policy decisions, and they respond positively to price signal uncertainty and factor risk. Yet in social policy and law, order and civil rights, governments disinvest after successes, seemingly to maintain their gains. A topic for future research may be found in these differences in signs across policy domains, which may, for instance, reflect the priority of the economy as well as foreign and defence policy as core concerns of governments. It is also important that issue ownership and manifesto commitment shape investments beyond policy investment considerations, as those literatures would predict. Prime ministers remain party politicians in these respects, but investment considerations have larger substantive impacts on the allocation of policy priorities than these party-political characteristics.
We argue that Britain provides auspicious conditions for implementing our policy investment approach. Governments between 1971 and 2000 were untrammelled by election bargains or negotiations across institutions in systems with a separation of powers. The prime minister can concentrate on investment choices as she or he can generally control cabinet colleagues, be secure in office for up to a five-year term and face no veto players in the second chamber or in other branches of the state. Indeed, we draw attention to a neglected line of writing about British politics that stresses the freedom the executive has to determine the agenda to produce responsible and responsive government. The irony suggested by our results is that through constitutional reforms that allocate powers to other actors, the governments elected since 1997 have been tearing down the very features of the British state that helped enable the government to act as an investment manager. Nonetheless, we expect our policy investment approach to produce valuable insights into the future of British politics, not least because it is possible to adapt the approach to coalition governments, which were in existence before 1945 and have emerged again since 2010.
Partly for this reason, there are important lessons for political systems outside Britain, such as those with many parties in office. In these cases of coalition governments, parties trade manifesto items and bargain for space in the Speech from the Throne or equivalent list of policy promises. In other respects, the policy investment model described in this article also applies to coalition agreements providing initial policy investment weights rather than individual party manifestos. In separation of powers systems such as the United States, public policy investment is the product of compromise among executive, legislative and even judicial actors, a scenario that may admit different initial weights even when members of the same party control political institutions. Separate branches face transactions costs in coming to an agreement, which will need to be modelled in future work. Such additional country cases will provide additional tests of policy investment framework and will produce different predictions about the nature of statecraft in those systems.