This paper focuses on a particular vowel variable, the BATH vowel (Wells, Reference Wells1982) that brings into relief many aspects of the vowel systems of English in South Africa (henceforth SAfE) and the large-scale sociolinguistic changes characteristic of postapartheid society.Footnote 1 The vowel is a particularly good diagnostic of the many crisscrossing currents that make up English in a complex multilingual and multicultural society. SAfE shows an interplay between a central-to-back BATH vowel (like traditional received pronunciation [RP] [ :]) and other variants that are fully backed as [ɑ:] or backed and (weakly) rounded as [ɒ:], or backed and raised, with concomitant rounding as [ɔ:]. Daniel Jones (Reference Jones1962[1918]:74) characterized the formation of RP [:] as follows: fully open; highest point of tongue somewhat in advance of the center of “back,” neutral lips, medium to wide opening between the jaws.Footnote 2 By Jones's characterization, the RP value of BATH is not fully back, but enough to be considered a back vowel. On the other hand, a fully back quality appears acceptable in RP today, judging from descriptions like those of Gimson (Reference Gimson1962:105 and subsequent editions), who described a range within RP that includes [a:] at one end to a realization “retracted near to the quality of Cardinal [ɑ] . . . typical of some advanced (refined) RP speakers.”Footnote 3 But the RP variant that has prestige internationally is the center-to-back one described by Jones.
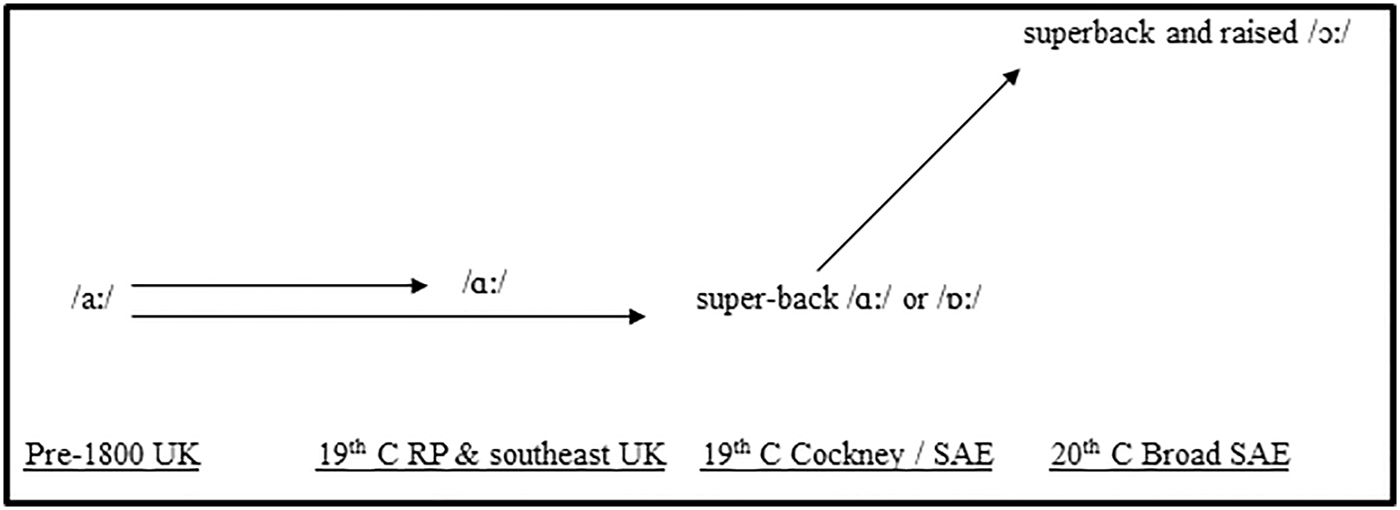
The original backing of /a:/ is an innovation of southern British English dating to the early 1800s (Wells, Reference Wells1982:234), with Northern English resisting the innovation until today. On the basis of comments by observers in the late 18th and early 19th centuries, MacMahon (Reference MacMahon and Romaine1994:455–456) deduced that backing (i.e., a central-to-back realization) was initially associated with the lower classes, while a front or front-to-central realization occurred with others. Backing only became socially acceptable by the late 1860s—see also Trudgill (Reference Trudgill2004:59–67). In some varieties /a:/ was retracted even further as a fully back vowel—a process we label “superbacking.” Ida Ward (Reference Ward1929:77) wrote that “In London a very retracted [ɑ] used to be common, though at present a common forward [a] (fa:ðə) is frequently heard. . . .” Historically the RP variant had overt prestige in South Africa, and covaried with the fully back one that carried more localized, vernacular orientations (Lanham & Macdonald, Reference Lanham and Macdonald1979:153) (see Figure 1).
Shifts involving /ɑ:/ in SAfE and its antecedents.

The BATH set of this paper—as with southern British English—is really a superset made up of BATH proper, START, and PALM, all of which have /ɑ:/. “BATH proper” is the subset that corresponds to the historical retention of /æ/ before voiceless fricatives (as in bath, fast, class) in varieties like U.S. English. The START set of SAfE corresponds to that of RP and U.S. English, with /ɑ:/ before historical /r/. This characterization is not affected by the fact that U.S. English is (with a few exceptions) rhotic, while SAfE and RP are not. The PALM set in all three varieties shows backing before (historical) /l/. In the United States, the PALM set may have to be extended to include the word father, some loanwords like taco and a few open syllables like ah, ma, and pa. Thus it is the START and PALM sets of the United States that are comparable to the BATH superset of this South African study. The equivalent of South African superbacking can be heard in some U.S. dialects. The Atlas of North American English (Labov, Ash, & Boberg, Reference Labov, Ash and Boberg2006:111) showed the most retracted variants of /ahr/ to occur in the Midlands and the South (with F2 readings ranging from 960 Hz to 1140 Hz). They note further that the height of /ahr/ does not play as great a role in dialect differentiation, except in eastern New England and the Great Lakes region, where much lower variants occur. Elsewhere Labov (Reference Labov2010:41) described a chain shift that has been completed in Philadelphia “with no significant variation by social class, gender or age”: /ahr/ shifts to mid-back position, taking the place of /ohr/, which moves to high-back position in a merger or near-merger with /uhr/.
THE VARIETIES OF SOUTH AFRICAN ENGLISH
The variety that was introduced via colonization and settlement in 19th-century South Africa was an offshoot of Southern British English (Lass, Reference Lass and Mesthrie1995), having its most important centers in Cape Town (1795), Port Elizabeth (1820), Durban (1840), Kimberley (1871), and Johannesburg (1886). According to Lanham and Macdonald's (Reference Lanham and Macdonald1979) model of the historical development of SAfE, the Eastern Cape (represented in this study by Port Elizabeth) showed the influence of 19th-century working-class speech from the southern parts of England, whereas Natal (represented by Durban), compared with the Eastern Cape, had a somewhat greater proportion of middle-class and Northern British settlers. As far as English speakers are concerned, Cape Town first had administrative and army personnel and later attracted people from a range of social backgrounds—from unskilled laborers to craftsmen, retailers, and professional people (Worden, Van Heyningen, & Bickford-Smith, Reference Worden, Van Heyningen and Bickford-Smith1998:94–95). The discovery of diamonds in what was to become Kimberley and gold in what was to become Johannesburg attracted a wide range of speakers from within South Africa, and from the United Kingdom, Eastern Europe, and elsewhere. As far as L1 English was concerned, this migration of diverse groups brought into contact South African varieties of English that had previously been remote from each other. According to Lanham and Macdonald (Reference Lanham and Macdonald1979), the features of Natal English acquired prestige and spread within and then outward from Johannesburg. Inherent in this model is the conviction that Johannesburg lacked characteristics of its own, and that the linguistic focusing that took place from 1886 onward drew mainly on pre-existing characteristics of Natal English with additional influences from Afrikaans, which was also a significant language of the diamond and gold mining areas. Both claims have been contested in the literature. First, on the basis of evidence from early Settler spellings, Lass and Wright (Reference Lass and Wright1986) argued that the case for Afrikaans influence was overstated. Second, Bekker (Reference Bekker2012) has questioned the plausibility of the claim that Johannesburg had no features of its own. He proposes on the grounds of some degree of Settler coherence (e.g., miners from Cornwall, Cumberland, and Lancashire) that Johannesburg must have formed its own koiné, which eventually overtook the earlier Cape and Natal ones.
White SAfE (WSAfE) is best known in the literature for its short front vowel shift, involving the raising of TRAP and DRESS and the centralization of KIT in environments not involving a velar or glottal consonant (Lass & Wright, Reference Lass and Wright1986; Wells, Reference Wells1982:612). SAfE also shows glide-weakening of the PRICE and MOUTH diphthongs (Lanham & Macdonald, Reference Lanham and Macdonald1979:41–42), and GOOSE fronting (Hopwood, Reference Hopwood1928:22). SAfE thus shares some traditional similarities with Australia and New Zealand (Lass & Wright, Reference Lass and Wright1986) and the American South. Consonant variation has been less salient in SAfE. SAfE is not generally rhotic, though some older speakers have a recessive [r] in the –er suffix of agent nouns and comparative adjectives and words like water. Additionally, younger middle-class speakers show incipient postvocalic [r] in “expressive” styles, probably following global trends emanating from the popularity of U.S. English in film and on television.
In the South African context, “Black” is differentiable from “Colored” insofar as the former prototypically refers to a speaker with a Bantu language (e.g., Xhosa, Zulu, Sotho) as the language of the home and community; the latter refers to people of multiple ancestries prototypically having shifted from a non-Bantu click language (e.g., |Xam, !Gora) or a Bantu language (e.g., Tswana) to Afrikaans and/or English.Footnote 4 “Indian” in this context refers prototypically to people who trace their ancestry to 19th-century India.
Black SAfE (BSAfE) began as an L2 variety, spoken by a small segment of the population in contact with missionaries and settlers in the Eastern Cape since the 1820s and in some forms of employment. It grew with the development of the mining and other industries and with the growth of township schools in the 20th century. Like L2 English in much of Sub-Saharan Africa, the ratio of Black speakers to native English models was too great to engender a close-to-L1 variety, especially in view of colonial and apartheid segregation and inequalities. BSAfE is well known for its largely five-vowel system and variable use of diphthongs and schwa. Some analysts of this system have felt safer in limiting their studies of BSAfE to speakers with a specific home language, for example, Van Rooy (Reference Van Rooy2002) on Tswana English, and De Klerk (Reference De Klerk2006) on Xhosa English. Others have assumed uniformity across the country based on a broad Southern Bantu substrate, for example, Buthelezi (Reference Buthelezi and Mesthrie1995). Partial desegregation and nonracial schooling since 1994 have resulted in the label BSAfE no longer being an appropriate linguistic label for all Black people. In particular, there is a growing number of young people who use a structurally different variety having more in common with White L1 norms. The sociology, educational consequences, and sociophonetics of this new development continue to engage new South African scholarship (McKinney, Reference McKinney2007; Mesthrie, Reference Mesthrie2010; Wilmot, Reference Wilmot2014). In our discussion of results, we will accordingly break down the constructed sample of Black speakers into two subsets to reflect the two radically different sets of norms for English.
The English of Colored people in South Africa is starting to receive closer phonetic attention, especially that of the large Cape Town community (Finn, Reference Finn, Schneider, Burridge, Kortmann, Mesthrie and Upton2004; Toefy Reference Toefy2014; Wood, Reference Wood1987). The substrates and languages of continuing influence are generally different from those influencing BSAfE speakers: non-Bantu click languages and Malay in the 18th century, and the continuing presence of Afrikaans as L1 or L2. Generally speaking, this variety of SAfE shares the short front vowel shift with WSAfE, but not the predilection for monophthongization of PRICE and MOUTH (Finn, Reference Finn, Schneider, Burridge, Kortmann, Mesthrie and Upton2004:969–973).
Just as Cape Town is a base for the Colored population, Durban is the largest center for South Africa's Indian population. Indian SAfE has been studied more for its grammatical structure than for its phonetics. What is known of the latter is that it is phonetically distinct within South Africa, partly because of its (weakly) retroflex consonants, which are, however, recessive in the younger population. The fricatives /θ/ and /ð/ of English are usually dental stops in Indian SAfE. In terms of vowels, traditional Indian SAfE does not have the raising of the short front vowels to the same degree as in WSAfE, nor the monophthongization of PRICE and MOUTH (Mesthrie, Reference Mesthrie1992:137).
LITERATURE REVIEW: THE BATH VOWEL IN SOUTH AFRICA
The earliest mention of the BATH vowel in South Africa is a prescriptive comment by a visiting educationist, M. C. Bruce (Reference Bruce1919) who wrote caustically of being introduced to a “Mr. Morton—and it took me five days to find out his name was really ‘Martin’” (cited by Lanham & Macdonald, Reference Lanham and Macdonald1979:39). Likewise, the British phonetician David Hopwood (Reference Hopwood1928:12)—the first to describe SAfE in detail—cited the surname Larsen (['lɑ:s ]) being pronounced in the eastern part of the Cape Province as Lawson (['lɒ:s].Footnote 5 Intent on characterizing the cardinal vowels for an international audience in her Phonetics of English, Ward (1939:91) noted that, “In some forms of . . . South African pronunciation a vowel near Cardinal [ɑ] is found.”Footnote 6 Lanham (Reference Lanham, Lanham and Prinsloo1978:153) described a further variant, “backed, raised aa” as a stigmatized feature of Extreme SAfE that is subject to correction to front [a:] in certain monitored styles. Both Lanham and Hopwood pointed to Cockney antecedents in London, and Hopwood (Reference Hopwood1928:13) supplied a contemporary example from Punch with the popular spelling <aw>: “You mawk moy words, mite” [= ‘You mark my words, mate’].Footnote 7 In descriptions of WSAfE starting with Lanham (Reference Lanham1967:61) “Extreme” refers to broader varieties associated with working class (= essentially upper-working class) Whites, or varieties influenced by Afrikaans, or associated with small towns and country districts. “Conservative” applies to RP-oriented SAfE, while “Respectable” refers to middle-class prestige varieties less oriented to RP. Lass (Reference Lass and Mesthrie1995:99) made the following perceptive observations on the BATH vowel in SAfE:
The quality of this vowel is socially important. In conservative SAfE it tends to be centralised back [:], in posher styles even central [a:]; in both Respectable and Extreme it is backer, even fully back [ɑ:] (generally in Respectable backer for men and younger speakers). It becomes acutely significant when, as in Extreme SAfE, it may round to [ɒ:], and even raise toward [ɔ:] . . .
Lass's remarks about stigmatization of the backed variants (with possible raising and rounding) are based on parodies like that of Malan (Reference Malan1972), which contained examples such as: smort ‘smart’, porti Paulli Tix ‘party politics’, Orfficorns ‘Afrikaans’, in-divorce-dy ‘inter-varsity (sport)’. However, Lass (Reference Lass and Mesthrie1995:99) noted that at least the weakly rounded back variant was becoming less stigmatized by the 1990s.
Bekker (Reference Bekker2012) showed why a study of BATH is important in the history of SAfE. Trudgill (Reference Trudgill2004:63) had earlier raised the question why South African BATH realizations do not accord with those of Australia and New Zealand, three colonies established by the British within half a century, with settler populations not radically different in terms of areas of origin and social class backgrounds: 1788 (Australia), 1820 (South Africa), and 1840 (New Zealand). Australia and New Zealand have a noticeably front vowel [a:] in the BATH, START, and PALM sets (Trudgill, Reference Trudgill2004:62). Bekker (Reference Bekker2012) proposed that present-day WSAfE originated at a later period, with the founding of the mining city of Johannesburg (1886), rather than with the premining areas of the Eastern Cape (1820) and Natal (1840). He saw BATH backing and rounding as a late SAfE feature arising in Johannesburg that has since spread to other urban centers. This claim has yet to be fully tested against historical and geographical data. Lanham and Macdonald (Reference Lanham and Macdonald1979:39), contrary to Bekker, stated that “evidence that Backed aa originates in Home Counties working class speech of 1820 Settlers is strong,” citing as an example the spelling <gorden> for ‘garden’ in the diary of Jeremiah Goldswain, an uneducated settler in the eastern Cape originally from Buckinghamshire. The early history of BATH in the different South African provinces is clearly worthy of closer archival investigation. Perhaps a structural consideration is of relevance here: South Africa has [ɒ:] or [ɔ:] in BATH as against centralized [ä] arising from monophthongization of PRICE. Australia has the reverse: [ɒɪ] with prominent rounding of the first element in broader varieties for PRICE and front values [a:] of BATH—see Trudgill and Hannah (Reference Trudgill and Hannah1985:17). In both varieties, phonetic distance is maintained between BATH and PRICE, but in different ways. It is tempting to see PRICE as the prime mover, with the BATH variant being selected from the pool of variants of the time in response to PRICE. This is a structural hypothesis, pending proper historical data.
This paper is concerned with the present geographical and ethnic distribution of the variants of BATH in South Africa. Even for older speakers, whose Englishes were forged in the extreme social segregation characteristic of apartheid (1948–1994), descriptions of ethnic salience have to be tempered by other factors such as geography, the relative size of ethnic groups per city, and degrees of interaction between their speakers. Thus Mesthrie (Reference Mesthrie2012) explored the relationship between the English of Indian and Colored South Africans, showing large degrees of similarities between the two ethnic categories within each of the five cities studied for two variables: lamino-dental versus tongue-tip-alveolar variants of (t) and stop versus fricative variants of (th). However, these similarities were not commonly shared within the same ethnicity across all cities. In the present study, two features of a vowel variable (height and backness) are used to further explore the relationship between urban geography and ethnicities in South Africa and, secondarily, to locate finer differentiation according to gender.Footnote 8
THE CONSTRUCTED SAMPLE AND METHODS
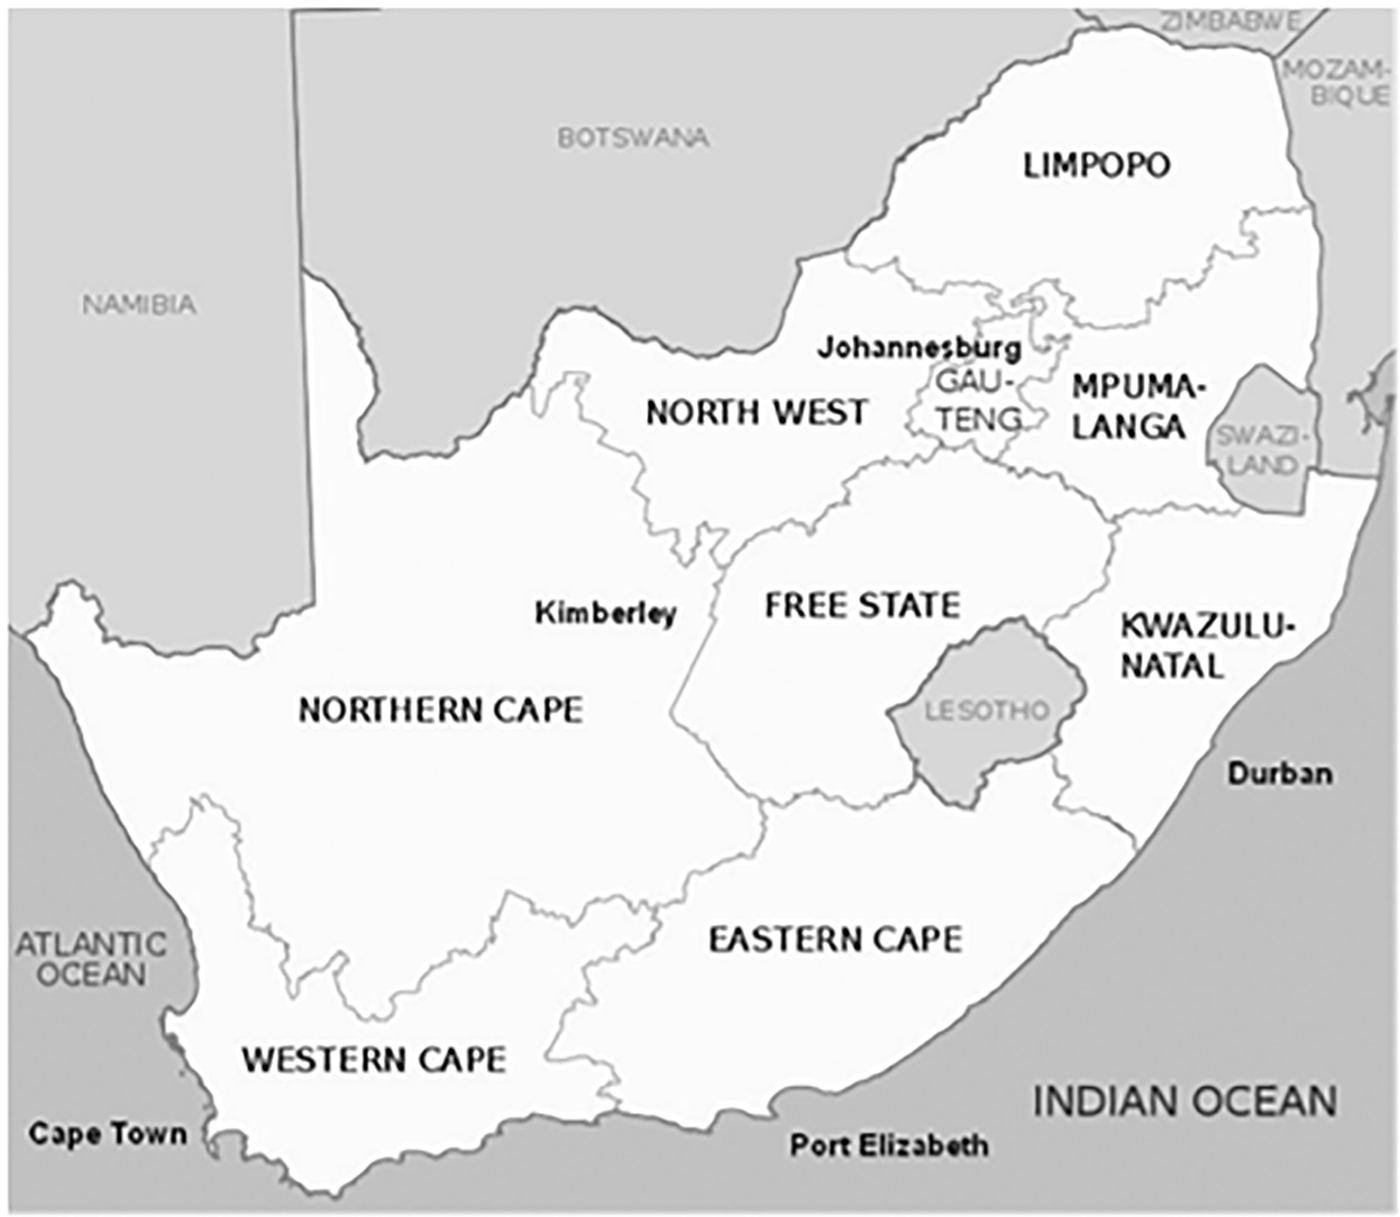
This study is based on 200 interviews undertaken in five cities: Johannesburg (JHB), Durban (DBN), Cape Town (CPT), Port Elizabeth (PE), and Kimberley (KBY).Footnote 9 These cities represent the geographical spread of English in five of the country's nine provinces (respectively, Gauteng, KwaZulu-Natal, Western Cape, Eastern Cape, and Northern Cape) (see Figure 2). The first four cities are the largest of the country, with the fifth, Kimberley chosen not so much for its size, as for its historical importance as an English-speaking center of the 19th century. The survey also covers both sexes and four of the country's five ethnicities (White L1 speakers of English, Blacks, Coloreds, and Indians, but not—for reasons of capacity—White Afrikaans speakers). The sample was thus designed to explore variation in key sociolinguistic variables associated with equal-sized groups pertaining to city-ethnicity-gender (henceforth C-E-G) combinations.
South Africa's nine provinces and the five cities studied. The figure is reproduced with permission from Rusty Russell at kidsmaps.com. Available at: http://www.kidsmaps.com/geography/images/fullsized/provinces-south-africa.png. Accessed January 10, 2013.
No distinction was made between L1 and L2 speakers at the stage of choosing interviewees: the only criterion set was that speakers had to be comfortable with and fluent in English.Footnote 10 In a multilingual country the distinction between L1 and L2 is less clear-cut and meaningful than one in which English is overwhelmingly dominant (see Agnihotri & Singh, Reference Agnihotri and Singh2012). Regarding the country's Black majority, particularly, it would be unfortunate to exclude a large and significant proportion for whom English is generally not a first language, but nonetheless an important shared, working language of education, business, and government. However, as we shall see, phonological features of their traditional L2 variety are not always easy to integrate into a single SAfE diasystem.
Further characteristics of the constructed sample follow. Speakers had to be born in their city of residence or have lived there from age three onward. Short periods of residence of up to a year in other areas or abroad were not excluded, as some sectors of the population are fairly mobile. The criterion of fluency in English meant that the survey reached largely middle- and upper-working-class people. In each city two older speakers (over 50 years) were interviewed per ethnicity, around six younger people (of 18 to 30 years), and the rest (usually two) between 30 and 50 years. The selected samples of size 10 were thus by design roughly comparable in class and age composition of four ethnicities, across the five cities. Gender subgroups within the 20 combinations of city and ethnicity were not necessarily comparable in class and age composition.
A Labovian sociolinguistic interview (Labov, Reference Labov, Baugh and Sherzer1984) was undertaken mainly by the lead author in peoples’ homes in the five cities (n = 188). In a few cases graduate research assistants undertook interviews as part of their training on the project (n = 12). A Marantz Professional (PDM661 MKII) solid-state recorder with internal microphone was used. Recordings were done in MP3 (320 kbps, 44.1 kHz sample rate), subsequently converted to 16-bit WAV. Interviews of 40 to 60 minutes’ duration focused on speakers’ backgrounds and interests, their schooling, recollection of childhood games, discussion of dialect words, and local crime stories—including the all-too-frequent personal experience of mugging. The interviews were often rich in comments about peoples’ experience of speakers from other cities and their accents. Some (unsolicited) comments specific to the BATH vowel among Colored speakers are cited in the results section. Each interview was concluded with a reading of a list of words adapted from Wells's (Reference Wells1982) lexical sets. The well-known reading-passage option was not undertaken, as prior experience had shown that some adults struggle with reading.
HYPOTHESES
As far as this specific analysis of BATH is concerned, the following initial hypotheses were formulated, based on the aural impressions of the lead author during the fieldwork.
Hypothesis 1. Region does not account on its own for particular realizations of the BATH vowel ([ä:], [:], [ɑ:], [ɒ:], and [ɔ:]), but interacts with ethnicity.
Hypothesis 2. Ethnicity does not account on its own for particular realizations of the BATH vowel. However, several subhypotheses are possible, which are cited as 2a to 2d.
Hypothesis 3. While gender differences are not always obvious on first listening, women have less backed and raised norms than those of men, ceteris paribus.
Hypothesis 2's subhypotheses regarding region and ethnicity are as follows:
2a. Among White speakers there are no clear-cut regional differences.
2b. Among Colored speakers there is a difference between Johannesburg, in which front-to-central realizations of BATH are common, and the other cities where backed, raised, and rounded variants are more common.
2c. Indian speakers closely match Colored speakers in all cities, except Durban, where there is polarization in their respective BATH norms ([ɑ:] for Indians, [ɔ:] for Colored speakers.
2d. Among traditional speakers of BSAfE there are no regional differences for BATH, with the usual realization being a short, low central [a] for BATH.
There are other viable expectations that cannot be tested statistically, given the larger number of potential independent variables they would entail. These are briefly illustrated in a concluding section as a prelude to further research:
Style does not affect BATH realizations for most speakers, except possibly for Whites.
There is bifurcation among Black speakers, with younger middle-class “crossover” speakers showing similar norms to young White speakers, and older speakers showing the traditional realization of a short, low central [a] for BATH.
ANALYSIS
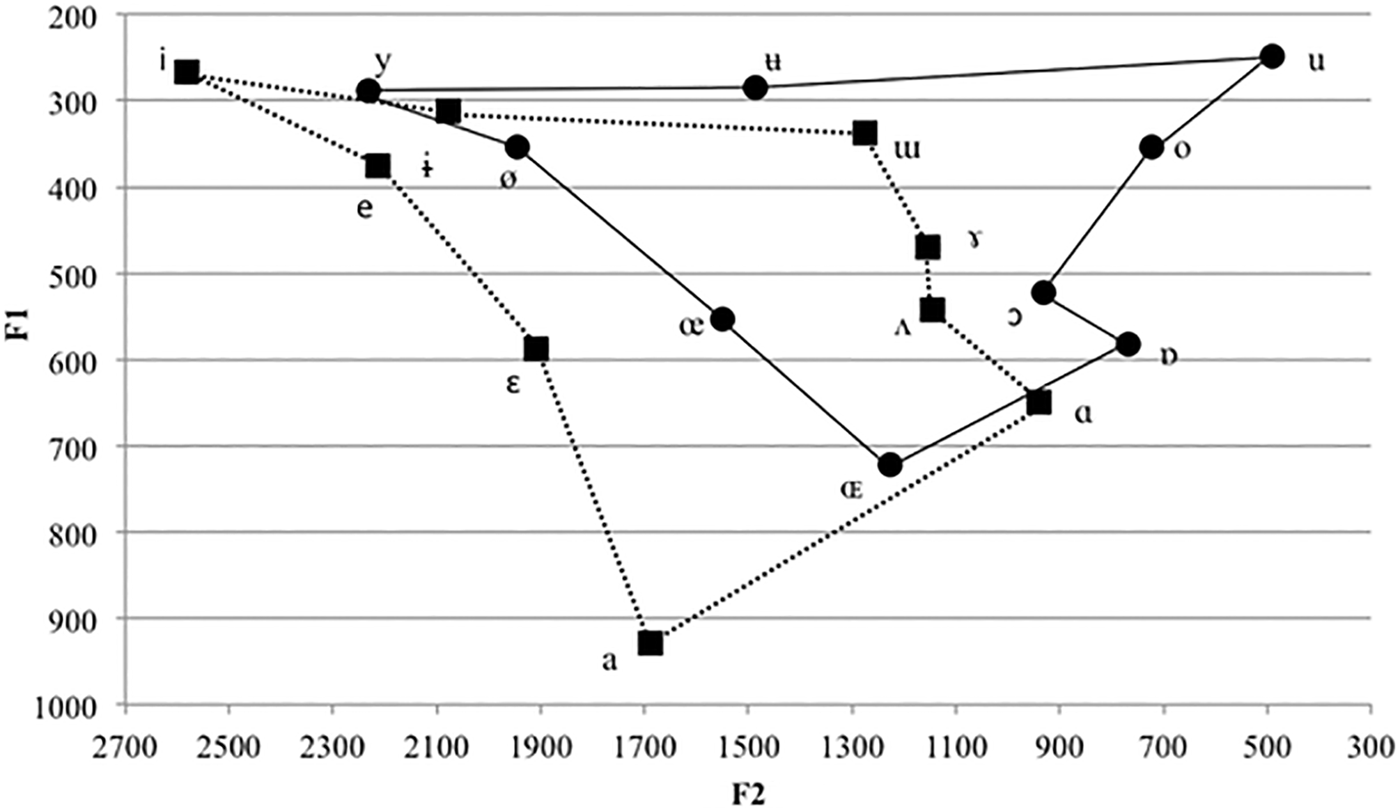
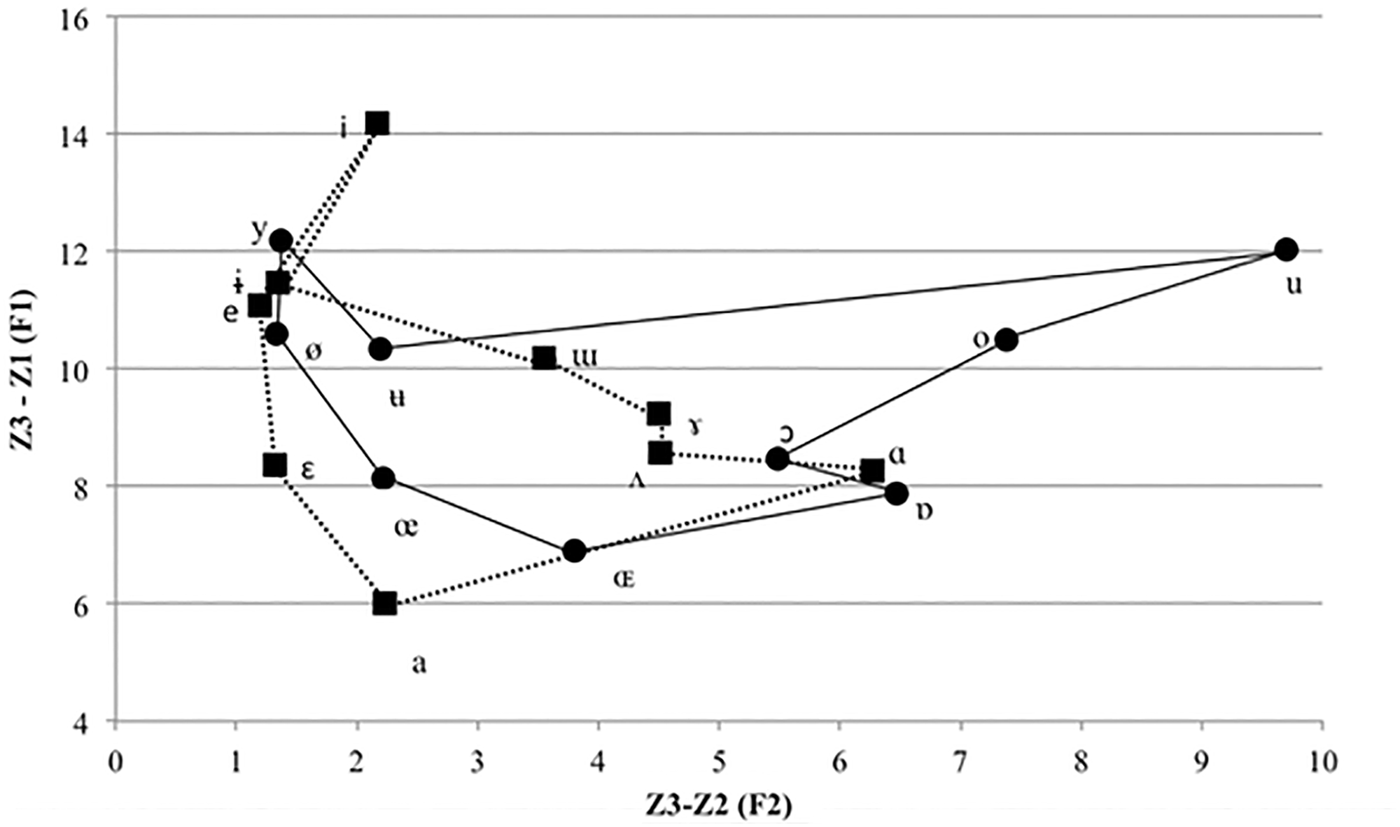
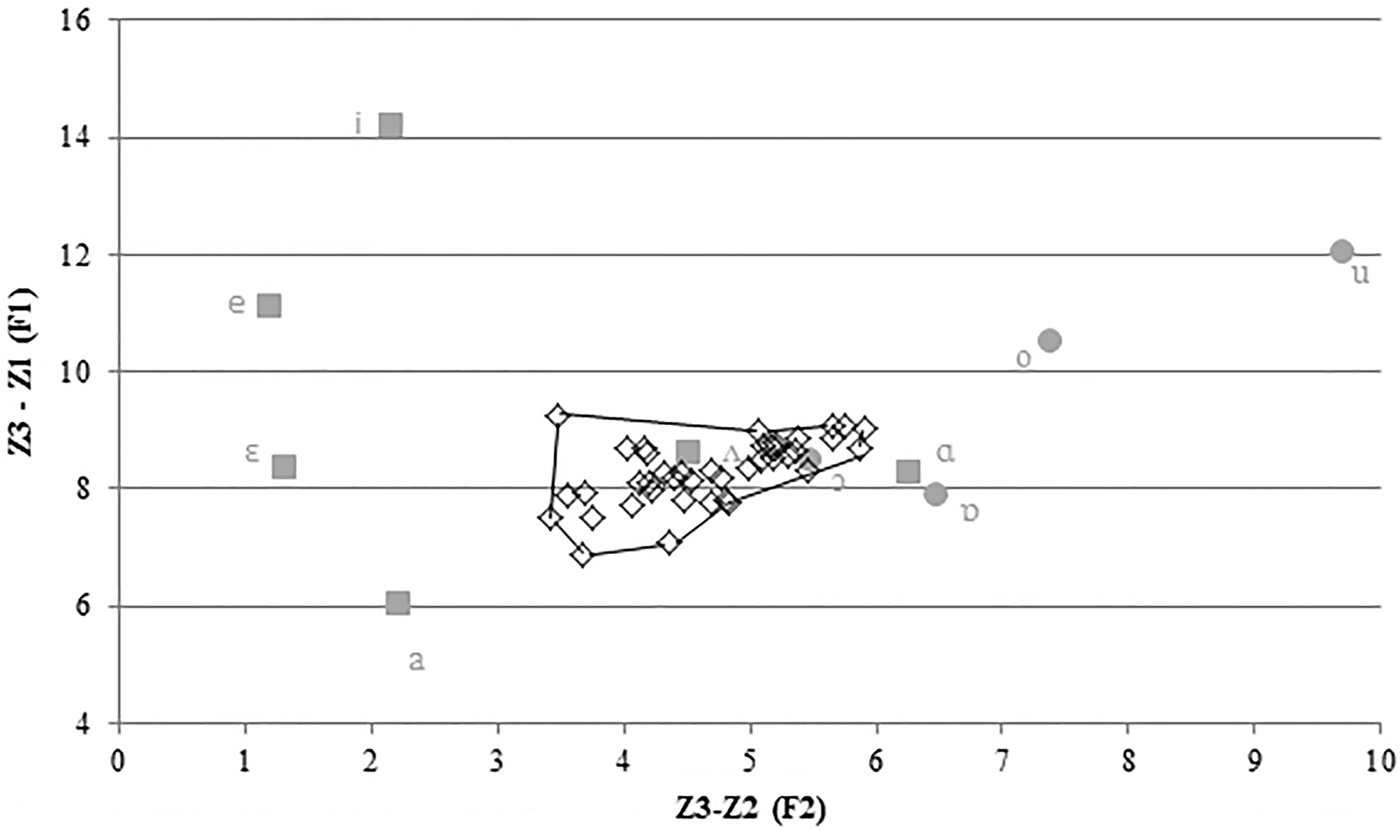
The acoustic analysis was done via PRAAT (Boersma & Weenink, Reference Boersma and Weenink2010), using PRAAT scripts.Footnote 11 Each token of the BATH vowel was measured a third of the way through its duration.Footnote 12 Of the variety of normalization techniques available, we settled on the Bark-difference metric, a vowel intrinsic method of normalization (i.e., it undertakes normalization without reference to vowels other than the one being studied). The method may be described as vowel-intrinsic, formant-extrinsic, and speaker-intrinsic.Footnote 13 The Bark-difference metric subjects the F1, F2, and F3 formant values to a series of mathematical transformations to give normalized values for F1 and F2 (Thomas, Reference Thomas2011:163–165). The reason for choosing the Bark-difference method is that it is one of the few viable options for analysis when only a few vowels have been studied in detail, as in the early stages of dialect description such as this study.Footnote 14 That Bark is vowel-intrinsic confers the further advantage of its being less susceptible to the phonological differences between dialects than vowel-extrinsic methods (Thomas, Reference Thomas2011:165). One drawback of this normalization is a warping of the vowel space that does not accord with traditional notions of the vowel quadrilateral, especially in the low back area, which is empty. To show this warping, we reproduce as Figure 3 Thomas's (Reference Thomas2011:146) diagram for Daniel Jones's recorded cardinal vowel demonstrations of 1956, with F1 and F2 plots in Hertz. We went a step further and converted the figures given by Thomas into the Bark-difference metric (via the NORM website of Thomas & Kendall, Reference Thomas and Kendall2007), which will form a basis for interpreting the graphs provided in this paper. Despite the nontraditional vowel charts in Figure 4, we deemed Bark-difference normalization the currently most effective way of analyzing our data and demonstrating variation of systematic and incidental kinds (see Adank, Smits, & van Hout, Reference Adank, Smits and van Hout2004; Clopper, Reference Clopper2009 for an assessment of the relative merits of different normalization procedures).
Daniel Jones's cardinal vowels in Hertz. Dashed lines represent unrounded sets; solid lines represent rounded sets. Adapted from Thomas (Reference Thomas2011:146).
Bark-difference scale graph for Daniel Jones's cardinal vowels. Dashed lines represent unrounded sets; solid lines represent rounded sets.
Particular environments had to be excluded to ensure accuracy of measurement: it is held by most acousticians that vowel tokens in the environment of /l m n r/ are distorted by these sonorants (Di Paolo, Yaeger-Dror, & Wassink, Reference Di Paolo, Yaeger-Dror, Wassink, Di Paolo and Yaeger-Dror2011:88). Then there is the question of possible structural conditioning. Previous studies of BATH in SAfE give no suggestion of any influence from adjacent segments, and Lanham and Macdonald (Reference Lanham and Macdonald1979:39) explicitly stated that “variants are not conditioned by phonological conditioning.” Nevertheless, words in which the BATH vowel was preceded by the palatal /j/ were separated from the other BATH tokens in our study, on the expectation that /j/ induces considerable fronting.Footnote 15 As a rule of thumb, we consider differences of more than .5 Bark units to be salient, that is, as the minimal perceptually meaningful signal of a special structural condition or allophony.
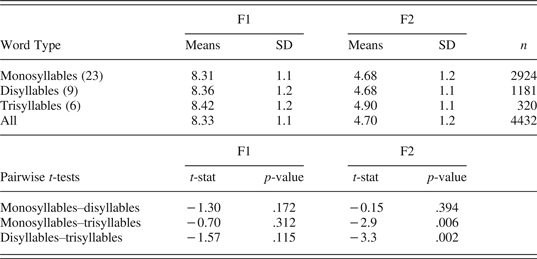
The 10 most frequent words in the database of 5553 tokens were: are (n = 552), father (507), after (483), car (325), ask(ed) (281), part (245), hard (233), half (212), far (180), and start (172). The bulk of the tokens by far were monosyllables, though disyllables and trisyllables were not excluded, provided [ɑ:] was articulated as a “full,” rather than reduced form. Words of more than three syllables were excluded for reasons of acoustic clarity. We checked whether formant readings for BATH were affected by the number of syllables in the remaining set of words. Words that had more than 20 tokens overall were chosen for this purpose. There were 38 of these words accounting for 4432 tokens—the bulk of the database. In this broad and initial comparison, the associated information about the C-E-G sources of the tokens was ignored. Table 1 provides the means and standard deviations and p-values for pairwise t-tests. Although Table 1 indicates a discernible difference in the F2 means between trisyllables and the rest, the mean difference of .22 Bark difference units is below the .5 cutoff.
Comparison of F1 and F2 means in Bark-difference units by number of syllables
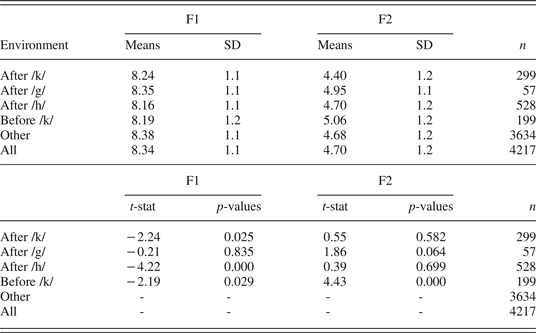
Laboratory phoneticians further advocate teasing out possible effects of velars (e.g., Bauer, Reference Bauer2012). To honor this caveat, we checked for velar effects (in words such as bark, garden) for possible differences from the rest of the BATH set, even though (unlike for palatal /j/) no such effect was apparent to us by ear, or by casual inspection of the Hertz scores for F1 and F2. We performed this check on the same subset of 38 words and 4432 tokens described earlier, heeding the further advice of laboratory phoneticians to test voiced and voiceless velars separately.
We tested for velar and glottal effects after /k/, /g/, and /h/ and for velar effects before /k/. (No vowels are followed by /h/ in English and there were no common words with the BATH vowel followed by /g/, with items like arg(ue) occurring infrequently in our database).Footnote 16
Table 2 provides t-statistics for pairs of means for data sets of each of these specific contexts versus the rest (designated “Other”). These t-values show that there are statistically discernible differences between several environments and “Other,” namely before /k/ for F2, and after /k/, /h/, and before /k/ for F1. However, none of the mean differences exceed the cutoff value of .5 Bark units for phonetically meaningful differences between any particular environment and the overall mean. For this reason, we do not separate BATH tokens after /k/, /g/ or /h/ or before /k/ as a special set in our analysis.
A comparison of BATH means in Bark-difference units after velars, glottals and other segments
Figure 5 displays the normalized means of each of the 40 C-E-G groups, plotted as open diamonds, and shows the range as a polygon within the frame of Figure 4.
The range of BATH variation in South African English shown as a polygon within a Bark-normalized cardinal vowel chart.
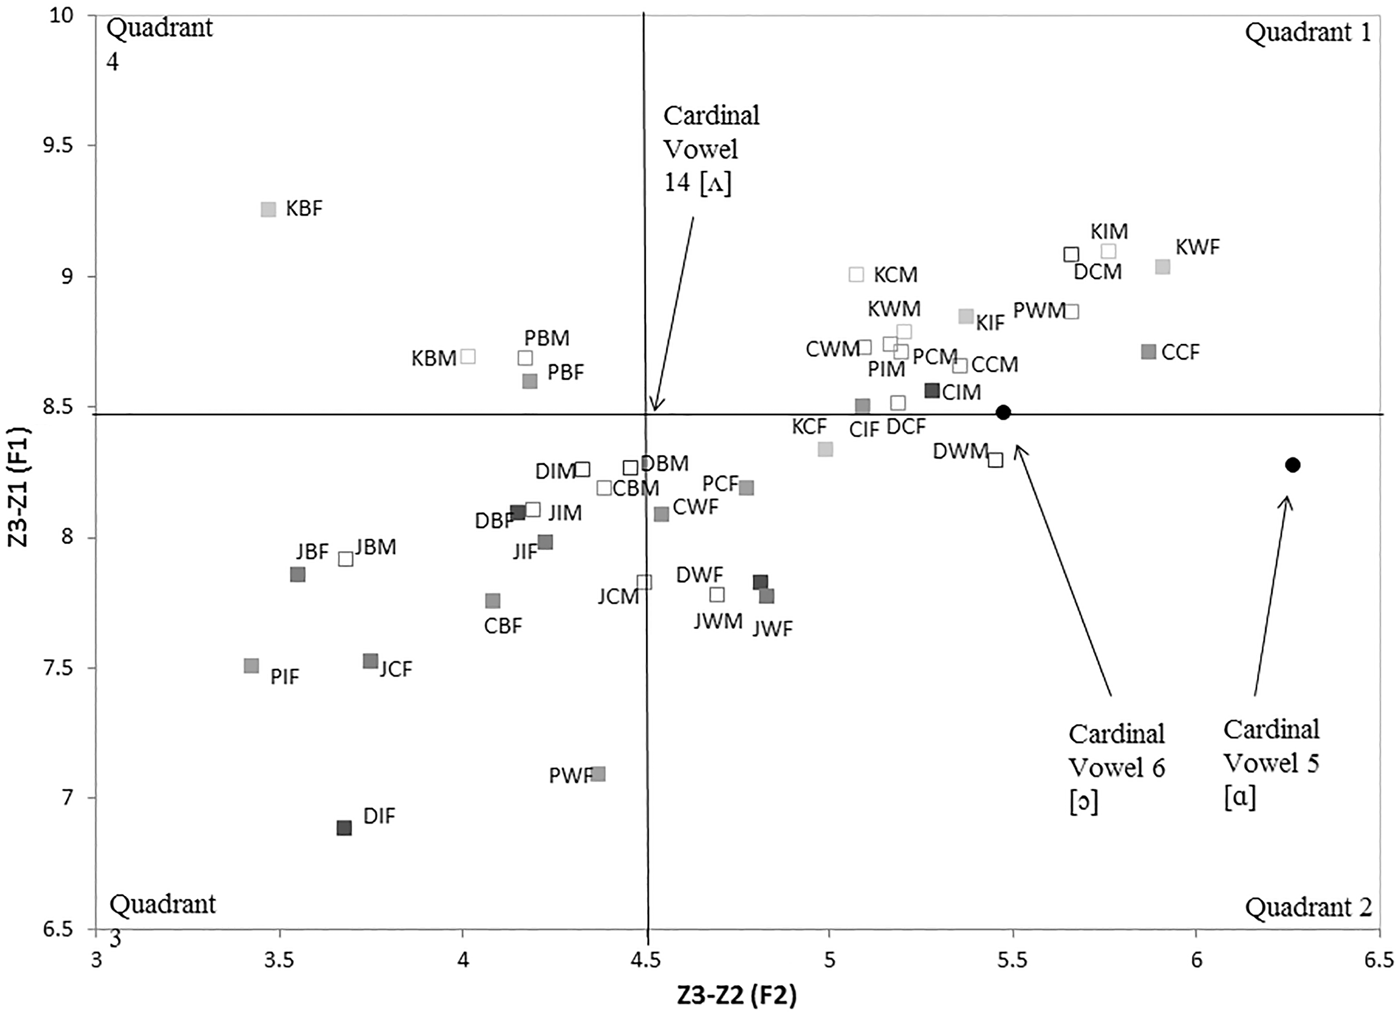
Figure 6 is a close-up of the polygonal range for BATH based on Figure 5. It also shows as anchor points cardinal vowels 5 and 6, as calculated in Figure 4. We further provide the location of cardinal 14, [ʌ] as a useful peg in partitioning the scatterplot and its data into four quadrants which help us visualize an initial meaningful sociophonetic description of the pattern of the 40 C-E-G groups.Footnote 17 For ease of keeping the acronyms for cities (JHB, KBY, etc.) and C-E-G groups (e.g., DCM, PBF) apart, note that the latter always end with the gender marker M or F (see Figure 6).
Distribution of C-E-G means for BATH over four quadrants with [ʌ] as dividing point for South African English. Initial of city comes first: C(PT), D(BN), J(HB), K(BY), P(E); ethnicity comes next: B(lack), C(olored), I(ndian),W(hite); and gender is last: F(emale), M(ale).
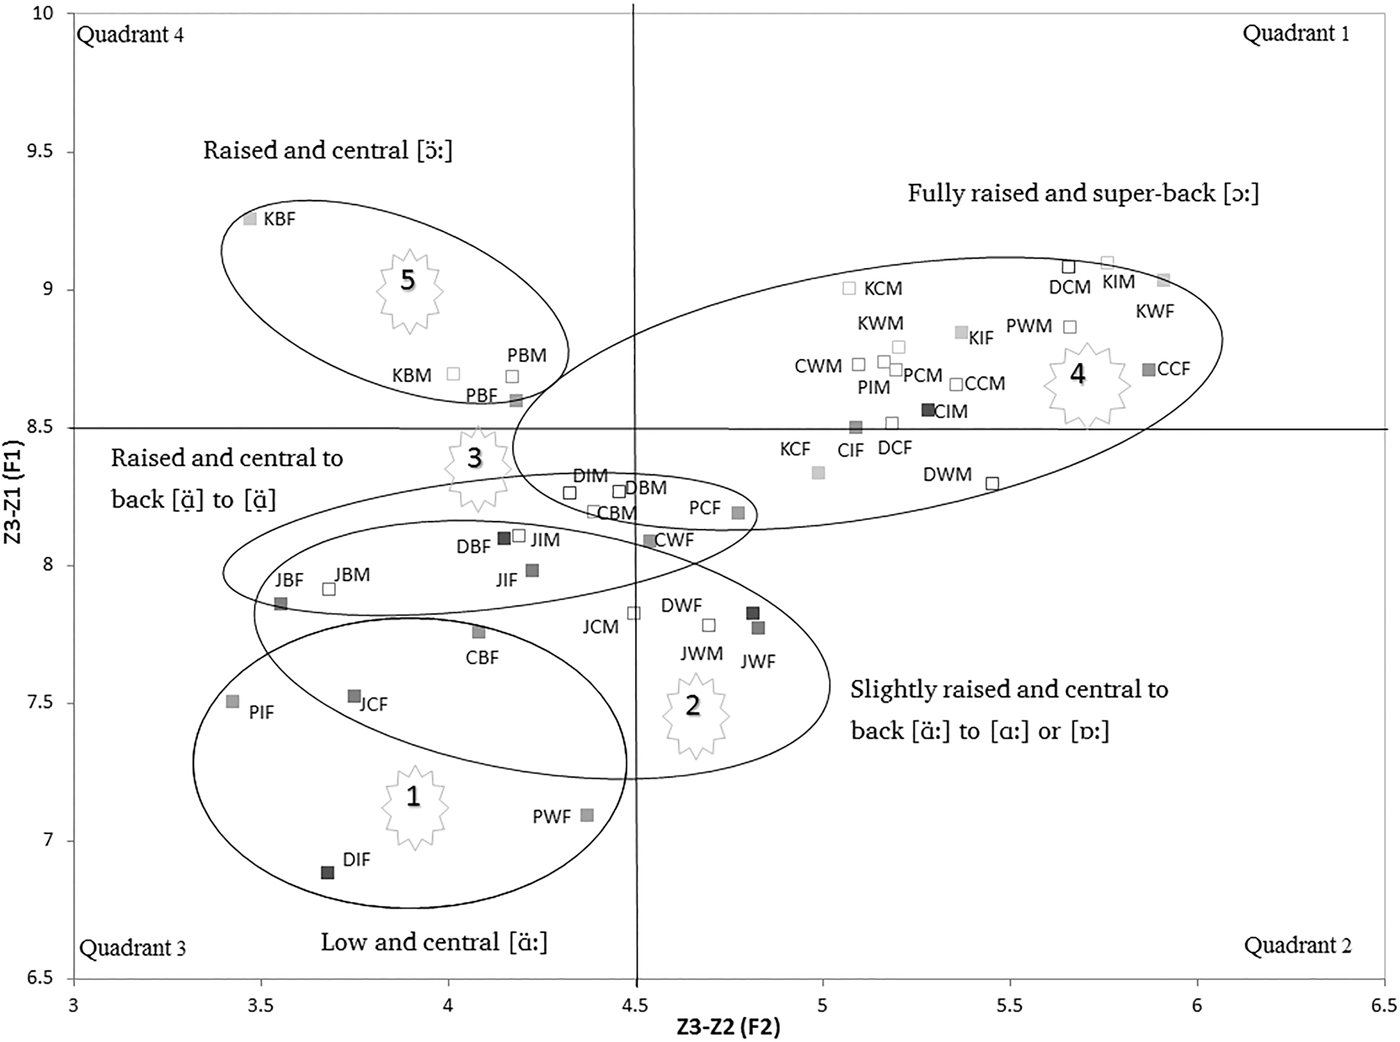
The data comprised bivariate F1 and F2 measurements from 5553 BATH tokens used in free and undirected speech. The data set was modelled using fixed effects (40 C-E-G groups) and 5 random effects for persons within groups were initially ignored. Counts of actual BATH words per person were highly variable from 2 to 105 among 200 persons (mean = 27.8; SD = 18.7). In all, 317 distinct words from the BATH lexical (super)set with highly variable frequencies from 1 to 552 appeared within the 5553 instances. The complexity of this naturally arising structure of observations for the BATH vowel led to mixed effects models being reported as computationally unstable, even when they were permitted to run for many iterations to attain a suitable convergence criterion. There was overwhelming statistical evidence for differences in both univariate means across the 40 C-E-G groups. The challenge was to define meaningful insights into the way these 40 groups may be partitioned. The groups were initially ranked in sequence according to increasing F1 means. Clustering of 40 group bivariate means was assessed within the chosen F1 sequence, by a heuristic exploratory rule. A string of bivariate means was regarded as an inseparable cluster until both the leading group's means became statistically different from the corresponding bivariate means of a group further down the sequence. This strategy sought to specify at least one plausible separation into clusters of the 40 groups that was based on the two observed variables alone and that was devoid of any insights or intuitions from linguistic perspectives. This approach suggested nine clusters, which however did not offer any phonetically interpretable features—see online Appendixes A and B. A more linguistically directed modification was then adopted and presented as five overlapping clusters in Figure 7. The phonetic characteristics and approximate IPA symbols that may be associated with the aggregates are indicated in Figure 7. Whereas the characteristics of 1 and 4 are clear-cut, aggregates 2 and 3 are less so and are best made sense of as intermediaries between the extremes of aggregate 1 (RP-like) and aggregate 4 (backing and raising).
Paired comparison aggregates showing five main groups and their overlaps. See Figure 6 for explanation of abbreviations.
We now turn to the specific results in relation to our earlier hypotheses.
Hypothesis 1, that region on its own does not account for BATH variation, is upheld because there is no aggregate in Figure 7 made up of solely of a single city with all eight of its ethnicity-by-gender groups together. However, as we discuss under Region, JHB and KBY each show internal cohesion.
Hypothesis 2, that likewise ethnicity on its own does not account for BATH variation, is also upheld because there is no aggregate in Figure 7 made up solely of a single ethnicity with all 10 of its city-by-gender groups together. However, Black groups show greater cohesion than others, as we discuss under Ethnicity.
Hypothesis 3, that women have on average fronter and lower realizations than men do in their city-by-ethnic group, is partially upheld and will be discussed further under Gender.
While there was no overall clear-cut differentiation of BATH by area or ethnicity, some aggregates do have clear social or geographical tendencies. Thus, Aggregate 1 is made of only (but not all) female C-E-G groups. Aggregate 5 is made of only (but not all) Black groups. Aggregate 4 contains, inter alia, six out of a possible eight Kimberley C-E-G groups (all but the Black speakers). We examine these subgroupings more closely in the following sections, peeling off layers based on region, ethnicity, and gender to reveal some degree of cohesion in a large data set.
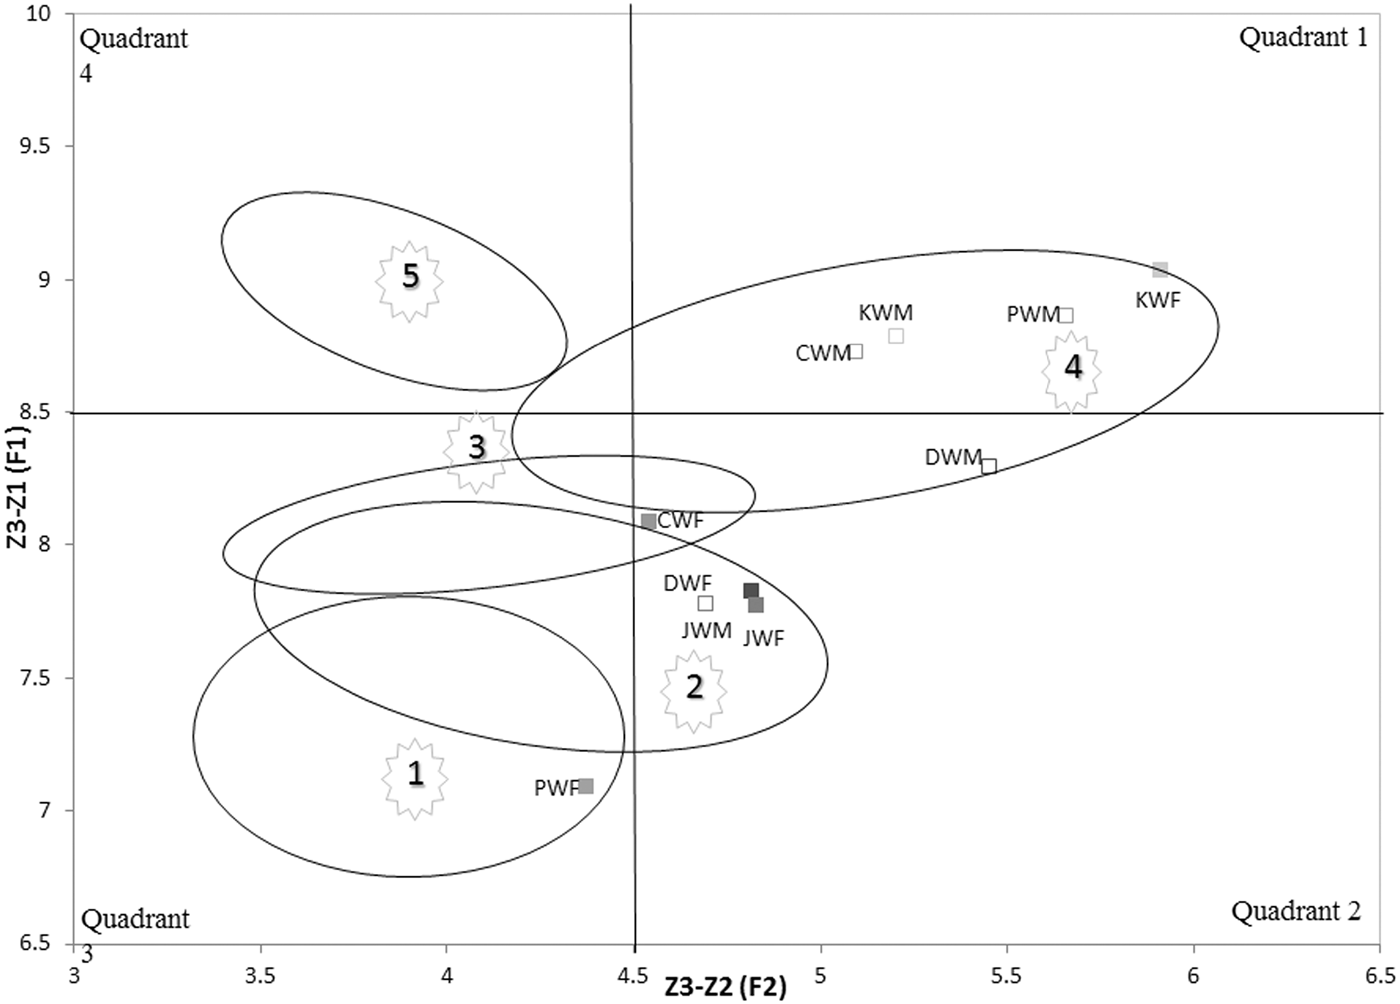
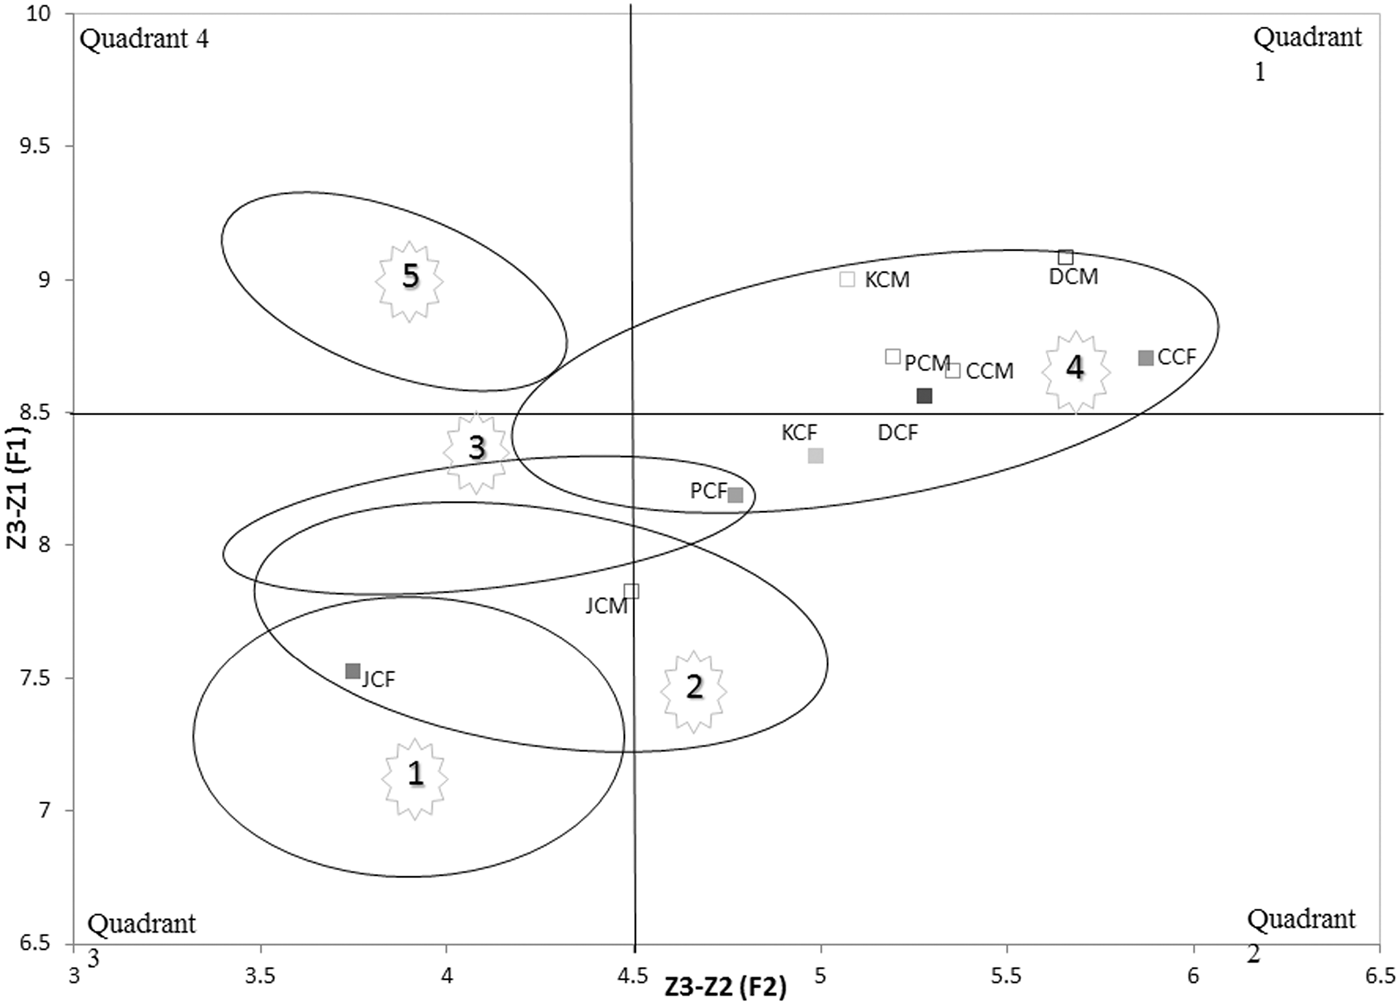
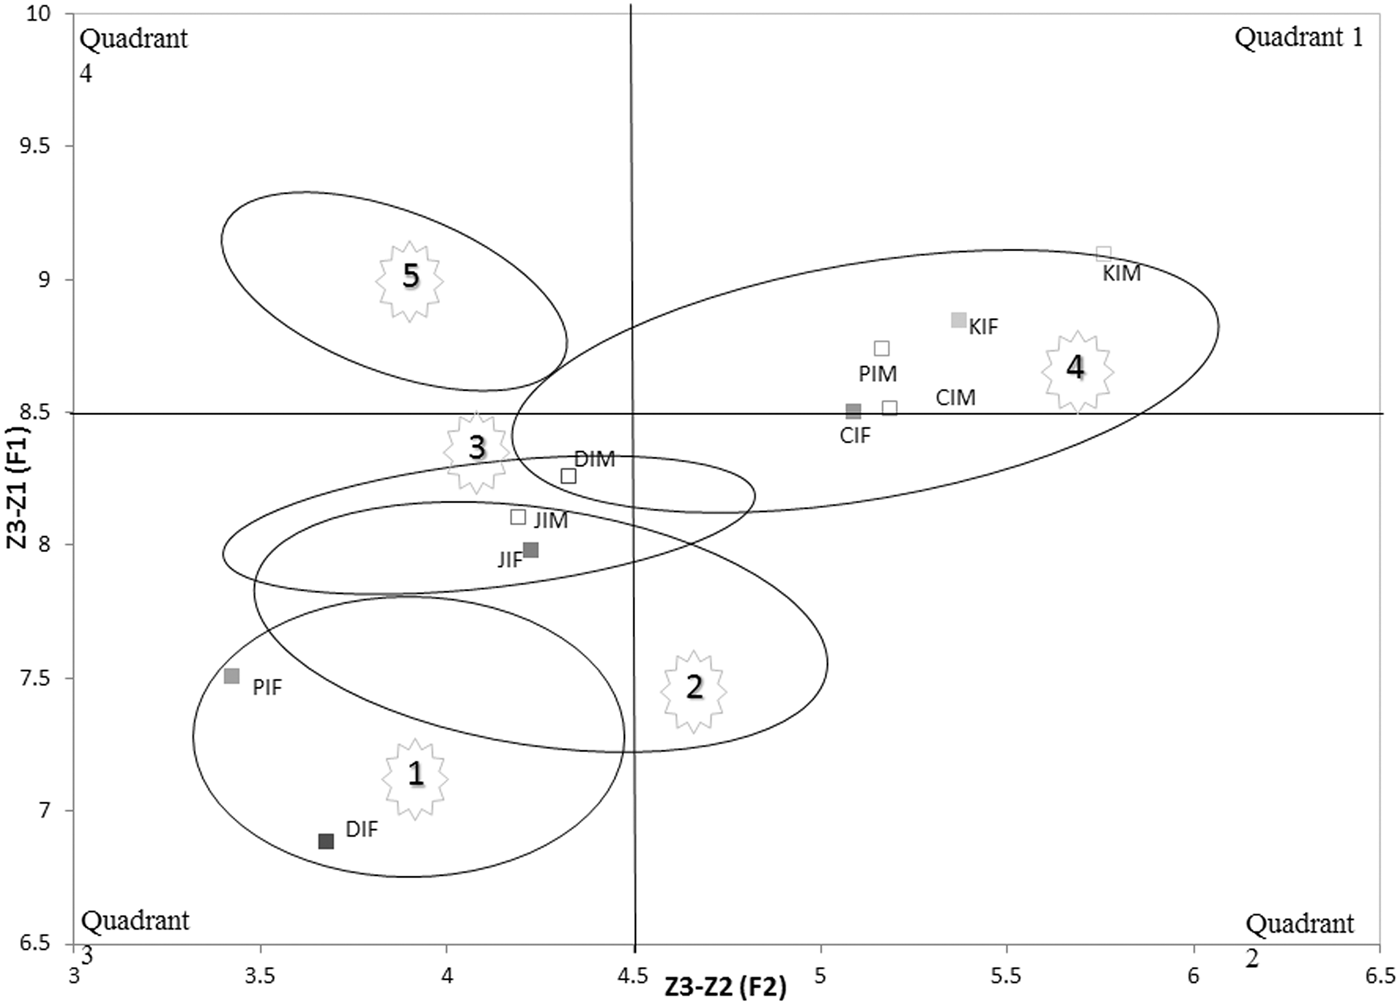
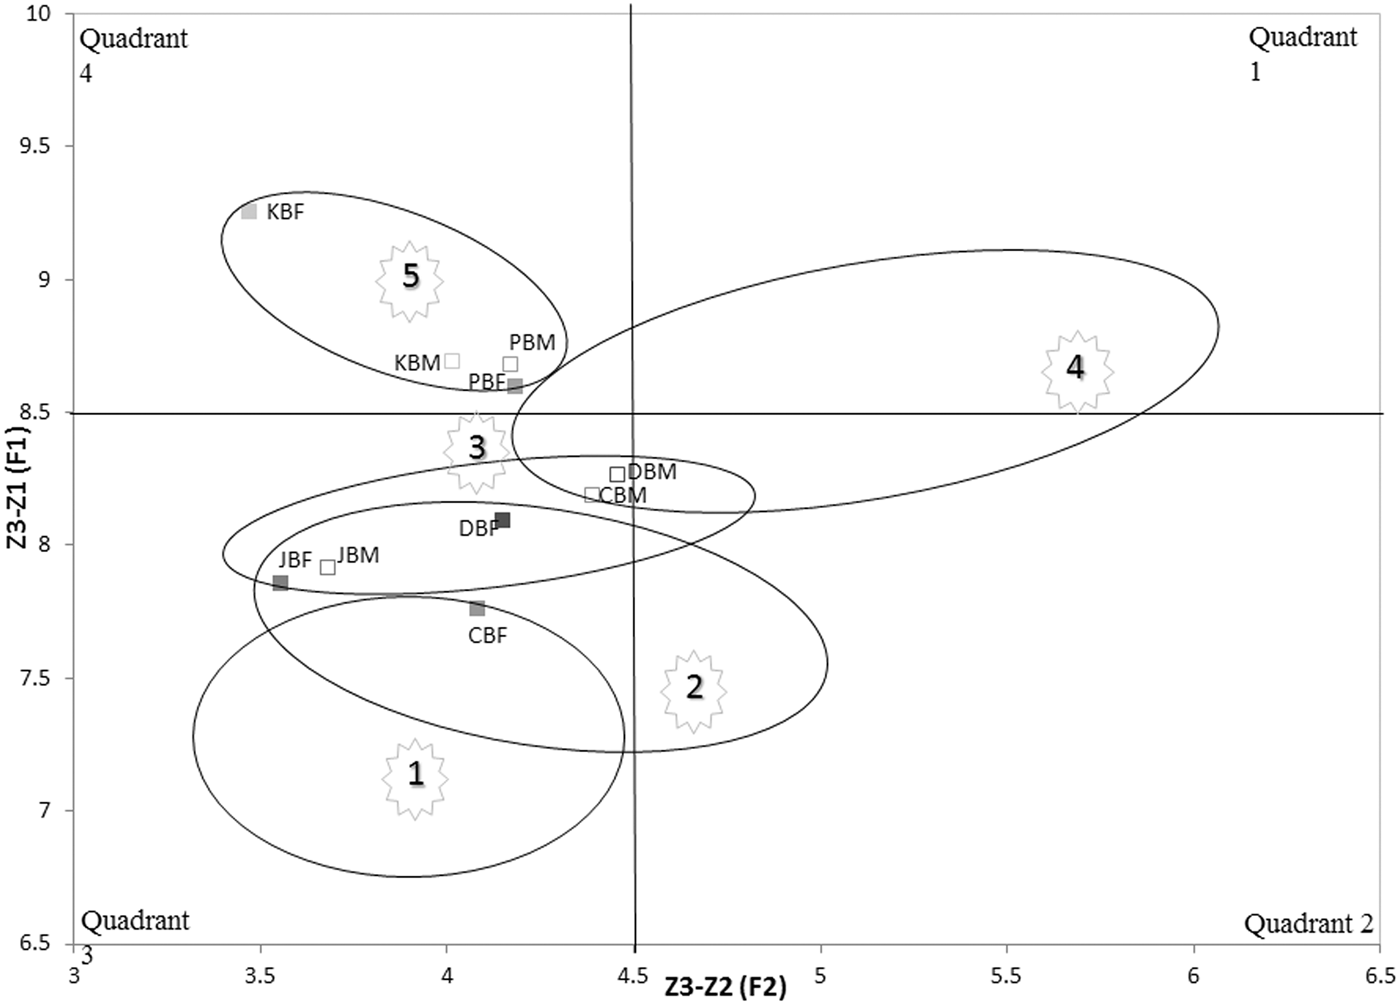
Region
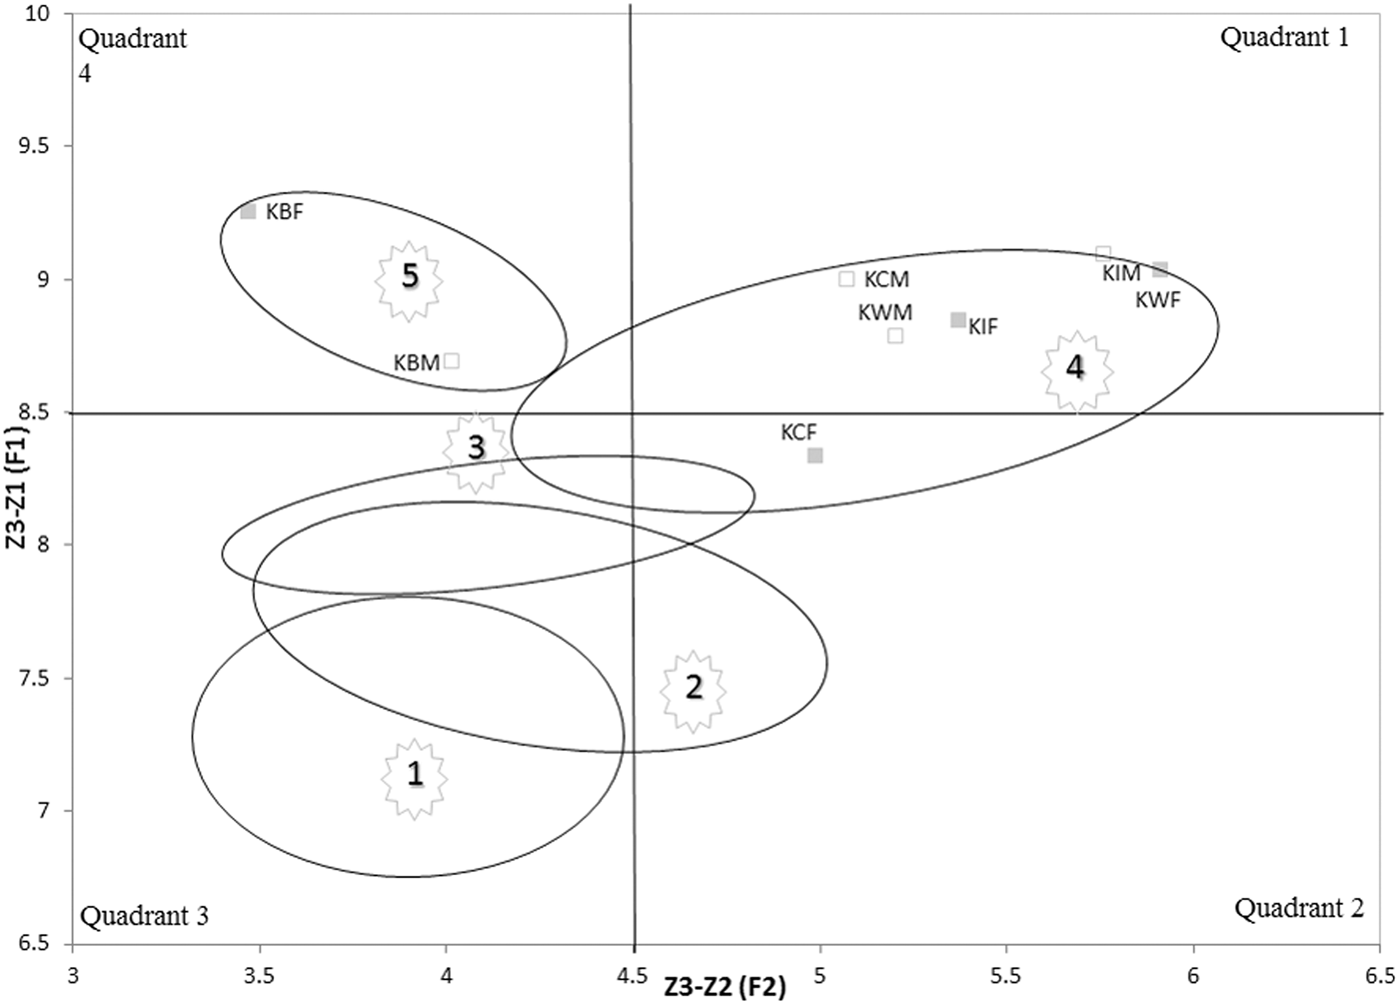
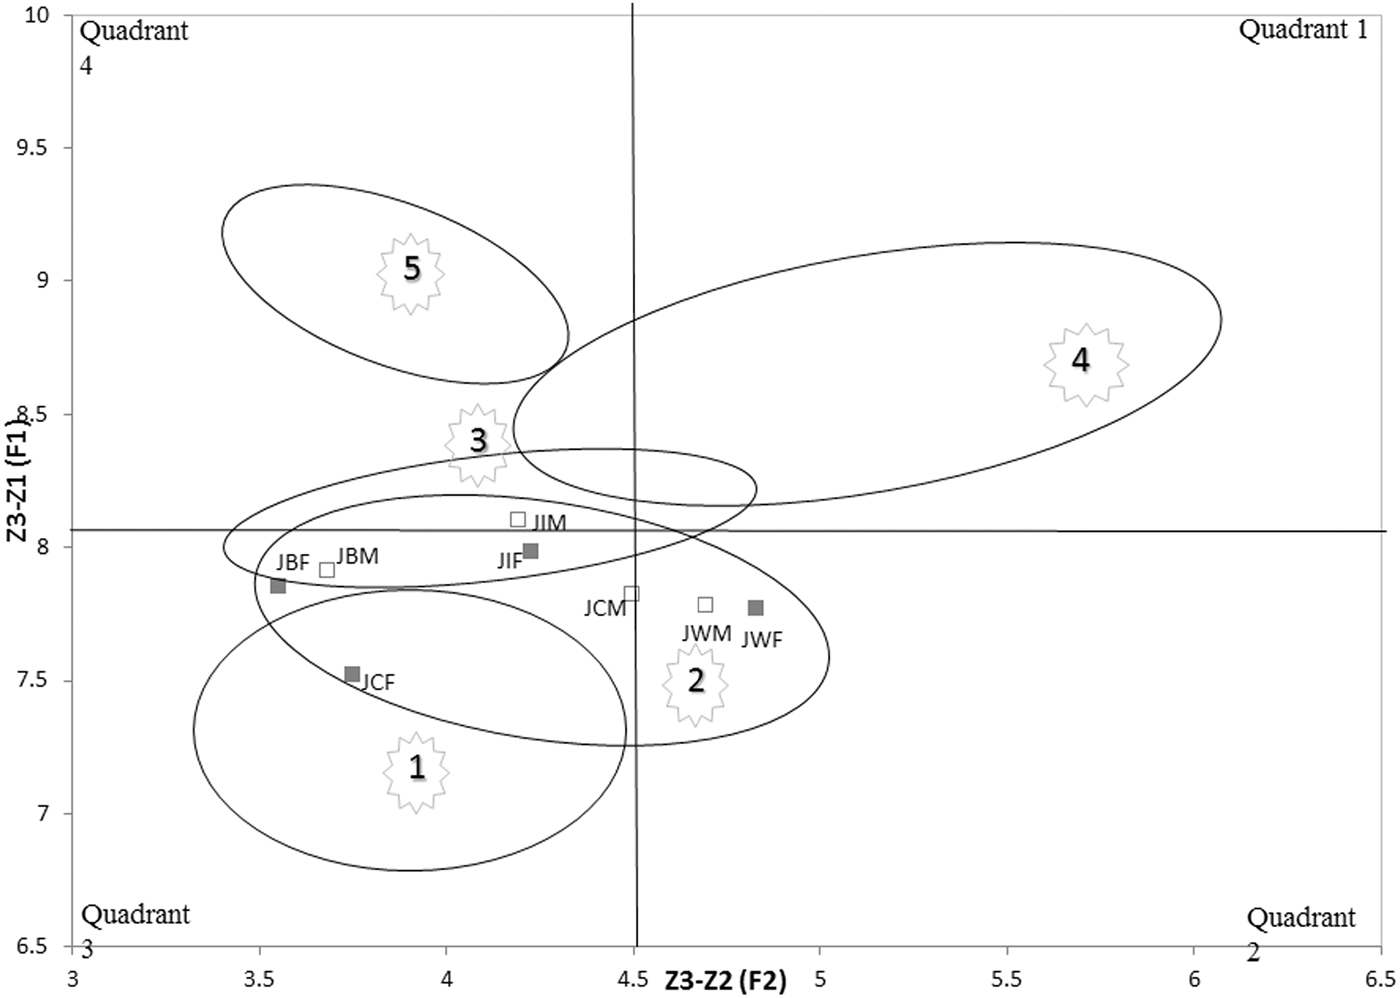
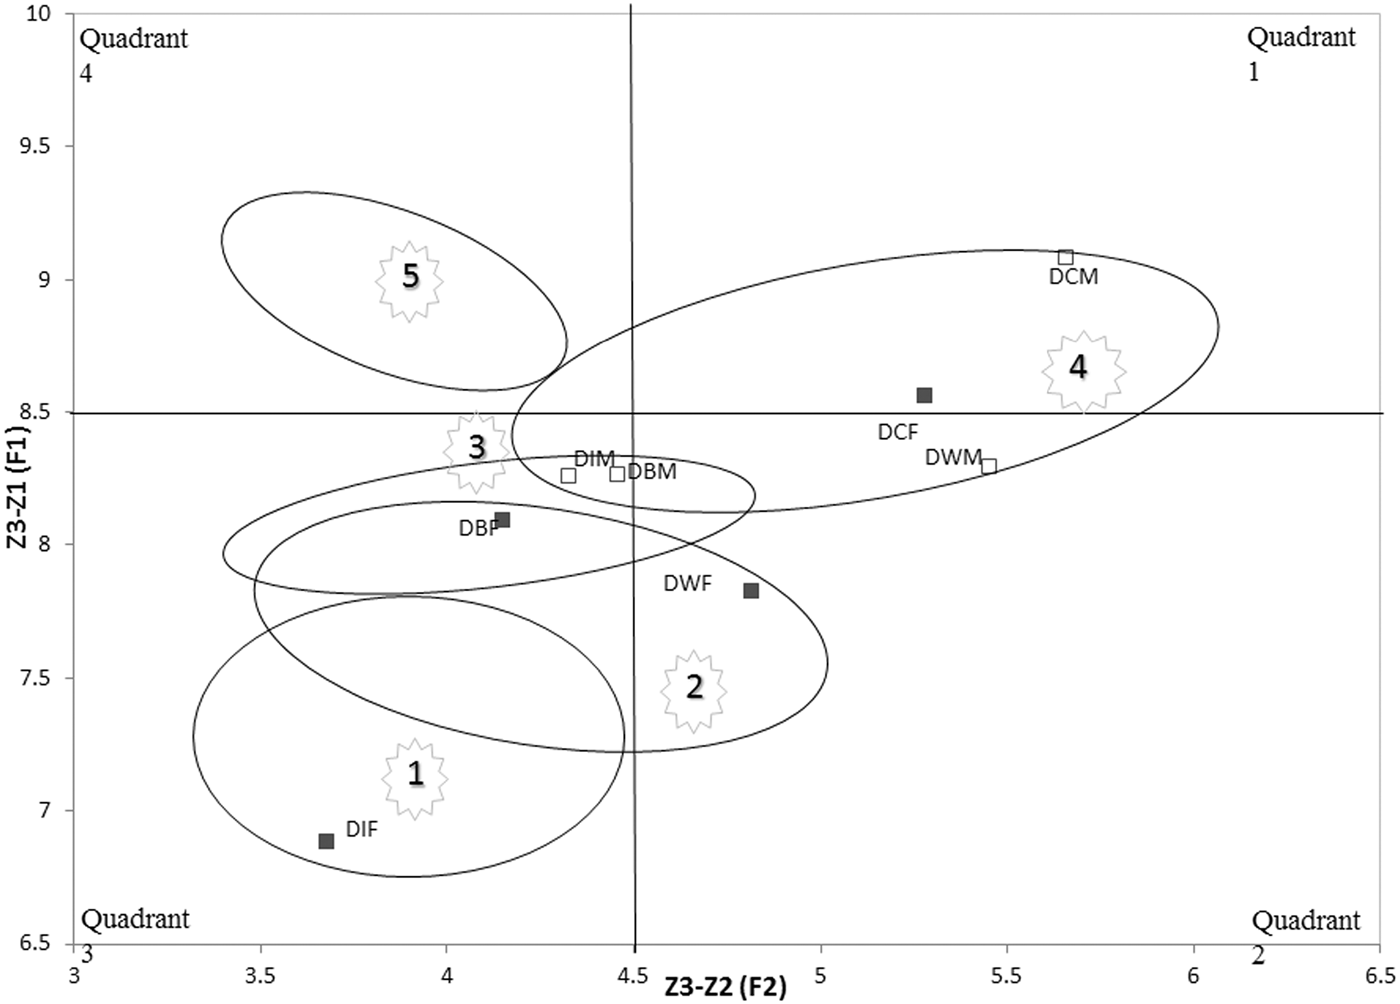
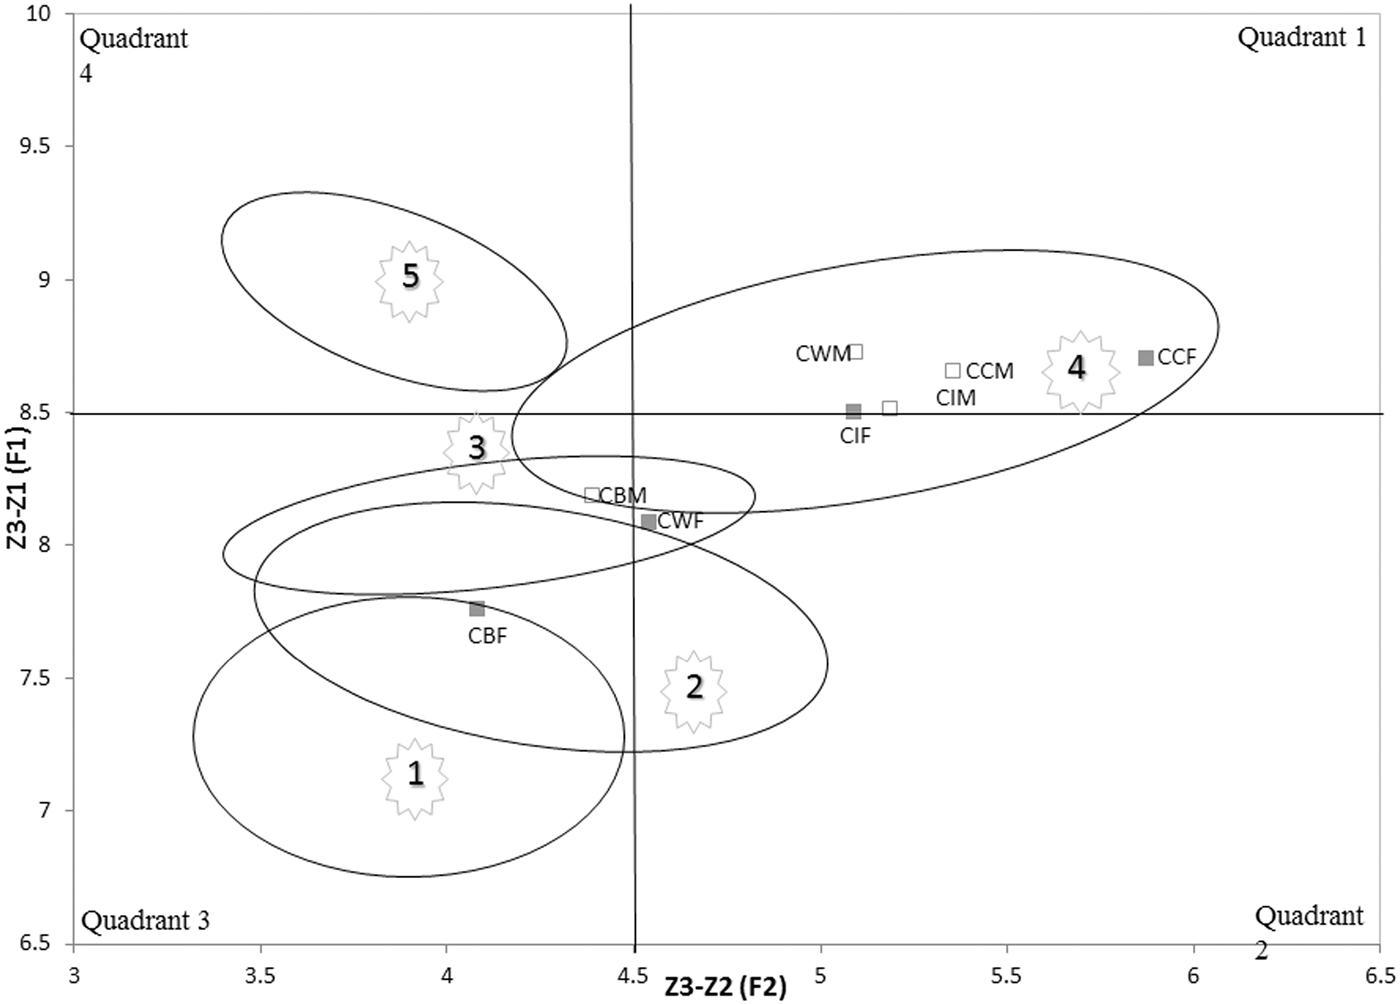
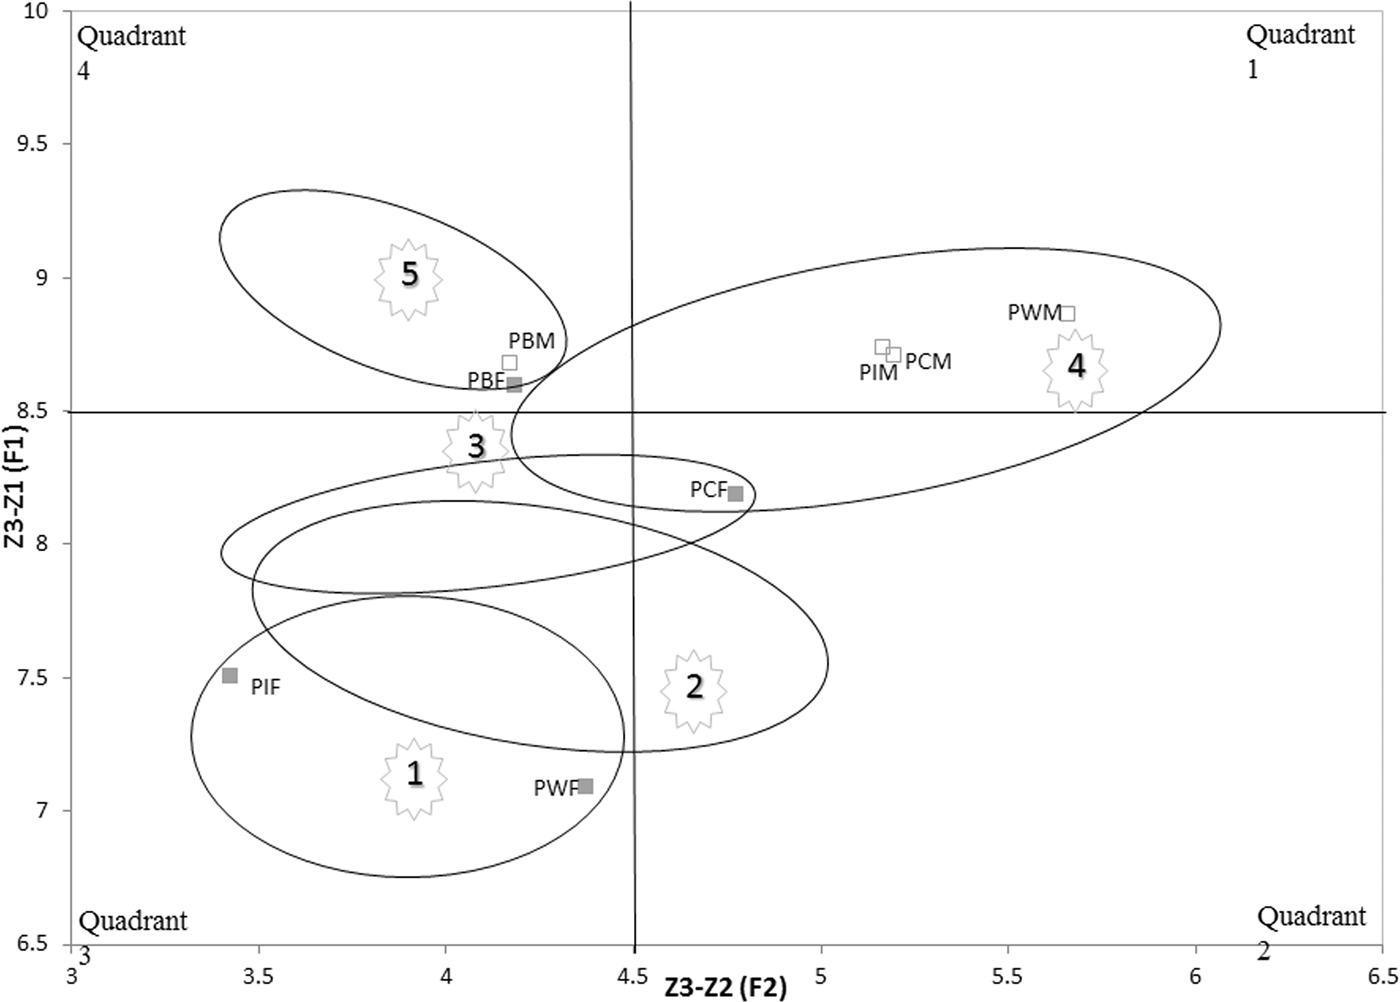
Figures 8A to 8E show the distribution of the ethnicity-by-gender groups per city. Three of the cities show no cohesion, with each of their C-E-G groups spread over four different aggregates. These are PE, CPT, and DBN. JHB shows an unexpected degree of cohesion, with all its C-E-G groups falling into Aggregate 2 (albeit with a range that includes 1/2, 2, and 2/3; i.e., slightly raised and central to back BATH means).Footnote 18 Likewise, KBY stands out as having all of its eight C-E-G groups with raised BATH vowels (falling into Aggregates 4 and 5). Raising is accompanied by backing, except for Black speakers who show distinct centralizing or even slightly front means. They would thus appear to share BATH raising with the rest of their city, but BATH centralizing with traditional Black SAfE. We believe that backing with raising is typical of small cities and towns, in which the more local (“Extreme/Broad”), rather than prestige (“Conservative/Cultivated”) variants dominate. Also relevant here is the degree of influence from Afrikaans (discussed in the final section), which is felt more in small cities and towns. Thus Figures 8A and 8B show that JHB (the largest city) has no overlap with KBY (the smallest city). Other salient regional generalities are possible, but only within particular ethnicities, as we outline in the following sections.
BATH means for Kimberley by ethnicity and gender. See Figure 6 for explanation of abbreviations.
BATH means for Johannesburg by ethnicity and gender. See Figure 6 for explanation of abbreviations.
BATH means for Durban by ethnicity and gender. See Figure 6 for explanation of abbreviations.
BATH means for Cape Town by ethnicity and gender. See Figure 6 for explanation of abbreviations.
BATH means for Port Elizabeth by ethnicity and gender. See Figure 6 for explanation of abbreviations.
Gender
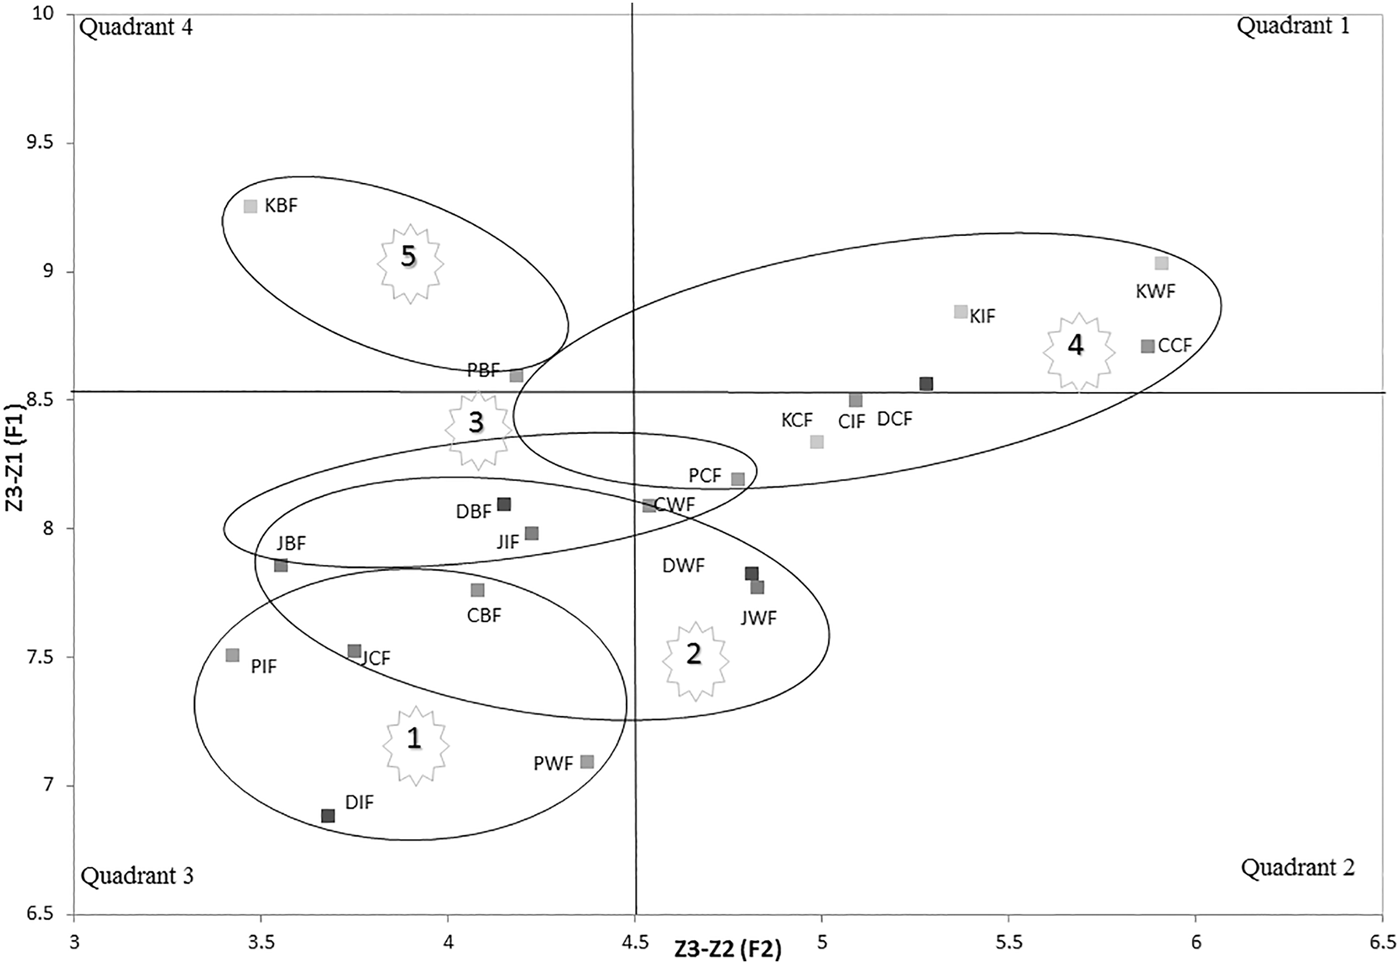
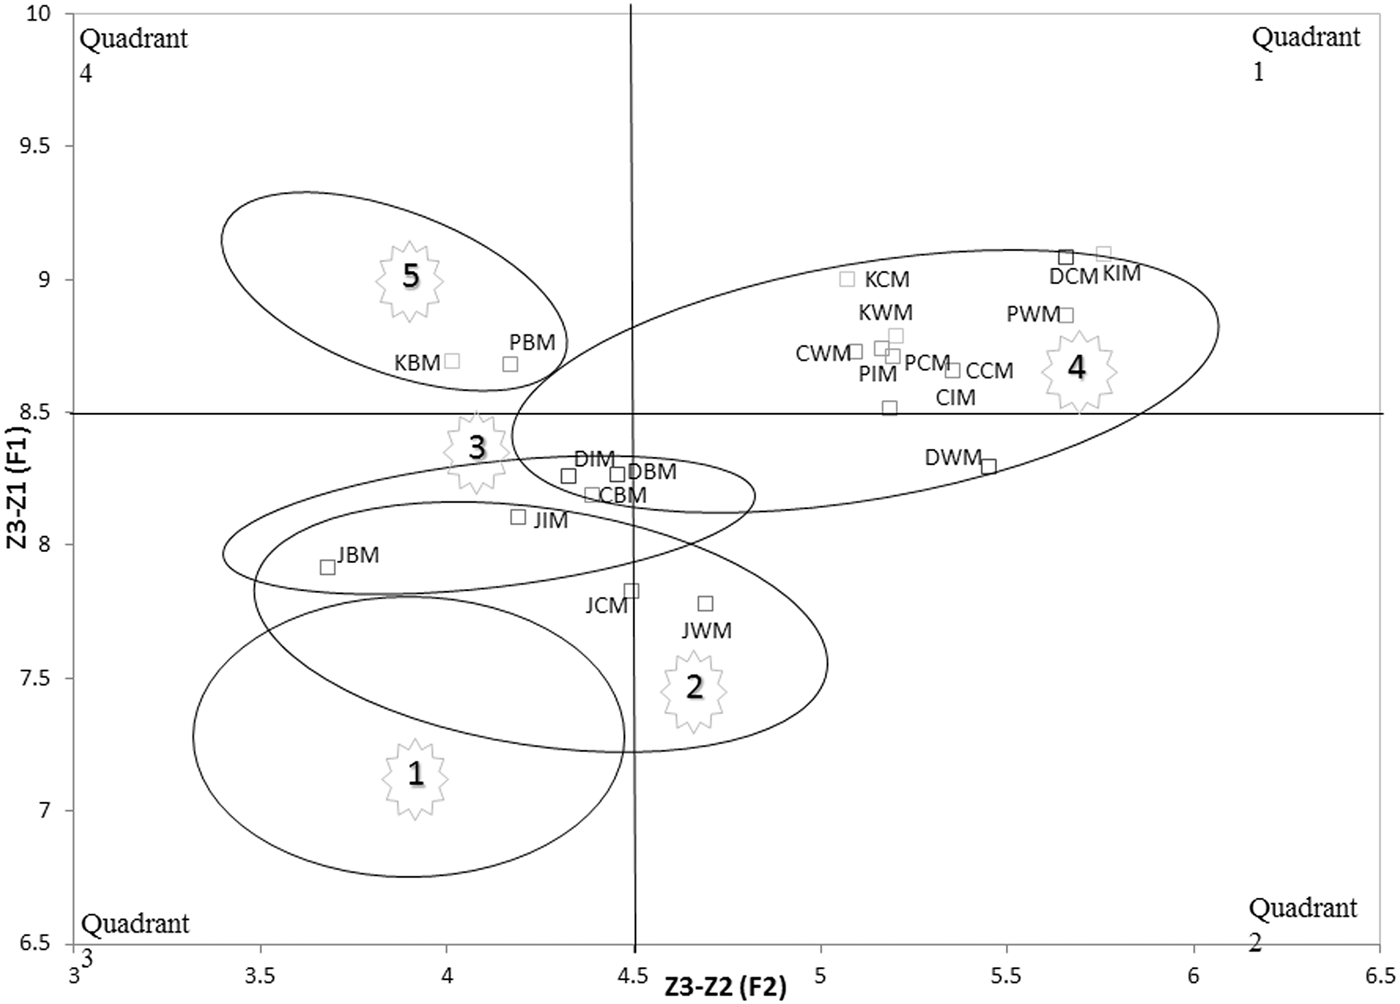
Figures 9A and 9B show the results for gender. The most striking result is that five female groups produce means in Aggregates 1 and 1/2 (low and centralized), while no male groups do. Furthermore, in 6 of the 20 city-by-ethnicity pairs, women fall into different aggregates than their male counterparts do; women show statistically significantly lower and fronter BATH vowels than men do. These are PE Whites, PE Indians, DBN Whites, DBN Indians, CPT Whites, and CPT Blacks. In the remaining 14 city-by-ethnicity pairs gender differences are not significant. This pattern suggests a strong result—that male averages are never more “standard” than those of equivalent female city-by-ethnicity groups.
BATH means for females by city and ethnicity. See Figure 6 for explanation of abbreviations.
BATH means for males by city and ethnicity. See Figure 6 for explanation of abbreviations.
Black speakers show less differentiation by gender than other ethnic groups do, since in four cities male and female Black speakers fall into the same aggregates: Aggregate 5 for PE and KBY, aggregate 2/3 for JHB, and aggregate 3 for DBN (more specifically aggregate 2/3 for females and 3/4 for males). These three aggregates show central and raised/slightly raised means, respectively. The fifth city, CPT shows greater differentiation, with Black women in Aggregate 1/2 and men in Aggregate 3/4. Thus CPT shows the pattern that is more familiar from other ethnic groups, with women having lower and fronter equivalents than males.Footnote 19
Hypothesis 3 is thus partially upheld. While gender differences are overall not obvious, where they do exist women have significantly fronter and lower BATH means than do the men of their C-E-G group.
Ethnicity
We first characterize White speakers, the historical reference group for SAfE. Figure 10A shows that 5 of the 10 gender-by-city groups for Whites are in Aggregate 4, the fully raised and superback area. Of these, four are male groups, the one exception being KBY females. The remaining five groups are in Aggregate 2 (for JHB males and females and DBN females), Aggregate 1 (PE females), or Aggregate 3 (CPT females). Hypothesis 2a, that there are no clear-cut regional differences for White speakers, is mostly upheld. However, one could draw attention to KBY being in Aggregate 4 for both genders, unlike all the other cities, where at least the female means are not raised or back enough to fall into Aggregate 4. The polarization in PE between females (Aggregate 1) and males (Aggregate 4) is worthy of future investigation, via a larger sample.
BATH means for White speakers by city and gender. See Figure 6 for explanation of abbreviations.
The strongest regional results are to be found in the Colored group (see Figure 10B). JHB falls into Aggregate 1/2 for females and Aggregate 2 for males, while all other cities fall into Aggregates 3/4 or 4 (showing backing/superbacking and raising). A basic and firm dichotomy thus exists between lower and fronter realizations [ä:] or [:] in JHB versus the remaining four cities with BATH backing, raising, and weak rounding ([ɔ:]). This is strong confirmation of Hypothesis 2b that for Colored speakers JHB stands out from the other cities in its BATH realizations. In KBY, the city in our survey spatially closest to JHB, this awareness of difference is strongest. Speakers from other cities are well aware of the difference of their own pronunciations from those of JHB Colored speakers, and ironically consider the more RP-like realizations of JHB to be aberrant. As one speaker from KBY light-heartedly observed (without any direct knowledge of U.S. stereotypes about New England citizens): “Yah, well they say ‘Pahk your cahr in your yahd’ [pä:k jo: kä: in jo: jä:d]. Another anecdote from KBY concerned a child born there who once corrected his father who came from elsewhere (in this case East London): Daddy, why do you say “car” ([kä:]), don't you know it's “cor” ([kɔ:])? The results in Figure 10B show that there is a basis for such stereotypes, at least for car in JHB versus cor ([kɔ:]) in KBY.
BATH means for Colored speakers by city and gender. See Figure 6 for explanation of abbreviations.
For Indians (in Figure 10C) there is a basic dichotomy on the one hand between DBN and JHB, which show no backing and slight or no raising (Aggregates 1 and 2/3, and 3/4), versus KBY and CPT on the other, which show superbacking and raising (Aggregate 4). PE is, somewhat surprisingly, starkly divided according to gender, rather like the Whites of the city. Females fall into Aggregate 1 (showing lowering and fronted to central values) but males fall into Aggregate 4 (with superbacking and raising).
BATH means for Indian speakers by city and gender. See Figure 6 for explanation of abbreviations.
There are no statistically significant differences between the genders for Indians in CPT, JHB, and KBY. That DBN females have a significantly lower BATH vowel (in Aggregate 1) than do males (in Aggregate 3/4) was an unexpected finding, which should be probed in future studies.Footnote 20
The results for Black speakers are the most cohesive compared to other ethnicities: 9 of the 10 gender-by-city groups fall into Aggregates 2/3, 3/4, or 5 (where the means suggest a lack of low or back realizations). The one exception is that of CPT females who fall into 1/2, which is also suggestive of a lack of backing, this time low in terms of vowel height. This result is also indicative of close similarities between the genders in all cities, except CPT. Despite the broad similarities, Hypothesis 2d, that there are no regional differences among Black speakers, is not upheld. Figure 10D suggests that there are differences primarily between PE and KBY on the one hand (fully raised central vowels in Aggregate 5) and the other cities, which show a lesser degree of raising. Some further observations are necessary. First, our analysis does not cover measurements of vowel length, which is an additional difference between older (or traditional) BSAfE and other varieties. Second, as mentioned earlier, there is ongoing bifurcation between an older BSAfE variety and newer varieties that show greater influence from the L1 Englishes of the country, or even a crossing over into those L1 varieties. We offer a preliminary account of this difference in the following section.
BATH means for Black speakers by city and gender. See Figure 6 for explanation of abbreviations.
POINTERS FOR FUTURE RESEARCH
Bifurcation among Black speakers
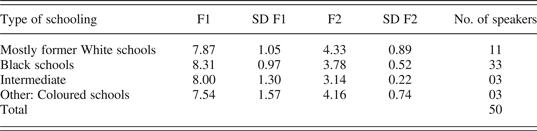
The speaker means for BATH conceal a bifurcation in the Black subsamples between “traditional” and “crossover” speakers. In order to explore the differential effects of these subgroupings, we therefore subdivide the speakers according to whether they belong to one of the following four sets: (a) those who had their entire education within segregated Black schools, and used English as L2; (b) those who had their entire or almost entire education in desegregated schools in which White L1 norms were influential, and who speak English as a dominant language; (c) those who are intermediate speakers who encountered a desegregated education relatively late in high school or university; or (d) those who went to Colored or Indian schools in their area. Table 3 gives the means for these speakers.
F1 and F2 means in Bark-difference units for Black speakers by type of schooling
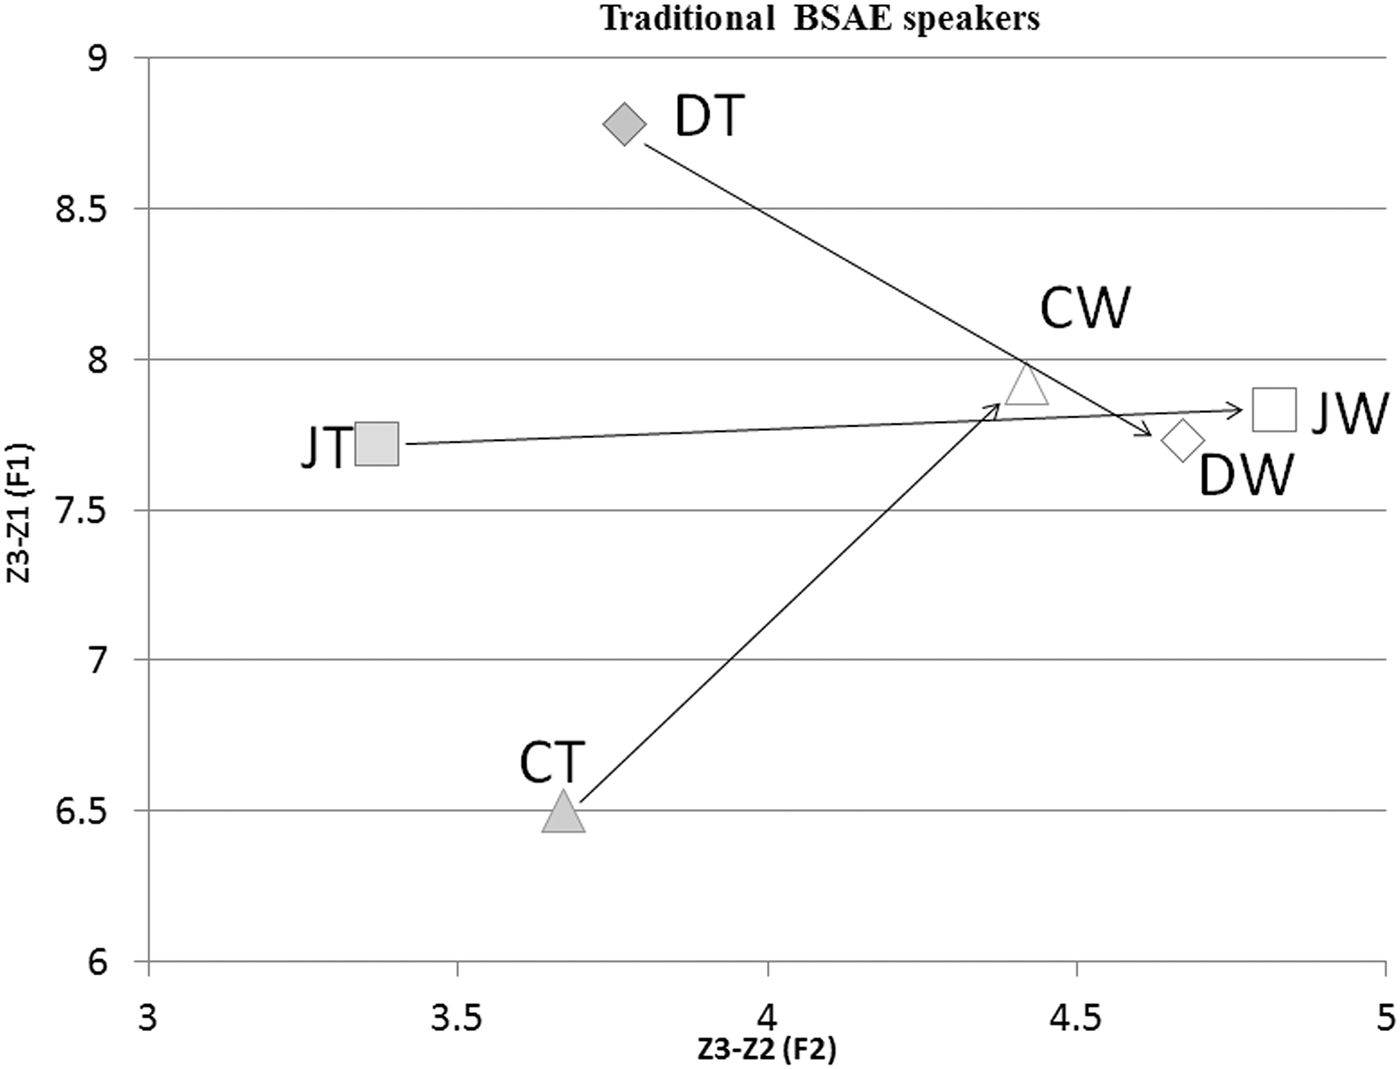
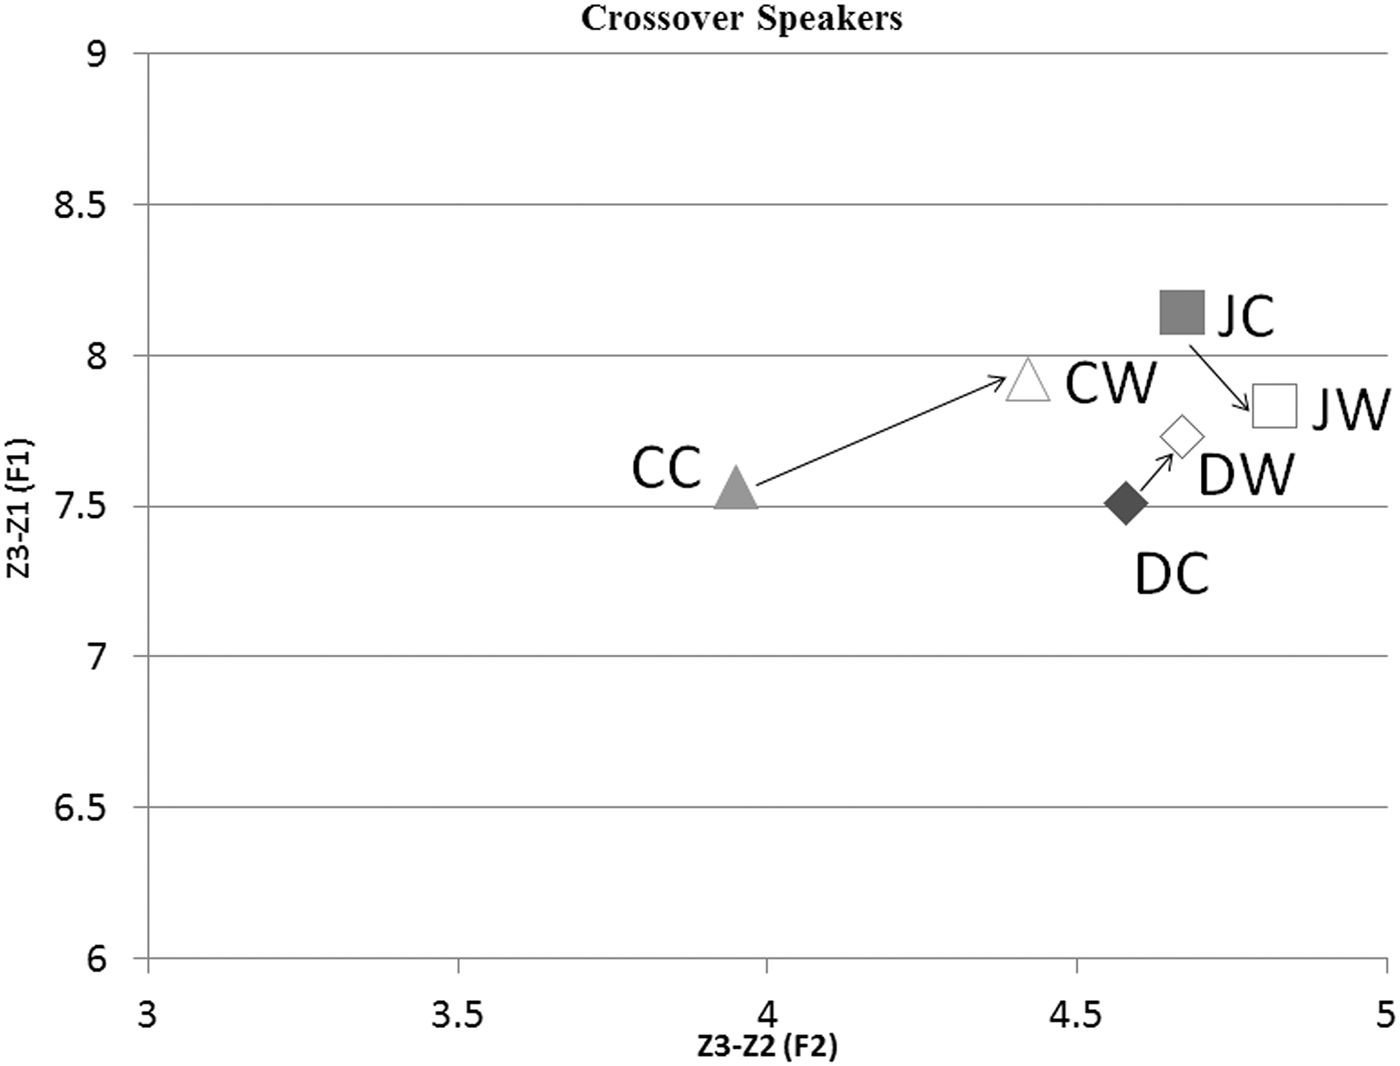
The difference between the group with desegregated school networks at former White schools (essentially “crossover” speakers) and those who attended segregated Black schools (essentially “traditional” speakers) is statistically discernible for F2 (t-diff = 3.630; p = .001) but not for F1 (t-diff = −.720; p = .476).Footnote 21 We can also compare the norms of Black speakers with those of White speakers in their city. Figures 11A and 11B chart out the means of Black crossover speakers in the largest cities (three each from JHB, DBN, CPT) against the mean of the White speakers of their city and gender, and against the means of traditional Black L2 speakers. The expectation that those with White friends from an early age via schooling are not reproducing the older BSAfE front or central norms is borne out in this preliminary illustrative account. Note the shortness of the arrows in Figure 11B, joining crossover speaker means (dark symbols) with those of their White counterparts (unshaded symbols) per city. Compare these distances with the considerable length of arrows in Figure 11A, joining traditional BSAfE speakers with White means in their city.
Means of three traditional Black SAfE speakers in 3 cities compared to White means. The first initial indicates the city (see Figure 6) and the second indicates whether the speaker is a traditional Black (T) or White (W) speaker.
Means of three crossover Black SAfE speakers in three cities compared to White means. The first initial indicates the city (see Figure 6) and the second indicates whether the speaker is a crossover Black (C), traditional Black (T), or White (W) speaker.
Afrikaans influence or its opposite?
BATH backing is one more linguistic feature of SAfE in which questions of Afrikaans influence are pertinent (see Lanham & Macdonald, Reference Lanham and Macdonald1979, relating to central realizations of KIT and a refutation by Lass & Wright, Reference Lass and Wright1986). Words with <aa> spellings in Afrikaans like praat ‘to talk’ and saam ‘together’ do have as variants [ɑ:] and [ɔ:]. Hence, Wissing (Reference Wissing2006) was able to play on this variation in the title of his acoustic study of this phenomenon, “Het jou mô en pô ‘n strôndhuis by Hôrtenbos?” ‘Do your mum and dad have a beach house in Hartenbos?’. With backing, rounding, and raising, beach house becomes shithouse. Wissing argued that backing and rounding occurs when a word or phrase is stressed, and cites De Villiers and Ponelis (Reference De Villiers and Ponelis1987) to the effect that it is a feature associated with young, urban speakers under English influence. Conversely, some English speakers in our experience associate the occurrence more with Afrikaans than English. At least one Afrikaans-English equilingual linguistics graduate student of ours believes that she produces raised and rounded BATH in her Afrikaans when wishing to sound less “English.” Are these independent developments in the two Germanic languages of the country, has Afrikaans influenced English “from below,” or has English influenced Afrikaans “from above”? These questions are matters for future English dialectology in the country and yet another case in which a problem in English dialectology can contribute to a historical sociophonetics of Afrikaans (see also Mesthrie, Reference Mesthrie2012).
Style and stylistic change?
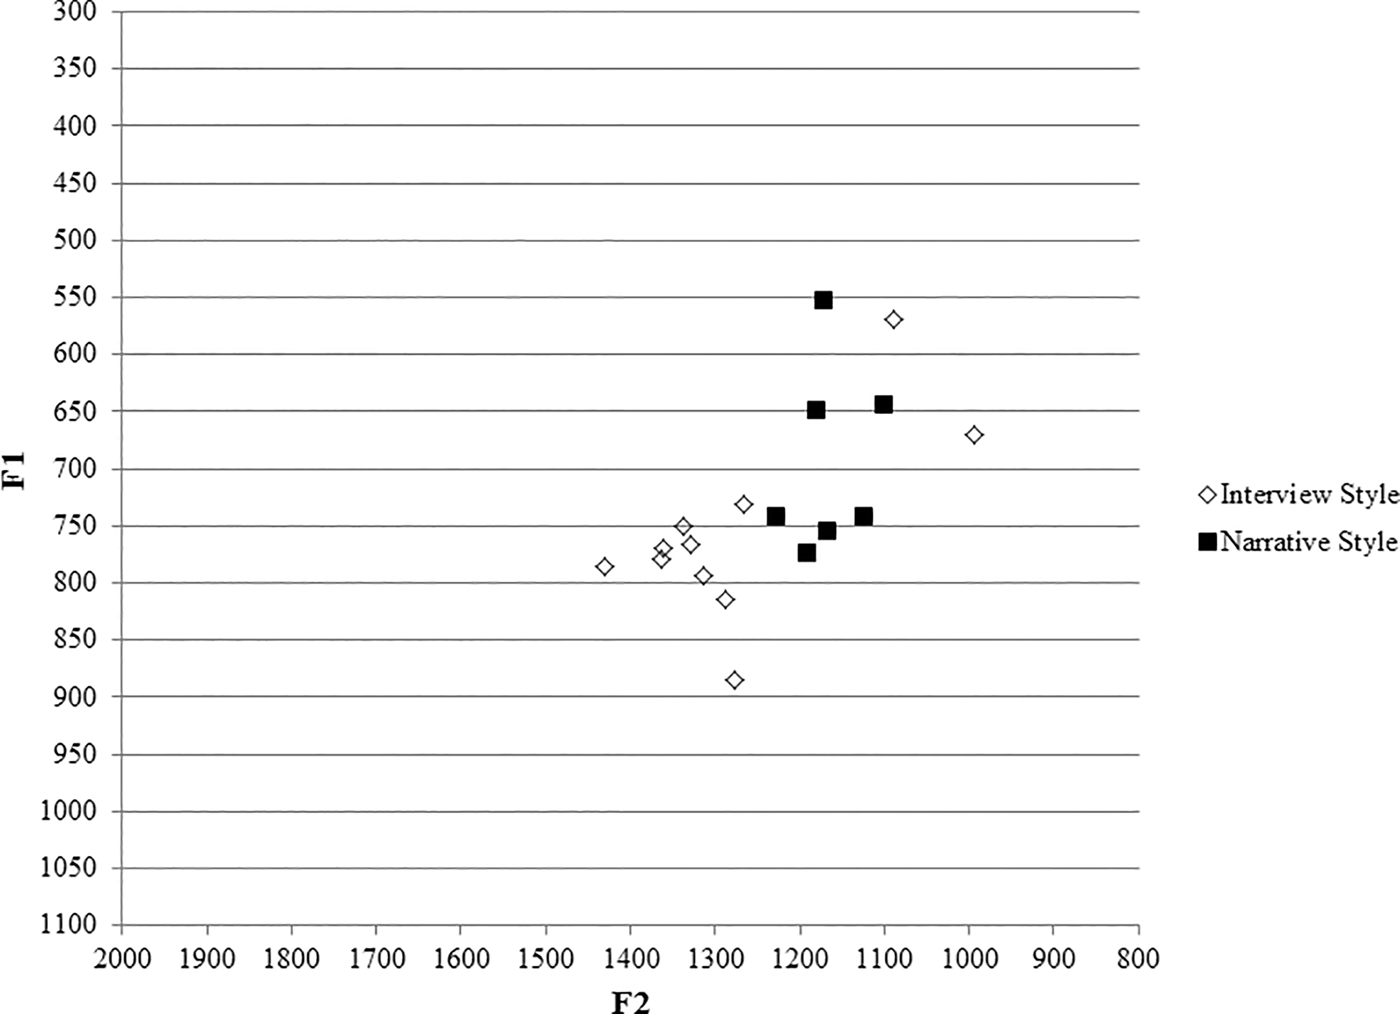
A second matter for future investigations concerns style. Given our focus on region, gender, and ethnicity, it was not possible to add further variables such as style. It is our impression that style shifting for BATH is not prominent in traditional Indian, Colored, and Black varieties. This might be less true of White speakers. We use speaker MV, a young, White, middle-class, JHB female, dominant in English, as an illustrative example. In Figure 12, the squares represent BATH tokens from an “involved” narrative style, when M.V. was talking about a crime she had experienced; the diamonds reflect lower and fronter equivalents in a less involved interview style. Apart from two exceptions, the two sets of tokens (n = 18) do not overlap. The pattern suggests that [ɒ:] or [ɔ:] are the vernacular variants, and [ɑ:] is the more prestige variant in WSAfE. A reversal might be occurring with prestigious crossover Black speakers producing the [ɒ:] variant in contexts where the RP variant was usual—for example, on television by newsreaders and anchor persons.
BATH style shift shown by MV, a White middle-class female Johannesburg speaker.
SUMMARY OF RESULTS AND CONCLUSIONS
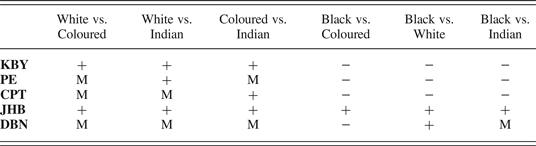
BATH is a good diagnostic vowel in characterizing sociolinguistic and regional differentiation in SAfE. Some differentiation occurs among Whites, in terms of gender mainly. Gender differentiation is also noticeable among Coloreds and Indians within certain cities, but it is not always parallel to White norms. Backing is no longer an “extreme” working-class feature in WSAfE, as suggested by Lanham (Reference Lanham, Lanham and Prinsloo1978:153), since middle-class males in all cities, and women in three cities do exhibit backed variants. Colored people show the most salient regional differentiation for BATH, with JHB contrasting sharply with the other cities. It is left to future work to uncover the reasons for this robust regional difference. In this study of vowel quality, Black males and females are different from all six other groups in KBY, PE, and CPT; different from five other groups in DBN (excepting Indian males); and different from four other groups in JHB (excepting male and female Indians).Footnote 22 The raised central means in KBY and PE are something of a puzzle since such realizations are not aurally salient. Table 4 summarizes the C-E-G results by pairwise comparisons of ethnic groups.
A summary of pairwise similarities among ethnic groups by city and gender
Note: + denotes similarities in both genders; — denotes similarity in neither gender; M denotes similarity among males; F (unused) denotes similarity among females. The pluses and minuses in table 4 are based on affiliation within aggregates excluding overlaps. Two C-E-G groups are scored as ‘—’ if they belong to different aggregates, but if they belonged to overlaps like 1/ 2 versus 2/ 3 they would be counted as ‘ + ’.
In terms of regional distribution, it is notable that in KBY, White, Colored, and Indian speakers show backing and raising.Footnote 23 This sharing of norms is suggestive of a small city effect for broader variants, which is a desideratum for future research that would include smaller towns and country districts. Table 4 strikingly confirms the earlier point made that ethnic differences are smallest in JHB. It also shows that in none of the 30 comparisons do females of one group share BATH norms with another ethnicity, without the males also doing so. The converse holds in eight instances, marked “M” in the table. Finally, Hypothesis 2c, that Indian speakers closely match Colored speakers in all cities, except Durban, is only partially upheld. The matching occurs for both genders in KBY, CPT, and JHB and for males in PE. Even in DBN, the difference between Colored males (Aggregate 4) and Indian males (Aggregate 3/4) proves to be not significant in this survey.Footnote 24
In conclusion, we trust that this survey will be the stimulus for further work on the interaction of regional and social variables in SAfE, with due regard to crossover complexities and stylistic fluidities that we have only touched on. We would encourage future researchers to focus on larger samples within a single city. The sociophonetics of South African English is a wide-open field.
Supplementary materials and methods
The supplementary material for this article can be found at http://www.journals.cambridge.org/LVC