
1. Introduction
Water entry problems, a phenomenon studied for centuries, have been motivated by a wide range of interests, from the ancient art of stone skipping to naval applications, water-surface craft (Halswell et al. Reference Halswell, Wilson, Taunton and Austen2012) and the biological/biomimetic dynamics of water-walking (Richardson Reference Richardson1948; Glasheen & McMahon Reference Glasheen and McMahon1996; Bush & Hu Reference Bush and Hu2006; Kubota et al. Reference Kubota and Mochizuki2015), as well as impacts on granular flows (Lohse et al. Reference Lohse, Bergmann, Mikkelsen, Zeilstra, Van Der Meer, Versluis, Van Der Weele, van der Hoef and Kuipers2004; Zhao, de Jong & van der Meer Reference Zhao, de Jong and van der Meer2019; Ye & Meer Reference Ye and Meer2021). Classical studies of rigid-sphere impact have demonstrated a complex interplay between projectile dynamics and cavity evolution. According to Aristoff & Bush (Reference Aristoff and Bush2009) and Speirs et al. (Reference Speirs, Mansoor, Belden and Truscott2019) and other related work (Korobkin & Pukhnachov Reference Korobkin and Pukhnachov1988; Truscott, Epps & Belden Reference Truscott, Epps and Belden2014), the accurate modelling of these phenomena may be characterised by five dimensionless numbers: Weber number
 $We = \rho _w U_{0}^{2} R_0/\sigma$
, Bond number
 $Bo = \rho _w g R_{0}^{2}/\sigma$
, Reynolds number
 $Re = \rho _w U_0 R_0/\eta$
, solid–liquid density ratio
 $\rho = \rho _s/\rho _w$
and air–liquid density ratio
 $\tilde {\rho } = \rho _a/\rho _w$
, where
 $\rho _s$
is the sphere density and
 $R_0$
is the radius,
 $\sigma$
is the surface tension,
 $\eta$
is the dynamic viscosity of the liquid,
 $\rho _w$
is the liquid density,
 $\rho _a$
is the air density and
 $g$
is the gravitational acceleration.
There are two distinct dynamical regimes governed by the Weber number. In the capillary-dominated regime (
 $ We \leqslant 1$
), surface tension enables dense spheres (
 $\rho \geqslant 1$
) to establish a transient contact line and rebound through capillary forces (Vella, Lee & Kim Reference Vella, Lee and Kim2006; Vella & Metcalfe Reference Vella and Metcalfe2007). Conversely, in the inertia-dominated regime (
 $ We \gg 1$
), cavity dynamics is controlled by the Froude number
 $ Fr = U_{0}^{2}/(gD_{0})$
, with aerodynamic effects becoming negligible when
 $ Fr \gg 1$
(Lee & Kim Reference Lee and Kim2008; Truscott et al. Reference Truscott, Epps and Belden2014). In this regime, whether the rigid sphere rebounds during impact depends on two characteristic time scales: the cavity collapse time
 $ \tau _p$
and the sphere deceleration time
 $ \tau _c$
. Following Duclaux et al. (Reference Duclaux, Caillé, Duez, Ybert, Bocquet and Clanet2007),
 $ \tau _p$
represents the cavity pinch-off time. When
 $ \tau _c \gg \tau _p$
, the sphere’s motion decouples from cavity evolution as deceleration becomes insignificant during collapse. While when
 $ \tau _c \approx \tau _p$
(Aristoff et al. Reference Aristoff, Truscott, Techet and Bush2010), the coupled interaction between sphere dynamics and cavity evolution enables rebound through synchronised fluid–structure interactions.
Key advancements in rigid sphere rebounds, as demonstrated by Aristoff et al. (Reference Aristoff, Truscott, Techet and Bush2010), revealed that low-density rigid spheres (
 $\rho \lt 0.3$
) with a contact angle of approximately
 $120^{\circ}$
experience upward forces due to cavity collapse. Further research by Lee & Kim (Reference Lee and Kim2008) found that hydrophobic rigid spheres with a contact angle of
 $154^{\circ}$
and
 $\rho \approx 1$
exhibit rebound when
 $WeBo^{3/2} \approx 8$
, where
 $Bo \approx 5$
and
 $We \leqslant 2$
. Additionally, the study by Speirs et al. (Reference Speirs, Mansoor, Belden and Truscott2019) extended the range of contact angles of the spheres from
 $84^{\circ}$
to
 $145^{\circ}$
, revealing that spheres rebound at
 $We \lt 1$
and
 $Bo \lt 0.5$
.
Correspondingly, the cavity behaviour can be classified into four distinct categories – quasi-static, shallow seal, deep seal and surface seal – depending on
 $Bo$
and
 $We$
(Aristoff & Bush Reference Aristoff and Bush2009). It is worth noting that Duclaux et al. (Reference Duclaux, Caillé, Duez, Ybert, Bocquet and Clanet2007) provided an analytical solution for cavity evolution, assuming that the sphere does not influence the cavity. This suggests that the cavity evolution follows a scaling of
 $t^{1/2}$
, according to potential flow theory, and this relationship is also observed when considering the interaction between the sphere and the cavity. Aristoff & Bush (Reference Aristoff and Bush2009) further developed a more specific theoretical framework to characterise the evolving cavity dynamics, accounting for the effects of rigid-sphere velocities.
Regarding droplet–liquid impact, there are four distinct regimes of droplet behaviour (Zhao, Brunsvold & Munkejord Reference Zhao, Brunsvold and Munkejord2011): low-energy collision coalescence, bouncing, high-energy collision coalescence and splashing. These regimes are characterised by a sequence of interfacial phenomena, such as transient crown formation, air entrainment cavity dynamics and subsurface bubble generation, all of which are governed by the dimensionless parameters, particularly
 $We$
,
 $Re$
and Ohnesorge number (Gilet & Bush Reference Gilet and Bush2012; Lhuissier et al. Reference Lhuissier, Sun, Prosperetti and Lohse2013). The rebound phenomenon is particularly sensitive to interfacial physics, requiring a precise balance of competing forces. As demonstrated in Richard & Quéré (Reference Richard and Quéré2000), droplet bouncing on thin liquid films necessitates sustained air cushioning, with rebound occurring only when inertial forces balance the retention of interfacial energy. Hydrophobic surfaces amplify droplet rebound behaviour(Tran et al. Reference Tran, de Maleprade, Sun and Lohse2013) and enable complete droplet ejection from the liquid, a phenomenon known as hydrodynamic bouncing (Korobkin & Pukhnachov Reference Korobkin and Pukhnachov1988; Lee & Kim Reference Lee and Kim2008; Truscott et al. Reference Truscott, Epps and Belden2014).
While the dynamics of rigid solids and liquid droplets during water impact is well characterised (Bush & Hu Reference Bush and Hu2006), hydrogels – due to their high water content, strong hydrophilic properties and viscoelastic features – exhibit mechanisms of transition from rigid to liquid impact behaviour in granular media (Ye & Meer Reference Ye and Meer2021). Unlike rigid spheres or liquids, hydrogel spheres undergo significant deformation upon impact, storing elastic energy, altering cavity dynamics and leading to unexpected behaviours by fluid–structure coupling. Experimental and theoretical studies (Hurd et al. Reference Hurd, Belden, Jandron, Fanning, Bower and Truscott2017) on the vertical water entry of elastic spheres demonstrate that deformations of the sphere induce wavy disturbances in the cavity. Furthermore, Belden et al. (Reference Belden, Hurd, Jandron, Bower and Truscott2016) performed experiments and numerical simulations of elastic spheres during oblique water entry, revealing that elastic spheres exhibit superior water-skipping ability compared with rigid spheres. This is attributed to the deformation of the sphere, which is governed by the elastic Mach number
 $Ma = U_{0}/U_e$
. Besides, deformable spheres can achieve skipping at an impact angle of
 $\beta = 47^{\circ}$
when
 $\rho = 0.959$
(Belden et al. Reference Belden, Hurd, Jandron, Bower and Truscott2016), which exceeds the upper limit of
 $\beta = 18^{\circ} / \sqrt {\rho }$
(Richardson Reference Richardson1948) for rigid spheres. In vertical impact experiments, Rabbi et al. (Reference Rabbi, Kiyama, Allen and Truscott2022) investigated soft hydrogel spheres impacting a droplet and observed a bouncing phenomenon. They identified a modified elastic Mach number
 $V_e/U_e$
, where
 $V_e$
is the spreading velocity of the droplet, to determine the onset of droplet lift-off.
Therefore, deformable hydrogel spheres present a unique feature for investigating fluid–structure interactions during water entry. Here, an experiment for hydrogel spheres vertically impacting into liquid is performed. We measure sphere deformation and cavity dynamics during impact using high-speed cameras, examining how the motion of spheres depends on control parameters through energy distribution and potential flow theory. An analytical model relates the maximum deformation area and velocity to hydrodynamic drag, identifying rebound mechanisms and predicting parameter ranges for rebound. This approach can also be applied to other natural systems like basilisk lizards and shorebirds, which exploit inertial forces by hyperextending limbs to conform to transient cavities, followed by energy recovery during rebound (Glasheen & McMahon Reference Glasheen and McMahon1996; Kubota et al. Reference Kubota and Mochizuki2015).
The paper is structured as follows: In § 2, we discuss the experimental set-up, the production of the hydrogel sphere and the measurement method of Young’s modulus, as well as the preparation of liquids with varying viscosities. In § 3, we exhibit the motion of the hydrogel spheres and the evolution of the cavity. Section 4 then focuses on the decomposition of the impact kinetic energy
 $E_k$
into two components: the energy used for the deformation of the sphere (
 $E_d$
) and the energy contributed to the formation of the cavity (
 $E_s$
). Finally, in § 5, we investigate the bouncing phenomenon, exploring the conditions under which the spheres rebound and analysing the process in terms of time scales. The paper is concluded in § 6.
2. Experimental methods
We investigate how varying the impact velocity
 $U_{0}$
, the stiffness characterised by Young’s modulus
 $Y$
of the spheres and the viscosity of liquid influence the entry of deformable hydrogel spheres into liquids. The experimental set-up is shown in figure 1(a), where two high-speed cameras at 10 000 frames per second are simultaneously employed to capture hydrogel sphere deformation and cavity profile at impact speeds
 $U_{0}$
ranging from
 $1$
to
 $4.5\,{\rm m\,s}^{-1}$
. For instance, figures 1(b) and 1(c) are snapshots when the hydrogel sphere reaches its maximum diameter
 $d_m$
and the corresponding cavity radius, respectively.
(a) Sketch of the experimental set-up. The impact of the hydrogel sphere and its deformation are imaged with one high-speed camera, whereas simultaneously, the cavity formation of the liquid is recorded by the second high-speed camera. (b) The moment when the diameter reaches its maximum
 $d_m$
and (c) the cavity radius
 $R(\theta )$
at this instant.

A series of acrylamide gels are prepared by copolymerising acrylamide (40 % stock solution, Sigma-Aldrich) as the monomer and methylene bisacrylamide (2 % stock solution, Sigma-Aldrich) as the comonomer. To initiate and accelerate radical polymerisation, sodium persulphate (0.93 g l−1, Sigma-Aldrich) and tetramethylenediamine (0.6 g l−1, Sigma-Aldrich) were added. The monomer and comonomer solutions were premixed before the addition of initiators. Subsequently, a volume of 33.6 to 113.1 μl of this solution (corresponding to a hydrogel sphere with a diameter
 $D_{0}$
of approximately 4.0 to 6.0 mm) was transferred into an Eppendorf tube filled with polyoil of density 1.006 g ml−1 (Sigma-Aldrich) at 25
 $^{\circ}$
C to match the solution’s density, promoting polymerisation.
The polyacrylamide hydrogel sphere exhibits a static contact angle of 20.6° (Wu & Shanks Reference Wu and Shanks2004), indicating strong hydrophilicity. Meanwhile,
 $Y$
of the hydrogel sphere was adjusted by varying the concentrations of the monomer and comonomer, which was evaluated using the Hertz theory for the deformation of an elastic sphere (Ye & Meer Reference Ye and Meer2021):
 \begin{equation} F(\delta )=\frac {4Y}{3\sqrt {2}(1-\nu _P^{2})}D_{0}^{1/2}\delta ^{3/2}\,, \end{equation}
where Poisson’s ratio
 $\nu _P = 0.5$
was determined by the incompressibility condition. The homemade set-up used for measuring Young’s modulus comprises a scale and a micrometer, as illustrated in figure 2(a). A hydrogel sphere was placed between the scale and a rigid plate connected to a micrometer mounted on a stand. By adjusting the micrometer to apply quasi-static loading, the indentation
 $\delta$
of the sphere and the corresponding force
 $F$
were recorded, as shown in figure 2(b). The measured
 $Y$
ranges from approximately
 $50$
to
 $1000$
Pa, following the expected power law, as detailed in table 1.
(a) The set-up for Young’s modulus measurement. Hydrogel spheres were placed on a scale and a rigid plate, with the micrometer mounted on top of the plate. (b) Experimental data for hydrogel spheres with different moduli, where the dashed line represents the scaling with an exponent of
 $3/2$
, as predicted by Hertz theory. Note that the symbol legend of (b) is shared by the other figures.

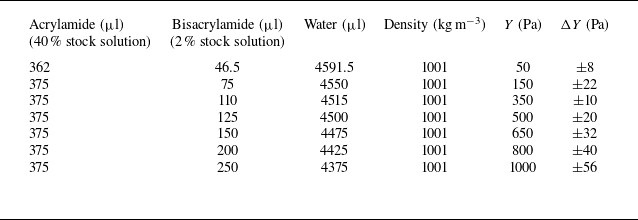
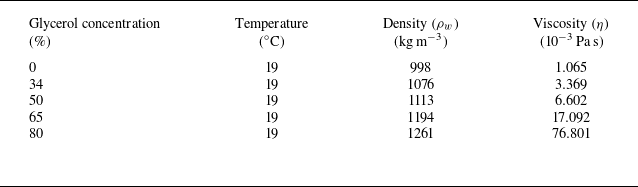
We prepared liquid pools with controlled viscosity using ultrapure water and glycerol–water mixtures. The glycerol (Sigma-Aldrich, 99.5 % purity) was blended at various volume concentrations to produce solutions of specified viscosity, with detailed formulations listed in table 2. The density of each solution was measured experimentally, while viscosity and surface tension values were taken from the established work of Takamura, Fischer & Morrow (Reference Takamura, Fischer and Morrow2012). These reference values show excellent agreement with both theoretical calculations (Cheng Reference Cheng2008; Chantelot et al. Reference Chantelot, Coux, Clanet and Quéré2018) and independent experimental measurements (Sharma et al. Reference Sharma, Nand, Pramanik, Chen and Mishra2020).
Young’s modulus
 $Y$
of hydrogel spheres determined after polymerisation of different concentrations of acrylamide and bisacrylamide. Here,
 $\Delta Y$
represents the standard deviation in
 $Y$
, obtained from different batches of hydrogel spheres prepared using the same method.

Viscosity and other properties of ultrapure water and glycerol solution with different concentrations.

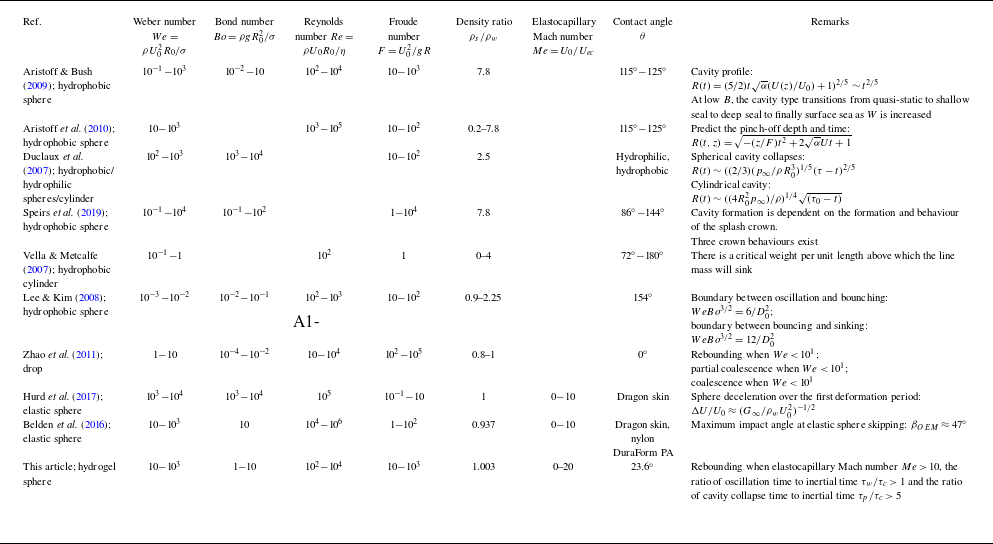
Dimensionless quantities of various water entry behaviours are summarised based on relevant studies and the results presented in this study.

Before performing impact experiments, hydrogel spheres are suspended from a small nozzle connected to a vacuum pump that generates suction pressure. When the suction pressure was released, the spheres fell down vertically into a
 $10$
cm
 $\times \ 10$
cm
 $\times \ 8$
cm liquid container under gravitational acceleration. It was checked that the boundaries of the container have a negligible effect on the impact results. We mainly focus on results obtained with the liquid viscosity
 $\eta$
ranging from
 $1.065 \times 10^{-3}$
to
 $76.801 \times 10^{-3}$
Pa s at
 $19\,^{\circ}$
C, with dimensionless parameters spanning
 $We=10$
–
 $10^{3}$
,
 $Bo=1$
–
 $10$
and
 $Re= 10^{2}$
–
 $10^{4}$
(table 3). For comparison, we include parameter ranges from representative studies on rigid-sphere entry to liquid-surface rebound phenomena. The elastocapillary Mach number
 $Me$
, related to
 $Y$
, is introduced through energy partitioning analysis in § 4.1, with the corresponding values included in table 3.
3. Dynamic process of hydrogel sphere water entry
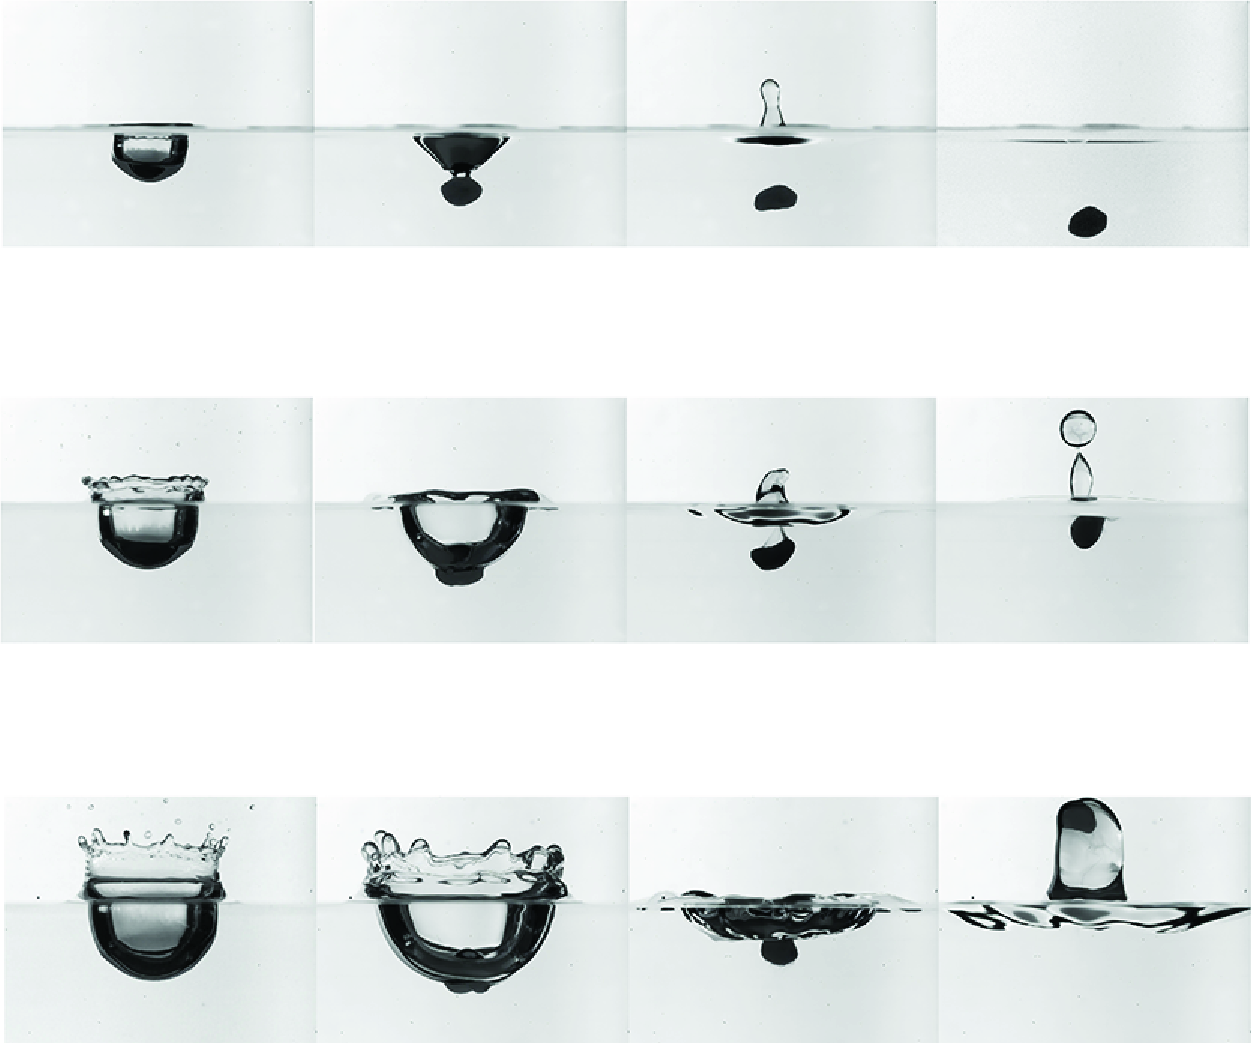
For the motion of the hydrogel sphere impacting liquid at different parameters, we have observed three distinct regimes as shown in figure 3 and Supplementary Movies. Figure 3(a) and Supplementary Movie 1 captures a hydrogel sphere (
 $Y = 150$
Pa,
 $U_{0} = 1.5$
m s−1) impacting a liquid surface. A transient shallow and narrow cavity forms and then collapses as the contact line reaches the apex. The hydrogel sphere continues to sink vertically, which we refer to as ‘sinking’. At
 $U_{0} = 2.5$
m s−1, the hydrogel sphere (
 $Y = 150$
Pa) undergoes more pronounced deformation during impact, forming a radially wider and deeper cavity. As the cavity retracts, the hydrogel sphere rises and remains suspended near the surface for a long time, even if its density is higher than that of the surrounding liquid. This behaviour is defined as ‘suspension’, as illustrated in figure 3(b) and Supplementary Movie 2. At
 $U_{0} = 4$
m s−1 (figure 3(c) and Supplementary Movie 4), the hydrogel sphere experiences extreme deformation and cavity expansion. As the cavity retracts, the Worthington jet rebounds above the water surface, while the hydrogel sphere remains encapsulated within the jet and ascends with the retracting cavity – a phenomenon termed ‘rebounding’, in which elastic and hydrodynamic forces sustain partial submersion rather than full detachment.
In these three types of motion, the cavity morphologies observed are classified as the quasi-static seal, following the established categorisation for solid sphere water entry (Aristoff & Bush Reference Aristoff and Bush2009; Speirs et al. Reference Speirs, Mansoor, Belden and Truscott2019). Specifically, for a solid sphere with contact angle of
 $89^{\circ}$
, Speirs et al. (Reference Speirs, Mansoor, Belden and Truscott2019) reported that cavities transition to the quasi-static seal when
 $We \lt 200$
within their investigated
 $Bo$
range, a behaviour qualitatively similar to our observations. Similarly, previous studies have established
 $We \gt 55$
as the critical threshold for Worthington jet formation (Hsiao, Lichter & Quintero Reference Hsiao, Lichter and Quintero1988), which is consistent with our findings. However, hydrogel spheres may remain submerged even for
 $We \gt 55$
, indicating that jet formation alone is insufficient to guarantee hydrogel sphere rebound.
We systematically map these parametric dependencies by varying
 $U_{0}$
,
 $Y$
,
 $D_{0}$
and
 $\eta$
. Figure 4 presents a phase diagram where colours distinguish different regimes. Notably, all cases experience the transitions of the impact type from ‘sinking’ to ‘suspension’ to ‘rebounding’ regimes as
 $U_{0}$
increases, while the transitions occur at lower
 $U_{0}$
for lower
 $Y$
. All the data are well classified within these three regimes. The ‘rebounding’ regime (blue) occurs at high
 $U_{0}$
and low
 $Y$
, whereas the ‘sinking’ regime (red) dominates at low
 $U_{0}$
and higher
 $Y$
, and the ‘suspension’ regime (grey) lies in between these two regimes for medium
 $U_{0}$
and
 $Y$
, highlighting the critical role of deformation in the rebound dynamics of hydrogels. Remarkably, for soft hydrogels (low
 $Y$
), we observe a positive correlation between rebound probability and
 $We$
– directly opposing the negative
 $We$
dependence characteristic of solid spheres. It is demonstrated that hydrogel spheres exhibit increased
 $d_m$
and a higher tendency to rebound with increasing
 $U_{0}$
, under fixed values of
 $Y$
, liquid surface tension
 $\sigma$
and density ratio
 $\rho$
. This behaviour contrasts with that of solid spheres, which are more likely to rebound at lower
 $U_{0}$
. Furthermore, rebound is completely suppressed for stiff hydrogels (high
 $Y$
), such that as hydrogels become stiffer, jet-assisted rebound is absent, similar to the behaviour observed with solid spheres.
Snapshots of hydrogel sphere impact process at the same
 $Y=150\, {\rm Pa}$
but three different initial speeds, also representing the three different regimes: (a)
 $U_{0}$
= 1.5 m s−1, ‘sinking’ regime; (b)
 $U_{0}$
= 2.5 m s−1, ‘suspension’ regime; (c)
 $U_{0}$
= 4 m s−1, ‘rebounding’ regime.

The full phase diagram of all experimental cases in the (
 $U_{0},\ Y$
) parameter space. The red, grey and blue points represent the cases in the ‘sinking’, ‘suspension’ and ‘rebounding’ regimes, respectively. The solid line represents the prediction curve based on (5.2), derived from a force balance on hydrogel spheres. The vertical axis corresponds to the right-hand side of (5.2), governed by the Young’s modulus
 $Y$
, surface tension
 $\gamma$
and diameter
 $D_{0}$
of the hydrogel sphere. The horizontal axis represents the left-hand side of the equation, which depends on the impact velocity
 $U_{0}$
, density ratio
 $\rho$
and drag coefficient
 $C_D$
, as detailed in the derivation presented in § 5. The data points represent an extended experimental dataset, with corresponding dimensionless parameters in the ranges
 $Bo \in [1, 10]$
and
 $We \in [10, 10^{3}]$
, consistent with table 3.

This phenomenon is distinct from the mechanism by which the initial jet propels the water strider above the free surface (Watson et al. Reference Watson, Thornton, Khan, Diamco, Yilmaz-Aydin and Dickerson2024), as it occurs even when
 $\rho \gt 1$
. To understand these distinct behaviours, we theoretically predict these regime transitions in subsequent sections, revealing the underlying mechanics governing hydrogel impact dynamics.
Starting with the force balance, we consider a sphere impacting a free surface with contact line
 $C$
and a wetted contact area
 $S_b$
. The instantaneous force
 ${\textbf{F}}$
acting on the object, composed of hydrodynamic stress and the force generated by surface tension, can be expressed precisely as
 \begin{equation} {\textbf{F}}=\int _{S_{b}}{\textbf{S}}_{\textbf{T}}\cdot {\textbf{n}}{\rm d}{\kern-0.5pt}S + \int _{C}\sigma {\textbf{t}}{\rm d}\ell , \end{equation}
where
 ${\textbf{n}}$
and
 ${\textbf{t}}$
are the unit vectors normal and tangent to the free surface. Hydrodynamic stress is
 ${\textbf{S}}_{\textbf{T}}=-p{\textbf{I}}+2\mu {\textbf{E}}$
, where
 $p$
is the fluid pressure,
 ${\textbf{I}}$
is the identity matrix and
 $ {\textbf{E}}=[\nabla {\textbf{u}} +(\nabla {\textbf{u}})^{T}]/2$
is the rate of strain tensor. Applying the Stokes theorem, we transform the line integral into an equivalent surface integral over
 $S$
:
 \begin{equation} \int _{C}\sigma {\textbf{t}}{\rm d}\ell =\int _{S_b}\left [\sigma \!\left (\nabla \cdot {\textbf{n}}\right ) {\textbf{n}}-\nabla \sigma \right ]\!{\rm d}{\kern-0.5pt}S. \end{equation}
The surface tension contributes to both the normal and tangential stresses at the interface. The normal stress is given by the Laplace pressure
 $\sigma \kappa$
, where
 $\kappa = \nabla \cdot {\textbf{n}}$
is the interface curvature. The tangential stress arises from surface tension gradients
 $\nabla \sigma$
. In our experiments, the cavity dynamics is characterised by the maximum depth
 $H^{*} = 10^{-3}$
m and its associated time scale
 $T^{*} = 10^{-2}$
s. This gives dimensionless numbers
 $Re = \rho _w H^{\ast 2}/(T^{\ast} \eta ) \approx 10^4$
and
 $Ma = H^{\ast} /(T^{\ast} c) \approx 10^{-4}$
, where
 $c=1500$
m s−1 is the speed of sound in water. With
 $Re \gg 1$
and
 $Ma \ll 1$
, both viscous and compressibility effects are negligible.
For inviscid flow, the pressure
 $p$
is related to the velocity fields through the unsteady Bernoulli equation:
 $(\partial \phi /\partial t)+(1/2)|{\textbf{u}}|^{2}+(p+\rho {\textbf{g}}\cdot {\textbf{z}})/\rho =Q$
. Here,
 ${\textbf{u}}$
is the fluid velocity,
 $\phi$
is the velocity potential,
 ${\textbf{g}}$
is gravity,
 ${\textbf{z}}$
is the position of the sphere and Q is a constant. Substituting the Bernoulli pressure
 $p$
into the hydrodynamic stress tensor
 $\textbf{T}$
, then the combination of
 $\textbf{T}$
, curvature force (3.2) and (3.1) yields a force
 \begin{equation} {\textbf{F}}=\int _{S_b}\left [\left (\rho _w\frac {\partial \phi }{\partial t}+\tfrac {1}{2}\rho _w|{\textbf{u}}|^{2}-\rho _w{\textbf{g}}\cdot {\textbf{x}}+\sigma (\nabla \cdot {\textbf{n}})\right )\right ]{\textbf{n}}-\int _{S_b}\nabla \sigma \,{\rm d}{\kern-0.5pt}S. \end{equation}
The integrated form of (3.3) yields the complete force balance comprising five key contributions, including the drag force
 $\rho _w U^{2} A$
, buoyancy force
 $\rho _w g H A$
, added mass force
 $\rho _w V {\rm d}U/{\rm d}t$
, curvature force
 $\sigma A/L$
and Marangoni force
 $\nabla \sigma A$
. Taking impact velocity
 $U_{0}$
, sphere volume
 $D_{0}^{3}$
, contact area
 $D_{0}^{2}$
, contact width
 $D_{0}$
and penetration depth
 $H^{*}$
as characteristic scales, the dimensional scaling reveals that inertial forces
 $\rho _w U_{0}^{2} D_{0}^{2}$
dominate at
 $\mathcal{O}(10^{-2})$
, while buoyancy
 $\rho _w g D_{0}^{3} \sim \mathcal{O}(10^{-3})$
, hydrostatic pressure
 $\rho _w g H^{*} D_{0}^{2} \sim \mathcal{O}(10^{-5})$
and capillary effect
 $\sigma D_{0}^{2}/L \sim \mathcal{O}(10^{-5})$
are secondary. The added mass
 $\rho _w D_{0}^{3} U_{0}/T^{*} \sim \mathcal{O}(10^{-4})$
becomes negligible during rapid acceleration, and the effect of Marangoni force
 $\nabla \sigma D_{0}^{2} \sim 0$
remains negligible throughout the impact process. Therefore, the drag force dominates all other contributions by at least one order of magnitude during the initial impact stage (
 $t \leqslant T^{*}$
). This permits a simplified force balance:
 \begin{equation} \rho _{s} V \ddot z_{c}=\tfrac {1}{2}\rho _{w}AU^{2}C_{D}, \end{equation}
where
 $V$
is the volume of the sphere,
 $z_c$
is the displacement of the sphere,
 $U$
is the centre-of-mass velocity of the sphere,
 $C_D$
is the drag coefficient and
 $A$
is the wetted area. Completely understanding the phase diagram requires modelling
 $A$
,
 $U$
and
 $C_D$
via a coupled analysis of hydrogel deformation and cavity dynamics in subsequent sections.
4. Modelling hydrogel deformation and cavity dynamics
The impact dynamics of hydrogel spheres exhibits strong coupling between elastic deformation and cavity evolution. Following the energy-based framework in prior studies of droplet impacts (Chantelot et al. Reference Chantelot, Coux, Clanet and Quéré2018) and granular impacts (Ye & Meer Reference Ye and Meer2021), the impact energy is partially used for the deformation of the droplet, and the remaining part may be used for the formation of the crater. We hold the same argument and investigate these phenomena by analysing the energy distribution between sphere deformation and target response to determine the sphere’s contact area
 $A$
and
 $U$
.
The relevant average deceleration experienced by (a) a hydrogel sphere impacting on solid and (b) a hydrogel sphere impacting on liquid.

As established in previous work (Ye & Meer Reference Ye and Meer2021), when a hydrogel impacts a solid substrate, the spreading diameter reaches its maximum, producing a centroid displacement of
 $ \delta _m/2$
(figure 5
a). The solid surface exerts an average force
 ${2E_{k}}/{\delta _m}$
on the sphere, yielding an average deceleration
 $ a \approx {U_{0}^{2}}/{\delta _m}$
. In our experiments where water replaces the solid substrate (figure 5
b), the centre-of-mass displacement increases to
 $ \delta _m/2 + H^{\ast}$
. Consequently, the deceleration is reduced to
 \begin{equation} a = \frac {U_{0}^{2}}{\delta _m + 2H^{\ast} } = \frac {\delta _m}{\delta _m + 2H^{\ast} } \,\frac {U_{0}^{2}}{\delta _m}. \end{equation}
This indicates that, for the same impact kinetic energy, the deceleration of the hydrogel decreases from
 $ a = {U_{0}^{2}}/{\delta _m}$
to
 $ a = ({\delta _m}/{(\delta _m + 2H^{\ast} )})U_{0}^{2}/\delta _m$
, a reduction by a factor of
 $\xi ={\delta _m}/{(\delta _m + 2H^{\ast} )}$
, which is equivalent to the hydrogel sphere impacting a solid surface with an effective kinetic energy
 $E_d = \xi E_k$
. In other words, when a hydrogel sphere impacts a liquid, the impact kinetic energy
 $E_k$
is partitioned into two components:
 $E_d$
, which is used for the deformation of the hydrogel sphere, and
 $E_s$
 $= E_k - E_d$
, which is used for the formation of the cavity. These components are defined as follows:
 \begin{equation} E_d = \frac {\delta _m}{\delta _m + 2H^{\ast} }E_k \qquad {\text{and}} \qquad E_s = \frac {2H^{\ast} }{\delta _m + 2H^{\ast} }E_k. \end{equation}
We can estimate the maximum vertical deformation
 $\delta _{m}$
based on the incompressibility condition, given by
 $\delta _{m} \approx D_{0} - D_{0}^{3}/d_{m}^{2}$
, where
 $d_{m}$
represents the maximum deformation diameter of the hydrogel sphere. Notably, when the hydrogel sphere reaches
 $d_{\text{m}}$
, both the sphere and the surrounding liquid move at identical velocities, inducing the added mass force. The above dimensional analysis indicates that the added mass effects are negligible in comparison with inertial forces.
4.1. Spreading diameter of hydrogel spheres
To characterise the evolving morphology of the hydrogel, we employ the digital image correlation technique developed by Zhao et al. (Reference Zhao, de Jong and van der Meer2019). In our experimental imaging conditions, the sphere appears as a dark elliptical profile due to the combined effects of viewing perspective and illumination. The instantaneous spreading diameter
 $d$
is determined by identifying maximum-correlation template size, from which the maximum diameter
 $d_m$
is extracted through temporal analysis of the impact sequence.
Dimensionless maximum spreading diameter
 $\lambda _{m}$
of hydrogel spheres as a function of: (a) impact velocity
 $U_{0}$
for varying
 $Y$
, (b) elastic Mach number
 $U_{0}/U_{e}$
, (c) elastocapillary Mach number
 $U_{0}/U_{ec}$
and (d) inverse square law
 $U_{ec}^{2}/U_{0}^{2}$
.

Figure 6(a) exhibits the scaled maximum spreading diameter
 $\lambda _m = d_m/D_{0}$
versus
 $U_{0}$
. The scaled maximum diameter
 $\lambda _m$
shows a pronounced increase with both decreasing
 $Y$
and
 $U_{0}$
, revealing the coupled influence of material properties and impact energy on spreading dynamics. Hurd et al. (Reference Hurd, Belden, Jandron, Fanning, Bower and Truscott2017) revealed that the peak spreading diameters of the sphere could be predicted using neo-Hookean hyperelasticity, scaled by the dimensionless group
 $ G/\rho _w U_{0}^{2}$
. Here,
 $G$
is the shear modulus of the sphere, related to
 $Y = 2G(1 + \nu ) \approx 3G$
. It is similar to the work of Tanaka, Yamazaki & Okumura (Reference Tanaka, Yamazaki and Okumura2003), who studied cross-linked gels (
 $Y \approx 2000$
Pa) impacting non-adhering rigid substrates and applied the balance of inertial and elastic energies to predict maximum spreading diameter. We now extend this energy-balance approach to our system, equating
 $E_e$
with the portion
 $E_d$
of the impact kinetic energy that is available for the sphere deformation. Based on elasticity theory, the bulk elastic energy
 $E_{e} \approx \pi D_{0}^{3} G(2\lambda _m^{2}+\lambda _m^{-4}-3)/12$
. When the maximum spreading diameter is significantly large (
 $\lambda _m \gg 1$
), the first term dominates the elastic energy, leading to
 $E_e \approx \pi D_{0}^{3} G \lambda _m^{2}/6$
. We derive the expression for the spreading diameter by applying the energy conversion
 $E_d = E_e$
, which gives
 \begin{equation} \lambda _m \approx \frac {\sqrt {\xi }}{\sqrt {2}} \frac {U_{0}}{U_{e}} . \end{equation}
Here, the quantity
 $\sqrt {\xi } U_{0}/U_e=\sqrt {\xi } Ma$
can be interpreted as a modified elastic Mach number and
 $U_e = \sqrt { Y/3\rho _s}$
represents the characteristic velocity of transverse elastic waves. Figure 6(b) presents
 $\lambda _m$
versus the modified elastic Mach number
 $Ma$
for an extended dataset including various liquid viscosities and sphere diameters. While the data collapse well at lower values of this parameter, the scaling deteriorates at higher values. This is due to the surface tension term becoming significant (Arora et al. Reference Arora, Fromental, Mora, Phou, Ramos and Ligoure2018; Ye & Meer Reference Ye and Meer2021) when
 $l_{ec}/D_{0} \gtrsim 1$
, where
 $ l_{ec} \equiv 9\gamma /Y$
is the elastocapillary length, derived from
 $ G + 3\gamma /D_{0} = 3Y(1+l_{ec}/D_{0})$
. Given our experimental range of moduli (50–1000 Pa), we introduce the surface energy term
 $E_c \approx \pi D_{0}^{2}\gamma \lambda _m^{2}/2$
into the balance. Consequently, the sum of the elastic and capillary energies must be in balance with the portion of the impact kinetic energy available for the deformation of the sphere
 $\xi \pi \rho _sD_{0}^{3}U_{0}^{2}/12=\pi D_{0}^{3} G\lambda _m^{2}/6+\pi D_{0}^{2}\gamma \lambda _m^{2}/2$
, which finally gives
 \begin{equation} \lambda _m \approx \frac {\sqrt {\xi }}{\sqrt {2}} \frac {U_{0}}{U_{e c}} \quad \text{with } \quad U_{e c}^{2}=U_e^{2}+U_c^{2}=\frac {Y}{3 \rho _s}+\frac {3 \gamma }{\rho _s D_{0}}. \end{equation}
Figure 6(c) demonstrates the universal scaling of
 $\lambda _m$
with the elastocapillary Mach number
 $M_e = U_{0}/U_{ec}$
(using
 $\gamma = 7.3 \times 10^{-2}$
N m−1), where all experimental data collapse onto a single master curve. To contrast with previous scaling laws, we further plot
 $\lambda _m$
against
 $U_{ec}^{2}/U_{0}^{2}$
in figure 6(d) (the dashed line is plotted using the expression for the full curve
 $\lambda _m^{2} = g[(\delta _{m}/(\delta _{m} + 2 Z_c^{\ast} )) U_{0}^{2}/U_{e c}^{2}]$
, where
 $g[\dots]$
is the inverse of
 $f(\lambda _m^{2}) = 2\lambda _m^{2} +\lambda _m^{-4} -3$
). This vertical impact result proves a linear scaling relationship between the maximum spreading ratio
 $\lambda _m$
and the Mach number
 $Ma$
. Building on prior studies, Belden et al. (Reference Belden, Hurd, Jandron, Bower and Truscott2016) demonstrated a soft sphere (approximately 500 Pa) in obliquely impacting water, showing that for shallow impacts (
 $11.5^{\circ}$
),
 $ \lambda _m$
is approximately proportional to
 $ Ma^{2/3}$
, while for deep impacts (
 $ 47^{\circ}$
),
 $ \lambda _m$
is approximately proportional to
 $ Ma^{5/6}$
. The linear relationship reveals critical limit scaling behaviour as the impact angle approaches vertical. It is noted that the rebound of hydrogel spheres occurs in the region defined by
 $U_{ec}^{2}/U_{0}^{2} \lt 10^{-2}$
, which represents an extended parameter region that has not been previously investigated.
Turning back to the spreading diameter, we measure the time evolution of the sphere diameter
 $d$
with varying
 $Y$
under fixed
 $U_{0}$
, as shown in figure 7(a). The experimental data capture the spreading behaviour of hydrogel spheres in three types of motion for clarity. All curves exhibit expansion–retraction behaviour, with the time to reach
 $d_m$
decreasing significantly as
 $Y$
increases. The spreading dynamics can be treated as that of a one-dimensional harmonic oscillator. The equivalent stiffness coefficient
 $ K$
of the hydrogel sphere is derived by equating the spring potential energy
 $K\lambda _m^{2}/2$
to the sum of the elastic and capillary energies. Under the condition
 $\lambda _m \gg 1$
, we obtain
 \begin{equation} K=\frac {\pi }{\xi } \left(\gamma +\frac { G_0D_{0}}{3}\right). \end{equation}
Dimensionless spreading diameter of hydrogel spheres: (a)
 $\lambda$
versus time and (b)
 $\hat {\lambda }=d/d_{m}$
versus the dimensionless time
 $\hat {t}=\omega t$
. (c) The measured spreading time
 $\tau _m$
versus the theoretical scaling
 $\sqrt {\xi } D_{0}/U_{ec}$
.

This effective stiffness combines contributions from bulk elasticity and surface tension. From the conservation of total energy
 $m\dot {\lambda }^{2}+K\lambda ^{2}=K\lambda _m^{2}$
, it can be inferred that at any moment, the normalised spreading and contracting diameter
 $\lambda =d/D_{0}$
of the hydrogel sphere is
 \begin{equation} \lambda =\lambda _{m}\sin(\omega t+\varTheta ), \end{equation}
where
 $\omega =\sqrt {K/m}$
is the oscillation frequency and
 $\varTheta = \arcsin (1/\lambda _m)$
is the initial phase. Equation (4.6) reduces to a dimensionless form
 $\hat {t}$
when time is normalised by
 $\omega t$
, and
 $\hat {\lambda }=d/d_{m}$
. Applying the same rescaling to experimental data yields agreement between measurements and theoretical predictions during the first quarter-period, as illustrated in figure 7(b). Weak deviations emerge in the subsequent quarter-period during sphere retraction, which originates in viscous dissipation between the hydrogel sphere and surrounding liquid, or inherent viscous dissipation. The temporal evolution of the spreading diameter establishes the foundational framework for calculating the wetted area
 $A$
.
In addition to the maximum spreading diameter, we quantified the spreading time
 $\tau _{\textrm {m}}$
, defined as the time interval from the initial impact to the maximal deformation reached, which is plotted in figure 7(c). The measured
 $\tau _{\textrm {m}}$
corresponds to one-quarter of its oscillation period, consistent with the theoretical scaling of the oscillation period
 $ T=2\pi /\omega =\sqrt {2\xi }\pi D_{0}/U_{ec}$
. The time scale is discussed in § 5.
4.2. Cavity evolution modelling
The impact generates an axisymmetric air cavity that expands radially before collapsing. Figure 8 illustrates the cavity evolution in
 $T/2$
oscillation time for three distinct
 $Y$
at
 $U_{0}$
= 2.0 m s−1. During cavity expansion, the strong hydrophilic hydrogel promotes coalescence between the sphere’s base and the advancing cavity interface, thereby exerting a nearly uniform surface force on the cavity. This leads to the cavity geometry approaching a state where the diameter becomes approximately equal to the depth prior to collapse.
Snapshots from the entry of hydrogel spheres onto water, for three different values of the Young’s modulus, namely (a)
 $1000$
Pa, (b)
 $350$
Pa and (c)
 $50$
Pa, for the same impact velocity
 $U_{0} = 2$
m s−1. The red semicircle represents the cavity profile predicted by potential flow theory. Each row represents five consecutive snapshots of an impact, where the leftmost column illustrates the moment of initial contact between the hydrogel sphere and the liquid,
 $t=0$
. The subsequent snapshots correspond to
 $t=T/8$
,
 $t=T/4$
,
 $t=3T/8$
and
 $t=T/2$
. Here,
 $T$
is the oscillation period of a hydrogel sphere, that is,
 $T= 2\pi /\omega =\sqrt {2\xi }\pi D_{0}/U_{ec}$
.

To systematically investigate the interplay between hydrogel dynamics and cavity collapse, we quantify the pinch-off depth
 $Z_{p}$
and pinch-off time
 $\tau _{p}$
of the cavity using the methodology outlined in Speirs et al. (Reference Speirs, Mansoor, Belden and Truscott2019). Here,
 $Z_{p}$
is defined as the distance from the undisturbed free surface to the location where the cavity walls collapse, while
 $\tau _{p}$
represents the time from impact to the pinch-off event. In the quasi-static regime of the cavity,
 $Z_{p}$
increases with the Weber number
 $We$
, while remaining bounded below
 $3D_{0}$
. All values of
 $Z_{p}$
resulting from impacts on cavities with varying
 $Y$
lie within this range, demonstrating a remarkable insensitivity to elasticity, as illustrated in figure 9(a). The observed spread in
 $Z_{p}$
originates from the combined effects of initial conditions, including
 $Y$
,
 $D_{0}$
,
 $U_{0}$
and
 $\eta$
. While, the normalised pinch-off time
 $ \tau _p/\tau _c$
(where
 $ \tau _c$
is derived in § 5) reveals a more complex dependence, exhibiting exponential growth with
 $ We$
while maintaining distinct stratification by
 $ Y$
. These observations highlight the dominant role of
 $ Me$
in governing cavity collapse dynamics, particularly in the formation of nested matryoshka cavities, which are related to sphere rebound. The complete explanation of these coupled phenomena is developed in § 5.
The normalised (a) pinch depth
 $Z_p/D_{0}$
and (b) pinch time
 $\tau _p/\tau _c$
of the cavity are plotted against
 $We$
for the impact of hydrogel spheres with different Young’s moduli
 $Y$
. The measurement methodology is outlined in Speirs et al. (Reference Speirs, Mansoor, Belden and Truscott2019).

Now, we proceed by developing a theoretical description of the cavity evolution. As mentioned in § 3, the pressure is related to the velocity field through the unsteady Bernoulli equation
 $(\partial \phi /\partial t)+(1/2)|{\textbf{u}}|^{2}+(p+\rho _w {\textbf{g}}\cdot {\textbf{z}})/\rho _w=Q$
for inviscid flow. For any point
 $ A$
within the cavity at an arbitrary moment, and any point
 $ B$
at the initial moment, as plotted in figure 1(c), integrating the Bernoulli equation yields the following result:
 \begin{equation} \left[ \frac {\partial \phi }{\partial t}+\frac {|{\textbf{u}}|^{2}}{2}+\frac {p+\rho _w {\textbf{g}}\cdot {\textbf{z}}}{\rho _w}\right]_A^B=0 . \end{equation}
At the free surface, the conditions
 $ {\textbf{u}}_B = 0$
and
 $ {\textbf{z}}_B = 0$
are satisfied. Additionally, according to the inequality of pressures across the liquid interface, as described by the Young–Laplace equation, it follows that
 $ p_A - p_B = 2\gamma /R$
, where
 $ R(\theta ,t)$
represents the radius determining the location of the interface at time
 $ t$
in the direction
 $ \theta$
. Hence, (4.7) takes the form
 \begin{equation} \rho _w\frac {\partial \phi }{\partial t}\Big |_A +\rho _w\frac {|{\textbf{u}}_A|^{2}}{2}+\rho _w gz_A+ \frac {2\gamma }{R}=0 .\end{equation}
Initially, the cavity exhibits isotropy with
 $\partial /\partial r\gg \partial /\partial \theta$
, and
 $ \partial /\partial z = 0$
. Mass conservation implies
 $ \partial (r^{2} u_r)/\partial r = 0$
, which yields
 $ u_r ={(R/r)}^{2} \dot {R}$
and
 $ \phi (r,t) = -{R^{2}\dot {R}}/r$
. Incorporating these equations into the differential equation governing cavity dynamics, derived from (4.8):
 \begin{equation} R\ddot {R}+\frac {3}{2}\dot {R}^{2}+gR\sin\theta +\frac {2\gamma }{\rho R}=0. \end{equation}
By integrating the aforementioned equation, we obtain
 \begin{equation} \rho R^{3}\dot {R}^{2}+\frac {1}{2}\rho _w gR^{4}\sin\theta +2\gamma R^{2}=E_{0}. \end{equation}
In this formulation,
 $ E_0$
represents the integration constant, typically determined by the initial condition
 $ \dot {R}(t=0)$
. For solid water entry problems, when the sphere’s motion is decoupled from cavity evolution,
 $ \dot {R}(t=0) = 0$
is used (Duclaux et al. Reference Duclaux, Caillé, Duez, Ybert, Bocquet and Clanet2007). However, when the interaction between sphere dynamics and the cavity is coupled (Aristoff & Bush Reference Aristoff and Bush2009; Aristoff et al. Reference Aristoff, Truscott, Techet and Bush2010), the instantaneous velocity of the sphere is generally required. In our case, the energy allocated to cavity evolution is
 $ E_s$
, as described in § 4, thereby defining the integration constant as
 $ E_0 = E_s$
. Additionally, taking
 $ Z_{p}$
as the characteristic length scale, scaling arguments demonstrate that gravitational potential and surface tension energies are negligible. This simplification yields
 $R^{3} \dot {R}^{2} = E_s/\rho _w$
, leading to
 \begin{equation} R(t) = \left (\frac {5}{2} \sqrt {\frac {E_s}{\rho _w}} t \right )^{2/5}. \end{equation}
A similar power law with
 $t$
for cavity evolution was derived in previous studies (Taylor Reference Taylor1950; Duclaux et al. Reference Duclaux, Caillé, Duez, Ybert, Bocquet and Clanet2007; Aristoff & Bush Reference Aristoff and Bush2009; Benusiglio, Quéré & Clanet Reference Benusiglio, Quéré and Clanet2014).
The evolution of (a) the cavity radius
 $R$
and (b) the velocity at the bottom of the cavity
 $\dot {R}$
, (c) log–log plot of the cavity radius
 $R$
and (d) normalised cavity radius
 $\hat {R}$
plotted versus time. The circles represent experimental results and the solid lines are the theoretical predictions by
 $R=(5/2\sqrt {{E_s}/{\rho _w}}t)^{{2}/{5}}$
in (a),
 $U=\dot {R}$
in (b) and
 $\hat {R}=R/(5/2\sqrt {{E_s}/{\rho _w}})^{{2}/{5}}$
in (d). Note that the extended dataset has been included in (c,d), and the same symbols legend of (d) is shared by the other panels.

Figure 10(a,b) illustrates the temporal evolution of cavity radius
 $ R$
and velocity
 $ \dot {R}$
for varying
 $ U_{0}$
. Further analysis of figure 10(a) in log–log coordinates reveals a characteristic slope of
 $ 2/5$
, confirming the universal scaling
 $ R \propto t^{2/5}$
, as shown in figure 10(b). To generalise these results, we normalise the cavity radius as
 $\hat {R}=R/(5/2\sqrt {{E_s}/{\rho _w}})^{{2}/{5}}$
. Remarkably, this normalisation collapses all data spanning diverse
 $Y$
,
 $ U_{0}$
and
 $D_{0}$
onto a single
 $ t^{2/5}$
master curve. These results provide the expression of
 $ \dot {R}$
required to model the hydrodynamic forces.
5. Prediction of regime transition
Rebounding of the hydrogel sphere is a counterintuitive phenomenon for vertical water impact since
 $\rho \gt 1$
. While solid sphere water entry typically involves superhydrophobic surfaces, hydrophilic spheres with a contact angle
 $ \sim 90^{\circ}$
require
 $ We\lt 1$
and
 $Bo \lt 0.5$
for rebound (Speirs et al. Reference Speirs, Mansoor, Belden and Truscott2019). Recent numerical and experimental studies on skipping and rebounding of deformable spheres reveal that elastic deformation energy increases the critical rebound angle to
 $47^{\circ}$
, demonstrating that traditional parameters, such as
 $We$
,
 $Bo$
and wettability, cannot fully predict rebound dynamics alone (Belden et al. Reference Belden, Hurd, Jandron, Bower and Truscott2016). This necessitates the introduction of new dimensionless groups
 $Ma$
or
 $Me$
to characterise the role of deformability in phase space.
Theoretically, vertical rebound becomes feasible when the sphere’s shear modulus satisfies
 $ G \approx \gamma /D_{0}$
. For a 4 mm sphere with density ratio
 $ \rho = 1$
, this criterion requires shear modulus
 $ G \lt 20$
Pa. Our experiments demonstrate that even hydrophilic hydrogel spheres with
 $ G \sim 100$
Pa still achieve vertical rebound. To understand the mechanism behind this, we revisit the force balance (3.4) governing sphere dynamics during impact.
With measured
 $\lambda$
, integrating over
 $T$
yields the equivalent wetted area
 $A=\pi \bar {\lambda }^{2}/4 = \pi (\int _{0}^{T/2}\lambda {\rm d}t/T)^{2}=(1/\pi ) D_{0}^{2} \lambda _{m}^{2}$
. Additionally, the centroid velocity of sphere
 $ U$
converges to the cavity evolution rate
 $ \dot {R}$
when the velocity difference induced by hydrogel deformation is negligible, given by
 $U=2/5(5/2\sqrt {{E_s}/{\rho _w}})^{{2}/{5}}t^{-{3}/{5}}$
. The last piece is the drag coefficient
 $C_D$
, as determined by
 $ C_D = 18.5/Re^{0.5}$
(MotMottt, Noor & Aziz Reference MotMottt, Noor and Aziz2006), considering that
 $ Re$
ranges from
 $2.4\times 10^{2}$
to
 $2.5\times 10^{4}$
in our experiment.
Based on the analysis by Hurd et al. (Reference Hurd, Belden, Jandron, Fanning, Bower and Truscott2017), we also define the characteristic acceleration as
 $(U_2 - U_{0})/T = \Delta U/T$
, where
 ${U}_2$
represents the velocity of the sphere’s centre of mass after one oscillation period. Substituting these physical quantities back into (3.4), the velocity difference after a completed oscillation period can be obtained by integrating (3.4) over
 $ T$
. This allows us to reformulate as
 \begin{equation} \frac {U_{0}-U_2}{U_{0}}=\frac {3\sqrt {2}}{32}\rho C_{D}\xi ^{3/2} Me^{3} . \end{equation}
The critical rebound occurs at
 $U_2=0$
. Having pieced all the puzzles together, we can derive the critical transition curve
 $ (Y, U_{0})$
for sinking and suspension:
 \begin{equation} Y+{9\gamma }/{D_{0}}=a_1\left(\frac {C_{D}}{\rho }\right)^{2/3} U_{0}^{2}, \end{equation}
where
 $a_1=3({3\sqrt {2}}/{32})^{2/3}\rho _s\xi$
. The final theoretical curve from (5.2) is shown in figure 4, which qualitatively captures all experimental observations and successfully predicts the transition from ‘sinking’ to ‘suspension’.
Let
 $ U_{{min}}$
denote the minimum critical impact velocity required to suspend the sphere, which is determined by solving the critical motion equation (5.2). Given measurable properties of the hydrogel sphere and fluid, this equation yields the critical impact velocity
 $ U_{0}$
, which corresponds to
 $ U_{{min}}$
. In the limiting analysis of Belden et al. (Reference Belden, Hurd, Jandron, Bower and Truscott2016),
 $ U_{{min}}$
for horizontal impacts follows a lower bound proportional to
 $ Y^{1/5}$
. In contrast, for deep impacts at an angle of
 $ 47^{\circ}$
,
 $ U_{{min}}$
scales with
 $ Y^{5/22}$
. Our experimental and theoretical results provide insight into the critical upper bound for the rebound of an elastic sphere during vertical water entry, suggesting that
 $ U_{{min}}$
in this case is related to
 $ Y^{1/2}$
. Given that
 $ U_{{min}}$
is the characteristic velocity and
 $ 2D_{0}/\tau _c^{2}$
is the characteristic acceleration, (3.4) can be estimated as
 \begin{equation} \frac {2 D_{0}}{\tau _c^{2}} \approx \frac {3 C_D U_{0}^{2} \lambda _m^{2}}{\pi ^{2} D_{0} \rho }. \end{equation}
Therefore, the inertial time scale is given by
 $\tau _c= (\pi D_{0}/U_{0} \lambda _m)\sqrt {2\rho /3C_D}$
. The oscillation time of the sphere is given by
 $\tau _w = \pi /2 \sqrt {K/\rho _s V} = (\sqrt {\xi } \pi D_{0})/(2\sqrt {2} U_{ec})$
. The ratio between them is
 \begin{equation} \frac {\tau _{w}}{\tau _{c}}=\frac {\xi }{4}\sqrt {\frac {3C_D}{2\rho }}\frac {U_{0}^{2}}{U_{ec}^{2}}. \end{equation}
Equation (5.4) exhibits that the time-scale ratio is related to
 $(U_{0}/U_{ec})^{2}$
. Belden et al. (Reference Belden, Hurd, Jandron, Bower and Truscott2016) proposed that the critical time scale is
 $\tau _w/\tau _c \sim U_{0}/U_{ec}$
for a shallow impact angle, and
 $\tau _w/\tau _c \sim (U_{0}/U_{ec})^{11/6}$
for a steep impact angle of
 $47^{\circ}$
. Our results, once again, reveal an upper bound, given by
 $\tau _{w}/ \tau _{c} \sim (U_{0}/U_{ec})^{2}$
. The experimental and theoretical results, as shown in figure 11, explain the rebounding mechanism in the vertical water entry.
Ratio of the (a) sphere oscillation time
 $\tau _w = \sqrt {\xi }\pi D_{0}/(2\sqrt {2}U_{ec})$
to inertial time
 $\tau _c = (\pi D_{0}/U_{0}\lambda _m)\sqrt {2\rho /3C_D}$
and (b) cavity pinch time
 $\tau _p$
to sphere inertial time
 $\tau _c$
versus the elastocapillary Mach number
 $U_{0}/U_{ec}$
. Note that the extended dataset from figure 9 has been used to create this plot, using the same symbols. The symbols denote experimentally measured ratios of (a) sphere spreading time
 $\tau _m$
(with
 $\tau _m$
values extracted from figure 7
c) and (b) cavity pinch time
 $\tau _p$
to
 $\tau _c$
(where
 $\tau _p$
data are taken from figure 9
b). In (a), the dashed lines delineate the theoretical bounds for the drag coefficient
 $C_D$
, encompassing variations in
 $D_{0}$
,
 $U_{0}$
and
 $\eta$
. The inset of (a) shows
 $\sqrt {\xi }$
as a function of
 $U_{0}$
.

More significantly, our observations indicate that the ratio of the spreading time to the impact duration is a critical parameter that determines whether sinking occurs. Returning to the spreading time
 $\tau _{m}$
presented in figure 7(c), we compare the measured
 $\tau _{m}$
with the theoretical oscillation time
 $\tau _{w}$
for a hydrogel sphere with varying
 $Y$
, which is equal to one-quarter of the oscillation period of the hydrogel sphere.
The dimensionless ratio
 $\tau _w/\tau _c$
exhibits a linear correlation across all experimental data. A distinct threshold emerges at
 $\tau _{w}/\tau _{c} \approx 1$
, indicated by a horizontal dashed line, which separates sinking and suspension, as shown in figure 11(a). Here,
 $\tau _{w}$
characterises the horizontal spreading time scale, while
 $\tau _{c}$
represents the vertical motion time scale (Richard & Quéré Reference Richard and Quéré2000). When
 $\tau _{w} \gt \tau _{c}$
, the impact energy predominantly converts into horizontal oscillations, excluding rebound behaviour. Furthermore,
 $\tau _{w}$
corresponds to the time required for circumferential elastic waves to propagate to the air–water interface. The matryoshka phenomenon manifests when the total contact time
 $\tau _{c}$
exceeds this wave propagation time
 $\tau _{w}$
(Belden et al. Reference Belden, Hurd, Jandron, Bower and Truscott2016). In this case, sphere vibrations interact with water through the matryoshka cavity, significantly decreasing bouncing efficiency.
Regarding the dimensionless ratio
 $\tau _p/\tau _c$
, as shown in figure 11(b), rebound becomes possible only when
 $\tau _c \approx \tau _p$
(Aristoff et al. Reference Aristoff, Truscott, Techet and Bush2010) in solid sphere entry, indicating strong coupling between sphere dynamics and cavity evolution. Our vertical impact experiments demonstrate that
 $\tau _p/\tau _c = 5$
serves as the critical threshold separating sinking and suspension regimes. Both oscillation time and cavity collapse time effectively characterise the liquid response, with these critical ratios highlighting the strongly coupled nature of hydrogel–liquid interactions.
We further plot
 $\sqrt {\xi }$
as a function of
 $U_{0}$
in figure 11(a) for different diameters, which shows that
 $\xi$
is nearly constant with increasing impact velocity as the prefactor in (5.2), as well as in the energy distribution relation. Interestingly, it shows that the distribution of initial kinetic energy to the surface energy is a constant value regardless of the control parameters, and this conclusion can be potentially extended to other impact problems with deformable projectiles.
6. Conclusion
In this study, we have introduced and characterised an intriguing rebounding phenomenon observed during the vertical water entry of highly deformable hydrogel spheres. This behaviour contrasts with the well-known sinking of rigid or weakly deformable solids and persists even when the density of the hydrogel sphere exceeds that of water. Through systematic experiments and theoretical modelling, we demonstrated that the elastic deformations at the sphere–liquid interface oscillate and inject extra energy that drives the unexpected rebound. Our high-speed imaging captured the complete sequence of events – from initial impact to maximum spreading, cavity formation and eventual rebound. These observations allowed us to quantify the spreading area, cavity depth and deformation dynamics over time. Analysis of the energy distribution revealed that the interplay between elastic energy storage and hydrodynamic drag governs the fate of the sphere after impact.
We showed that the spreading diameter evolves analogously to a one-dimensional harmonic oscillator, driven by impact-induced elastic compression and subsequent recovery. In parallel, the cavity depth evolution follows a potential flow framework, similar to classical water entry problems. Combining these perspectives, we developed a predictive model that provides an expression for
 $Y$
as a function of the impact velocity
 $U_{0}$
, identifying the transition boundary between the ‘sinking’ and ‘rebounding’ regimes. These results highlighted the crucial role of soft material elasticity in controlling water entry results. In particular, the ability to store and release strain energy within a highly deformable sphere offers a mechanical template for energetic activation at fluid interfaces.
From a broader perspective, our energy-based framework could be extended to account for surface tension effects, viscoelasticity and wetting properties. Future studies could generalise these insights to more complex soft materials, such as gels with anisotropic stiffness, liquid-filled capsules or soft composites. Moreover, exploring oblique impacts, structured surfaces and multi-sphere interactions could further enrich our understanding of soft matter dynamics at fluid interfaces, with implications for environmental processes, biological propulsion and next-generation soft materials design.
Supplementary movies
Supplementary movies are available at https://doi.org/10.1017/jfm.2025.10207.
Acknowledgements
X.Y. wishes to thank X. Zheng, D. van der Meer and J. Zhang for their invaluable support and help.
Funding
The authors acknowledge the financial support of the National Natural Science Foundation of China (nos. 12172156, 12472411, 11872029), National Key R&D Program of China (no. 2023YFF0717200), Ministry of Education and the Fundamental Research Funds for the Central Universities (lzujbky-2024–0y09).
Declaration of interests
The authors report no conflict of interest.