

INTRODUCTION
Under ordinary circumstances, migration of citizens within their home country is not cause for attention from national politicians. However, the Great Migration was extraordinary and did affect politics. Abnormal forces—ranging from boll weevil outbreaks and a struggling Southern economy to the search for a life free from discrimination—drove masses of Black people out of the South. From the turn of the twentieth century through the 1960s, more than six million Black Americans migrated to cities throughout the North in search of economic opportunity and freedom from racial subjugation. In the South, Black Americans faced unique discrimination when attempting to vote. There were legal challenges, like White primaries and literacy tests, as well as extra-legal challenges like violence and intimidation. Once in the North, they could participate in ways that would not become possible for their Southern counterparts until the Voting Rights Act of 1965. This development in Black American political enfranchisement was consequential for the political parties, particularly the Democratic Party, in ways that warrant additional scholarly attention.
The primary goal of this article is to contribute to the party change literature in American politics by highlighting the significance of the Great Migration to the story of Democratic Party change. I argue that Democrats’ compromised electoral position in the post-war period— coupled with growth of the Black population through the Great Migration—led them to recognize Black voters as a potential lifeline. The Democratic Party earned fewer popular and Electoral College votes in each election from 1936 until 1960. Democratic Party elites were acutely aware of the demographic changes caused by the Great Migration during the period. Along with other informed observers, they thought of the migrants as the potential balance of power in elections. Therefore, they strategized to position candidates in ways that would to secure electoral support from Northern Black voters. The posturing and outreach manifested in a number of ways, including specific outreach to Northern Black voters during elections and promises that Democrats would take liberal positions on civil rights issues.
The central argument of this work is that the Great Migration changed the way Democratic Party elites interacted with Black communities. My argument consists of four premises. First, Black Americans moved out of the South into North through the Great Migration. In many instances, they settled in large urban areas. Second, The Great Migration effectively created a new pool of eligible voters. The migration changed Black Americans’ ability to participate in politics because many barriers to participation in the South did not exist in the North. Third, White politicians came to believe that Black voters could help them reach their electoral goals. In cities, the Black voting bloc might help politicians win factional disputes during primary elections or become an important coalition partner for general elections. Finally, because of White politicians’ belief that Black voters were important, they changed their campaign strategies and positions to manage Black support. In many instances, this meant posturing to secure Black votes. Sometimes, this meant working to suppress Black participation. Therefore, the Great Migration is among the factors leading to twentieth century changes in the Democratic Party.
Another part of describing Democratic politicians’ beliefs about the importance of Northern Black voters is assessing the plausibility of the frequent assumption that Black voters were the balance of power in elections. The logic behind the balance of power idea is that when elections are close, Black voters have the potential to determine the electoral outcomes. This is especially true particularly if/when the White electorate is evenly divided. Since Reconstruction, when Black Americans first gained the ability to vote, political observers have described the Black electorate as the potential balance of power in important elections (Bunche Reference Bunche and Johnson1973; Du Bois Reference Du Bois1912; Moon Reference Moon1948, 1956; Nowlin Reference Nowlin1931; Tatum Reference Tatum1953). Particularly important to this work is that White politicians often believed that Black voters were the balance of power and described them as such in their language about party strategy. Throughout the article I will refer to Black voters as the balance of power in keeping with the strategic discussions of the time.
Henry Lee Moon (Reference Moon1948) and Ronald Walters (Reference Walters1988) tested the idea of Black voters as the balance of power by calculating the potential significance of the Black vote for presidential elections in the 1940s and 1990s. I build on Moon’s and Walters’ work by extending the period of interest to investigate whether Black voters were the balance of power during the second wave of the Great Migration, which includes the period from 1948–1964. In the next section, I describe the political situation of the Democratic Party in the years before 1948 to assert that the Democratic Party was interested in seeking new coalition partners. Further, the Great Migration presented the Party with an opportunity to build partnerships with Black voters.
In what follows, I briefly describe the Great Migration and situate my work in the American political party change literature. Then, I describe Democratic party instability in the post-war period. Next, I consider why politicians believed that the Great Migration had positioned Black voters as a potential balance of power in California, Illinois, Michigan, New York, and Pennsylvania. I examine the idea of Black Americans as the balance of power in elections to explain politicians’ assumptions that there were enough of them in these large Electoral College states to influence the outcome of elections from 1948–1960.Footnote 1 Finally, I describe presidential candidates’ interaction with Black voters during election campaigns from 1948–1960.
THE GREAT MIGRATION
The Great Migration occurred in the United States of America from 1915–1970, moving more than six million Black Americans out of the South in search of jobs and racial equality. They mostly followed specific migration streams from the southern locations where they lived. For example, Mississippians went to Chicago, Floridians to New York, and Louisianans to California. The migration occurred in two waves: the first from about 1915–1930 and the second from about 1940 through the 1960s.
In first wave of migration, problems with the cotton economy pushed Black Americans out of the South. The system of sharecropping that existed after slavery prevented most Black farmers from profiting from their work. Natural forces that destroyed crops and profit potentials—particularly the boll weevil—exacerbated the problems of the sharecropping system. The second wave of the migration was born of opportunities for employment in Northern defense industries. Reports of high paying jobs and the potential to build a life for themselves that would look different from what they could attain in the South drew migrants to the North.
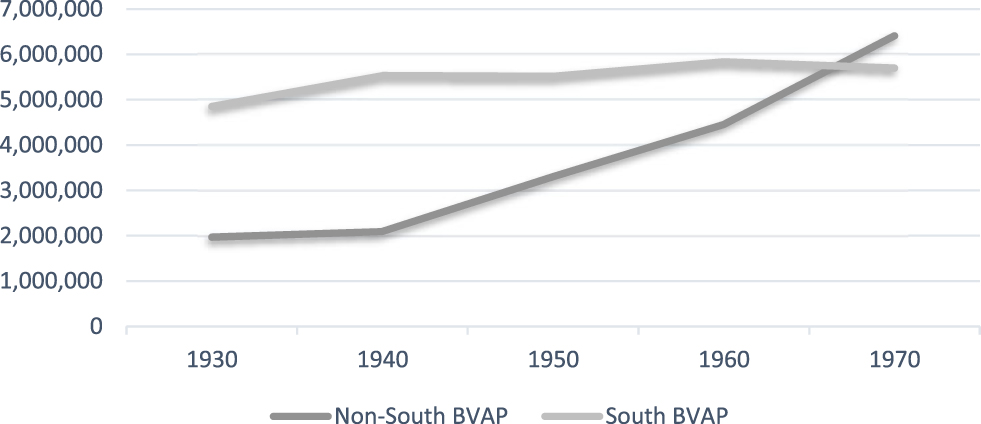
Black Voting Age Population in the South and Non-South, 1930–1970.
Source: Detailed Charateristics of the Population. US Census. 1930–1970.

Better pay was not the only benefit of leaving the South. Another notable difference was Black Americans’ ability to participate in politics. Before the migration, the national Black voting age population (BVAP) was effectively limited to the number of Black people living in the North. In the South, they faced a host of legal and extra-legal challenges when attempting to exercise their political rights. Although the total BVAP was nearly 6.8 million in 1930, the Northern BVAP was only 1.9 million at that time. Just by virtue of their residence in the South, approximately 4.8 million Black voters were shut out of the 1932 presidential election. Migrants’ access to politics and political participation evolved as the migration continued. By the time the Voting Rights Act of 1965 passed, about half of the Black population already had access to political participation based on their residence in the North. Figure 1 illustrates the change in the distribution of Black voters during the period of interest.
PARTY CHANGE IN AMERICAN POLITICS
Recent scholarship has reconsidered key parts of the dominant narrative on change in the Democratic Party during the twentieth century, including the rate, timing, and level of change. By Edward Carmines and James Stimson’s (1983) account, Democratic Party change was top-down and occurred quickly as members of Congress became more liberal on racial issues in the 1960s. Revisionists argue that change occurred slowly, beginning in the 1930s and lasting through the 1960s, rather than happening at a critical moment in the 1960s (Karol 2005; Schickler Reference Schickler2016). Further, revisionists argue that Democratic Party change on racial issues began with politicians and political parties at the sub-national level instead of beginning with national party organizations and presidential candidates (Chen 2004; Pearson et al., 2008). Although newer scholarship has been helpful to clarify our collective understanding of the period, the addition of more writing that considers the role of the Black people in shaping party change would strengthen the literature. For example, Schickler (Reference Schickler2016) describes how Robert Vann—editor of the Pittsburgh Courier—worked with Democratic elites to draw attention to Black voters as potential allies.Footnote 2 Also necessary is additional focus on the demographic changes of the period and the importance of voters at the mass level.
Although demography is not a dominant concern of the party change literature, some scholars have written about how it influences party development (Converse 1966; Frendris Reference Frendreis1989). For example, Earl and Merle Black (Reference Black and Black2002) partially attribute the growth of the Republican Party in the South to the in-migration of White Northerners. Less scholarship exists that describes the role of Northward migration in shaping politics in that region. By extension, very little is specifically concerned with the significant effect of Black migration on American political parties. Nevertheless, the Great Migration is an important demographic consideration in the story of twentieth century party change because Black Americans’ move to the North led to an expansion of the electorate and the changes in the population of eligible voters impacted the ways that politicians strategized about winning elections.
Until recently, party scholars tended to focus on elite actors when writing about Democratic Party change on racial issues during the twentieth century.Footnote 3 This stems, in part, from the lack of available individual-level data about Black Americans.Footnote 4 The result is that discussion of the Great Migration—or the masses of Black voters who grew as a percentage of Northern electorates—is present in party change texts but usually limited.Footnote 5 Still, the Great Migration facilitated the resettlement of millions of new, first-time voters in Northern states with strategic political importance. The goal of this work is to highlight the Black masses in the revised narrative by describing how their migration led to changes in Northern party elites’ beliefs about Black voters’ political power and, by extension, their behavior and response to these voters.
METHODOLOGICAL APPROACH
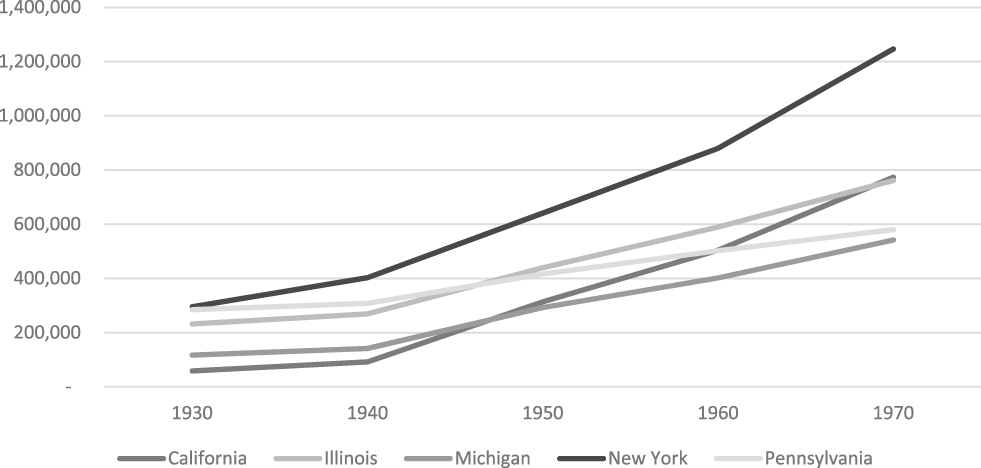
I focus on presidential election results in five states from 1948–1960 to consider how changes in party electoral fortunes and the demographic composition of Northern states may have motivated Democratic politicians to modify their interactions with Black voters. Although Black Americans’ exodus from the South impacted all areas of the nation, it was very pronounced in large, industrial states. I chose the five states under consideration here—California, Illinois, Michigan, New York, and Pennsylvania—because they experienced tremendous growth as a result of the Great Migration and were important to Democratic Party strategy.Footnote 6 During the period of interest, the Black population in these states doubled. The population growth is more profound when looking at the some of the states individually. For example, California experienced the greatest increase during this period, with a 737% growth in the Black population from 1940 to 1970. Michigan and New York had increases of more than 200%, while Illinois increased by 182% and Pennsylvania increased by 88%.
An important contribution of this work is describing how Democratic Party elites responded to the growth of the Black voting population in the North. To get a real-time account of party strategy and reaction to changes in the environment, I used the ProQuest Historical Newspapers database to find relevant articles in The New York Times, Washington Post, and Chicago Defender newspapers. ProQuest was also a useful source for files from the National Association for the Advancement of Colored People (NAACP). Archival data from the John F. Kennedy and Lyndon B. Johnson presidential libraries provided insight about the priorities of these presidential candidates as they sought to win re-election campaigns. Finally, this work builds on the scholarship of other political scientists and historians who have written about the Great Migration, its impact on cities, and change in the Democratic Party during the twentieth century. A large number of secondary sources were helpful to provide supplementary information and context.
DEMOCRATIC MOTIVATIONS FOR SEEKING BLACK VOTES
In 1932, after a three-term losing streak, Democrats regained the presidency with the election of Franklin D. Roosevelt (FDR), who won re-election by large majorities in 1936. However, it became increasingly difficult for the Democratic Party—which meant different things to different people—to hold together a majority. The 1940 election was the beginning of a downward trend in Democratic Party fortunes that lasted throughout the decade, led to losses in the 1950s, and created tremendous uncertainty in the party for the 1960s. Below, I examine the increasing competition in the popular and Electoral College votes to argue that Democrat’s vulnerable position would have driven them to seek support from Black voters.
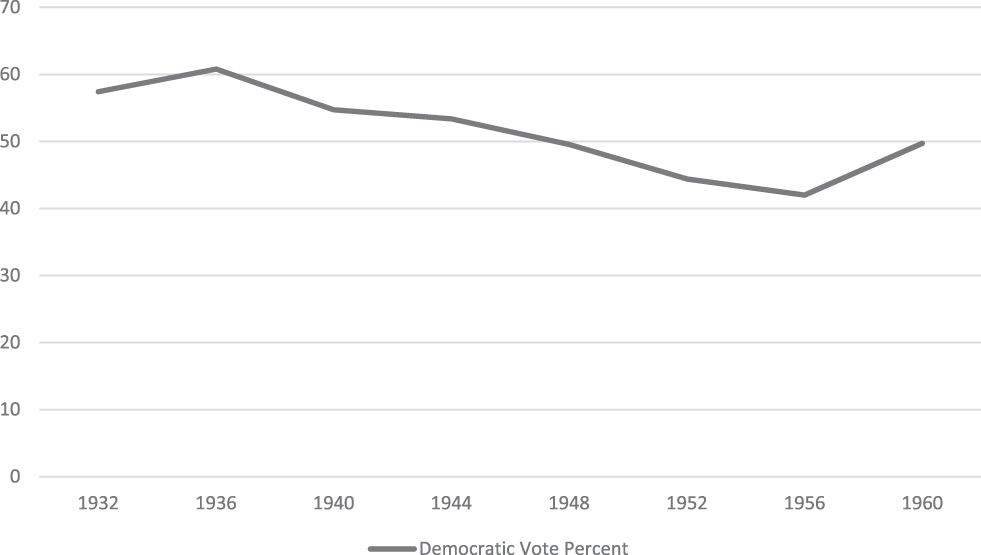
Although Democrats were winning elections from 1932–1948, their national margins of victory were decreasing over time. The height of Democratic support was in 1936, when FDR earned 60.8% of the popular vote. In the next election, Roosevelt’s popular vote majority declined for the first time since he took office to 54.7%. The trend continued in the 1944 election, when the Roosevelt/Truman ticket won with 53.4% of the popular vote. The 1948 election was almost too close to call, with Democrats barely winning the presidency—getting only 49.6% of the national popular vote.
National democratic popular Vote Percentage: 1932–1960.
Source: Gerhard peters and John T. Woolley, The Presidency Project, University of Califronia, Santa Barbara.

The five states under consideration here followed a pattern similar to the nation as a whole. In each of the states, Democrats won high levels of support in the 1936 elections. However, support for Democrats declined in the 1930s and 1940s and reached low points at various times during the period. In California, the low point was 1952. For Illinois, New York, and Pennsylvania, it was 1956. Support for Democrats was equally low in Michigan for the 1952 and 1956 elections. The Party rebounded in each of the states for the 1960 election.
Of additional importance to analysis of the popular vote is the competitive nature of the elections in the large Electoral College states. In the five states I consider here, the margin of victory was less than ten percentage points in all but one election between 1948 and 1960. If we separately consider each election contest by state, ten of the elections a had margin of victory that was five percentage points or less. In short, Democrats were simultaneously facing two significant problems that made it necessary to seek new coalition partners: very competitive elections and a decrease in the overall share of popular votes.
Black Voting Age Population in Large Electoral College States: 1930–1970.
Source: Detailed Charateristics of the Population. US Census. 1930–1970.

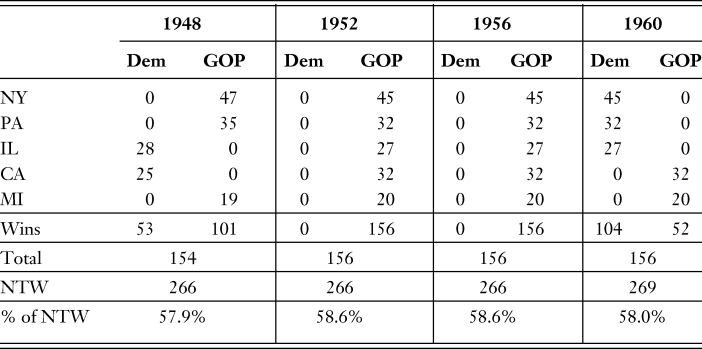
The Electoral College results reflected the Democratic Party’s popular vote problems. They struggled in the states with large Electoral College delegations, which absorbed the bulk of participants in the Great Migration.Footnote 7 Black voters’ swelling proportion in Northern populations contributed to their importance in Electoral College politics. From 1948–1956, presidential candidates needed 266 Electoral College votes to win the election. The number increased to 269 in 1960. Over the entire period, the five states under study here controlled nearly 60% of the Electoral College votes needed to win the presidency.Footnote 8 The prevailing notions that a presidential candidate could win the election by focusing on voter engagement and turnout in these states made Black voters central to campaign strategy. Black voters’ position as an integral part of vote counting and coalition building for the parties grew as they flooded into these states. The Great Migration presented Democrats with an opportunity to court a new group of voters.
Electoral College Situation, Large Electoral College States. NTW: needed to win

The 1948 Presidential Election
Informed observers and insiders predicted that Harry S. Truman would lose the 1948 presidential election campaign and his position as President of the United States. In the fall of 1947, the Rowe/Clifford Memo proposed a solution.Footnote 9 James S. Rowe, political strategist and Democratic ally, described the steps Truman needed to take if he planned to beat the Republican Party in the 1948 election. Rowe advised that the campaign did not need to expend energy in the South. “It is inconceivable that any policies initiated by the Truman Administration no matter how ‘liberal’ could so alienate the South in the next year that it would revolt,” (Rowe and Clifford, 1947, p. 2). Therefore, he counseled, the campaign should focus its efforts on the West. If the Party could secure the South and the West they might be able to withstand losses in the big states (New York, Illinois, New Jersey, Ohio, and Massachusetts).
The memo included a discussion of groups and described “the Negro” as an important consideration. Rowe writes:
A theory of many professional politicians is that the northern Negro not only vote in a bloc but are geographically concentrated in the pivotal, large and closely contested electoral states such as New York, Illinois, Pennsylvania, Ohio and Michigan. This theory may or may not be absolutely true, but it is certainly close enough to the truth to be extremely arguable (Rowe and Clifford, 1947, p. 8).
The memo goes on to caution:
Unless there are new and real efforts (as distinguished from mere political gestures, which are today thoroughly understood and strongly resented by sophisticated Negro leaders), the Negro bloc, which, certainly in Illinois and probably in New York and Ohio, does hold the balance of power, will go Republican” (pp. 8–9, underline in original).
In short, Rowe suggested pursuit of Black votes through espousal of liberal positions on race and economic development. He acknowledged this could cause some problems in the South but advised that those problems could be easily overcome. The Rowe/Clifford memo set the tone for the campaign.
Truman made racially liberal gestures before the 1948 election (Stikoff Reference Sitkoff1971). As President of the United States, he had already publicly supported the Fair Employment Practices Committee (FEPC) in June 1945 and established the Committee on Civil Rights in 1946. The Committee on Civil Rights considered issues like lynching, voting, and discrimination. The result was a report entitled To Secure These Rights, which advocated for federal intervention to solve these issues. When asked about his motivation for establishing the committee, he remarked it was a reaction to violence against Black veterans who were returning from war. As another way to appeal to Black voters, Truman addressed the closing session of the annual conference of the NAACP on June 29, 1947; he was the first sitting president to do so (Gardner Reference Gardner2002).
The Rowe/Clifford memo was wrong about the stability of Southern support for the Democratic Party. Truman’s actions on civil rights garnered backlash from Southern Democrats, who were upset that he was more interested in winning liberal and Black votes than worried about keeping theirs. In response, Southerners worked to recruit a states’ rights candidate for the 1948 election and found General Dwight D. Eisenhower. Despite his popularity, Eisenhower bowed out of the race just before the convention on July 5, 1948.
Truman’s problems with Southern Democrats flowed over into the 1948 Democratic National Convention, which would test the party’s position on civil rights as party leaders battled to determine how their platform would deal with the issue of race. In response, the Truman administration put forward the same civil rights plank they used in 1944. This much milder approach to civil rights was supposed to diminish conflict with the Southern wing of the party while keeping civil rights supporters at bay. The 1944 language was not sufficient for either side of the Democratic Party. Southerners fought for language that was even more mild and equivocal than the previous plank. Big city Democrats had their own reelection and balance of power calculations to consider. They believed Black voters were essential to their coalitions and knew that a tepid civil rights plank would be problematic for local campaigns. The 1948 platform moved forward with a liberal civil rights plank due to quick maneuvering by the liberal wing of the party.Footnote 10
In the general election, Truman was still contending with challenges from both ends of the ideological spectrum within the Democratic Party as well as the Republican Party nominee. On the left, he faced a challenge from Vice President Henry Wallace, who served during FDR’s second term and was popular in the Black community. On the right, Dixiecrats met after the convention and formed the State’s Rights Party. They chose South Carolina governor Strom Thurmond as their presidential candidate. The Republican Party nominee, New York Governor Thomas Dewey, was also popular among Black voters. Republicans hoped to capitalize on Dewey’s popularity by producing a racially liberal platform at their 1948 convention.
The Republican Party’s strong civil rights platform was no match for the sitting President’s ability to reach out to Black voters through government action during the election cycle. On July 26, 1948, Truman passed Executive Orders 9980 and 9981, which outlawed discrimination in federal employment and desegregated the military (Berman Reference Berman1970). As he had promised to do in his acceptance speech for the Democratic Party nomination for president, Truman reconvened the Congress to handle civil rights issues on July 26, 1948. The special session lasted for eleven days and did not produce meaningful civil rights legislation. However, these actions helped his position with Black voters.
By October of 1948, it was clear that the campaign had nearly given up on pleasing the South. They continued to make explicit overtures to win Black votes (Krock Reference Krock1948). For example, Truman traveled to Philadelphia in October to address an all-Black crowd (Leviero Reference Leviero1948). He became the first sitting President to campaign in Harlem and used his speech to describe the work of the Civil Rights Committee and remind attendees of the Executive Orders he implemented that summer. Truman’s final outreach to Black voters and his focus on large states paid off. Although most observers predicted a Democratic loss, Truman beat Republican candidate Thomas Dewey with 49.5% of the popular vote. The election was close, within five points, in nineteen of the twenty states where Truman lost. Black voters were essential to Harry Truman’s victory in 1948.
The 1952 Presidential Election
President Truman announced he would not seek the 1952 Democratic nomination long before the convention and the party had no heir apparent. The Democrats most interested in the presidency represented the extremes of the Party’s ideology. Estes Kefauver, a liberal Senator from Tennessee, represented the liberal wing and took positions on civil rights that made him popular with Black voters. On the other end was Senator Richard Russell, of Georgia, who supported Southern notions of states’ rights. In the center/moderate position was the sitting Vice President, Alben Barkley, a New Deal supporter from Kentucky.
Truman and other Democratic elites encouraged Adlai Stevenson to seek the nomination. The moderate Illinois governor represented an opportunity to build consensus within the party. Although Stevenson took liberal positions on race while governor, he did not support the idea of federal intervention to enforce desegregation (Sitkoff 1981). Despite encouragement from party leaders, Stevenson refused to seek the presidency. He cited his desire to finish his work in Illinois and run for re-election (Johnston Reference Johnston1952). Eventually, Stevenson did become part of the field of candidates who had expressed interest in the Democratic nomination and later became the party’s nominee for the election cycle.
Again, in the lead up to the 1952 election, many informed observers and campaign strategists predicted that Black voters could be the deciding factor. The GOP won the 1948 election by margins of five points or less in some large states. In the four years since, those large states had absorbed the bulk of Black migrants from the South. Democratic politicians believed capitalizing on this expansion of the electorate in large cities could be the key to winning the election. James Reston (Reference Reston1952b) of The New York Times explains the transition:
In short, Democrats having moved far enough to the right to block General Eisenhower’s bid for the South, are now moving cautiously to the left again in order to try to block Republican efforts to cut into the Negro and other minority votes in the large cities (p. E3).
Black voters were taking stock of politicians’ civil rights positions while the Party was trying to move leftward. They promised to vote based on their interests, for candidates who supported civil rights. This awareness and attention to civil rights positions became problematic for Stevenson, who publicly—and repeatedly—stated he did not support federal leadership on civil rights issues.
Stevenson later realized the potential consequences of his states’ rights comment for his ability to garner Black votes in the North. He changed his public position by August of 1952, saying he would use the presidency to lobby for a change in the filibuster rule which could help civil rights legislation. When asked about the possibility of losing Black voters to the Republican Party Stevenson responded, “I can hardly see why the Negro would find any refuge in the Republican Party” (Reston Reference Reston1952a, p. 1). The change in tone had a swift and positive impact on his standing with Black leaders and voters. Afterward, Roy Wilkins of the NAACP endorsed Stevenson for the presidency. The Black media followed suit for their 1952 endorsements, which also helped Stevenson with Black voters in the end.
Republicans also recognized the potential of the Black voting bloc and made appeals for their votes. Liberals in the party—including Henry Cabot Lodge of Massachusetts; Alfred Driscoll of New Jersey; and Irving Ives of New York—issued a statement that a Republican victory would be a boost to the FEPC effort (Reston Reference Reston1952b). By October of 1952, both parties had created separate campaigns to compete for the Black vote (Booker and Roberts, Reference Booker and Roberts1952). Further, they produced separate literature for Black voters in the Great Migration states, which they deemed most important to the election.Footnote 11 Dwight Eisenhower ended the Democratic winning streak and defeated Adlai Stevenson to win the election by 10.5 percentage points. Stevenson lost in all but ten states. Although Stevenson won a majority of Black votes, many Black people voted for Dwight Eisenhower.
The 1956 Presidential Election
In May of 1954—halfway between presidential campaigns—the U.S. Supreme Court ruled in Brown v. Board of Education that “separate but equal has no place” in public education.Footnote 12 The issue of desegregation grew in political importance as Southerners refused to accept the ruling to integrate their schools and politicians at all levels took no action to support the ruling. President Eisenhower refrained from action to support the Court’s ruling because he sensed the Republican Party could make progress on this issue in the South (Sitkoff 1981). Other civil rights issues of importance during the 1956 election cycle were anti-lynching, Black voter protection legislation, and elimination of the poll tax.
Adlai Stevenson had been quiet on civil rights issues after the 1952 campaign. When he did speak, he gave speeches that articulated his centrist positions on civil rights and upset Black voters. Many liberals proposed cutting funding for schools that refused to comply with the court’s decision. Stevenson said he would not cut funding to segregated schools if he was elected President and would not use the resources of the federal government to enforce integration. When asked how Southerners could work toward integration, Stevenson suggested to an audience of Black voters in Los Angeles that the approach must be gradual. In a different setting, he went on to say, “we cannot by the stroke of a pen reverse customs and traditions that are older than the Republic,” and that “true integration requires a change in the hearts and minds of men” (Shaffer Reference Shaffer1956). His Democratic opponents took different positions.
Estes Kefauver maintained his liberal positions in the lead up to the 1956 campaign, repeatedly stating his support for the Brown decision. Kefauver’s personal papers describe his position:
The Supreme Court is the final authority on Constitutional matters. When it rendered its school decision, that decision was and is the law of the land… I think the President ought to exert his own influence and good offices. (Martin Reference Martin1979, p. 138)
Because Stevenson was still very popular with the Democratic Party leadership, Kefauver calculated he would have a better chance of getting to the White House if he pushed instead for the opportunity to become the vice-presidential nominee. Kefauver chose to end his presidential campaign early in the season. Also to the left of Stevenson was Averell Harriman, who had also sought the Democratic nomination in 1952 and had civil rights as a primary campaign issue. Harriman worked as a Special Assistant to President Truman and as the director of the Mutual Security Agency.Footnote 13 In 1954, he was elected governor of New York. Once Kefauver exited the race, Harriman was the only candidate pushing Stevenson to take liberal positions. Although Harriman had been a Truman appointee, the former president chose not to endorse him as the party’s nominee for president because of his far-left positions in 1952 (Berman Reference Berman1970; Dales 1956). Eventually, to show his displeasure with Stevenson’s moderate positions, President Truman changed his mind and endorsed Harriman for the 1956 Democratic nomination for the presidency (Martin Reference Martin1979).
Stevenson’s move left on civil rights occurred gradually between 1952 and 1956, with most of the change occurring during the primary season of the 1956 election. After moving to keep up with Kefauver in the primaries and going even further to keep Harriman at bay during the convention, Stevenson was far more liberal by the general election campaign of 1956 than he had been in the 1952 cycle or 1956 primaries. He went from describing civil rights as something that should be gradual and not happening by force, to saying that he would act to enforce civil rights if he was elected President. In one post-convention interview, Stevenson remarked that he did not know what “moderation” was and told the Chicago Defender that he would “base his campaign on the fundamental proposition that a person’s rights cannot depend in any way on his race, his creed, or his color” (Payne Reference Payne1956, p. 2).
Republicans understood that Black votes would be a necessary part of their coalition if they were going to win in 1956; they believed they might have won the 1948 campaign if they had just gotten a little more support from Black voters (CQ Almanac 1956). Attorney General Herbert Brownell “calculated that [Black people] held a balance of power in seven states that cast 197 Electoral College ballots, as well as in some 60 Congressional districts” (Sitkoff 1981, p. ). Therefore, members of the Eisenhower administration, led by Brownell, proposed that the president capitalize on the potential to woo Black voters by sending a civil rights bill to Congress. A civil rights bill would benefit Republicans by exposing the rift on civil rights issues in the Democratic Party.
Eisenhower was doubtful of civil rights advances as a way to garner new support for the Republican Party. In a meeting with Republican legislative leaders, he “noted with irritation that his previous desegregation actions had not garnered the GOP any new support in 1954” (Burk Reference Burk and Fredrick1984, p. 157). In the end, Eisenhower hesitantly allowed Brownell to put forward civil rights legislation. One of the caveats was that the less innocuous parts of the legislation could be described as coming from the administration, but the more consequential parts must be described as suggestions of the Attorney General and Justice Department—separate from the office of the president. The bill passed the House of Representatives in the 1956 session but did not make it to the floor of the Senate for a vote.
What seemed like progress on racial issues from 1952–1956 motivated Black Americans to support the Republican ticket in growing numbers. Eisenhower benefitted from the fact that Brown v. Board happened during his first term in office. His administration also touted desegregation of the military and facilities in Washington, D.C. as accomplishments. Eisenhower got another bump in votes from the work of Democratic Congressman Adam Clayton Powell, Jr. on his behalf in Harlem. For some middle-class Black voters, the growing strength of the economy also led to a decision to support Eisenhower (Burk Reference Burk and Fredrick1984). Media outlets predicted a Black defection to the Republican Party, based on interviews with Black voters in communities across the country and the list of prominent Black leaders who endorsed Eisenhower for the presidency. They were right (CQ Almanac 1957). The second match-up of President Dwight Eisenhower and Democratic candidate Adlai Stevenson was a more crushing defeat for the Democrats than the 1952 contest. Stevenson lost in all but seven states, earning only seventy-three Electoral College votes and 42% of the popular vote.
The 1960 Presidential Election
After the 1956 election, both parties believed Black votes were truly up for grabs. Democrats and Republicans supported civil rights legislation, so they could argue they were the party that secured the legislation. President Eisenhower’s advisors had suggested civil rights legislation as a way to win support from Black voters in early 1956. However, like the Democrats, Eisenhower was more concerned with the message he would send to the South by advocating civil rights legislation. After the 1956 victory, the Eisenhower administration got back to work on civil rights legislation (Sitkoff 1984). Under the leadership of the Democratic Senate Majority Leader, Lyndon B. Johnson (LBJ), the Congress passed—and President Eisenhower signed—the Civil Rights Acts of 1957 in September. Although the bill lacked much of the power civil rights leaders and liberals hoped it would have, it was the first piece of civil rights legislation in a century. Cooperation on the legislation gave both parties the opportunity to argue that they were the ones more committed to civil rights—Republicans for proposing and signing the legislation and Democrats for moving it through the Congress.
Later in September of 1957, President Eisenhower scored another victory in the minds of Black voters when he reluctantly acted to enforce the Brown decision by activating the National Guard to desegregate Central High School in Little Rock, Arkansas. Eisenhower’s decision increased support for the Republican Party among the Black community. Republicans thought Black voters might continue shifting away from Democrats in the presidential election of 1960 (Shaffer Reference Shaffer1956). The Democratic Party slate of primary candidates included a host of liberals and one Southerner who sought to cast off his roots and be considered a liberal. Adlai Stevenson—the Democratic presidential candidate of the last two elections—announced he was not interested in the Democratic nomination.
Very popular with Black voters was Hubert Humphrey, a liberal Senator from Minnesota who had been instrumental in drafting the liberal civil rights plank of the 1948 Democratic convention. He expressed interest in a national elected position during the 1956 elections and hoped that Stevenson would choose him as a running mate. Estes Kefauver ended up getting the vice-presidential nomination instead. Senator John F. Kennedy (JFK) followed Kefauver in votes and popularity for the 1956 vice-presidential spot. Therefore Humphrey, interested though he may be, was not a serious contender for the nomination. Along with James Rowe, Humphrey decided his strategy for seeking the presidential nomination of 1960 would be winning primary elections (White Reference White1961).
Stuart Symington, a Senate Democrat from Missouri, was not well known outside his home state and had not taken any positions as a Senator that would be problematic to Black voters. In his time on the campaign trail, he made it clear he held liberal positions on civil rights issues. Responding to President Truman’s disapproval of the lunch counter sit-ins, he commented “[m]y basic premise is that every citizen of the United States should have all the rights of any other citizen—all the rights. We can have no second-class citizens in our country” (Spivack Reference Spivack1960, p. A10). He did not believe he could be successful in political primaries and thought he might be able to achieve nomination through building relationships with party leaders. In his estimation, he stood a strong chance of becoming the Democrat’s presidential nominee if, for some reason, the Convention was divided on their candidates (White Reference White1961).
Senate Majority Leader Lyndon B. Johnson also had presidential aspirations but did not acknowledge his intentions until January of 1960—late in the primary election process (Caro Reference Caro2012). Johnson was unpopular with Black voters, who were skeptical of him because of his Southern roots and positions on civil rights during his early political career. Further, many Black leaders and White liberals felt he compromised too much by allowing Southerners to remove the section on discrimination in public accommodations from the Civil Rights Act of 1957. Johnson figured he might be able to overcome his difficulty with Northern Democrats and Black voters if he was able to follow up on his promises to strengthen the civil rights legislation during 1960.
John F. Kennedy began working on the presidential nomination of 1960 not long after his defeat for the vice-presidential nomination in 1956. Kennedy’s 1956 experience taught him that a good relationship with the South could pave the way for his nomination in 1960. He nurtured relationships with Southern Senators and Representatives. In Washington, he voted with Southern Democrats on civil rights issues. His relationship building extended beyond Washington as he made frequent visits to the South—often speaking on everything except civil rights issues. When he was pressed to talk about civil rights during those travels, he expressed a view that moderation was the appropriate course of action.
Kennedy’s statements on civil rights issues grew more liberal as his pursuit of the party nomination continued. The campaign recognized they would need support from liberal groups including leaders from labor and the Black community if he was to win the party’s nomination. Kennedy got strong incentive to move to the left on racial issues from his interactions with labor leaders. Walter Reuther, of the United Auto Workers, was particularly influential in getting Kennedy to commit to liberal positions on a range of issues including civil rights.Footnote 14
Also aiding Kennedy’s leftward shift was his camp’s belief that Black voters might be more likely to support the Republican ticket in the general election. Therefore, he used a more liberal tone with Black voters, while also speaking to Southerners in ways that signaled his support for their position. For example, in June of 1960 during a speech to the Liberal Party of New York, he said “moral persuasion by the president can be more effective than force in ending discrimination against Negroes” (Brauer 1977, p. 33). This kind of statement was in direct contrast to earlier statements from Southern Democrats and their supporters—including Adlai Stevenson and Kennedy himself at one point—who had argued it was impossible for government to change people’s feelings about racial issues. Later, Kennedy went further in his attempt to create distance from the South saying, “he hoped to win the Democratic presidential nomination without a single Southern vote in the Convention” (Egan Reference Egan1960, p. 1). When Robert Kennedy—JFK’s brother and political advisor—heard about these comments, he advised JFK it sounded like he no longer wanted Southern support. A day later, JFK made a revised statement to Southern delegates telling them, “I would be happy and proud to receive support from delegates from any part of the United States” (Brauer 1979, p. 34).
In the general election, both the Kennedy and the Nixon campaigns recognized the importance of Northern Black voters for the coming campaign. In a 1960 interview with Ebony magazine, they both described how important Northern Black voters were to their strategy.
Nixon commented:
I am convinced that the future of the Republican Party today lies in pressing forward on civil rights. In any one of the ‘big six’ states (New York, California, Pennsylvania, Michigan, Illinois, and Ohio) our civil rights stand can make all the difference in the world. In the last election we lost the governorship of Pennsylvania by about 50,000 votes. A shift of just five percent of the Negro vote would have elected a Republican (Rowan Reference Rowan1960, p. 41).
Kennedy commented:
I’d be a fool not to consider the Negro vote crucial. We’ve got to carry the key northern and western states or we’re just not going to win… All I ask is that people will look at my views, will look at my record, and will look at my stand (Rowan Reference Rowan1960, p. 41).
By 1960, nearly half of the Black population lived outside the South, and the Kennedy campaign calculated that increasing the number of Black voters in the base would be helpful towards winning large states. The campaign was also keenly aware of the fact that Black voters participated at rates comparable to White citizens, if not higher. Louis Harris, a Kennedy pollster, wrote “the fact that Negroes…make it their business to vote is a key political fact. For it highlights the intense political feeling among Negroes in America today” (Shaffer Reference Shaffer1956, p. 152).
Democrats made voter registration an important component of the campaign’s strategy and worked to make the Black community comfortable with Kennedy. For example, they integrated campaign meetings and allowed the Black press to travel with their press corps (Brauer 1979). The campaign also created a dedicated Black campaign working-group known as the “civil rights section,” whose goals were to garner Black support through various forms of media to register, and turn out, Black voters.
The Kennedy campaign estimated there were 40 million eligible, unregistered voters in the nation, and that seventy percent of those people were Democrats (Rorabraugh Reference Rorabaugh2009). They sought to register new voters by working with local parties, but they met resistance in some areas. For example, New York Democrats refused to help with the registration efforts. Although the national campaign calculated that Black voters in the city would be key to delivering an Electoral College victory in the state, the local Democratic Party was not interested in mobilizing new voters. Local party leaders thought increasing Black participation would upset the balance of their municipal and state elections. The Kennedys circumvented the local party machines to register and mobilize Black voters by working with labor unions and activating the Citizens for Kennedy organization. In New York, they gained 500,000 votes (Rorabraugh Reference Rorabaugh2009).
During the general election campaign, JFK got an unexpected opportunity to make inroads with the Black community. After Martin Luther King, Jr. was arrested during a protest in Georgia, he called to console Coretta Scott King. The campaign used the call to its advantage in their outreach to Black voters.Footnote 15 He won approval from Black leaders for coming to King’s aid. Because mainstream media did not cover the event, he was able to evade backlash from the Southern wing of the party. Kennedy’s civil rights section created and distributed a pamphlet just before the election and framed the event as a public demonstration of JFK’s position on race.Footnote 16
The 1960 contest between JFK and Richard M. Nixon was one of the closest in U.S. history, with Kennedy beating Nixon by a fraction of the popular vote and 84 Electoral College votes. “Gallup estimated that Kennedy garnered 68% of the Negro vote, a 7% improvement over Stevenson’s last showing” (Brauer Reference Brauer1978, p. 59). In the end, JFK won more Black support than Stevenson in 1956, but not more than Stevenson received in 1952 (White Reference White1961).
After 1960
After 1960, Kennedy was sluggish in his approach to civil rights. He did not follow through on the promises of the campaign. However, members of Congress had to answer to their constituents in 1962 and pressured Kennedy to submit a Civil Rights bill. They also encouraged him to move quickly on legislation to prevent discrimination in housing, something he had promised he could do “with the stroke of a pen.” Individuals within the administration also suggested that Kennedy should move on civil rights issues. Louis Martin repeatedly wrote to Ted Sorensen that the party was facing tough elections and Black voters were an important voting bloc. The party was concerned about harnessing the power of Black voters for the 1962 mid-term elections. In response, the campaign produced materials to demonstrate their civil rights progress. They also created the Voter Education Project, which ran from 1962–1964.
President Kennedy was assassinated in November of 1963. The assassination gave LBJ one year to prepare for the 1964 election. Johnson moved at full speed to pass civil rights legislation. In part, LBJ was working to fend off nomination threats from liberal Democrats representing a wing of the party that required support for civil rights measures. Like Kennedy in 1960, Johnson was also concerned with maximizing support from Black voters. The Democratic Party had voter registration of Black people throughout the nation as one of many strategic considerations. The Party was especially focused on places outside the South where Black Americans represented ten percent or more of the population. They realized it was possible to win without the South but knew they would have to mobilize more of their coalition—including Black voters—in other parts of the nation to achieve victory without their old cornerstone.
THE BALANCE OF POWER
There are several ways to think about a group of voters as the balance of power in elections. Moon (Reference Moon1948) described Black voters as the balance of power when there were more of them in the voting age population than the margin of victory for an election. Under Moon’s assumptions, Black voters are very frequently the balance of power. Considering the problems with and limited access to information about Black voters, Moon’s approach is an excellent attempt to understand the impact of Black voters. Therefore, my analysis begins by using his method for analyzing the 1944 presidential election to consider the 1948–1960 presidential elections. Some issues with Moon’s description of the balance of power warrant reconsideration. Therefore, I also analyze the presidential elections of this period using different assumptions about what it would take for Black voters to be the balance of power. Below, I describe whether Black voters could be the balance of power by using Moon’s method, then reconsider their position after employing an alternative method.
Method and Findings (Moon Method)
Most jurisdictions did not collect information about the race of individuals who registered to vote during this period, which complicates any effort to determine the balance of power. Because we do not have official voter registration information indicating race, it is difficult to say with certainty what would happen with Black voters in an election before that election occurred. Therefore, I constructed an estimate of the Black voting age population (BVAP) using Detailed Characteristics of the Population from the 1940–1960 U.S. Censuses. I use voting age population as a proxy for the number of Black people with the potential to register and vote. I included all people classified as Negro and older than age twenty.Footnote 17 Next, using a dataset of all presidential elections, I compare the Democratic Party’s popular vote share to the BVAP to determine whether the BVAP was more than the margin of victory in presidential elections. Following Moon, I considered Black voters the balance of power in the election when the BVAP was more than the margin of victory in the popular vote.
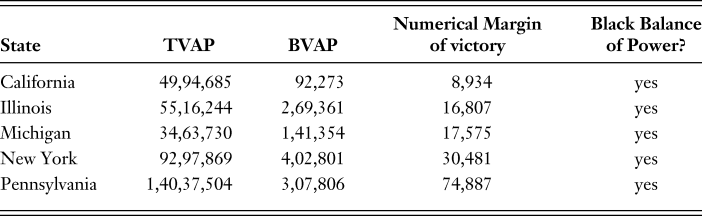
As outlined in Table 2, below, the number of Black people in the voting age population (VAP) exceeded the margin of victory in each of the Great Migration states in the 1948 election. If even a fraction of the Black voters who did vote for Democrats switched their positions to support for the Republican presidential candidates, the Republicans might have won the 1948 election.Footnote 18 Both political parties noticed Black voters’ contribution to the Truman victory. Parties would struggle to deal with attracting Black voters while maintaining White support. However, they fully understood that the Black voting bloc had great potential and should be considered as a part of party strategy.
1948 Balance of Power Estimate.

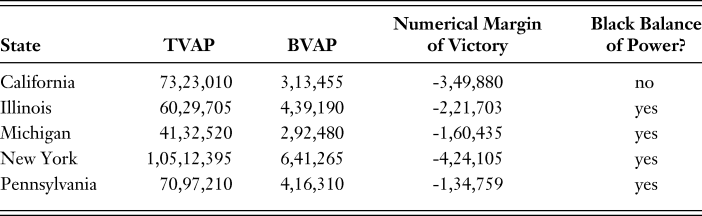
The 1952 election was close enough in Great Migration states that complete Black support for the Democratic candidate could have made a difference in the outcome of the election. The BVAP of Illinois, Michigan, New York, and Pennsylvania exceeded the number and percentage of votes needed to change the election. Keeping all else constant, if Black voters had supported Democrats at previous levels, Stevenson would have been in a better position to win the 1952 Electoral College. Despite the lopsided vote, Black voters maintained a numerical balance of power in four large Electoral College states: California, Illinois, Michigan, and Pennsylvania. Only in New York was the numerical margin greater than the Black population.
1952 Balance of Power Estimate. Minus sign indicates Republican victory/Democratic Party loss

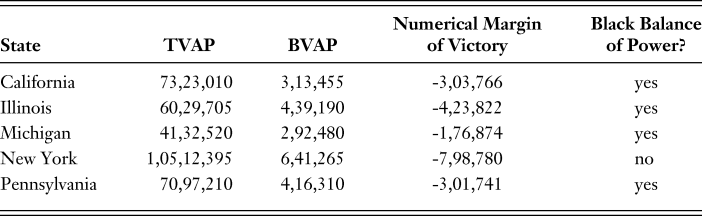
The election results from 1956 showed an 18% increase in the number of Black voters supporting the Republican ticket (Berman Reference Berman1970). Eisenhower’s biggest percentage gain—16.6 %—came in New York’s 16th District. Harlem was the second biggest Black constituency in the country, at 86.8% Black in 1950. The district’s Congressman, Rep. Adam C. Powell, Jr., followed through on his promise to break with the Democratic Party—which he viewed as too beholden to Southern interests—to support and campaign for Eisenhower’s reelection. In the nation’s largest Black constituency, Illinois’ 1st Congressional district in Chicago, Eisenhower scored a gain of 10.9%. In the third largest Negro district, Pennsylvania’s 4th (Philadelphia), Eisenhower gained 1.2% from 1952 (Reston Reference Reston1956). Again, while Stevenson’s election was a long shot, a strong and unified Black turnout could have helped in states with large Electoral College delegations.
1956 Balance of Power Estimate. Minus sign indicates Republican victory/Democratic Party loss

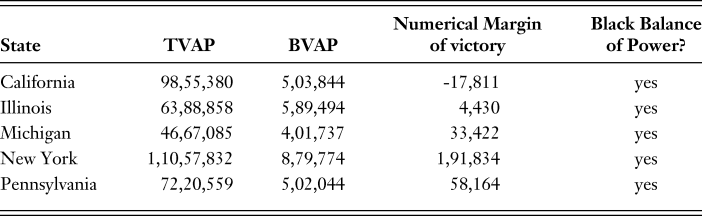
For the 1960 presidential election, Kennedy’s “local margin exceeded his national popular vote margin” in four of the five large cities of the Great Migration states (Rorabraugh 2002, p. 179). Approximately 250,000 Black voters supported Kennedy in Illinois and Michigan, where he won by 9,000 votes and 67,000 votes, respectively. Kennedy also carried Pennsylvania and New York. His margins were 791,120 in New York; 456,312 in Chicago; 331,544 in Philadelphia; and 311,721 in Detroit. Kennedy’s calculations about needing support in big states and increasing the total number of voters were correct.
Commenting in a 1962 interview with Ebony magazine, Richard Nixon acknowledged that Black voters were the balance of power in the election of 1960. “I could have become president. I needed only five percent more votes in the Negro areas.” He went on, “I could have gotten them if I had campaigned harder” (Booker 1962, p. 47). Although Nixon acknowledged the power of the Black vote, his party would take a vastly different direction in the 1964 presidential election campaign.
1960 Balance of Power Estimate. Minus sign indicates Republican victory/Democratic Party loss

Method and Findings (Alternative Method)
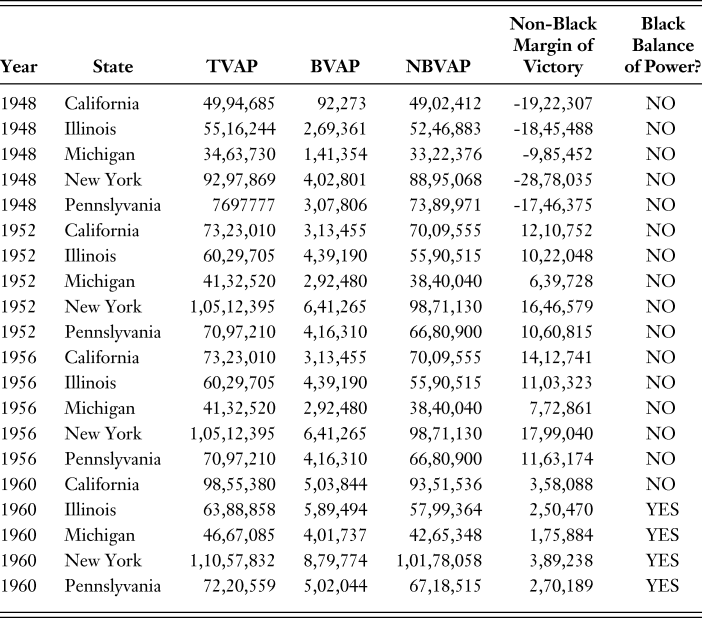
Acknowledging some of the shortcomings of Moon’s balance of power formula, I engaged a second method for thinking about the political impact of Black voters in the North. As stated above, Moon’s formula assumes that Black voters are the balance of power in elections when the number of Black people in the voting age population is greater than the margin of victory in the election. However, to ask whether Black voters are the balance of power in elections is really to question whether there are enough of them in the electorate to change the outcome of the election when the non-Black vote is evenly spilt.Footnote 19 Therefore, my alternative method differs from Moon’s by asking “are there enough Black Democratic supporters in the voting age population to change the outcome of the election, given the probable distribution of the non-Black electorate?” My alternative answers this question by revising assumptions about Black voters as part of the total vote and the rates at which Black voters supported the political parties.
In the South, Black Americans were barred from voting in a number of ways. In the North, however, the barriers to voting were lower and Black Americans did vote in elections from 1948–1960. Therefore, within a given result for the states and elections under consideration, it is safe to assume that some percentage of the people in the actual vote totals are Black voters. Consequently, determining the balance of power by comparing the BVAP to the margin of victory is to count Black voters twice. To remedy this, I approximate the likely number of Black voters and non-Black voters in the electorate, based on turnout in each presidential election.Footnote 20 This way, I can estimate the number of Black voters it would take to change the outcome of the election given the participation of non-Black voters in the election.
To address the likely differences in the levels of support for the political parties, I estimated support for political parties among Black voters and non-Black voters.Footnote 21 Creating these estimates was challenging because we have very little information about individual-level Black political participation before 1965. Further, very few localities collected any information about the race of citizens who registered to vote before the Voting Rights Act—much less, detailed information about Black people who were registering to vote. An alternative to individual-level data about voters would be to use survey data to estimate voter participation and partisan support. However, the surveys political scientists traditionally use to estimate American political participation often fail to provide reliable information about Black voters during the period of interest. Therefore, I want to be very clear that while this work seeks to advance Moon’s study, what we can know about Black voting during this time is severely limited by a lack of available data.
Another problem with earlier estimates of the balance of power is that they assume total support by Black voters for either political party. However, we should assume differing levels of support for the parties. Although Black voters did vote as a bloc, it is safe to assume that the number of Black voters supporting either party in a given election was less than one hundred percent. In other words, we should not assume that every single Black person who turned out to vote on election day voted for the same political party. It follows from this that we should not count the entire Black voting age population when thinking about the number of individuals necessary to overcome the margin of victory. Instead, we should measure whether the number of Black Democratic supporters could have been enough to change the outcome of the election.
I began the alternative method by estimating the actual turnout rate in a given election. I compared the total voting age population to the actual vote for president in the state for each election.Footnote 22 For each election, I assumed the Black turnout rate was at least as much as the overall turnout rate. This is a conservative estimate, given our knowledge that Black voters in the North often participated at higher rates than their White counterparts. The non-Black turnout number for each election was set to equal the overall turnout figure less the estimated Black turnout. I also considered whether Black voters would be the balance of power if I varied Black turnout numbers to assume a plus five- and plus ten-point increase in the number of Black voters.Footnote 23
Next, I produced estimates of support for both parties among Black and non-Black voters using responses from the American National Election Studies (ANES) Survey from 1948–1960. While the ANES is the best available data for this task, it is problematic in several ways. Most importantly, the number of Black people in the sample size for each year is very small. Although it is highly likely that support for the political parties varied from state to state, the ANES data does not account for differences in political support between states. Instead, survey responses about support for Presidential candidates are presented in the aggregate. An additional problem pertaining to the survey’s use in this work is that the 1948 election survey only includes seventeen Black voters, which is not enough to accurately project levels of support among Black voters.Footnote 24
Setting the problems with the ANES and other survey data of the period aside, I questioned the potential impact of variations in Democratic support among Black voters. I ran the following nine simulations, which varied assumptions about turnout and Democratic Party support among Black and non-Black voters as I described above:
1) Black turnout percentages equal to non-Black turnout percentages, and ANES support numbers as reported.
2) Black turnout percentages equal to non-Black turnout percentages, and +5 ANES support numbers.
3) Black turnout percentages equal to non-Black turnout percentages, and +10 ANES support numbers.
4) Black turnout is 5 points higher than non-Black turnout, and ANES support numbers as reported.
5) Black turnout is 5 points higher than non-Black turnout, and +5 ANES support numbers.
6) Black turnout is 5 points higher than non-Black turnout, and +10 ANES support numbers.
7) Black turnout is 10 points higher than non-Black turnout, and ANES support numbers as reported.
8) Black turnout is 10 points higher than non-Black turnout, and +5 ANES support numbers.
9) Black turnout is 10 points higher than non-Black turnout, and +10 ANES support numbers.
After estimating the likely turnout and levels of support for the Democratic Party among Black and non-Black voters, I classified Black voters as the balance of power in elections when their numbers of support for the Democratic Party were greater than the margin between non-Black voters.
The outcome was the same in each of these simulations, as depicted in Table 6, below. Black voters could have been the balance of power in only four of the twenty elections under consideration here—the 1960 presidential elections in Illinois, Michigan, New York, and Pennsylvania. In the other instances, the margin between non-Black Democrats and Republicans was too great to be singularly influenced by the Black voting bloc.
Black BOP based on ANES data, 1948–1960.

As described above, the ANES data proved problematic as a way to measure voting behavior of Black and non-Black populations during this period for a number of reasons. There was a mismatch between actual turnout information and the actions as reported by respondents to the ANES. Survey respondents did not accurately report whether they voted or for whom they voted. Because many people understand voting as a positive behavior, and want to be viewed in a positive light, they may have reported voting in the election even when they did not.Footnote 25 Misreporting could also be occurring because voters changed their positions between the time they were interviewed and the election or because their recollection of their vote changed to suggest that they voted for the winner. Alternatively, because the Great Migration states were often more closely contested than others in the nation, this could be an indication that the national survey results have failed to accurately represent the situation on the ground in these states.
CONCLUSION
The Great Migration deserves more prominent discussion in the study of Democratic Party change in the twentieth century. While other factors—like pressure from coalitional partners who were sympathetic to Black concerns and increasing national attention to civil rights issues because of the growing Civil Rights Movement—also contributed to Democratic Party strategy, scholars should highlight the role of the Great Migration for at least three reasons. First, movement to the North was a source of instant enfranchisement for Black Americans because they faced significant challenges to their right to vote in the South. Second, Black Americans went to places in the North that were most important to Democratic Party strategy. Third, party leaders believed that they needed to gain the electoral support of Black voters in the North to win elections.
During the post-war era, political parties and presidential candidates were keenly aware of the ways that the Great Migration influenced the distribution of potential voters. They wrote about these demographic changes and strategized about ways to manage them. Therefore, the migration is an important foundational piece of the political changes that occurred over the course of the twentieth century. This work has sought to connect the increase in the Black population in the North with the Democratic Party’s attention to Black voters. However, what we can know about the voting patterns of Black people in the United States is severely limited.
Moon’s analysis demonstrates why White politicians would have been very concerned with meeting the political needs of Black voters. However, as described above, there are problems inherent in his method. Regardless of the problems in Moon’s study, the qualitative data from the period confirms that White politicians believed Black voters were important to their electoral strategy. Further, White politicians believed Northern Black voters were the balance of power in presidential elections.
We are limited by lack of available data when attempting to think about Black voters as the balance of power through a different lens. The challenges of studying Black voters manifest in many ways that inhibit our ability to make inferences about early Black voting patterns. Survey data provides precarious results for all people before 1948 and during the years under study here. These problems are exacerbated for Black respondents, who were undercounted by survey firms of the times.Footnote 26 In this work, those methodological problems lend themselves to a set of conflicting findings. According to Moon’s estimates, White politicians had good reason to believe that Black voters were the balance of power. According to my estimates, those beliefs were misguided both because the Black population was not large enough to overcome the margin of victory in the non-Black population and because Black voters did not vote as a monolith. This deficit in information makes it difficult for us to use quantitative approaches to understand what was happening with Black voters. The deficit should not, however, deter scholars from working to understand this puzzle using alternative methods.
Contemporary party change scholars are reaching consensus on arguments about the timing and origin of Democratic Party change. Most agree that the Democratic Party experienced its earliest change on civil rights issues at the local and state level beginning in the 1940s. Even with the methodological challenges, scholars should not cease attempts to understand this period or Black voters’ participation during this period. If party change did occur earlier than previously thought and occurred at the state and local levels first, it is also important to think about sub-national politicians’ perception of the Great Migration. Future work in the field might consider how White mayors or state legislators dealt with the migration in their elections.
ACKNOWLEDGMENT
Thank you to the reviewers for their very thoughtful comments. Thank you also Kristi Andersen for reading many drafts of this work. I would like to acknowledge and express gratitude for the assistance of Rick Seltzer, Niambi Carter, Rachel Sigman, Seth Jolly, and Alexander Burstein. Archival research was made possible by grants from the John F. Kennedy Library Foundation, the Lyndon B. Johnson Library Foundation, and the Maxwell School of Citizenship and Public Affairs.