The Great Depression remains the most serious economic disruption in U.S. history, with unemployment rates ranging from 10 to 25 percent throughout the decade.Footnote 1 Under Roosevelt's New Deal in 1933, the federal government responded by taking responsibility for providing relief to the poor and unemployed for the first time in U.S. history. The income assistance took two primary forms—work relief, which required recipients to provide labor on public works projects, and direct relief, which required no work obligation. The Roosevelt administration's stated goals were to provide income relief to the poor and the unemployed and to promote the recovery of the economy through investment in civil infrastructure and stimulus of consumer spending. The government tried to insure the private industry was not affected by focusing work relief on building public works that had traditionally been the role of government. Moreover, work relief jobs were made less attractive by keeping work relief payments per hour worked well below private wages in most areas. Relief officials also encouraged workers to accept private employment when available. Despite these practices, private employers complained that WPA work relief made it more difficult for them to hire workers.Footnote 2
The research to date on New Deal relief programs and their relationship with labor markets during the 1930s has come in three forms. A large number of narratives describe how the programs worked.Footnote 3 A second set of cross-sectional studies show that more New Deal relief funds were distributed to areas with higher unemployment and deeper downturns in earlier periods.Footnote 4 A third series of studies seek to measure the impact of relief spending on private employment. Cross-sectional analysis by Robert Fleck of 1937 and 1940 unemployment statistics and by John Wallis and Daniel Benjamin of employment at the city level in 1934/35 find no effect of relief assistance on private employment. Ben Bernanke's time series study of employment in eight industries during the Depression finds that the presence of federal relief had no impact on labor markets. On the other hand, Wallis and Benjamin's unpublished study of employment in an annual state panel suggests that an additional relief job was associated with a reduction of about half of a private job.Footnote 5
Most of the research so far has not been able to capture the dynamic interactions between relief and private labor markets. We develop a new monthly panel data set containing private employment, private earnings, and measures of direct and work relief spending in 44 cities during the 1930s. A panel vector autoregressive (VAR) analysis is then used to show the dynamic responses of private earnings and employment to changes in relief spending, as well as the dynamic responses of relief spending to changes in private earnings and employment. We focus on private employment rather than unemployment for two important reasons. Defining unemployment for the 1930s requires a decision as to whether people on work relief should be treated as employed or not.Footnote 6 Second, unemployment surveys were conducted only in 1930, 1937, and 1940, while private employment information is available monthly.
The analysis employs a panel VAR model because it allows the use of high frequency data to account for the persistence of employment, earnings, and relief spending across months. Further, we can control for unobserved time-invariant features of cities and national month-specific shocks. The coefficient estimates from the empirical model are used to graph impulse response functions (IRF) that illustrate the time paths of relief spending, private employment, and private earnings that follow a one-month shock to each of the variables. The impulse response functions show quite different dynamics during the First New Deal (through June 1935) and the Second New Deal (after December 1935). During the earlier period, which began as the economy approached its trough, increases in total general relief spending (combined work and direct relief) were followed by increases in private employment and earnings, consistent with a view that relief spending served to stimulate the economy.
During the Second New Deal, which came after two years of recovery, increases in direct relief were followed by increased private earnings and no significant effect on employment. On the other hand, increases in WPA work relief were followed by strong declines in private employment and increases in monthly earnings. This result helps explain confusion in discussions about the WPA during the Depression. In response to employers’ complaints that WPA spending was making it more difficult to hire workers, WPA investigators provided evidence that the WPA encouraged its recipients to accept private employment. The results here suggest that the employers’ complaints were real but could not be easily resolved by the actions of WPA administrators. WPA spending created relatively stable employment opportunities for workers that made it difficult for private employers to compete without offering higher wages.
Finally, the analysis addresses the debate in the literature about the extent to which governments used relief funds for political purposes and/or to offset problems with unemployment. The analysis shows some of both. Declines in employment were followed by increases in relief spending. Meanwhile, after controlling for local economic conditions, increases in relief spending were higher during election years and tended to rise during the months just prior to elections.
Unemployment and New Deal Relief Institutions
In response to the massive unemployment of the 1930s, Roosevelt's New Deal in 1933 introduced the first federal relief programs targeted at the poor and unemployed. Several different agencies contributed to the relief effort during the Depression. Between summer 1933 and June 1935 the Federal Emergency Relief Administration (FERA) provided grants to the states, which, in turn, distributed funds to local governments to make need-based payments to the unemployed, either through direct or work relief. The payments that individual households received were set using the “budget deficit principle,” which based relief payments on the difference between the household's actual income and a standardized household budget. Local relief agencies had the discretion to set local FERA wages. Some used their discretion to lower benefits per person so that more families received relief.
The administration, worried about high unemployment and anticipating a harsh winter, created the Civil Works Administration (CWA) in November 1933. The CWA employed up to 4 million people per week through March 1934, when it ended and most of its workers were transferred to FERA projects. Eligibility for the CWA was also based on the household budget deficit principle, although the CWA paid hourly wages similar to the wages paid by private contractors who were hired by the government to build public works. Thus, hourly wages were substantially higher on CWA projects than on FERA projects.
As part of a compromise associated with the Social Security Act, full responsibility for direct relief was returned to state and local governments in the summer of 1935. Federal matching grants were offered to the states to help them run direct relief programs for the elderly, blind, and dependent children. The federal government continued to provide work relief directly through the Works Progress Administration for those considered “employable.” Eligibility for WPA jobs was determined by local governments using the budget deficit principle. WPA workers received hourly earnings that were roughly half those paid by private contractors working on government construction projects. Employables were also eligible to receive direct relief, in some cases while working on the WPA.Footnote 7
The Interactions Between Relief and Private Labor Markets
Roosevelt's stated goals for his relief programs were to promote relief by providing basic aid to the unemployed and the poor and, in turn, to stimulate recovery as relief recipients spent the funds they received. The Roosevelt administration anticipated that the work relief jobs would boost consumer spending and thus increase demand for labor, which would then raise private employment and earnings. Price V. Fishback, William C. Horrace, and Shawn Kantor find evidence that New Deal public works and relief spending did stimulate consumer spending.Footnote 8
Even though relief and public works spending stimulated consumption, there remains the issue of whether they stimulated private labor markets or even crowded out private employment. The crowding-out argument suggests that the presence of work relief gave workers an extra outside option that allowed them to search less and to seek higher pay in the private sector before accepting private employment. Higher pay would have induced private employers to reduce the number of workers demanded. The Roosevelt administration explicitly stated that they were trying to avoid adverse influence on private employment by focusing on public works projects traditionally built with government funds.Footnote 9 Work relief projects fell short of providing job opportunities for all of the unemployed. Roughly 4 to 7 percent of the labor force had work relief jobs, but the unemployment rate after subtracting out relief workers remained above 9 percent each year between 1931 and 1939.Footnote 10
It may seem surprising that work relief jobs would have been considered more attractive than private employment because the WPA paid substantially less per hour than most regular jobs.Footnote 11 However, a worker facing a depressed economy also worried about job security, so the expected earnings for the year or month certainly turned on a worker's assessment of his unemployment risk.Footnote 12 The risk of job loss in the private labor market during the Depression was high, while work relief jobs were viewed as relatively secure. Despite a WPA mandate that workers continuously employed on projects for over 18 months be released from work relief, 16 percent of those on work relief in February 1936 remained employed continuously for 36 months through February 1939.Footnote 13 After several years of high unemployment, risk-averse workers may well have seen the WPA jobs as viable alternatives, despite the low hourly earnings. One WPA worker remarked, “Why do we want to keep these jobs? Well … we know all the time about persons on direct relief … just managing to scrape along… . My advice, buddy, is better not take too much of a chance. Know a good thing when you got it.”Footnote 14
The Political Economy and Timing of Relief Spending
The issue of the use of relief spending for political purposes has generated even more academic controversy than the issue of crowding out.Footnote 15 Contemporary critics claimed that Roosevelt had been trying to “buy” votes by timing increases in relief to coincide with impending elections. In both 1936 and 1938 the national WPA numbers showed all-time highs in WPA employment in October and November, followed by December declines. Critics also sought to make political hay of autumn increases in 1940. The controversy was particularly heated during the 1938 election when WPA critics widely castigated Harry Hopkins for allegedly telling friends at a New York racetrack that the New Deal followed the following formula for success: “We shall tax and tax, spend and spend, and elect and elect.”Footnote 16 Meanwhile, the WPA defended the timing by arguing that they were striving to offset unemployment caused by seasonality, droughts, and unusual periods of unemployment. WPA officials argued that comparisons of WPA employment across states did not show higher than normal WPA employment in states where elections were tight. Although, Gavin Wright's cross-sectional regressions show that the number of per capita WPA jobs in December 1936 was higher in states that had more jobs in January 1935 as well as in states with more swing voting. He found similar results for November 1940 WPA jobs as a function of 1937 unemployment rates.Footnote 17
DATA
To analyze the effects of relief spending, we have compiled a new monthly panel data set of spending on direct relief and work relief in 44 cities for the period January 1933 through December 1939. When constructing the total relief series used in Figure 1, we combine monthly spending figures described as “General Relief” in the original source and WPA spending, along with estimates of city-level CWA spending from November 1933 through March 1934. “General Relief” in the original source includes all FERA spending on direct relief and work relief plus nearly all state and local spending on their own relief programs throughout the period from January 1933 through December 1939. The work relief portion of “General Relief” in the original source was typically about 43 to 50 percent after the end of the CWA in March 1934 until the introduction of the WPA in July 1935. The CWA and WPA spending in the original sources is all work relief.
TRENDS IN PERCENT DEVIATIONS FROM MEAN LEVELS OF RELIEF SPENDING AND PRIVATE LABOR MARKET EARNINGS AND EMPLOYMENT (averaged across cities)

In the period after December 1935, total relief spending can be divided into separate estimates of work and direct relief because after this time the “General Relief” expenditures were nearly all for direct relief programs. Consequently, WPA spending accounted for all work relief spending during the period with the exception of a very small amount of FERA work relief listed under “General Relief” until March 1937.Footnote 18 Relief expenditures are converted to per capita measures and then deflated by a city-level consumer price index. We merge these data with city-level private employment and private monthly earnings indices to create an unbalanced panel of monthly observations from 44 cities between 1933 and 1940.Footnote 19
There are a couple of limitations to the assembled data set that should be considered when interpreting our results. First, the sample is composed of larger urban areas. The smallest city has a population of approximately 62,000. Consequently, one should interpret our results as how larger urban labor markets responded to relief spending. Further, only 13 states are represented, with California as the only western state and no southern states.
Finally, the private labor market data for each city are based on “linked-relative” indices collected from surveys of a changing set of employers. These measures capture changes from one month to the next in the number of workers and the average monthly earnings of workers for the same set of private employers. The problem with such data is that firm exit or entry can distort the magnitude of total changes. Under certain circumstances, these indices may even misstate the direction of change in employment and earnings. In a longer working paper, we explore potential measurement error and find that the linked-relative indices correlate strongly with other measures of employment and only very large mismeasurement (more than 50 percent of the true change) would change the interpretation of our results.
Correlations Between Private Employment and Relief
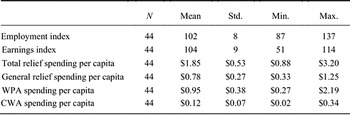
The Depression hit the entire country hard, but the extent of the downturn varied across locations. Similarly, the size of New Deal expenditures was unprecedented but also distributed unequally. Table 1 illustrates the cross-sectional variation of the six variables used in the article by showing the means across the 44 cities and the standard deviation, minimum, and maximum of those means. For example, between July 1933 and December 1939 Brockton, Massachusetts received the highest average monthly per capita WPA spending of $2.19. All figures here and in Table 1 are real 1935 dollars using city-level Consumer Price Index for all items from the United States Bureau of Labor Statistics with June of 1935 as the base month. Baltimore received the least at $0.27. For the entire sample of 44 cities, the average monthly expenditure on WPA programs was $0.95 per capita and the standard deviation of the means was $0.38.
CROSS-SECTIONAL SUMMARY STATISTICS

Note:
Spending figures are expressed in real June 1935 dollars.
Source:
See the text.
In order to make the spending variables comparable with the labor market indices, we transform each city/month observation into that month's percent deviation from the city mean over the time period being estimated. Figure 1 charts on one graph the average deviations of Private Employment, Private Earnings, and the aggregated Relief measure. Labor market variables are indexed on the left-hand axis and relief is indexed on the right.
The spike in total relief in early 1934 is associated with the massive CWA work relief program. The CWA lasted only 4 months while employing over 4 million people at its peak and paying prevailing wages for up to 30 hours per week.Footnote 20 During the Second New Deal, there were two peaks driven primarily by WPA spending, in mid-1936 and late 1938. The peaks in later periods fell well short of the CWA peak in the winter of 1933/34 because the WPA never employed more than 3.2 million people and offered payments per hour worked that were roughly half of the CWA level.Footnote 21 The smaller peak in 1935 is driven by the peak in First New Deal General Relief spending. Soon afterward, the federal government returned responsibility for direct relief to state and local governments, and work relief was transferred to the WPA.
It is difficult to see any consistent correlation between the relief spending and private labor market earnings and employment. There is one striking rise in per capita relief spending in 1938/39 that occurred at about the same time as a drop in employment. The relationship between private employment and earnings is also not clear. Over some periods it appears that increases in monthly earnings precede increases in employment. Since monthly earnings combine hours worked and wages, the pattern is consistent with employers following a practice of raising monthly hours before adding new employees.
EMPIRICAL MODEL
Estimating the relationship between employment, earnings, and relief is traditionally difficult because the three were likely determined simultaneously and endogenously. However, because we have data on a number of locations at a monthly frequency, we are able to employ a panel VAR model that allows us to explore the dynamic relationships between relief spending and the private labor market. The data set meets the two major requirements for that methodology: comparability and stationarity. The use of per capita expenditures makes relief spending comparable across location, while taking the percent deviation relative to the mean of each variable makes the variation in relief spending comparable with variation in the private labor market variables. Each of these variables was also found to be stationary using a Fisher-type unit root test for panel data.Footnote 22
The panel VAR methodology also has several econometric advantages. It does not require any a priori assumptions on the direction of feedbacks between the variables in the model. Instead, all current period measures of relief and the private labor market are allowed to be a function of the past values of each other. This enables us to estimate, for example, the total reduced-form effect that a past increase in work relief had on each of the other dependent variables and how those changes moved through the local economy over time. The structure of the panel VAR is found in equation system 1

where i indexes cities, t indexes months, and j indicates the lag length. The endogenous variables are measures of period t private employment (Empit), private earnings (Earnit), and per capita relief spending (Reliefit).
The panel VAR allows us to treat the past values of the variables as exogenous for several reasons. Since the equations estimate current values as functions of past values, the simultaneity of the system is eliminated. Potential problems with serial correlation in the errors of each equation are eliminated by incorporating an appropriate number of lags for each variable. Transforming the data into deviations from the city-level mean eliminates any time-invariant factors (such as structural features of the city's economy and political environment) that might have been correlated with both relief spending and the private labor market. In addition, the panel nature of the data allows us to control for national monthly shocks.Footnote 23 These would include seasonal factors that influenced employment patterns, national economy-wide shocks such as the move away from the gold standard or changes in federal tax rates, the timing of elections, and shocks to relief associated with the timing of Congress's approval of new federal budgets for relief, or changes in the federal relief program's rules.
Lag Length and Specification
To insure the consistency of the reduced-form VAR coefficient estimates, two methods are used to determine the appropriate lag structure. The first method selects the lag length that minimizes goodness-of-fit statistics, specifically the Akaike information criterion (AIC) and the Bayesian information criterion (BIC). The second method examines cross-correlations in the estimated residuals in order to assure that the innovations are not autocorrelated with one another over time. Using these two methods together, we settle on a lag length of nine.
We report two specifications, one each for the First and Second New Deals. General relief spending changed substantially after June 1935 when the WPA took over work relief and the FERA was being phased out. In specification 1, which runs from January 1933 through June 1935, we examine the separate effects of the CWA work program, which paid close to private market wages, and the General Relief program, which included both FERA work relief and direct relief from all levels of government. Specification 2, which runs from January 1936 through December 1939, examines the effects of direct relief and WPA work relief, separately. To probe the robustness of these results, we have also estimated several other specifications that are reported in a longer working paper. The conclusions reached from those alternative specifications are very similar to what we report here.Footnote 24
RESULTS
Each specification entails the estimation of as many as 225 coefficients. As is common in VAR analysis, we will forgo a discussion of the specific coefficients, although they can be found in the working paper version of this article. The statistical significance of one variable's ability to explain another is examined through a series of Granger causality tests.
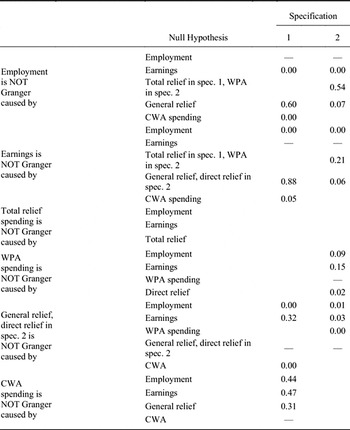
Table 2 reports the p-values from the test that the lagged values of a given variable can be excluded from an equation. In both specifications, the private monthly earnings and private employment variables can be said to Granger-cause one another at a confidence level of 5 percent or better. Specification 1 shows that General Relief, which includes both work and direct relief during the First New Deal, does not Granger-cause private employment or earnings at any meaningful level. Meanwhile, private employment Granger-causes general relief at the 0.1 percent level. The CWA Granger-causes private employment and earnings at the 1 percent and 5 percent levels, respectively.
GRANGER CAUSALITY TESTS

Note:
Numbers indicate the p-value of the test of each null hypothesis by specification. For example, under specification 2 we can only reject the null hypothesis that employment is not Granger caused by General relief at a significance level of 60 percent or higher.
Source:
See the text.
In specification 2, where we examine the differences between work relief and direct relief most clearly, private earnings and employment are estimated to have Granger-caused WPA work relief spending at the 9 and 15 percent levels, respectively. However, neither of the private labor market variables is Granger-caused by WPA work relief at any significance level below 21 percent. Meanwhile, there is Granger causation at the 7 percent significance level or better in both directions between direct relief and each of the private labor market variables. WPA spending and direct relief had Granger-causal relationships at the 2 percent level or better in both directions.
Impulse Response Functions
The dynamic relationships estimated in the panel VAR are best illustrated by graphing Impulse Response Functions (IRFs). Figures 2 and 3 chart the responses to a one-month, one-standard-deviation positive shock in period zero (hereafter referred to simply as a shock) over the following three-year period. The units on the vertical axis show the dependent variable's percent deviation from its mean in each month. The dark line is the point estimate of the response, and the lighter lines show the 90 percent confidence interval around that estimate, created using bootstrap standard errors with one thousand repetitions. The IRF figures illustrate the patterns of the responses, but using them to assess the magnitude of the responses is complicated for two reasons. First, because the deviations are measured as a percent of a variable's mean, dollar-for-dollar or job-for-job comparisons are not obvious. Second, the deviation shows how a variable is affected in a given month. One is also likely interested in how much employment, for example, responded in total over the course of three years to an increase in, say, relief over that same period. In order to make these calculations, we will also compare the cumulative deviations, roughly equivalent to the area between the impulse response line and the zero line.
IMPULSE RESPONSES TO A ONE-STANDARD-DEVIATION POSITIVE SHOCK AT TIME ZERO—SPECIFICATION 1
IMPULSE RESPONSES TO A ONE-STANDARD-DEVIATION POSITIVE SHOCK AT TIME ZERO—SPECIFICATION 2
The IRFs from specifications 1 and 2 show quite different dynamics by program and time period. The relief shocks during the First New Deal in specification 1, which combine work and direct relief from the FERA and the state and local governments, were followed by rises in employment and earnings. A shock to general relief spending in specification 1 was followed by higher than average general relief spending for more than 6 months in the chart in row 3 and column 3 of Figure 2. As seen in row 1 and column 3, the relief shock was followed by a dip in employment below the mean for the first 6 months and then a rise in employment above the mean between months 7 and 16. When all of the changes relative to the mean are summed across time, the relief shock was associated with a cumulative increase in relief spending of 41 percent of the mean and a cumulative increase in employment of 0.58 percent. For a city like Cleveland with average general relief spending of $1,467,000 per month prior to July 1935, the one-month shock would have led to feedbacks and responses that ultimately raised relief spending by $600,000. Given Cleveland's average expenditure per case of $26.50 in this time period, the rise in relief spending would have provided aid for roughly an additional 22,600 case-months over three years.
Given that Cleveland had an average employment of around 450,000 workers, the cumulative rise in employment of 0.58 percent would have added approximately 2,600 job months over the 36-month period. This suggests that one additional private job month was added for each additional $230 in relief spending or each 8.6 additional relief case months. A similar calculation suggests that an additional job month would have been associated with a rise of 7.1 and 6.7 case months in Los Angeles and New York, respectively.
A general relief shock was also followed by a monthly earnings increase that had little effect for six months before rising to 0.3 percent in the latter half of the first year and remaining quite high for several months thereafter (see row 2 and column 3 of Figure 2). Using Ohio's average monthly wage of $102 (1935 dollars) for Cleveland, the 0.3 percent increase in monthly earnings in the latter half of the first year would have been an extra 31 cents for that month. The cumulative increase of 1.6 percent from the mean in private earnings would have amounted to a total of 1.63 additional dollars paid out over 36 months.
Since the CWA lasted for only five months, it should not be surprising that a shock to CWA spending led to virtually no sustained increase in CWA spending (row 4, column 4 of Figure 2). A shock to CWA spending per person was followed by a decrease in employment that bottomed out in five months at about 0.76 percent (row 1, column 4 of Figure 2). The response of private earnings fluctuated sharply within the first eight months though was for the most part negative. On net, over the three years after a shock to CWA spending, both employment and private earnings would have had cumulative decreases of 2.2 and 1.0 percent, respectively. In Cleveland, this would have meant a cumulative decrease in employment of 9,900 job months and cumulative lower earnings payments of $102 over three years.
Specification 2 for the Second New Deal offers an opportunity to separately examine the impact of work relief and direct relief. A shock in direct relief spending was followed by a cumulative increase in direct relief over the 3-year period of 58 percent (row 3 and column 3 of Figure 3). For a city like Cleveland that had average direct relief spending during this period of approximately $720,000 per month, the cumulative increase would have been $418,000 over the 3-year period. The shock to direct relief is followed by a decrease, then increase in private employment with a cumulative net change that sums to a –0.2 percent change. Direct relief had a stronger effect on private earnings, as the cumulative increase following a shock to direct relief was 6.2 percent. Assuming a monthly wage of $102, this would have meant extra payments summing to $6.32 over the period.
WPA spending had a different relationship with the private labor market than the combination of direct and work relief in the First New Deal and the direct relief spending during the Second New Deal. At several points during the New Deal, there were positive shocks to a city's WPA budget when the federal relief administration approved a new works project. Although New Deal administrators tried to prevent WPA work relief from having a negative impact on private employment, the impulse response function in Figure 3 (row 1, column 3) shows that an increase in work relief spending at time zero was associated with a statistically significant decrease in private employment that peaked at –0.20 percent before slowly decaying back to zero.
The sum of all the deviations in WPA spending over the entire 36-month period associated with the initial shock in WPA spending is 90 percent. If we assume that all of this increase went to an increase in the number of work relief job months rather than higher work relief pay, it would have meant a 90 percent increase in WPA jobs relative to the mean number in the city. In Cleveland, which averaged about 39,100 WPA jobs per month, the initial shock would have led to an additional 35,200 relief job months over the 36-month period.
Meanwhile, the cumulative effect of the WPA shock was to reduce the number of job months of private employment over the following 36 months by 4.9 percent. In Cleveland, where mean employment was around 480,000 workers in this period, this translates into a cumulative decrease in private job months of approximately 23,500 over the 36-month period. The comparison suggests that for every relief job month added over the period, private sector employment declined by approximately 0.66 job months. Using the same procedure and assumptions an additional work relief job month would have decreased private employment by 1.33 and 0.92 job months in Los Angeles and New York, respectively.
At the same time, the shock to WPA spending was also associated with a rise in private monthly earnings (see row 2, column 4 of Figure 3). At its peak, the WPA shock raised private earnings over 0.2 percent from its mean. After adding up the deviations from the mean over the 36-month period, the cumulative effect is 5.7 percent. Assuming a monthly wage of $102, this would mean a typical worker would have received a total of $5.84 in extra pay spread over the period.
Together the IRFs for employment and earnings in response to a shock in work relief spending are consistent with a model of crowding out. These results might help explain a common complaint during the New Deal. Private employers argued that the WPA earnings were too high and that they were having trouble hiring workers at wages they had been paying before. Among the numerous reports, a June 1937 survey of State Administrators of the New Deal by the Office of Government Reports found that private industry expressed interest in hiring WPA workers in 35 states, but a number of workers were reluctant to accept private work and some actually refused in 19 of the states. The type of work refused ranged from domestic labor to farm labor to factory work to skilled labor.Footnote 25
Worried about this issue, the WPA investigated their procedures and typically found that the local project managers were encouraging workers to accept private jobs when the jobs became available. In some cases, the workers were even allowed to supplement WPA earnings with private earnings. At various times, the WPA promised workers an opportunity to return to work relief if the private job fell through. The results of the WPA investigations often turned up relatively few cases where workers had turned down private work at prevailing wages, and those who had were immediately fired. When the WPA officials reported the findings of their investigations, they sounded a triumphant note that they had proved the complaining employers wrong. H. O. Hunter of the WPA in a 1939 radio address stated: “Now we have found one single overwhelming fact in all of these cases—as soon as we ask for concrete details, with names and dates, the stories melt away into nothing but idle rumor.”Footnote 26
The impulse response functions suggest, however, that the complaining employers and the WPA officials both were right, but they were talking past each other. The employers were describing real patterns and experiences that they were witnessing in their cities. They might not have been able to pin down precise names and dates, but they were seeing some upward pressure on the wages they had to pay and, thus, their incentives to hire diminished. Meanwhile, WPA officials could document that they were following the procedures that they had designed to avoid harming private labor markets. WPA wages that were “too high” in the employers’ view did not have to exceed wages on private jobs. It is very possible that the security of the WPA job made the relief job attractive enough that employers were having trouble hiring workers in a time of extraordinarily high unemployment rates.
Did Relief Respond to Economic Distress?
In the extensive debate over the political economy of New Deal spending, part of the discussion has centered on the extent to which New Deal spending responded to problems in the economy. Typically, the cross-sectional studies that focused on the effect of the economy on relief expenditures used measures of economic activity from earlier periods to avoid simultaneity bias. These studies have shown that areas that had higher unemployment and/or experienced deeper downturns tended to receive more federal money for relief. The monthly data and panel VAR offer the first opportunity to examine how the timing of relief funds responded to economic upturns and downturns within the same city.
In general, we find support for past work that indicated that relief was targeted at places experiencing reduced economic activity. The First New Deal relationships in row 3 of Figure 2 show that following positive shocks to the private labor market, general relief decreases. Specifically, the shocks to employment and earnings result in respective increases of 18 and 11 percent above their means over the 3-year period. This results in cumulative decreases in general relief of 12 and 3 percent, respectively. The separate responses of direct and work relief during the Second New Deal are shown in rows 3 and 4 of Figure 3. A cumulative increase in employment of 25 percent corresponds with cumulative decreases in both direct and work relief of 5 and 2 percent, respectively. Meanwhile, a cumulative increase in earnings of 26 percent corresponds to cumulative decreases in direct and work relief of 6 and 24 percent, respectively. Together these responses illustrate that all measures of relief were negatively related to the health of the local labor market. When the labor market improved relief spending was reduced, while a downturn in labor market activity would have been followed by increases in relief spending.
Elections and the Timing of Relief Spending
Contemporary critics claimed that the Roosevelt administration had been trying to “buy” votes by timing increases in relief to coincide with impending elections, particularly in 1936 and 1938. The WPA argued that rises in spending around election time were designed to offset unemployment caused by seasonality, droughts, and unusual periods of unemployment around the country. We can use the monthly data on relief and private labor markets to determine how much of the variation in spending that is not directly related to economic activity was timed to occur near election time. To the extent that the electorate's attitude can be expressed as, “What have you done for me lately?” we expect that efforts to use spending to aid reelection chances would be timed to be higher in the final months of the campaign. To capture the timing, we begin by estimating equation 3 for the period January 1936 through December 1939. Note that this is simply the relief equation from the VAR model in specification 2.Footnote 27

Figure 4 plots the time fixed effects from equation 3. These represent the WPA spending patterns associated with each time period after controlling for local employment and earnings and past relief spending. They show two clear patterns. First, WPA spending during an election year, holding private market activity constant, was higher than during non-election years. Second, the spending in the months August through November (the period encompassing the final months of an election) was higher in federal election years than in non-election years. Both of these differences were statistically significant at the 5 percent level. The only time of year in which the non-election year spending was similar to federal election year spending was in December, the month after the election and again in March. As a result, the timing of WPA spending, even after controlling for local economic activity, seems consistent with the view that it was timed to influence federal elections.
WPA SPENDING PATTERNS BY MONTH OF THE YEAR AFTER CONTROLLING FOR LOCAL LABOR MARKET CONDITIONS AND PAST WPA SPENDING
DISCUSSION
Our analysis captures the dynamic relationships between relief and private labor markets at the local level after controlling for common nationwide shocks and for time-invariant factors in each city. There were substantial differences in the relationships found during the First New Deal (through June 1935) and the Second New Deal (after December 1935). Because we have controlled for the differences in nationwide shocks that occurred each month, we believe that the differences in the relationships between the first and second periods are related to the differences in the structural economic environment of the two periods. During the First New Deal, when the economic problems were at their worst, a rise in the combination of direct and work relief spending distributed by the FERA and state and local governments was followed by increases in employment and monthly earnings. The cumulative effects suggest that the FERA direct and work relief spending had a net stimulative effect on private labor markets. A rough estimate based on the cumulative responses suggests that an increase of eight work relief case months eventually gave rise to an additional private job month.
After two years of recovery and a series of reorganizations of New Deal programs, the impact of the programs changed substantially. After December 1935 the direct relief spending run by the state and local governments had a much weaker and slightly net negative relationship with private employment. Monthly earnings responded positively. Meanwhile, the relationships between WPA work relief and private employment were quite different from the patterns estimated between general relief spending and employment during the FERA era. A positive shock to WPA spending was followed by a proportional decline in private employment, such that the addition of one relief job month over the period yielded a reduction of 0.6 to 1.3 private job months. In addition, increases in work relief were associated with increases in private monthly earnings. The patterns found for the WPA help explain a wide range of complaints filed by employers against the WPA despite the WPA's administrative efforts to get workers to accept jobs. The implication is that a real change in the relationship between relief and the private labor market occurred during the 1930s.
At this stage, we can only speculate about the reasons for the change in responses between the two periods. There are a number of differences between the periods that may have contributed. After 1936 state and local governments were forced to fund direct relief with state and local tax dollars; therefore, there were no more external direct relief funds injected to provide a stimulative effect in the local economy. The WPA, however, remained federally funded, thus the difference in the effects for WPA spending might have been driven by changes in the economic environment between the First and Second New Deal.
During the earlier period, unemployment rates, including people on work relief, ranged between 20.1 and 24.9 percent; the rates were 14.2 to 20.6 percent if those on work relief are not included. Real GDP still remained 11.4 percent below the 1929 peak in 1935 after reaching a trough of 27 percent below the peak in 1933. During the First New Deal, the National Recovery Administration had been established to allow industry to establish codes of “fair competition” that allowed them to raise prices and hourly wages. The reduced-form microeconomic effect of the NRA codes was to reduce employment, total hours worked, and industry output.Footnote 28 Crowding-out effects were less likely during a period when the code policies slowed the hiring of workers and there was a vast pool of available labor.
After 1935, on the other hand, the WPA was operating in an environment where real GDP had recovered enough to exceed its 1929 level. Unemployment rates had fallen to 14 to 19 percent including work relief workers, and 9.1 to 12.5 without them. In short, during the Second New Deal the economy was growing, private employers no longer were covered by the NRA codes and thus faced fewer constraints on their hiring, and the pool of unemployed labor was smaller, although still substantial.
Finally, a worker's perception of work relief likely changed between the First and Second New Deals. During the earlier period, work relief was a new and unfamiliar concept run by the same agency that handled direct relief. This new “welfare” program may then have been viewed less as a job and more as a handout. Additionally, the newness of the program might have raised questions about its future. The creation of the WPA in 1935, after two full years of extensive work relief hiring, likely sent two strong signals. First, work relief and direct relief had been officially separated, potentially reducing the “welfare” connotations of work relief programs. Second, the creation of a new agency to handle work relief likely signaled a level of permanence to the program. The program was still called an emergency program, but many Democrats were lobbying to make the WPA more permanent. Together these would have worked to make a WPA job more like a low-risk substitute for a private sector job in the mind of a worker, a prospect borne out by the significant length of time that many people stayed on work relief under the WPA. Relative to the situation in the First New Deal, one might expect that the negative labor supply-side consequences were more likely to overwhelm any stimulative effects of the work relief payments during the Second New Deal.
Finally, the dynamics we document also contribute to the large literature on the extent to which the distribution of New Deal funds reflected Roosevelt's declared goal of promoting relief and recovery. While nearly all of the prior work has focused on cross-sectional analysis, the results of the panel analysis show that relief spending increased after declines in private employment and earnings in a way that helped promote recovery. On the other hand, the monthly variation in relief spending also yields evidence consistent with the idea that political motivations were important. All else constant, WPA work relief spending was higher in federal election years than in off years, and the election year spending showed increases in the late summer and early fall months leading into the November election.