Introduction
Catalysis is the single most important interdisciplinary technology in the chemical industry. Of all chemical and pharmaceutical products produced today, more than 85% of products are manufactured by catalytic processes.[Reference de Jong1] The application of heterogeneous catalysis is highly desirable in order to achieve green chemistry goals by minimizing separations. The activity of heterogeneous catalysts depends on various factors, such as surface area, pore size of the support, and particle size of the active metals on the support. Hierarchically porous catalysts have connecting pores with multiple length scales.[Reference Yuan and Su2–Reference Yang, Leonard, Lemaire, Tian and Su5] This provides superior mass diffusion that can in turn increase the accessibility of the fluids (reactants and products) during organic transformations. There is increasing interest in development of these materials, as the ability to separately control structure at the nanometer and micrometer length scales[Reference Parlett, Wilson and Lee6] promises improvements in catalytic performance by tuning the structure of the catalyst.
Porous carbon is widely used in heterogeneous catalysis because of high surface area and large pore volume coupled with good chemical, thermal, and mechanical stability. Meso–macroporous carbons have been studied in important applications, such as adsorption, gas storage, separations, and electrochemistry as well as catalysis. Porous carbons are widely used as supports for catalytically active metals such as palladium (Pd), platinum (Pt), nickel (Ni), etc. Various approaches have been reported for the synthesis of hierarchically porous carbon support including catalytic activation of carbon precursors,[Reference Oya, Yoshida, Alcaniz-Monge and Linares-Solano7, Reference Kyotani8] carbonization of polymeric blends,[Reference Ozaki, Endo, Ohizumi, Igarashi, Nakahara, Oya, Yoshida and Iizuka9] use of basic catalysts such as lysine,[Reference Hao, Li, Wang, Wang, Qi and Lu10] and the carbonization of resorcinol–formaldehyde or phenol–formaldehyde aerogels.[Reference Biener, Stadermann, Suss, Worsley, Biener, Rose and Baumann11] Recent reports describe the fine tuning of the textural properties of the carbon including meso–macroporosity, ordered–disordered, surface area, and stability by varying the composition of the surfactant template and carbon precursor or hard[Reference Liang, Li and Dai12, Reference Xia, Yang and Mokaya13] and soft-templating methods.[Reference Chuenchom, Kraehnert and Smarsly14] The use of SiO2 monoliths as a hard template for replication to synthesize mesoporous carbon monoliths has been reported.[Reference Lu, Smått, Backlund and Lindén15] Various block-copolymers and the tri-block copolymers of the Pluronic family have been applied for the direct synthesis of ordered porous carbon.[Reference Liang and Dai16–Reference Liu, Li, Song and Chen18] The incorporation of active metal species onto the porous carbon support is typically carried out by impregnation or infiltration techniques. However, these processes can be time consuming and increase the cost of the final product.
In this work, we report a novel, one-pot, facile approach for the synthesis of Pd supported on a hierarchically porous carbon monolith using a co-gelation method in which a Pd complex is included with the resorcinol–formaldehyde polymer precursors. The macropores in the carbon are produced by spinodal decomposition, and mesopores are produced by the addition of the tri-block non-ionic surfactant F127. This type of direct synthesis has previously been reported for the one pot synthesis of various metals and metal oxides supported on mesoporous carbon powders[Reference Sun, Sun, Qiao, Wei, Yue, Wang, Deng, Kaliaguine and Zhao19–Reference Wang and Dai21] and thin films,[Reference Chi, Tu, Wang, Li and Zhao22, Reference Stojmenovic, Momcilovic, Gavrilov, Pasti, Mentus, Jokic and Babic23] but to the best of our knowledge this is the first report of the application to monoliths as catalysts.
The aim of the work is to achieve hierarchically porous, stable Pd/C catalysts as monoliths in a single step synthesis, thereby making the synthesis more material and energy efficient, while retaining the catalytic properties needed for use in a fixed bed reactor or monolithic microreactor. The catalytic activity was assessed by the hydrogenation of styrene. The adsorption of Pd to the support was assessed by washing the catalyst with ethyl alcohol. Both properties are compared to a standard commercial catalyst of similar Pd loading.
Experimental
Materials and chemicals
Ethyl alcohol (EtOH, 99%), non-ionic surfactant Pluronic F127 (99.9%), 1, 6 diamino hexane (DAH, 99.5%), formalin and styrene (>99%) were obtained from Aldrich (St. Louis, MO). Resorcinol (99.9%) was purchased from Riëdel-De Haën Ag Seelze, Hannover. Tetraammine palladium (II) chloride monohydrate [Pd(NH3)4Cl2.H2O, 99.9%] was purchased from Alfa Aesar, Ward Hill, MA. 1 wt% Pd/C catalyst extrudates were purchased from Alfa Aesar (a Johnson-Matthey (JM) company, Ward Hill, MA).
Synthesis of Pd/C material
The Pd/C (4.7 g) material with 1 and 5 wt% Pd on carbon were synthesized using the co-gelation method. A typical synthesis follows.
In a 500 ml beaker, 9 g resorcinol crystals, 3.75 g of F127, 27 g of EtOH and deionized (DI) water (27 g) was added to the same beaker and the solution was stirred till a transparent brown solution was observed. The Pd(NH3)4Cl2.H2O salt (0.1168 g, 1 wt% Pd loading) was added to the transparent brown solution. The solution was stirred for 10 min until all the salt was dissolved. DAH (0.234 g) was added making the solution basic and the solution was stirred for 30 min. Formalin solution (13.26 g) was added to the solution and stirred for 10 min. The resultant cloudy brown solution was degassed under vacuum for 10 min to remove trapped air and transferred to cylindrical molds. The molds were sealed with lids and placed in a pressure vessel that contained 50 ml each of EtOH and DI water. The pressure vessel was kept at 80 °C in an oven for 24 h. After cooling to room temperature (RT), the monoliths were removed from the pressure vessel and kept at 60 °C for 2 days in an oven (to allow maximum evaporation of the solvent). The resultant gel monoliths were removed from the molds and then dried at 100 °C in a tubular furnace under nitrogen (N2) gas flow. The dried monolithic columns were then simultaneously carbonized and the Pd was reduced under 5% H2/N2 by heating to 500 °C at a rate of 1 °C/min, and kept at 500 °C for 2 h. The resulting Pd/C monoliths were black.
Material characterization
The N2 physisorption measurements were recorded on a Quantachrome Nova 2200e pore size analyzer (Boynton Beach, FL) at −197 °C with He mode to determine surface area (SA) and void volume of the monoliths, respectively. Interpretation of the isotherms was done with Quantachrome NovaWin software version 10.01. The BET isotherm model was used to determine surface area and the Barrett-Joyner-Halenda (BJH) method was applied to the adsorption branch to calculate the pore size distribution. Powder x-ray diffraction (XRD) measurements were performed on a Bruker D8 Discover with GADDS (wavelength Co Kα, 1.79 Å) and a Hi-Star area detector. Scanning electron microscope (SEM) images were taken on a JOEL 7000 FE-SEM (Tokyo, Japan) with diode based back-scatter electron detector, and equipped with an Oxford Energy-Dispersive Spectroscopy (EDS) detector for elemental analysis at an accelerating voltage of 20 kV using secondary electron imaging detector.
Evaluation of catalytic activity
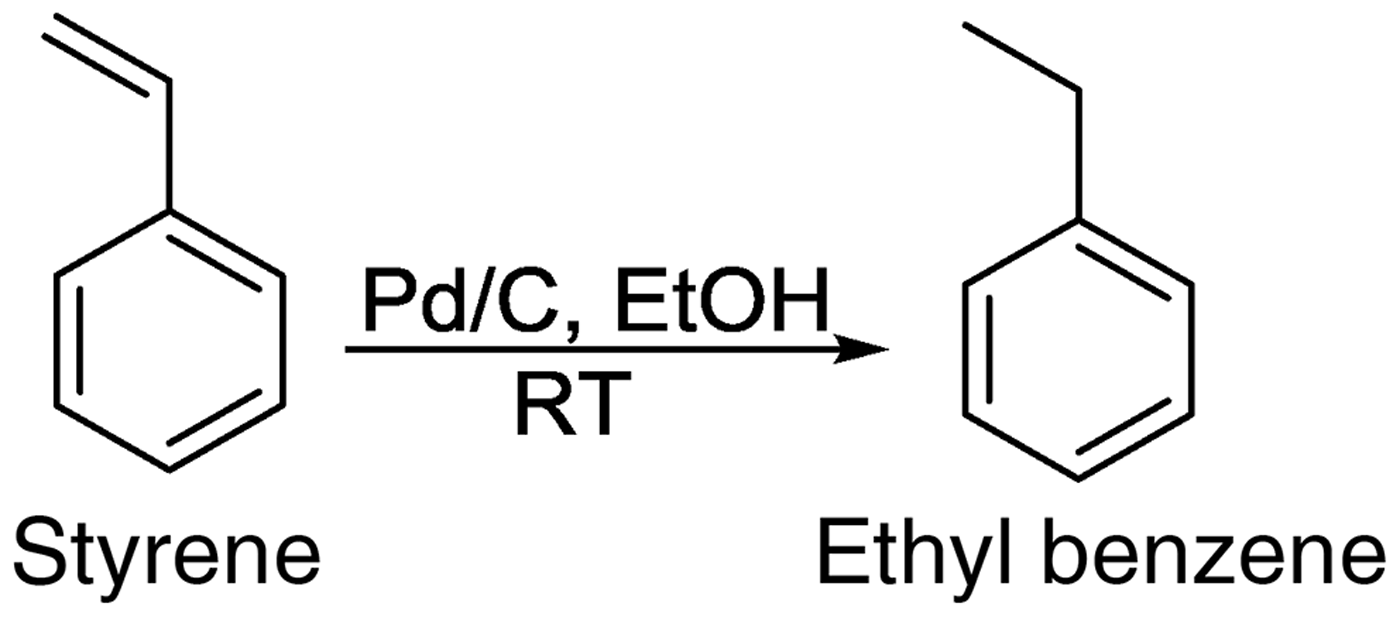
The hydrogenation of styrene (Scheme 1) was carried out in a 250 ml one-necked round bottom flask. The flask was charged with 2.3 ml styrene, 100 ml EtOH (solvent), Pd/C catalyst (calculated for 1 mol.% Pd) and a magnetic stir bar and placed on a magnetic stirrer. The catalysts were well ground using a mortar and pestle before adding to the reaction flask. The flask was evacuated under vacuum to ensure the removal of trapped air and moisture. The flask was covered with a rubber septum and fitted with a H2 balloon (1 atm). The reaction mixture was vigorously stirred at RT for 24 h, and the reaction was monitored by gas chromatography (GC). The samples were analyzed using a Varian GC model CP-3800 fitted with EC-5 column (length 30 m × ID 0.25 mm × film thickness 0.25 μm).
Hydrogenation of styrene to ethyl benzene using Pd/C catalysts.

Leaching studies
The leaching tests of the synthesized monoliths were carried out in a continuous flow microreactor. The fixed bed of the continuous monolithic microreactor was constructed as follows: The 1 wt% Pd/C (one monolith, 0.214 g; 1.4 cm × 0.85 cm) and 5 wt% Pd/C (one monolith, 0.129 g; 1 cm × 0.8 cm) were separately positioned in heat shrinkable PTFE tube of 5 cm length. The PTFE tubing was then heated to provide a conformal fit to the exterior of the monolith. EtOH (250 ml) was pumped through the microreactor with a peristaltic pump at a constant flow rate of 2.1 ml/min. The quantitative analysis of leaching of Pd from the support was determined by the resulting Pd ion concentration in the effluent using a Perkin Elmer AAnalyst 400 atomic absorption spectrophotometer (AAS).
Results and discussion
The procedure used to produce the hierarchically porous carbon is an extension of that reported by Hao et al.[Reference Hao, Li, Qian, Wang, Zhang, Zhang, Wang, Schuth, Bongard and Lu24] with the addition of Pd(NH3)4Cl2.H2O to the starting polymer precursor solution. The polymerization of resorcinol with formaldehyde is accelerated by the presence of the DAH, which is a weak base and acts as a catalyst. After drying, carbonization, and reduction under H2/N2, this synthesis procedure led to the formation of a partly graphitized carbon skeleton that incorporates nitrogen from DAH along with Pd. As shown in Fig. 1 the Pd/C material was produced as monolithic black cylinders, with a typical length of about 1.2 cm and diameter of about 0.85 cm.
Photograph of 1 and 5 wt% Pd/C (from left). An American one cent coin is shown to indicate scale.
N2 sorption analyses
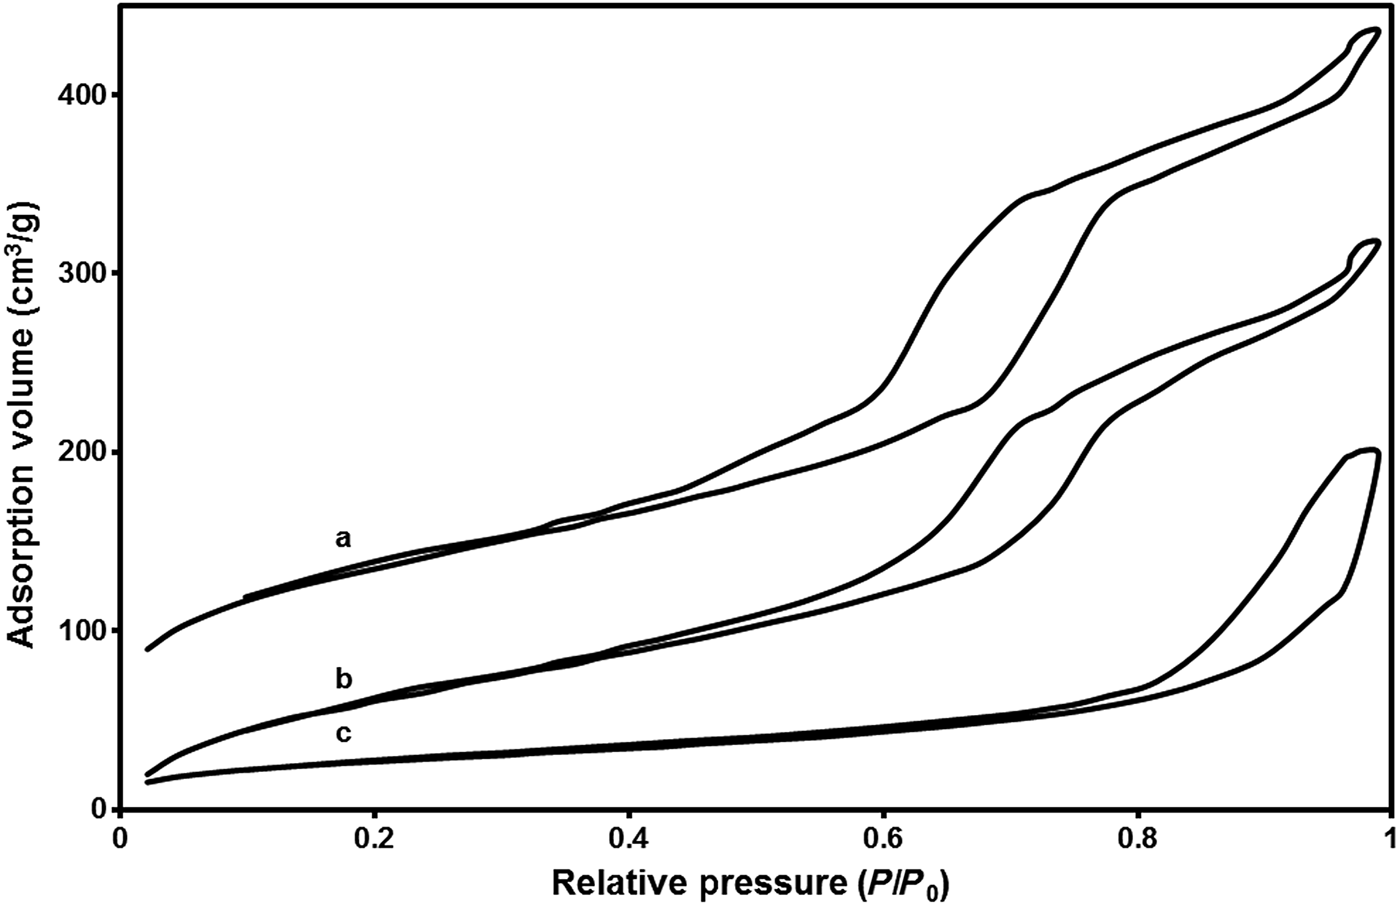
The N2 adsorption/desorption isotherms of the carbon support and the Pd/C materials are shown in Fig. 2. Typical Type IV adsorption isotherms were observed for the materials. The observed hysteresis loop between the adsorption and desorption branches, implies the presence of mesopores in both materials.
N2 adsorption–desorption isotherms of (a) carbon support, (b) 1 wt%, and (c) 5 wt% Pd/C.
In case of the isotherm of 1 wt% Pd/C, two adsorption steps were clearly observed, one at relative pressures between 0.45 and 0.8 P/P0 and the second above 0.9 P/P0. The first N2 uptake at relative pressure of 0.45 P/P0 is due to filling of surfactant templated mesopores, whereas the second N2 uptake at pressures above 0.9 P/P0 is due to the filling of textural pores and macropores. The sorption isotherm of 5 wt% Pd/C showed N2 uptake above 0.8 P/P0 is attributed to the filling of textural pores and/or macropores. However, the hysteresis in N2 uptake in the lower P/P0 pressure range was not observed. The surface areas and pore diameters are given in Table I. The pore size distributions are shown in Figure S1. The total surface area and mesopore volume both decrease on increasing incorporation of Pd into the carbon support. This could be due to disruption of the mesopore structure by the growing Pd nanoparticles, which have diameters that exceed the mesopore size. It is also possible that the DAH is displacing the ammonia ligands in the Pd(NH3)4Cl2.H2O complex; we would expect that a primary amine, such as DAH could displace ammonia. This possibility is supported by the observation that the as-synthesized Pd/C monoliths are less mechanically robust than the parent carbon monoliths. DAH crosslinking is known to substantially increase the mechanical strength of these types of carbon monoliths. Changes in amine type and concentration are also known to impact the diameter and extent of mesopore and micropore formation.[Reference Hao, Li, Qian, Wang, Zhang, Zhang, Wang, Schuth, Bongard and Lu24] Measurements of the pH of DAH solutions (Table S1) with and without Pd show pH changes consistent with displacement of the ammonia ligands by the DAH. DAH is a stronger base than is ammonia, and it is observed that as the Pd(NH3)4Cl2.H2O complex is added, the pH drops from a pH of 11.88–11.71 for the 1 wt% Pd complex, to a pH of 11.34 for the 5 wt% Pd complex. DAH contains amine groups at each end of the alkyl chain, and it is possible that more than one ammonia group can be displaced from a Pd ion. This raises the possibility of formation of a coordination polymer in which DAH units bridge two Pd ions. Pd is known to form coordination polymers with aryl nitrogens,[Reference Köcher, Lutz, Spek, Walfort, Rüffer, van Klink, van Koten and Lang25] heterocyclic nitrogens,[Reference Li, Liu, Huang, Yang, Xia and Li20, Reference Netto, Frem and Mauro26, Reference Navarro, Barea, Salas, Masciocchi, Galli, Sironi, Aniad and Parra27] and with bidentate phosphorus containing ligands.[Reference Zhang, Liu, Shen, Hu, Chen, Li and Amoureux28, Reference Paulusse, Huijbers and Sijbesma29] Formation of such a polymer would be predicted to increase the viscosity of solutions of DAH and Pd ions. Viscosity measurements (Table S1) show significant increases in viscosity for DAH/Pd solutions over solutions of just DAH and just Pd(NH3)4Cl2.H2O, consistent with formation of a coordination polymer. As the DAH is bound up with the Pd ions it is less available to interact with the F127 to direct mesopore formation, which is consistent with the loss of ordered mesopores observed in Table I.
Textural properties of Pd/C monolithic materials.
XRD studies
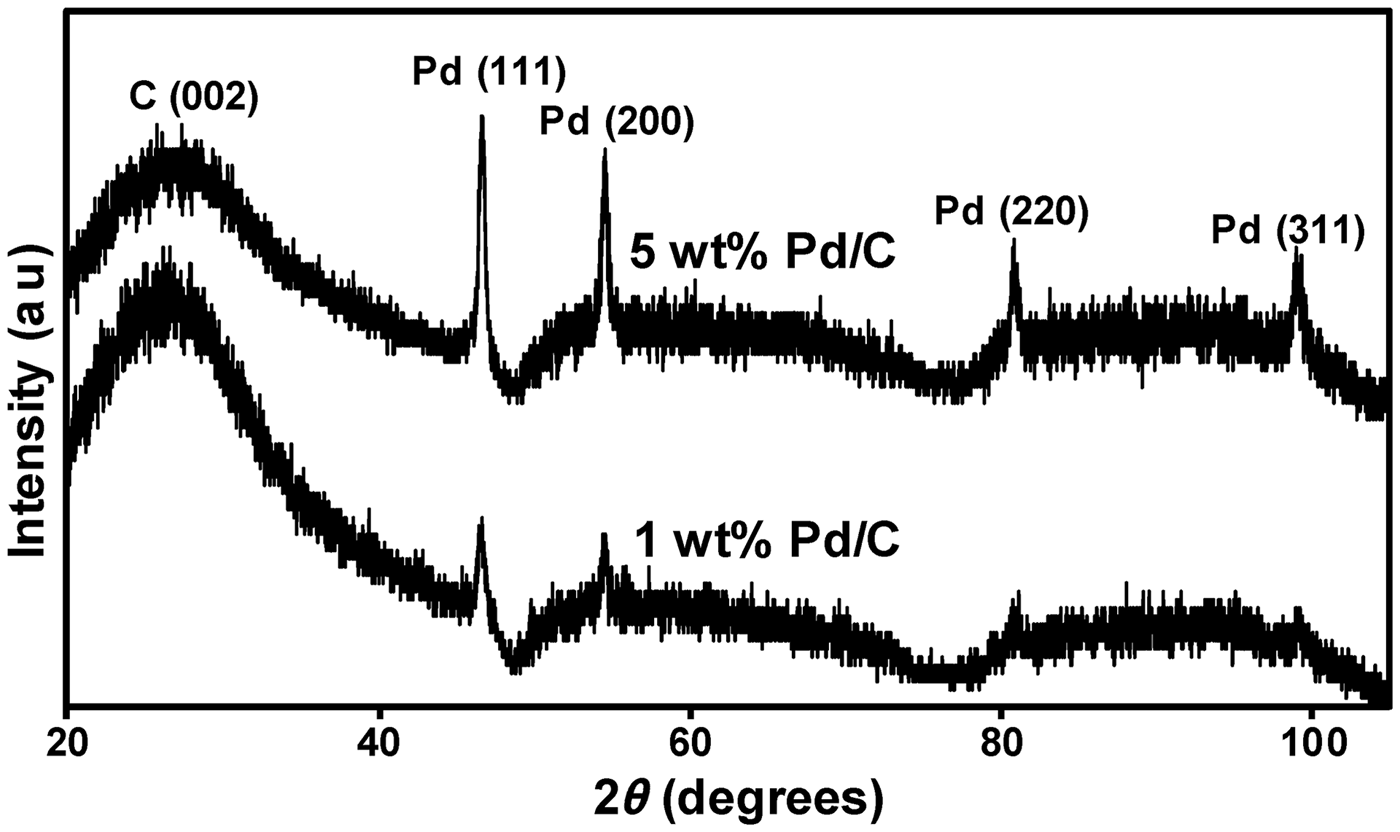
The XRD patterns of the Pd/C materials are shown in the Fig. 3. The XRD pattern of 5 wt% Pd/C predominantly shows peaks characteristic of face-centered cubic (fcc), crystalline Pd corresponding to (111), (200), (220), and (311) facets at 2θ = 46.4°, 54.5°, 80.9°, and 98.9°, respectively. Only the (111) and (200) peaks are seen for the 1 wt% Pd/C. The band at 26.5° observed in both the cases corresponds to amorphous C(002). Debye–Scherrer analysis of the peak linewidths give an estimate of the Pd crystallite size (Table I), which shows that the 5 wt% Pd/C sample has significantly larger Pd nanoparticles. This is in agreement with the observations from the SEM data (Figs. 4 and 5).
X-ray diffractograms of Pd/C monoliths.
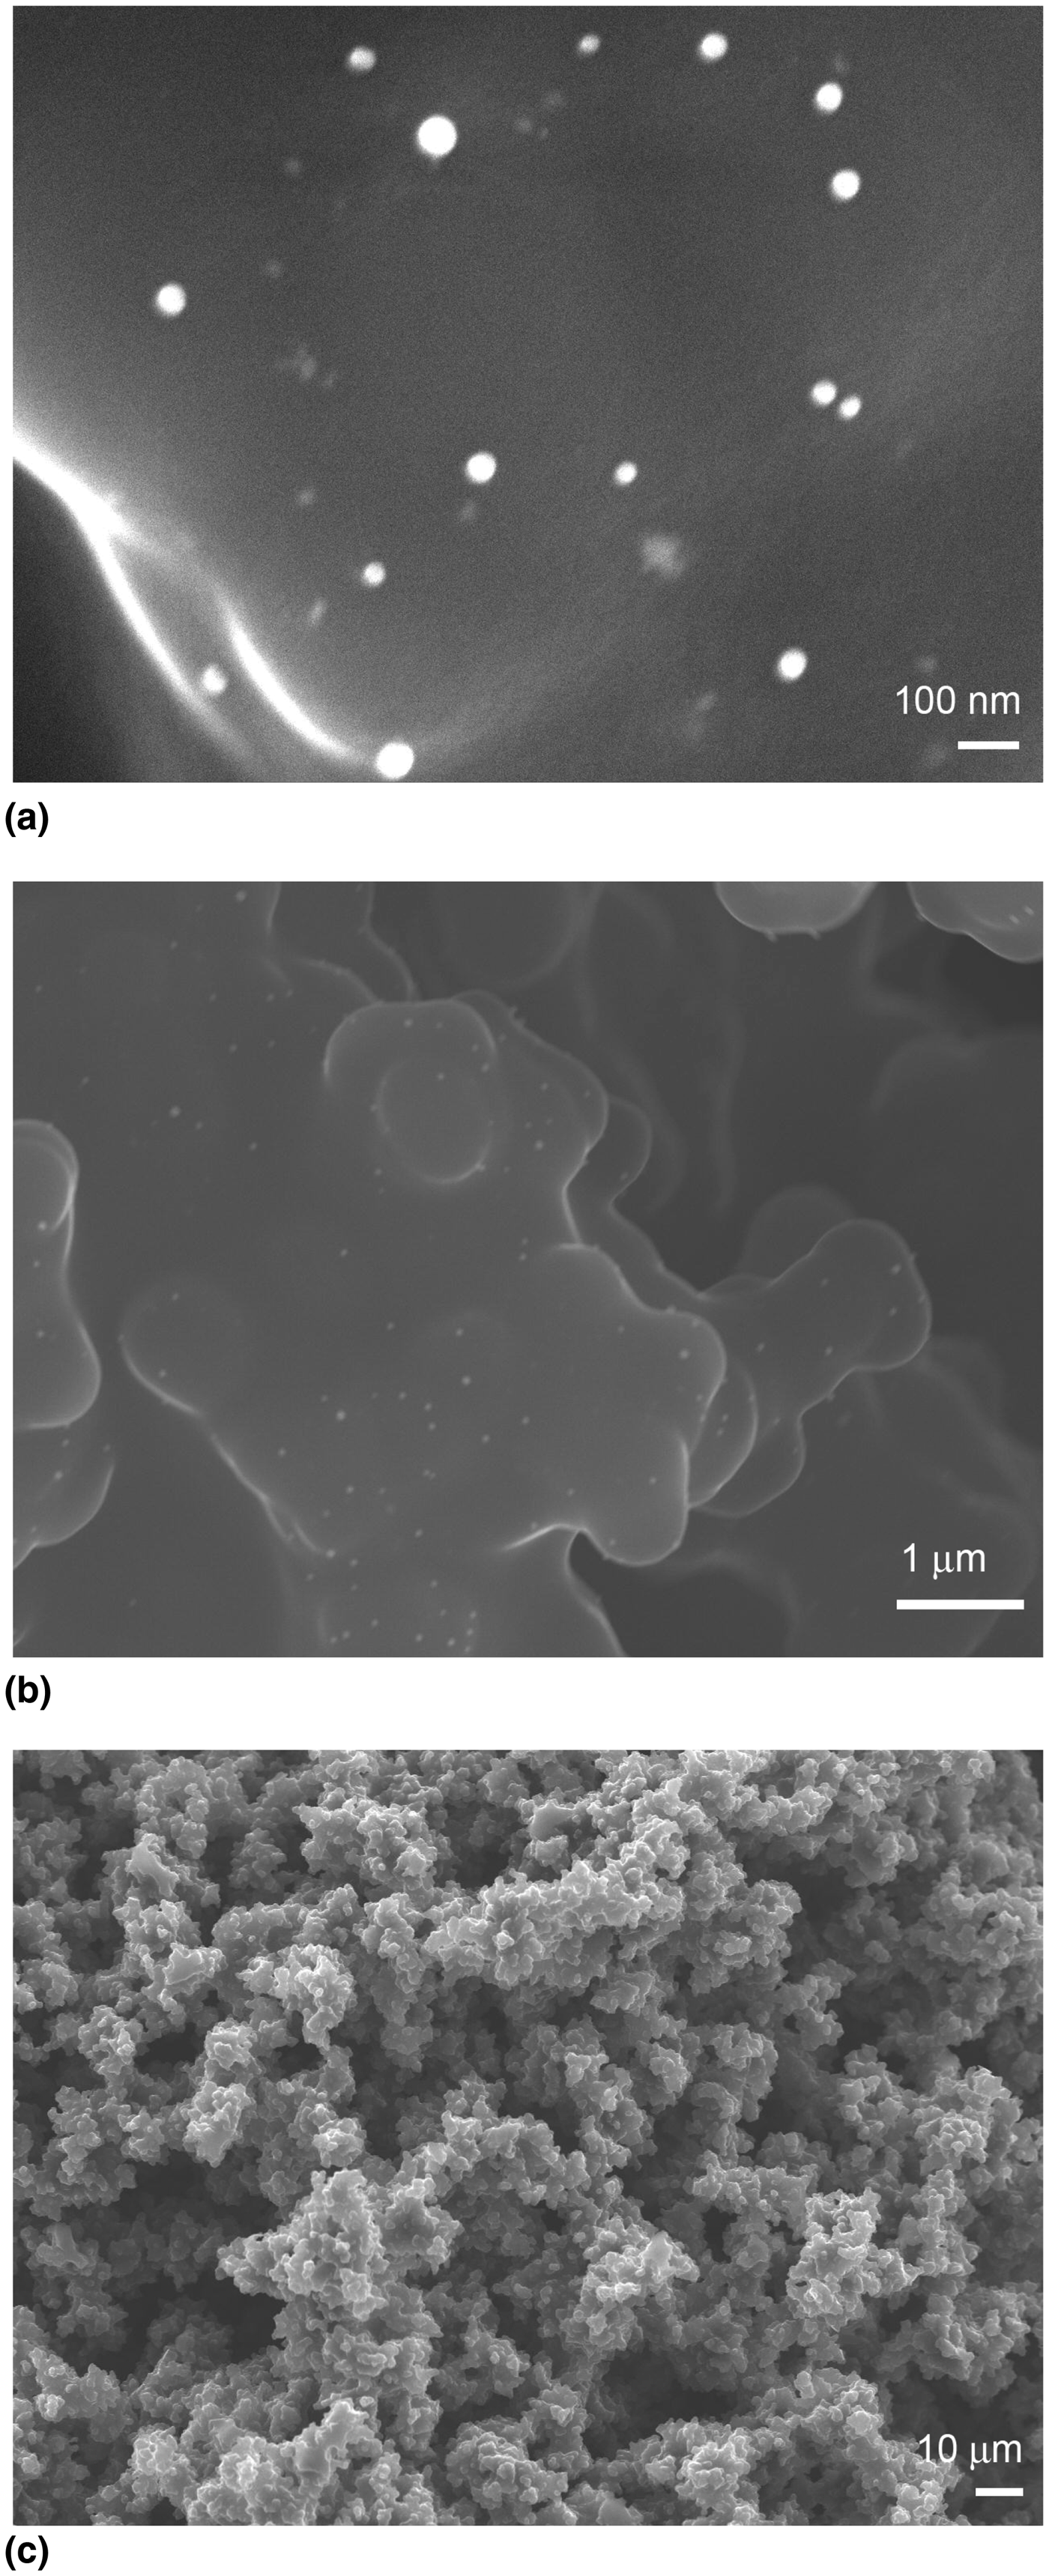
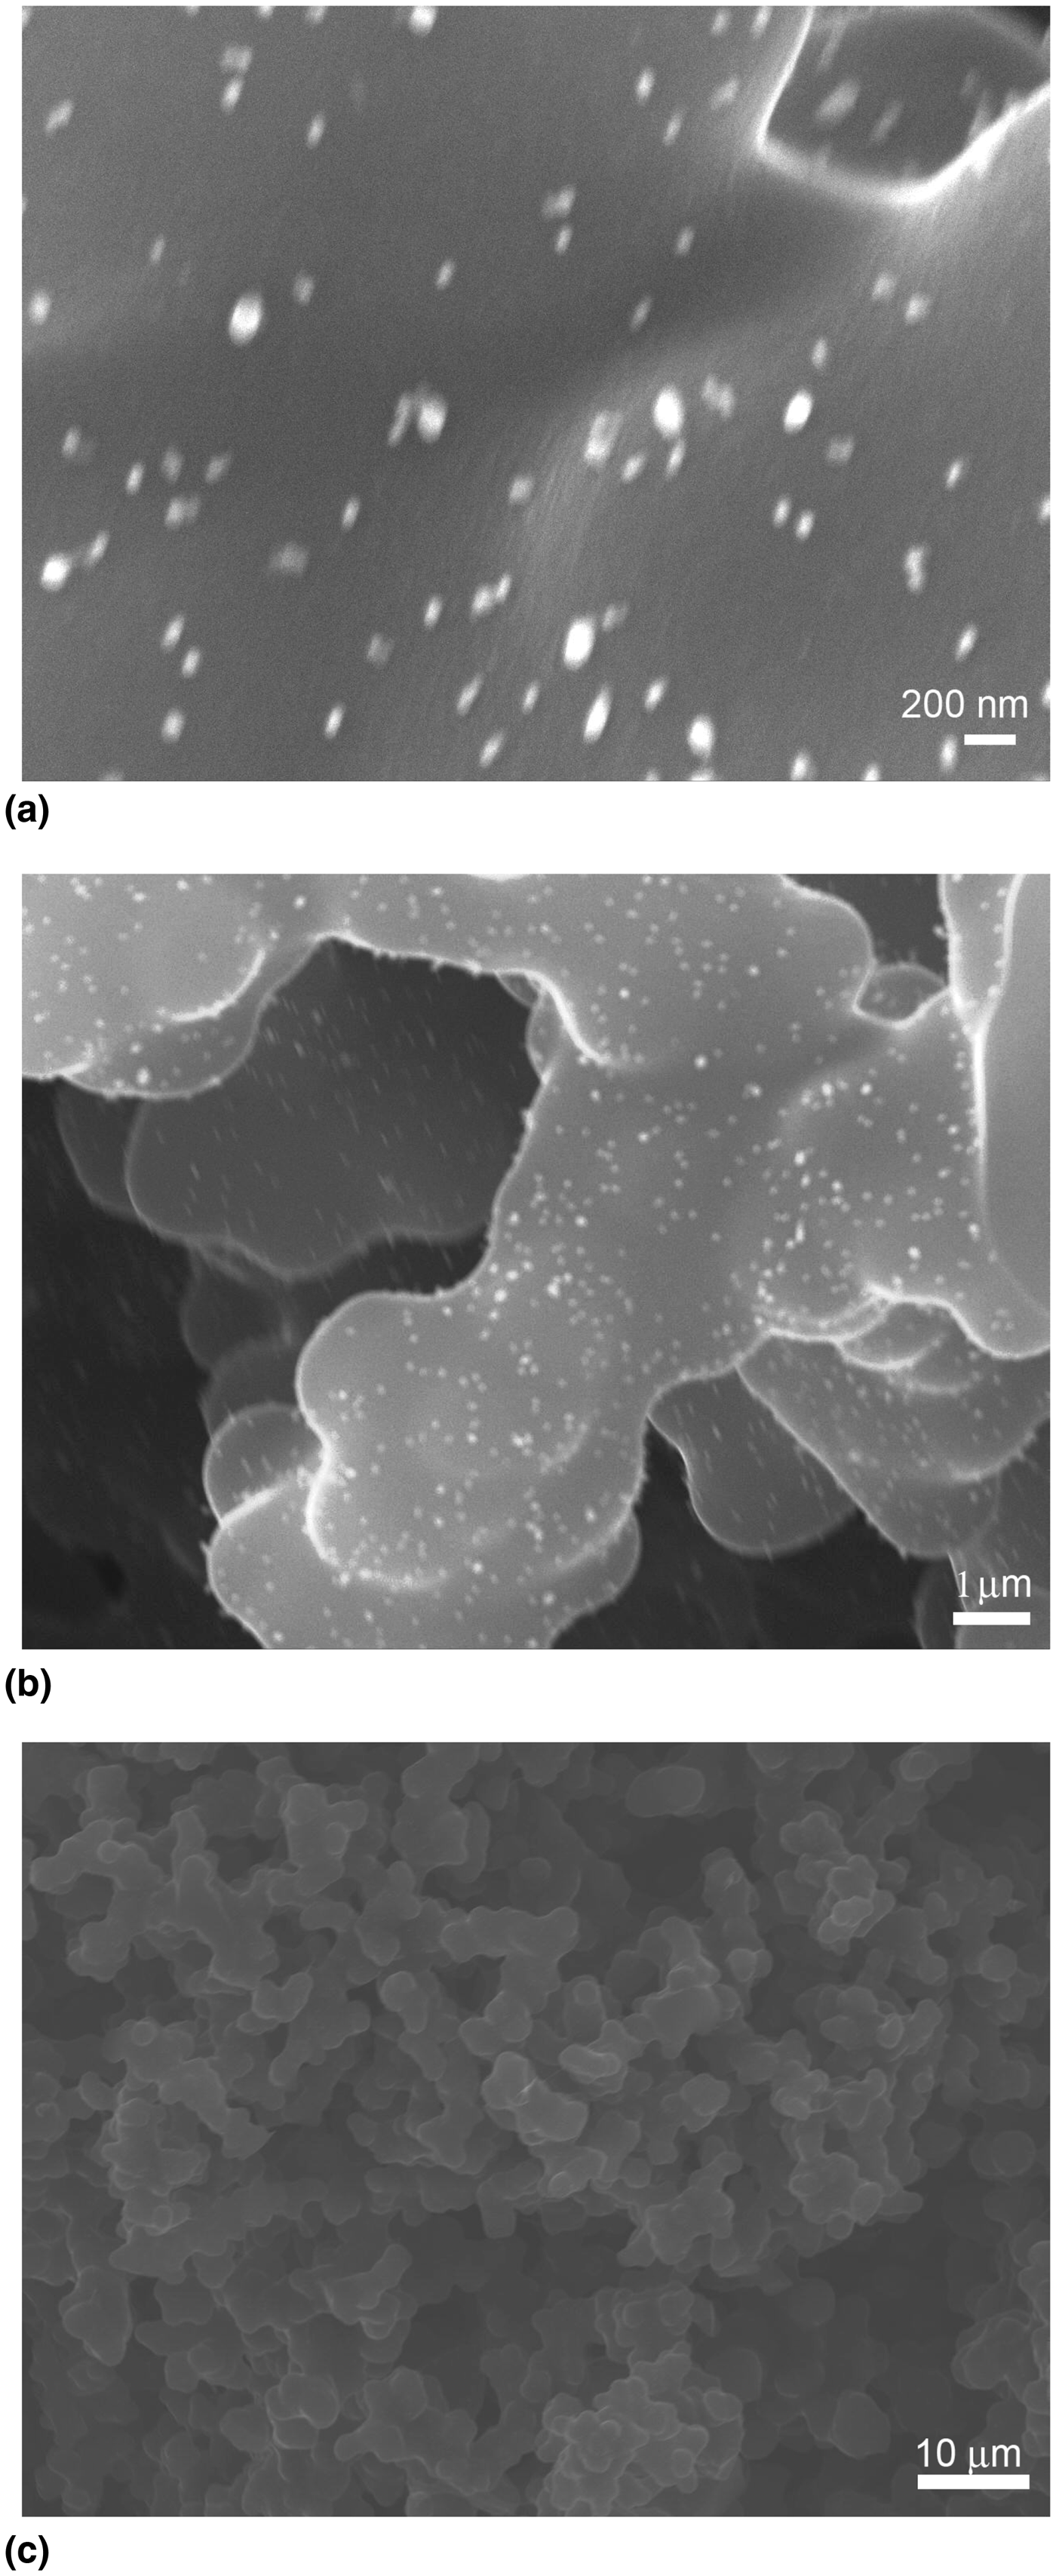
SEM images of 1 wt% Pd/C at different magnifications using secondary electron imaging.
SEM micrographs of 5 wt% Pd/C at different magnifications using secondary electron imaging.
SEM studies
The SEM images of 1 and 5 wt% Pd/C (Figs. 4 and 5, respectively) clearly show that the macroporous nature of the parent material is retained (Figure S2). For both materials, the images show the presence of a three-dimensional disordered sponge-like macroporous network interconnected with ligaments of diameter <10 μm formed from the phase separation that occurred during the synthesis. The macropore diameters were in the range of 3–5 μm. Clearly, the incorporation of Pd during the synthesis did not affect the porous structure of the carbon support at this length scale as the structure matched the porous monoliths reported by Hao et al.[Reference Hao, Li, Qian, Wang, Zhang, Zhang, Wang, Schuth, Bongard and Lu24]
In case of 1 wt% Pd/C, the sizes of Pd particles were in the range of 20–60 nm (Fig. 4). The Pd particles were in the range of 60–100 nm at higher loading i.e., 5 wt% Pd/C as seen in Fig. 5. The Pd particles were found to be uniformly dispersed on the carbon support in both cases, and it was clearly seen that the Pd particles were also present in the crevices of the ligaments along with the ligament walls of the carbon support. No obvious agglomeration was observed in either material with all the Pd particles having spherical or elliptical shapes. This suggests that either migration of nanoparticles is limited during the time the carbon is at high temperature, or that the temperature is sufficiently high to allow complete coalescence of the Pd particles. The co-gelation technique gave a uniform distribution of Pd on the hierarchically porous carbon surface.
Evaluation of catalytic activity
The hydrogenation of styrene (Scheme 1) was carried out as a model reaction to evaluate and compare the catalytic activity of the hierarchically porous Pd/C with commercial JM Pd/C catalyst. The hydrogenation was performed in the batch mode. Both the heterogeneous catalysts were used in powdered form instead of the original monoliths and extrudates in order to ensure comparable access of the reactants to the catalyst surface.
The hierarchically porous 1 wt% Pd/C made by co-gelation showed 36.7% conversion of styrene whereas the 1 wt% Pd/C from JM showed a 51% styrene conversion. A low styrene conversion of 13% was obtained when 5 wt% Pd/C was used as catalyst. This is consistent with the lower SA, the lower mesopore volume and the larger Pd particles observed for 5 wt% Pd/C. The formation of ethyl benzene was confirmed by comparison of the retention time of the product with the measured retention time of pure ethyl benzene under the same conditions.
Leaching tests
Another objective of the present work was assessing the stability of the Pd particles on the carbon support, which is of primary concern for heterogeneous catalysts used in fixed bed reactors. To evaluate this stability, leaching tests were performed by using the monoliths as microreactors in a continuous flow system. A known amount of EtOH (250 ml) was continuously pumped through the microreactor at a flow rate of 2.1 ml/min. The effluent was collected and analyzed by AAS to evaluate the Pd concentration in the spent solution. A total loss of Pd from 1 wt% Pd/C was found to be 18%, whereas 23% Pd was found to leach from 5 wt% Pd/C. These values are comparable to commercial JM 1 wt% Pd/C catalyst extrudates where the leaching test found a total of 12% loss of Pd.
Conclusions
The novel co-gelation technique has been successfully applied for the synthesis of hierarchically porous Pd/C monoliths. The final structure showed the presence of both meso- and macropores that are expected to be beneficial for heterogeneous catalysis where reactants and products diffuse to the internal surface of the carbon support for access to the active Pd species present in the pores. Batch hydrogenations of styrene showed that the crushed Pd/C monoliths have similar catalytic activity to the commercial catalyst. Leaching tests showed that the Pd/C materials synthesized by the co-gelation technique were comparable to the JM catalysts in loss of Pd. The shorter synthesis makes these materials of potential commercial interest.
The monolithic form of the co-gelation produced Pd/C makes it particularly suitable for use in microreactors, and these Pd/C monoliths will be screened in microreactors for various hydrogenations, reductions, and C–C couplings.
Conflict of interest
None.
Supplementary materials
For supplementary material for this article, please visit http://dx.doi.org/10.1557/mrc.2015.7
Acknowledgments
The authors acknowledge the CAF at the University of Alabama for support and technical assistance. TVK acknowledges the Research Simulation program for support. The authors wish to acknowledge the suggestion from one of the reviewers that a Pd coordination polymer was being formed.