1. INTRODUCTION
The “Safety Level Approach” (SLA) has been proposed by the International Maritime Organization (IMO) to develop goal-based standards using a risk-based methodology (IMO, 2005). SLA is the structured application of risk-based methodologies for the IMO rule-making process (IMO, 2016). It is essentially a process of application of risk analysis and risk management theory to maritime safety standard-setting and it will provide the IMO with a basis for guiding work for continuous improvement.
There are five elements in the structure of the SLA. As a starting point for the application of SLA, safety levels should be incorporated into the first element named safety goals. In order to avoid sudden discontinuities in setting safety goals, it is necessary to measure the tolerance degree of the current safety level. It should be noted that, in the context of the IMO's SLA, the required safety level reflected in the goals should address as a minimum: safety of life at sea, including occupational health and safety of the ship and prevention and control of pollution from the ship (IMO, 2016). Only the safety goals for people on board are considered in this work.
Societal Risk (SR) is an expression of average risk, in terms of fatalities, experienced by a whole group of people exposed to an accident scenario. Usually SR is taken to be the risk of death and can be expressed as a risk matrix, Frequency-Fatality (FN) diagrams, or the average number of fatalities per year, which is typically known as Potential Loss of Life (PLL) (European Maritime Safety Agency, 2015a). A risk matrix displays the basic properties, “consequence” and “likelihood” of an adverse risk factor and the aggregate notion of risk by means of a graph. As both the consequence and likelihood in the risk matrix are measured by a category scale, applications of the risk matrix are limited in practice (Hsu et al., Reference Hsu, Lian and Huang2017). PLL is defined as the expected value of the number of fatalities per year, which can be taken as a one-dimensional measurement of SR. SR expressed by FN diagrams shows the relationship between the cumulative frequency of an accident and the number of fatalities in a two-dimensional diagram. PLL is a simpler format of SR than the FN diagram (IMO, 2013). Since the two-dimensional graphical presentation of SR can be used to show ‘existing’ and ‘upgraded’ process performance, and overcomes some statistical problems of one-dimensional measures of SR (Prugh, Reference Prugh1992), the FN diagram is a more appropriate choice for the representation of SR in the context of the IMO's SLA.
In the literature, different methods for establishing FN criteria have been proposed. The FN criteria can be taken as reference FN curves for SR assessment purposes. The mathematical formalism of the FN curve has been introduced (Cox and Baybutt, Reference Cox and Baybutt1982), and improved continuously (Vrijling et al., Reference Vrijling, van Hengel and Houben1995; Hirst, Reference Hirst1998; Jonkman et al., Reference Jonkman, van Gelder and Vrijling2003; Horn et al., Reference Horn, Fulton and Westcott2008), which provide the basis for the determination of FN criteria. After theoretically analysing the relationship between SR and Individual Risk (IR) (Jonkman et al., Reference Jonkman, Vrijling and van Gelder2006), FN criteria can be formulated to be fully consistent with IR criteria (Schofield, Reference Schofield1993; Mona, Reference Mona2014). Furthermore, based on historical FN curves, FN criteria can also be established. For example, in Kaneko et al. (Reference Kaneko, Arima, Yoshida and Yuzui2015), the FN criteria are developed by multiplying a parameter with the historical FN curve. In Zhang et al. (Reference Zhang, Luo, Pei, Hao, Zeng and Yang2015), the bounds of the 95% confidence interval of the historical FN curve are taken as the FN criteria.
Although it is theoretically obvious that IR and SR calculations should lead to equal expected values, they might not always be consistent since the two risk indices are proposed based on distinct perspectives in practice (Qu et al., Reference Qu, Yang, Liu, Jin and Weng2014). Furthermore, it should be noted that serious accidents are very rare events which do not necessarily occur at regular intervals, so that FN criteria should not be based just on historical data, but also take the authority's point of view of how much risk is tolerable into consideration (Trbojevic, Reference Trbojevic2006; Skjong and Eknes, Reference Skjong and Eknes2002).
An alternative way of establishing FN criteria, which is widely used in Formal Safety Assessment (FSA), is based on the economic importance of the activity and calibrated against the average fatality rate per portion of Gross National Product (GNP) (Trbojevic, Reference Trbojevic2006; IMO, 2000). The FN criteria can be treated as guidelines that help encourage a reduction of risks of a catastrophe (European Maritime Safety Agency, 2015a), rather than as a basis for setting safety goals. In order to set appropriate levels for safety goals in the context of the IMO's SLA, new FN criteria need to be established.
In this article, a practical method for evaluating SR is proposed in the context of the IMO's SLA. The method consists of two steps. The first step is to establish new FN criteria which are fully consistent with revised IR criteria. The revised IR criteria can be obtained according to the principle of continuous improvement and calibrated with the current IR criteria. The second step is based on the new FN criteria. Dynamic factors are defined to express risk aversion, providing a numerical measure of tolerance degree. Finally, the method is verified by applying it to a SR evaluation of cruise ships and Roll-On Roll-Off Passenger (RoPax) ships.
The remainder of the paper is structured as follows. In Section 2, basic definitions of IR and SR criteria are described. Furthermore, principles and steps for establishing risk criteria are summarised. Section 3 discusses the modelling process for new FN criteria and dynamic factors for expressing risk aversion. In Section 4, a case study into the societal risk evaluation of cruise ships and RoPax ships is conducted. Findings and limitations are provided in the last section.
2. INDIVIDUAL RISK CRITERIA AND SOCIETAL RISK CRITERIA
2.1. Definition
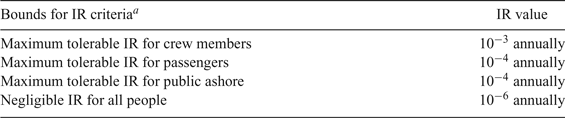
Individual risk (IR) is defined as the risk of death, injury and ill health as experienced by an individual at a given location (IMO, 2013). The purpose of IR criteria is to limit the risks to people on board the ship or to individuals who may be affected by shipping accidents. The current IMO IR criteria are listed in Table 1 (IMO, 2000).
IR criteria.

a Note that the names of bounds for IR criteria in this research are derived from IMO (2000).
The IR criteria in Table 1 are typically used as outer limits in a process that tries to make the risks as low as reasonably practicable in the context of FSA (European Maritime Safety Agency, 2015a). However, unlike IR, Societal Risk (SR) represents the risk to a group of people (IMO, 2013). The purpose of SR criteria is to limit the risks from ships to society as a whole, and to local communities which may be affected by ship activities (IMO, 2000). It has been discussed in the introduction that FN criteria can be used to evaluate SR. When plotted on log-log scales, the FN criteria are mostly depicted as straight lines. This way, the generated line is not based just on historical data, but also on the authority judgments and discretion (Skjong and Eknes, Reference Skjong and Eknes2002). The FN criteria (IMO, 2000) can be expressed as:
 $$\eqalign{PLL_{upperbound} &=\sum\limits_{N=1}^{N_u} {Nf_{upperbound-N}} =F_{upperbound-1} \left(\displaystyle{{1}\over{N_u^{b-1}}}+\sum\limits_{N=1}^{N_u -1} {\displaystyle{{(N+1)^b-N^b}\over{N^{b-1}(N+1)^b}}} \right) \cr PLL_{lowerbound} &=\sum\limits_{N=1}^{N_u} {Nf_{lowerbound-N}} =F_{lowerbound-1} \left(\displaystyle{{1}\over{N_u^{b-1}}}+\sum\limits_{N=1}^{N_u -1} {\displaystyle{{(N+1)^b-N^b}\over{N^{b-1}(N+1)^b}}} \right)}$$
where PLL upperbound (or PLL lowerbound) is the maximum tolerable (or negligible) number of fatalities per ship year, f upperbound−N (or f lowerbound−N) is the maximum tolerable (or negligible) frequency of occurrence of an accident involving N fatalities, F upperbound−1 (or F lowerbound−1) is the maximum tolerable (or negligible) frequency of accidents involving one or more fatalities, and b denotes the negative of the slope of the FN criteria on log-log scales. N u is the upper limit of the number of fatalities that may occur in one accident, which is well defined as the maximum number of people on board a ship.
2.2. Principles for Establishing Risk Criteria
In the literature, various principles can be utilised for establishing appropriate risk criteria in various transport modes. The adopted principles will naturally influence the criteria selected. Furthermore, by applying principles, it may be ensured that the risk criteria are based on a sound rationale and that they may easily be justified in a transparent manner (Vanem, Reference Vanem2012).
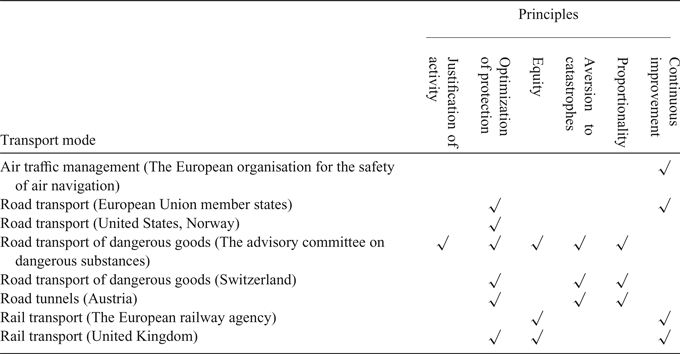
Based on the review provided in European Maritime Safety Agency (2015a), the principles for establishing risk criteria in other transport modes are briefly outlined in Table 2, which may be appropriate to the application of maritime risk criteria.

Although when resources are limited some of the principles discussed in Table 2 seem to be in opposition to each other, they are often used to compliment of each other in risk management and for setting safety goals (European Maritime Safety Agency, 2015a; Skjong et al., Reference Skjong, Vanem and Endresen2007).
2.3. Steps for risk criteria establishment
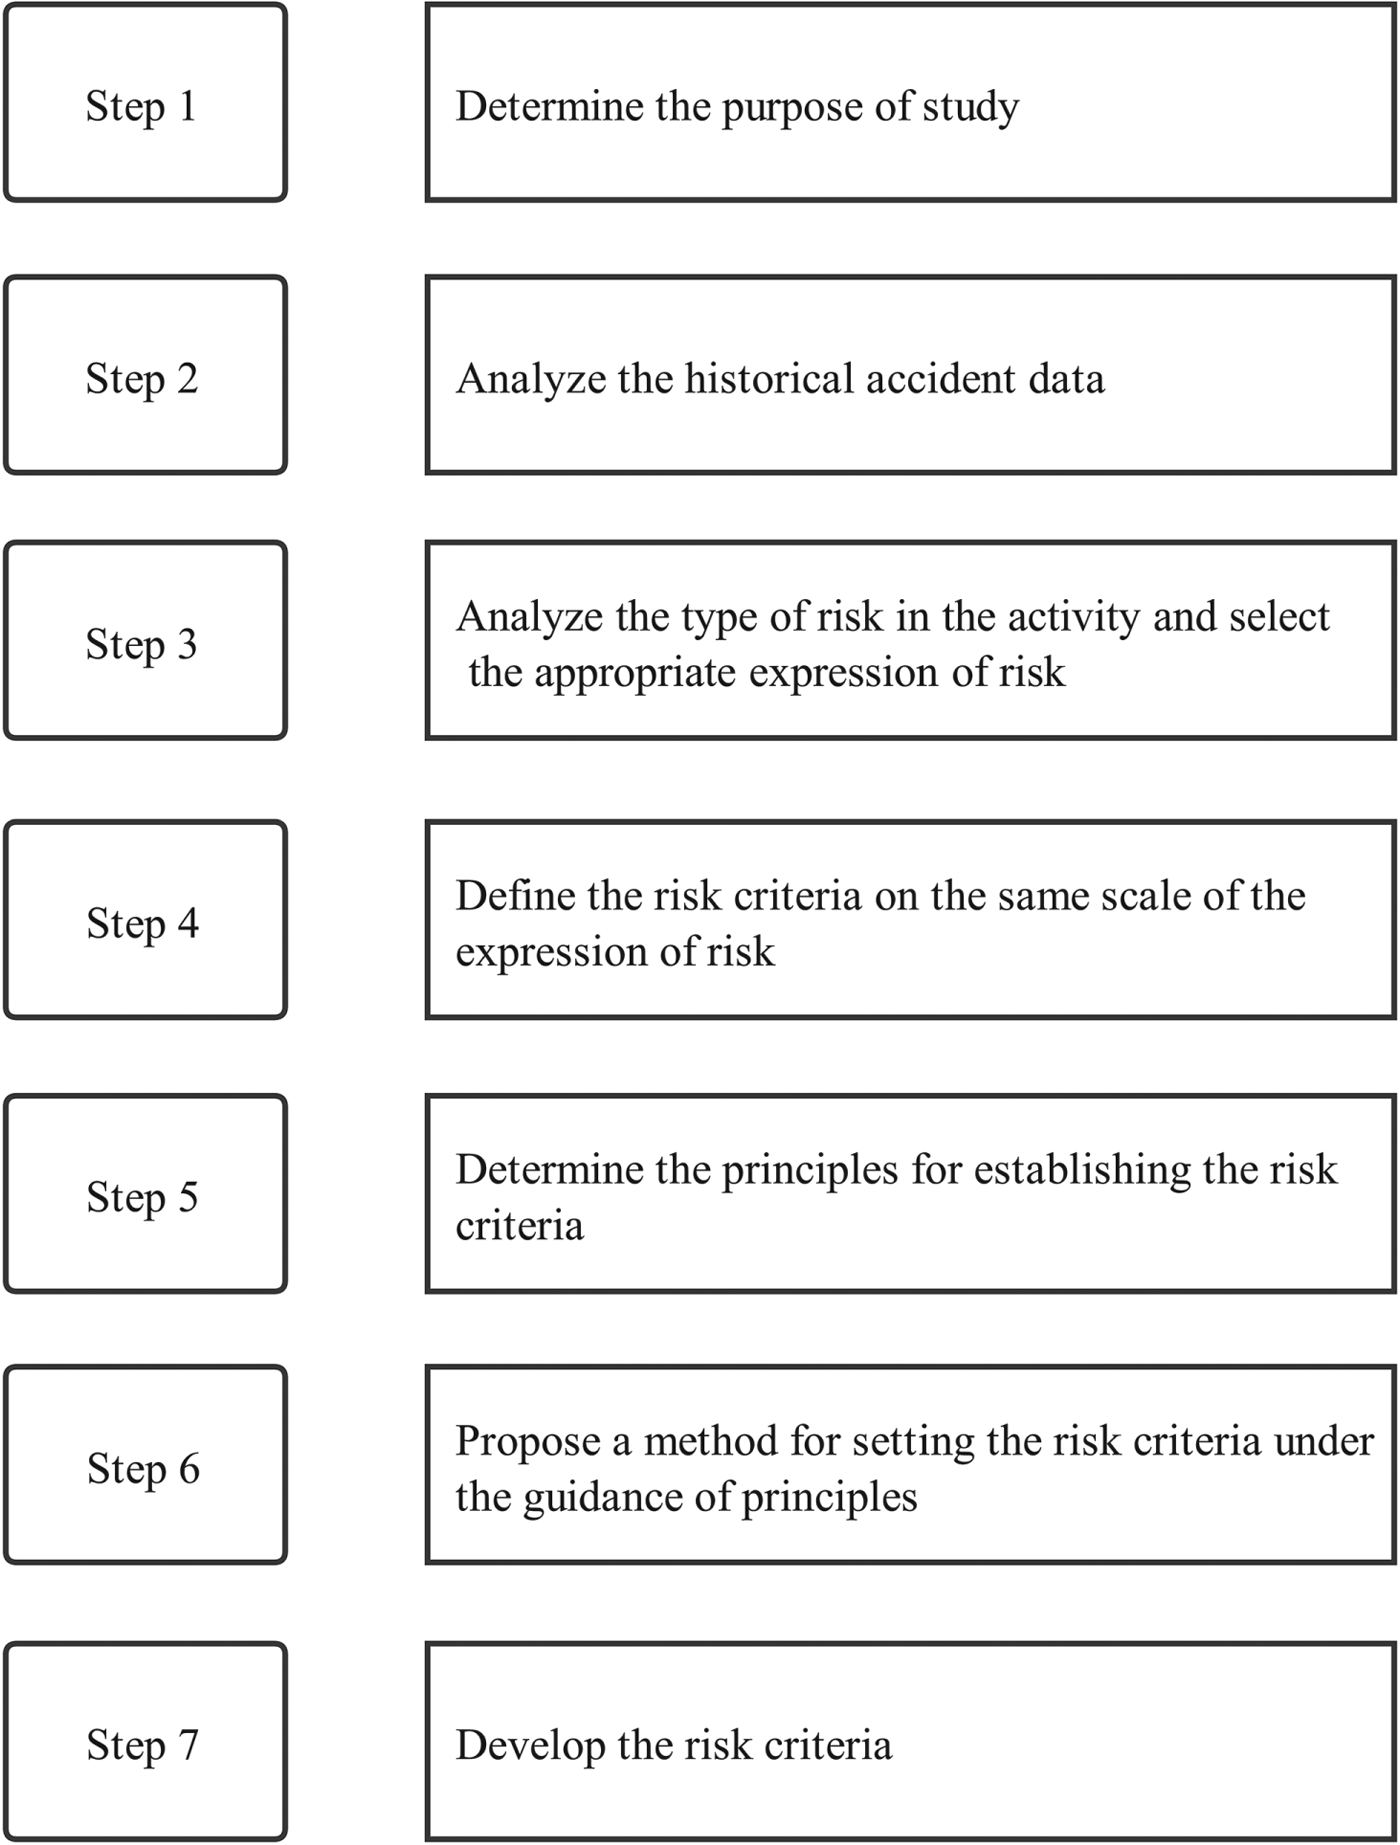
Based on the literature review, various important points need to be considered when formulating risk criteria (Rodrigues et al., Reference Rodrigues, Arezes and Leão2015). The flowchart presented in Figure 1 schematises the key steps to develop risk criteria for the shipping industry.
Steps to develop risk criteria for the shipping industry.

The seven steps in Figure 1 are described as follows. First, the purpose of the study should be presented clearly, which is crucial for the next steps. Second, in order to know what types of risks are involved, historical accidents need to be analysed. Third, based on the intention of the analysis, the appropriate expression of risk should be selected. For instance, FN diagrams are a better expression of SR than PLL in the context of the IMO's SLA. Fourth, risk criteria should be defined on the same scale of the expression of risk, for example, FN criteria are needed for the evaluation of SR expressed by FN curves. Fifth, different principles for setting risk criteria for the shipping industry can be found in Section 2.2. Sixth, under the guidance of the selected principles, methods for setting risk criteria should be proposed. Finally, the risk criteria are established.
3. A PRACTICAL METHOD FOR EVALUATING SR
3.1. Setting New FN Criteria
In general, safety goals need to be set based on the current safety level and risk criteria. Following the steps presented in Figure 1, risk criteria will be developed. To set safety goals for people on board, new risk criteria need to be established (step 1). Based on the discussion in the introduction, FN diagrams have been selected as the expression of SR (steps 2-3), and FN criteria need to be developed, which are on the same scale as the expression of SR (step 4). Because of the implementation of new regulations and constant renewal of fleets, the principle of continuous improvement is chosen to guide the establishment of new FN criteria which can be used in the context of the IMO's SLA (step 5).
The sixth step is to propose a method to establish the new FN criteria. This paper intends to develop new FN criteria consistent with the revised IR criteria. This idea is based on a simple formula for PLL (Kaneko et al., Reference Kaneko, Arima, Yoshida and Yuzui2015) as follows:
 $$\eqalign{ IR_{upperbound} N_u &=PLL_{upperbound} =\sum\limits_{N=1}^{N_u} {Nf_{upperbound-N}} \cr IR_{lowerbound} N_u &=PLL_{lowerbound} =\sum\limits_{N=1}^{N_u} {Nf_{lowerbound-N}}}$$
where IR upperbound (or IR lowerbound) is the maximum tolerable (or negligible) IR. It must be pointed out that IR upperbound and IR lowerbound are different from the current IR criteria in IMO regulations since they are used to develop the new FN criteria in the context of the IMO's SLA. In order to make it possible to do so, the worst-case IR derived from the annual data is chosen to be the IR upperbound according to the principle of continuous improvement. As 10−6 is mostly accepted as a negligible IR criteria (Chakrabarti and Parikh, Reference Chakrabarti and Parikh2013), the IR lowerbound of all types of ships can be set to 10−6 for simplicity. Furthermore, to take the uncertainty in the IR calculation into consideration, the worst-case IR is revised by multiplying by a value of ten. In order to confirm that the worst-case IR is not over-enlarged, the IR upperbound of passengers should not be higher than the maximum tolerable risk for crew, which is 10−3 annually. That is, the IR upperbound of passengers should be assigned a value equal to the lower value of the revised worst-case IR and the maximum tolerable risk for crew. Similarly, the IR upperbound for crew should be assigned a value equal to the lower value of the revised worst-case IR and ten times the maximum tolerable risk for crew, which equals 10−2 annually. In this paper, new FN criteria are also depicted as straight lines on log-log scales. Therefore, from Equations (1) and (2), Equation (3) can be derived.
 $$\eqalign{IR_{upperbound} N_u &=F_{upperbound-1} \left(\displaystyle{{1}\over{N_u^{b-1}}}+\sum\limits_{N=1}^{N_u -1} {\displaystyle{{(N+1)^b-N^b}\over{N^{b-1}(N+1)^b}}} \right) \cr IR_{lowerbound} N_u &=F_{lowerbound-1} \left(\displaystyle{{1}\over{N_u^{b-1}}}+\sum\limits_{N=1}^{N_u -1} {\displaystyle{{(N+1)^b-N^b}\over{N^{b-1}(N+1)^b}}} \right) }$$
According to the definition of b, the slope of the FN criteria on log-log scales equals −1 when b is assumed to be 1, which means that FN criteria represent the ‘accident size neutral’ criteria (Health and Safety Executive, 2003). When b is set to 1, Equation (3) simplifies to:
 $$\eqalign{ IR_{upperbound} N_u &=F_{upperbound-1} \sum\limits_{N=1}^{N_u} {\displaystyle{{1}\over{N}}} \cr IR_{lowerbound} N_u &=F_{lowerbound-1} \sum\limits_{N=1}^{N_u} {\displaystyle{{1}\over{N}}} }$$
It is reasonable that the new FN criteria are chosen to have a slope of −1 because dynamic factors are proposed to express risk aversion in the process of measuring the tolerance of SR, which will be discussed in Section 3.2. When N u of one type of ship is set, F upperbound−1 and F lowerbound−1 can be calculated. Finally, the new upper and lower bound FN criteria can be described as straight lines with a slope of −1 and a certain intercept on log-log scales. It should be noted that when FN curves cross the new upper bound FN criteria, the system should not be regarded as intolerable, but an indication that the tolerance of FN curves may be relatively low.
3.2. Tolerance Measurement
In order to avoid sudden discontinuities, safety goals of SR need to be set based on the current SR and should present continuous improvement. Therefore, a method to compare various FN curves is needed. Based on the new upper bound FN criteria, this paper proposes an approach to measure the tolerance of FN curves, which can be used as a tool to compare FN curves. The idea is to use the equivalent average distance between the FN curve and the new upper bound FN criteria as an indicator of risk tolerance. The equivalent average distance is defined as:
 $$\eqalign{{T}' &=\sum\limits_{N=N_{\min}}^{N_{\max}} (F_{upperbound-N} - F_N)g_N^\prime \quad If\ F_{upperbound-N} >F_N \cr {T}'' &= \sum\limits_{N=N_{\min}}^{N_{\max}} (F_N -F_{upperbound-N})g_N^{\prime\prime}\quad If\ F_{upperbound-N} < F_N \cr g_N^{\prime\prime} &= \displaystyle{{1}\over{g_N ^\prime}} \cr T &=\displaystyle{{1}\over{n}}({T}'-{T}'')}$$
where T′(orT″) is the sum of distances when F upperbound−N >F N (or F upperbound−N upperbound-NF N) which means that the FN curve is below (or above) the new upper bound FN criteria, F N is the frequency of accidents involving N or more fatalities, F upperbound−N is the maximum tolerable frequency of accidents involving N or more fatalities and T denotes the equivalent average distance between the FN curve and the new upper bound FN criteria. N max (or N min) is the maximum (or minimum) value of N, which is obtained by a risk analysis model, such as an event tree model. n is the total number of possible values of N, which is used for averaging (T′ − T″).  $g_{N}^{\prime}$ (or
 $g_{N} ^{\prime\prime}\rpar $ is proposed as a dynamic factor to express risk aversion since the actual distances F upperbound−N −F N (or F N −F upperbound−N) cannot be added directly when N becomes larger. Risk aversion can be discerned from two aspects. On one hand, the degree of risk aversion increases as N increases; on the other hand, it also increases as F N − F upperbound−N (if F upperbound−N <F N) increases. The idea is to express risk aversion by transforming the actual distances to the equivalent distances when N is N min. It should be noted that two conditions need to be satisfied for the determination of
 $g_{N}^{\prime} $(or
 $g_{N}^{\prime \prime}\rpar $. First,
 $g_{N}^{\prime} $ (or
 $g_{N} ^{\prime \prime}\rpar $ decreases (increases) and decreases (increases) faster when N increases. That is, the degree of risk aversion increases as N increases, and the increase in velocity of the risk aversion increases with increasing N. Second,
 ${g}'_{N_{\min}}$ (or
 ${g}''_{N_{\min}}\rpar $ equals 1. This means that the actual distance equals the equivalent distance when N is N min. The initial rate of change of
 $g_{N}^{\prime} $ (or
 $g_{N}^{\prime \prime}\rpar $ is set to zero for the simplification. Furthermore, the authority needs to select an appropriate value
 ${g}'_{N_{\max}}$ (or
 ${g}''_{N_{\max}}\rpar $ which represents the maximum degree of risk aversion. Based on the above discussion, it is reasonable to set
 $g_{N}^{\prime \prime}$ to the reciprocal of
 $g_{N}^{\prime} $. Therefore, the actual distances are all transformed into the equivalent distances when N is N min. If the equation of
 $g_{N}^{\prime}$ is a parabola,
 $g_{N}^{\prime}$ is defined as follows:
 $$(N-h)^2 =4p({g}'_N -k)$$
where h and k are the coordinates of the vertex (h, k) of the parabola and p is the distance from the vertex to the focus. Equation (6) can be solved by taking in vertex (N min, 1) and point (N max,  ${g}'_{N_{\max}}\rpar $. When
 $g_{N}^{\prime}$ is obtained,
 $g_{N}^{\prime\prime}$ is just the reciprocal of
 $g_{N}^{\prime}$.
In general, the tolerances of FN curves are comparable when they are derived from the same upper bound FN criteria. For FN curves with the same N min, the equivalent average distances can be directly compared, which is the indicator of risk tolerance. However, for FN curves with different N min, further processing is required for the comparison of the equivalent average distances. It is noted that the comparison is much easier when one FN curve lies wholly below another one. This paper proposes to transform all FN curves to equivalent FN curves. The equivalent FN curves are straight lines which have the same degree of tolerance as the original FN curves and are parallel to each other with the same slope as the FN criteria. The idea is to make it possible to compare FN curves with different N min because a spatial relationship between parallel lines is easy to identify. The equivalent FN curves are defined as:
 $$\eqalign{ T&=\displaystyle{{1}\over{n}}\sum\limits_{N=N_{\min}}^{N_{\max}} (F_{upperbound-N} -{F}'_N){g}'_N \quad If\ T>0 \cr T&=\displaystyle{{1}\over{n}}\sum\limits_{N=N_{\min}}^{N_{\max}} (F_{upperbound-N} - F'_N){g}''_N \quad If\ T< 0 }$$
where  ${F}'_{N}$ denotes the equivalent frequency of accidents involving N or more fatalities. As the slope of the equivalent FN curves equals −1, the right-hand side of Equation (7) can be further simplified according to the following process:
 $$\eqalign{ \log_{10} F_{upperbound-N_{\min}} &=-\log_{10} N_{\min} +\log_{10} F_{upperbound-1} \cr \log_{10} F_{upperbound-N_{\max}} &=-\log_{10} N_{\max} +\log_{10} F_{upperbound-1} \cr \log_{10} \displaystyle{{F_{upperbound-N_{\min}}}\over{F_{upperbound-N_{\max}}}}&=\log_{10} \displaystyle{{N_{\max}}\over{N_{\min}}} \cr F_{upperbound-N_{\max}} &=\displaystyle{{N_{\min}}\over{N_{\max}}}F_{upperbound-N_{\min}} \cr Similarly,{F}'_{N_{\max}} &=\displaystyle{{N_{\min}}\over{N_{\max}}}{F}'_{N_{\min}} \cr F_{upperbound-N_{\max}} -{F}'_{N_{\max}} &=\displaystyle{{N_{\min}}\over{N_{\max}}}F_{upperbound-N_{\min}} -\displaystyle{{N_{\min}}\over{N_{\max}}}{F}'_{N_{\min}} \cr &=\displaystyle{{N_{\min}}\over{N_{\max}}}(F_{upperbound-N_{\min}} -{F}'_{N_{\min}})}$$
where  $F_{upperbound-N_{\min}}$ (or
 $F_{upperbound-N_{\max}}\rpar $ is the maximum tolerable frequency of accidents involving N min or more fatalities (or N max or more fatalities),
 ${F}'_{N_{\min}} $ (or
 ${F}'_{N_{\max}}\rpar $ is the equivalent frequency of accidents involving N min or more fatalities (or N max or more fatalities). It should be noted that the above process is based on the discussion in Section 2.1 that the FN criteria are depicted as straight lines plotted on log-log scales. Equation (8) indicates that all
 $F_{upperbound-N} -{F}'_{N} $ can be transformed to the format of
 $F_{upperbound-N_{\min}} - {F}'_{N_{\min}}$. Therefore, the equivalent FN curves can be obtained.
4. CASE STUDY
The methods illustrated in Section 3 have been applied to the FSA reports of cruise ships and RoPax ships from the European Maritime Safety Agency (2015b) and IMO (2008) (hereafter both reports are called the FSA report).
4.1. New FN Criteria in the Context of the IMO's SLA
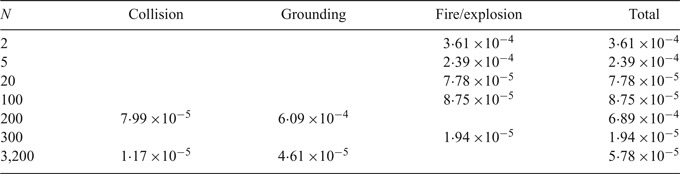
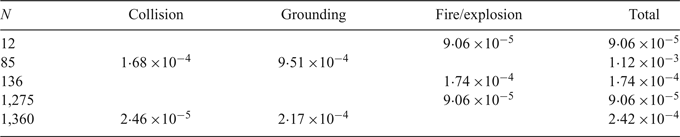
The risk levels of cruise ships and RoPax ships are dominated by collision, grounding and fire/explosion scenarios according to the FSA report. Therefore, the number of fatalities caused by the three types of accidents and the number of ship years are summarised for the period 2000 to 2012, as shown in Tables 3 and 4.
Fatalities from the three types of cruise accidents and ship years of cruise ships between 2000 and 2012.

Fatalities from the three types of RoPax ship accidents and ship years of RoPax ships between 2000 and 2012.

In the FSA report, 4,000 people are assumed on board a cruise ship and 1,700 on a RoPax ship during the period 2000 to 2012. As the number of passengers is considerably larger than the number of crew, when it comes to IR, for simplification, all people on board are treated as passengers. From the given fatality data and ship years data in Tables 3 and 4, the number of fatalities per ship year, PLL, for cruise ships and RoPax ships can be estimated. Based on the assumed number of people on board a cruise ship and a RoPax ship, IR can be derived by dividing PLL by the number of people on board. By comparing IR for cruise ships calculated from the years 2000 to 2012, the worst IR which is the maximum value of IR can be computed as 1·51 × 10−5, which corresponds to the IR in 2009. To take the uncertainty in IR calculation into consideration, the worst IR is revised by multiplying by a value of ten, which equals 1·51 × 10−4. According to the discussion in Section 3, the IR upperbound of passengers on board should be assigned a value equal to the lower value of revised worst IR and the maximum tolerable risk for crew. Therefore the IR upperbound for passengers on board cruise ships is set to 1·51 × 10−4. From Equation (4),  $F_{upperbound-N_{\min}}$ of cruise ships equals 6·8 × 10−2. Similarly, when it comes to RoPax ships,
 $F_{upperbound-N_{\min}}$ is 9·9 × 10−2. As 10−6 is set as the IR lowerbound of all types of ships for simplification, according to Equation (4),
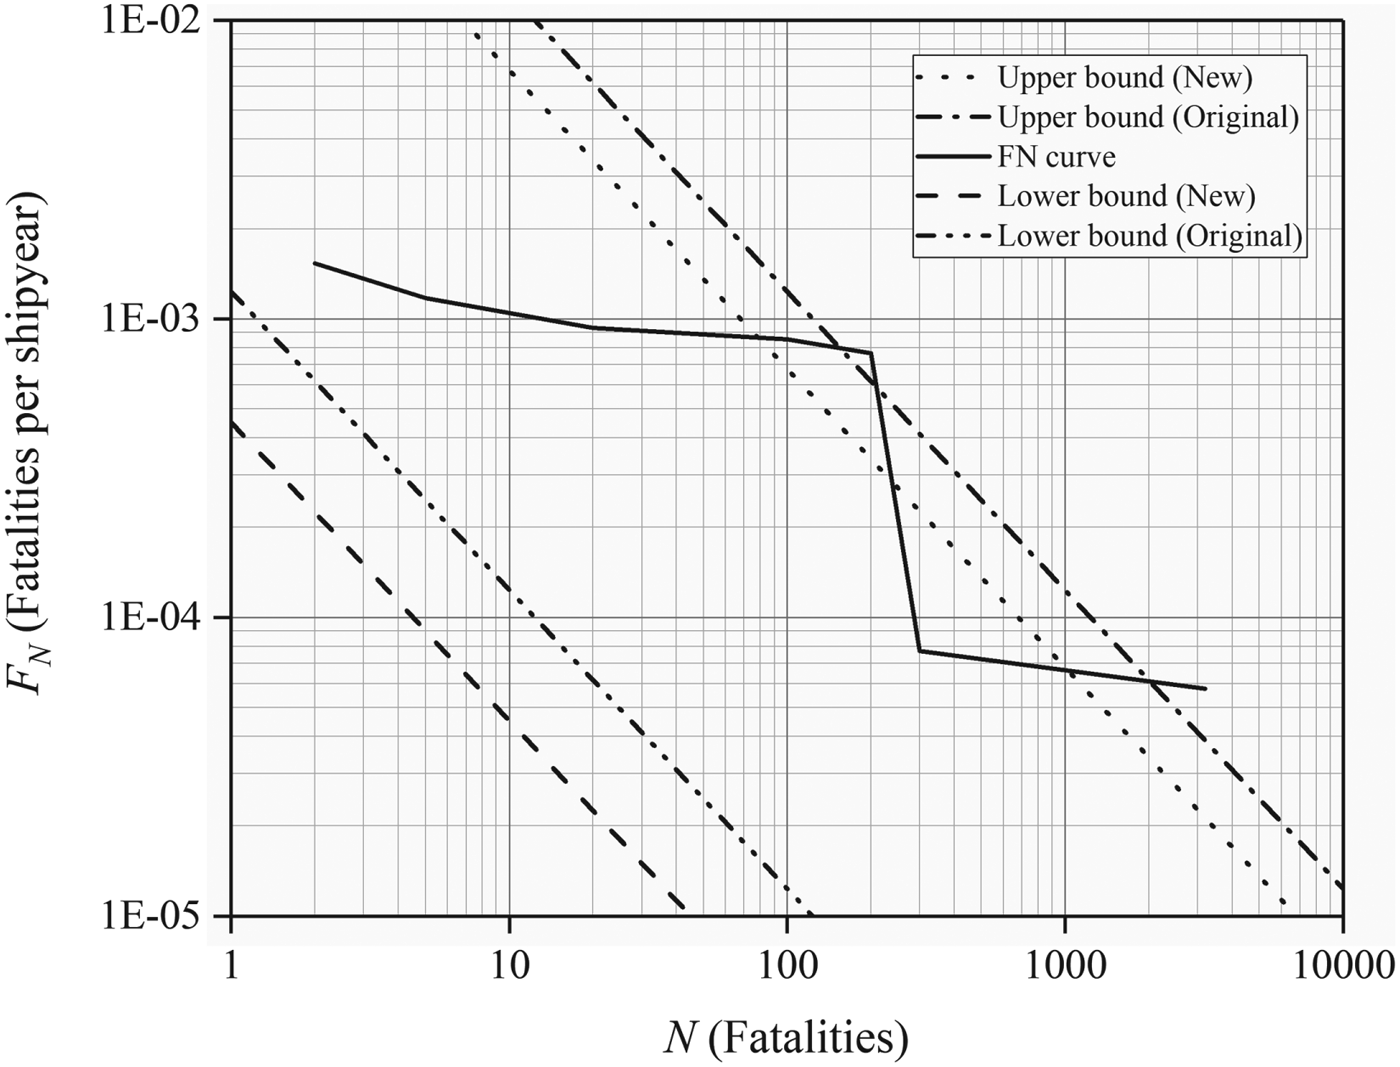
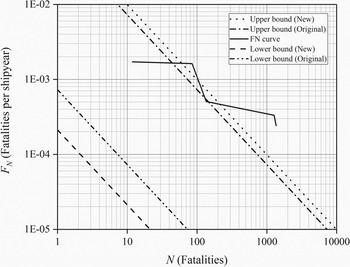
 $F_{lowerbound-N_{\min}}$ of cruise ships and RoPax ships are 4·5 × 10−4 and 2·1 × 10−4, respectively. The new FN criteria of cruise ships and RoPax ships are shown in Figures 2 and 3, and are compared with the original FN criteria. According to the event tree model in the FSA report, the exact frequencies of N fatalities per accident category for cruise ships and RoPax ships can be found in Tables 5 and 6. In order to plot FN curves, the cumulative frequency of N or more fatalities needs to be derived by adding all the exact frequencies of N or more fatalities. Based on the data in Tables 5 and 6, FN curves of cruise ships and RoPax ships are also plotted in Figures 2 and 3, respectively.
The comparison between original and new FN criteria of cruise ships.

The comparison between original and new FN criteria of RoPax ships.

Frequency of N fatalities per accident category for cruise ships.

Frequency of N fatalities per accident category for RoPax ships.

As can be seen in Figure 2, the new lower and upper bound FN criteria are all below the original ones for cruise ships. However, in Figure 3, the new lower and upper bound FN criteria for RoPax ships are below and above the original ones, respectively. The new upper bound FN criteria for cruise ships are relatively low because cruise ships remain at low levels of IR, which is the input for criteria development according to the principle of continuous improvement. FN curves of cruise ships and RoPax ships cross the corresponding new upper bound FN criteria, however, this does not mean that current SR are intolerable. This means that the tolerance degree of cruise ships and RoPax ships could be relatively low.
4.2. Risk Tolerance Comparison
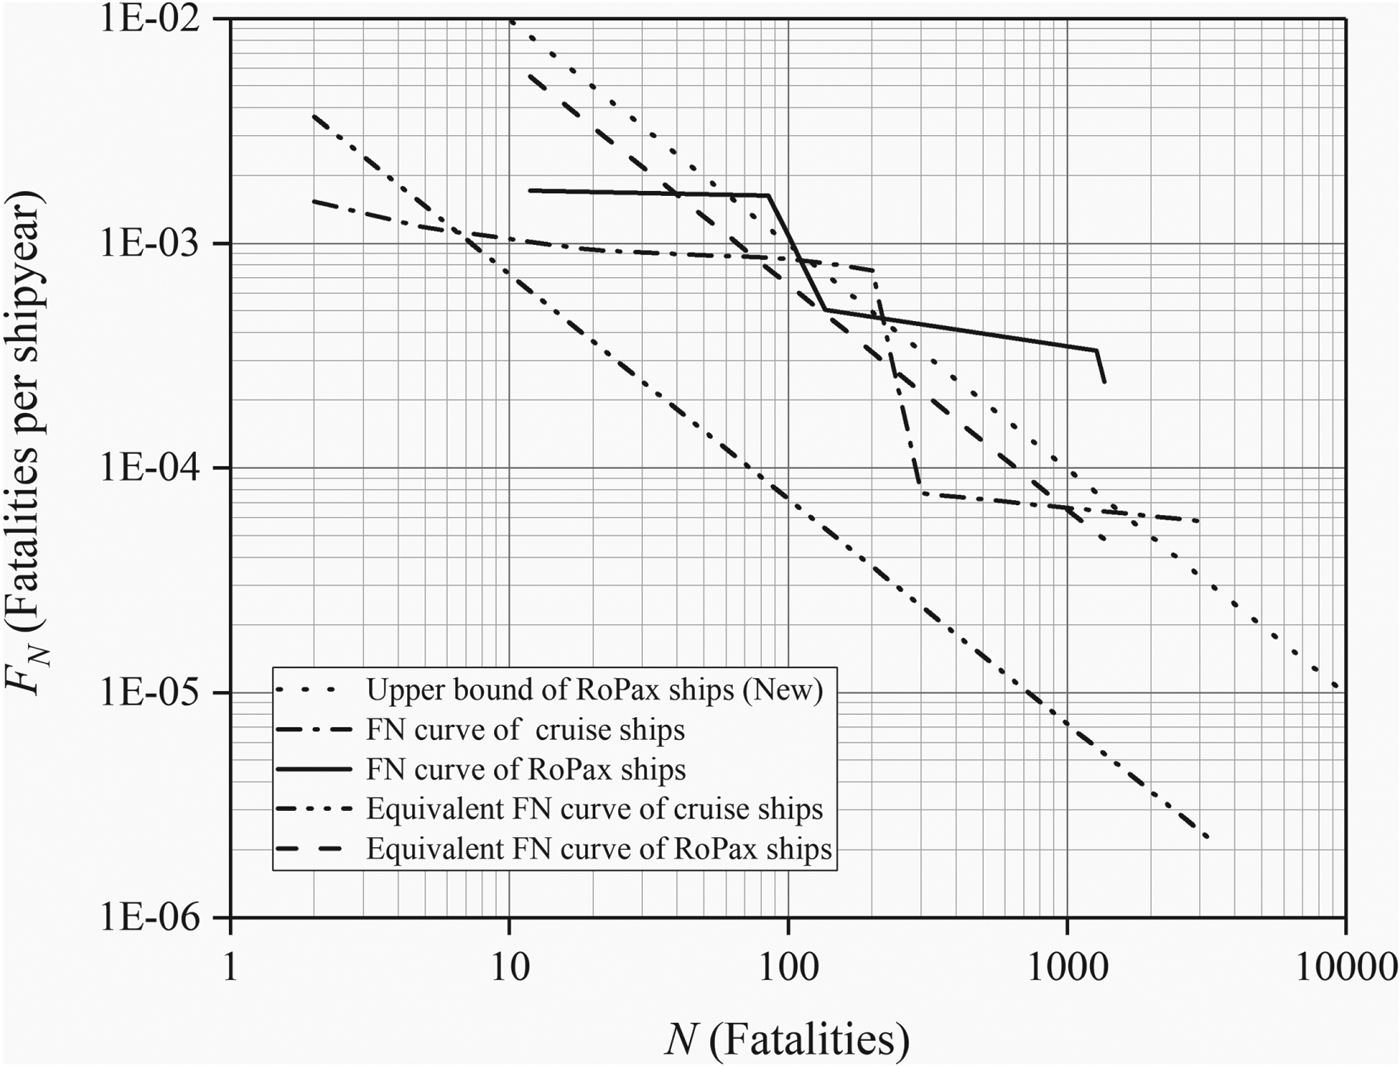
In order to test the method described in Section 3.2, FN curves of cruise ships and RoPax ships are used as examples, and the tolerance degrees are measured and compared. In order to make it possible to do so, a new upper bound FN criteria of RoPax ships is chosen as the reference level. As can be seen from Figure 5, the two FN curves have different N min and cross each other, which were previously incomparable to each other. The data of the FN curves and the corresponding values of FN criteria are shown in Tables 7 and 8.
The data of the FN curve of cruises and the corresponding value of FN criteria.

The data of the FN curve of RoPax ships and the corresponding value of FN criteria.

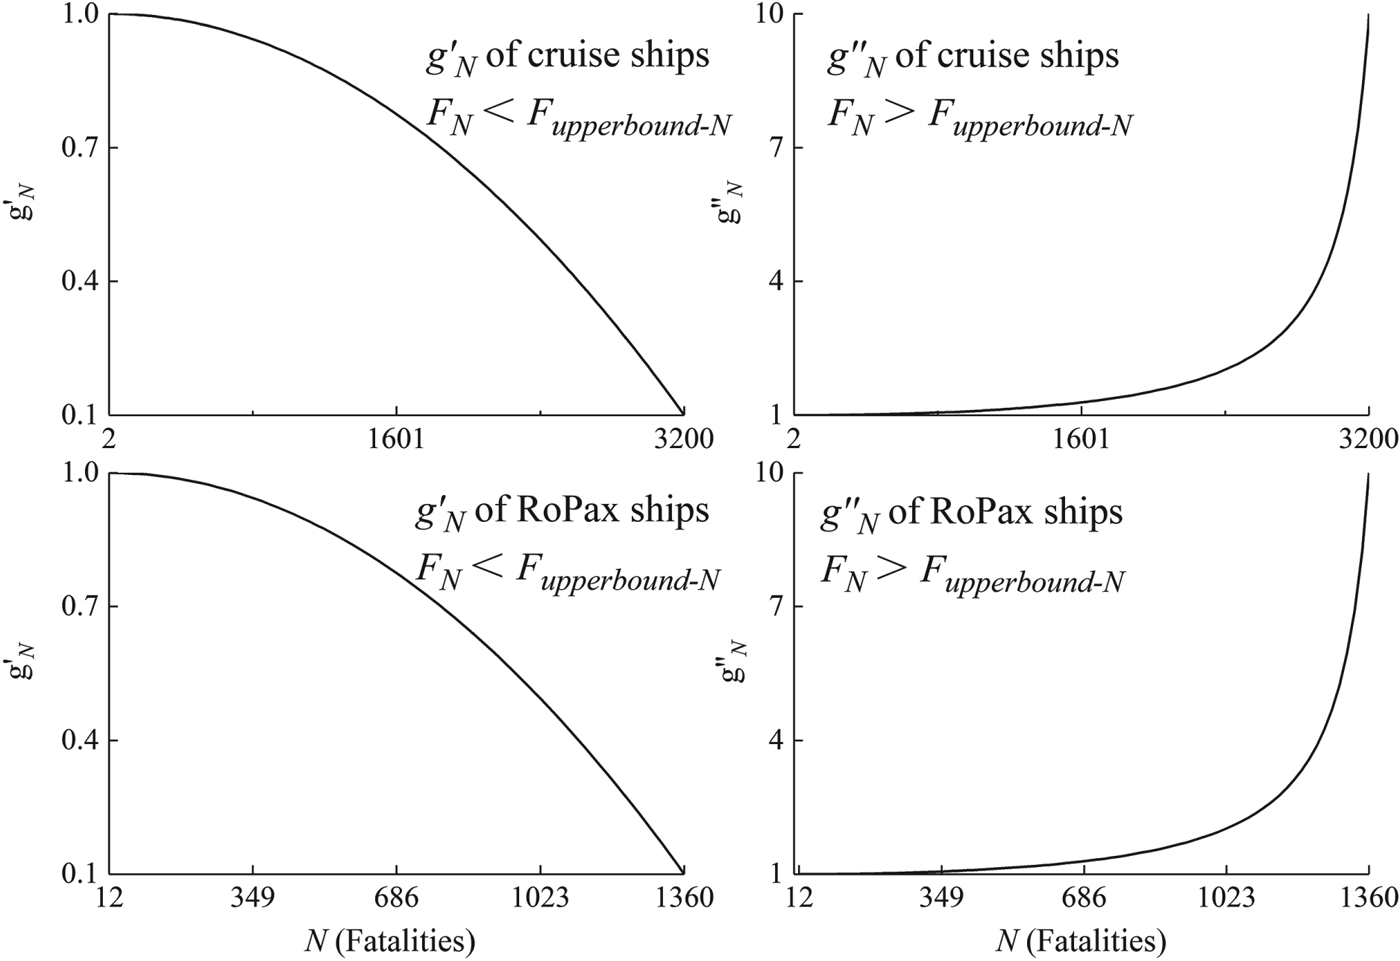
For simplification,  ${g}'_{N_{\max}} $is set to 0·1. From Equation (6), based on the data in Tables 7 and 8,
 $g_{N} ^{\prime}$ and
 $g_{N} ^{\prime \prime}$ can be obtained and are represented in Figure 4.
 $g_{N}^{\prime}$ and
 $g_{N}^{\prime\prime}$ of cruise ships and RoPax ships.

According to Equations (5), (7) and (8), equivalent FN curves of cruises and RoPax ships can be obtained and are plotted in Figure 5.
Equivalent FN curves of cruise ships and RoPax ships.

As can be seen in Figure 5, the equivalent FN curve of RoPax ships lies wholly above the equivalent FN curve of cruise ships when the new upper bound FN criteria of RoPax ships is chosen as the reference level. It can be concluded that the tolerance degree for cruise ships is higher than RoPax ships. It can be seen from Figure 5 that the FN curve of RoPax ships lies mostly above that for cruise ships, which means the SR of RoPax ships is relatively higher. This is consistent with the above conclusion.
5. CONCLUSIONS
This paper has focused on the problem of evaluating SR in the context of the IMO's SLA. Two main difficulties are mentioned, one is the absence of FN criteria which can be used for setting safety goals for people on board, the other is the inability to measure the tolerance of FN curves. To overcome the first difficulty, this paper summarises the steps of developing risk criteria for the shipping industry, and proposes an approach for establishing FN criteria in the context of the IMO's SLA. In addition, by defining dynamic factors to express risk aversion, a simple method to measure the tolerance of FN curves is proposed for the second difficulty. The proposed approaches seem adequate to remove the inconsistency between IR criteria and SR criteria, and can make it possible to measure and compare the tolerance of crossed FN curves.
The proposed method in this study is essentially an application of risk analysis and risk management theory to maritime safety and it may provide a guide for the IMO to continuously improve maritime safety. However, it is not limited to use in the IMO rule-making process. Considering limited available resources and budgets, the proposed method is also beneficial for government agencies and shipping companies in prioritising safety strategies. Based on the tolerance variation of societal risk before and after the implementation of various safety strategies, efficient strategies can be selected. Lastly, it should be noted that some simplifications are made in the paper. These issues are worth further investigation both from the theoretical and practical points of view.
FINANCIAL SUPPORT
The work was supported by National Natural Science Foundation of China (Grant no. 51509031) and the Fundamental Research Funds for the Central Universities of China (Grant no. 3132016009).