


INTRODUCTION
Titanium, as well as titanium-based alloys, is in the category of highly important materials characterized by extraordinary properties. Titanium exhibits excellent physico-chemical properties, such as admirable corrosion and erosion resistance, high strength-to-weight ratio, possibility of spontaneous passivation in electrolytes, etc. (Goodfellow Catalogue, Reference Goodfellow2000). Due to these characteristics titanium and its alloys are successfully applied to numerous applications nowadays, such as aero-space engineering, industrial tools, medical equipment, and implants. The application of titanium as a medical implant is mainly based on the fact that it possesses high level of biocompatibility with the human body (Bereznai et al., Reference Bereznai, Pelsoczi, Toth, Turzo, Radnai, Bor and Fazekas2003; Guillemot et al., Reference Guillemot, Prima, Tokarev, Belin, Porte-Durrieu, Gloriant, Baquey and Lazare2004). Excellent corrosion resistance of titanium gives opportunity for the fabrication of microfluidic networks and other microsystems such as micropumps for biomedical applications or for microchemical reactors (Chauvy, Reference Chauvy2003).
Modification of titanium surface using lasers was intensively studied, particularly in the last two decades. Different types of laser systems including excimer (Long & Rack, Reference Long and Rack1998; Gyorgy et al., Reference Gyorgy, Perez Del Pino, Serra and Morenza2002a), Nd:YAG (Gyorgy et al., Reference Gyorgy, Mihailescu, Serra, Perez Del Pino and Morenza2002a; 2002b; Reference Gyorgy, Perez Del Pino, Serra and Morenza2004; Trtica et al., Reference Trtica, Gakovic, Batani, Desai, Panjan and Radak2006), Ti:Sapphire (Vorobyev & Guo, Reference Vorobyev and Guo2007; Nayak et al., Reference Nayak, Gupta and Kolasinski2008), continuous wave CO2 (Lima et al., Reference Lima, Folio and Mischler2005), and Transversely Excited Atmospheric (TEA) CO2 (Thomann et al., Reference Thomann, Boulmer-Leborgne, Andreazza-Vignolle, Andreazza, Hermann and Blondiaux1996; Ciganovic et al., Reference Ciganovic, Stasic, Gakovic, Momcilovic, Milovanovic, Bokorov and Trtica2011) have been employed for these purposes. All of these lasers induced morphological surface features, ranging from micro-holes to conical spikes, and different micro/nanostructures.
With the appearance of commercially available femtosecond lasers, material surface modification gained a whole new dimension. Femtosecond laser pulses, compared to longer ones give unique benefits over other available techniques therefore they are widely used in microelectronics, optics, and biomedicine. Microelectronic applications include laser masking, machining of micro-holes, etc. Generally, in this regime of modification, the heat transfer to the material is drastically reduced, the transition from solid to vapor phase is quite possible, and high precision of material modification is ensured (Vorobyev & Guo, Reference Vorobyev and Guo2007; Bäuerle, Reference Bäuerle2003).
The treatment of titanium target with Ti:sapphire laser beam pulsed in the femtosecond time domain, with high intensity on the order of 1013–1015 W/cm2, could not be found in literature. Our goal in this paper was to study the effects of high-intensity femtosecond laser emitting in the near-infrared (800 nm) on a titanium surface in vacuum. One of the novel applications of laser ablation of titanium is laser pulsed deposition, which is conducted under vacuum or low pressure of the surrounding strictly controlled atmosphere. This is why, apart from air experiments, investigations in vacuum are also important.
EXPERIMENTAL
The titanium sample surface was prepared by a standard metallographic procedure. Target was mechanically polished (first by using SiC grinding paper (360–1200 grit) and finally by using diamond paste (1–0.25 µm)), ultrasonically cleaned and dried in hot air. Right before laser irradiation it was cleaned in ethanol. Bulk dimensions of the rectangularly shaped sample were 15 mm × 15 mm × 4 mm.
The laser beam of diameter 15 mm was focused normally on the target by a thin lens of 125 mm focal length. During the irradiation process, laser was operated in the near fundamental transverse mode TEM00. Irradiation was carried out in vacuum, at the pressure of 0.001 mbar.
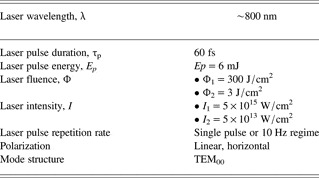
Ti:Sapphire femtosecond laser system pulsar by Amplitude Technologies, based on the chirped pulse amplification, was used. Central laser wavelength is approximately 800 nm, maximum laser energy 12 mJ, and the minimal laser spot diameter after focusing was around 50 μm. The sample was mounted on a four axis (x,y,z,θ) motorized computer-controlled positioning system, so that fresh target surface could be exposed to the laser beam before each shot. The sample surface was carefully positioned close to the lens focal plane (z-axis). Typical laser output parameters with experimental conditions are presented in Table 1.
Typical parameters of femtosecond Ti:sapphire laser used for irradiation of titanium implants
Various analytical techniques were used for characterization of the titanium samples before and after laser irradiation. The surface morphology was monitored by optical and scanning electron microscope (SEM). SEM was connected to an energy dispersive analyzer (EDX) for determining surface compositions of the samples. Profilometry was used for specifying the geometry of the ablated area. An X-ray pinhole camera was used for measuring the soft X-ray emission of the plasma in the energy range 10–1000 eV, while the hard X-ray spectra were recorded by Amptek X-123SDD detector.
RESULTS AND DISCUSSION
Non-irradiated surface of the titanium target, typically silver-white colored, had roughness of less than 1 µm as obtained by profilometer. Elemental analysis of the surface, performed before irradiation by EDX showed the following content: titanium about 94.0 wt.%, balanced to 100 wt.% by O (about 4.4 wt.%), C (about 1.5 wt.%), and Al (about 0.1 wt.%). Complete elemental analysis was normalized.
Generally, surface modification of the target depends on the laser output parameters—pulse energy density, irradiance (fluence), intensity, wavelength, laser pulse duration, number of accumulated laser pulses, as well as the sample characteristics, for example, absorptivity, and also irradiation conditions such as working atmosphere (vacuum, air, etc.).
Morphological changes of the titanium in vacuum atmosphere at the wavelength of 800 nm and as a function of accumulated laser pulses (1, 5, 10, 50, and 100 pulses) are shown in Figures 1 to 6. Figures 1 and 5 represent the modified surface of titanium at high and reduced laser fluence, respectively. The induced features at the titanium sample surface are presented below.
SEM analysis of the titanium implant surface after irradiation with femtosecond laser at different number of pulses. Vacuum atmosphere; I 1 = 5 × 10¹⁵ W/cm2 (Φ1 = 300 J/cm2). A, B, D, E, F = after irradiation with 1, 5, 10, 50, and 100 pulses. C = view of the target before irradiation. (A1, B, D1, E, F1 = entire spot and A2, D2, F2, F3, F4 = periphery).

3D-(a) and 2D- view (b) of the crater and its cross-section after irradiation of Ti-sample with 100 laser pulses (profilometric analysis). Vacuum atmosphere; I 1 = 5 × 10¹⁵ W/cm2 (Φ1 = 300 J/cm2).

Crater depth (a), crater volume (b) and volume of the ejected material (c) as a function of the accumulated pulse number. Vacuum atmosphere; I 1 = 5 × 10¹⁵ W/cm2 (Φ1 = 300 J/cm2).

SEM image of the titanium implant with marked EDX locations after 100 pulses. Vacuum atmosphere; I 1 = 5 × 10¹⁵ W/cm2 (Φ1 = 300 J/cm2). Spectrum 1 = non-irradiated zone; spectra 2 and 3 = crater rim.

SEM analysis of the titanium implant surface after irradiation with femtosecond laser at reduced intensities and different number of pulses. Vacuum atmosphere; A, B, C, D: I 2= 5 × 10¹³ W/cm2 (Φ2 = 3 J/cm2); A, B, C, D = after irradiation with 5, 10, 50, and 100 pulses, respectively. (A1, B1, C1, D1 = entire spot, C2 and D2 = center, A2, B2, C3, D3 = periphery zone).

SEM image of the titanium with marked EDX locations after 100 pulses. Vacuum atmosphere; I 2 = 5 × 10¹³ W/cm2 (Φ2 = 3 J/cm2). Spectrum 1 = non-irradiated zone; spectrum 2 = crater rim, spectrum 3 = periphery.

Regime of High Laser Intensity
Initially, the effects of femtosecond laser on the sample were studied at high laser intensity. This maximal intensity was achieved on the sample surface by focused laser beam with the single pulse energy 6 mJ and the corresponding fluence (Φ1) 300 J/cm2. The equivalent laser intensity I 1 was 5 × 10¹⁵ W/cm2 (Table 1). The view of the titanium surface before and after irradiation with femtosecond laser pulses, at the intensity I 1 is shown in Figure 1.
Surface changes can be summarized as follows: (1) crater-shaped damages, Figure 1A1, B, D1, E, F1, with the depth increasing with higher number of accumulated laser pulses. Profilometry analysis showed that craters had a conical cross-section after 50 and 100 pulses. Results for 100 pulses are given in Figure 2. Similar form of the crater cross-section on laser irradiated metals was previously observed (Karnakis, Reference Karnakis2006; Mao et al., Reference Mao, Chan, Shannon and Russo1993). Presence of the conical cross-section, Figure 2, can indicate different processes on the surface, particularly the occurrence of phase-explosion (Karnakis, Reference Karnakis2006); (2) formation of solid droplets at near and further crater periphery for more than one pulses applied, Figure 1B,D1,E, and (3) vast rim surrounding craters, especially expressed after 50 and 100 laser pulses, Figures 1E, F1, and 2; (4) appearance of conically shaped plasma in front of the sample. Plasma was bright-white and its length was about 3 mm.
The dependence of crater depth, crater volume and volume of the surrounding material above the surface as function of the number of accumulated laser pulses are shown in Figure 3.
Depth and volume (Figs. 3a and 3b) increase up to 50 accumulated laser pulses and with further pulse number increase their value declines. On the other hand, volume of the surrounding material is constantly increasing, Figure 3c. This morphology can be explained by spatial profile of the beam, where the central part of the beam corresponds to the highest crater depth, while the outer parts formed the surrounding rim. Some of the mechanisms responsible for the reduction of crater depth and volume for higher number of pulses are given by Di Bernardo et al. (Reference Di Bernardo, Courtois, Cros, Matthieussent, Batani, Desai, Strati and Lucchini2003). Тhus, with multiple laser shots, the effective absorbing surface becomes larger and the fluence decreases. Also, the laser pulse energy is absorbed within extremely small volume due to small beam diameter of femtosecond laser, creating a pressure and temperature comparable to a strong explosion. Because of this, material is rapidly atomized, ionized and converted into plasma that induces shock wave. This wave compresses the material to a higher density and causes decrease of ablation rate (Gamaly et al., Reference Gamaly, Juodkazis, Nishimura, Misawa, Luther-Davies, Hallo, Nicolai and Tikhonchuk2006). In case of successive laser pulses acting on the sample, as in our study, the formed plasma confines and condensates inside the formed crater lowering its depth. Another factor causing decrease of the crater depth could also be the collapsing of the surrounding ejected material inside the crater. Similar morphology, with volume of the surrounding material larger than the crater volume, was recorded on copper (Mao et al., Reference Mao, Chan, Shannon and Russo1993) for irradiation with high-intensity picosecond laser in argon atmosphere.
Titanium irradiation was conducted in vacuum, while our previous experiments (Trtica et al., Reference Trtica, Gakovic, Batani, Desai, Panjan and Radak2006) were carried out in air atmosphere using picosecond laser. In this earlier article, the presence of air resulted in the formation of titanium oxides and titanium nitride on the surface, while in the present work these compounds were not present. EDX surface elemental analysis obtained from irradiated and non-irradiated locations in vacuum ambient, Figure 4, is shown in Table 2.
Local EDX elemental analysis of the irradiated spot. Measuring locations are given in Figure 4. Spectrum 1 = non-irradiated zone; spectra 2 and 3 = crater rim
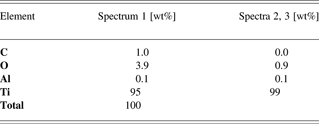
It is evident that carbon and oxygen are almost completely removed from the irradiated surface that becomes practically clean. For some applications, the presence of oxides and nitrides on the surface is advantageous since these layers increase hardness of the material. However, irradiation in vacuum is a solution when the goal is to modify the surface without changing its chemical composition and irradiation in vacuum also provides decontamination (Deppe et al., Reference Deppe, Warmuth, Heinrich and Korner2005).
The presence of plasma in front of the target at irradiation of titanium with high laser intensity of 5 × 10¹⁵ W/cm2 enables X-ray spectral analysis possible since the X-ray spectral emission is very intense. Preliminary recorded spectra reveal that the energy of the soft X-ray emission of photon energy in the range 10 eV–1 keV accounts for more than 5% of the laser energy. Lower intensities (e.g., 108 W/cm2) induce plasma irradiating in the ultraviolet region and therefore additionally sterilizing the surface. It can be assumed that the X-ray radiation present here has even more powerful decontamination effect.
Regime of Reduced Laser Intensity
Titanium surface modification with reduced intensity was considered too. For this set of measurements, laser energy was attenuated 100 times. This intensity was achieved on the sample surface by focused laser beam with the single pulse energy of 0.06 mJ and the reduced fluence (Φ2) 3 J/cm2. The equivalent laser intensity I 2 was 5 × 10¹³ W/cm2 (Table 1). The view of the titanium surface after irradiation with attenuated laser pulses is shown in Figure 5. Surface variation and phenomena can be summarized as follows: (1) appearance of the crater formed damage for 50 and 100 pulses; (2) reduction of hydrodynamic effects as resolidified droplets and appearance of the periodic surface structures at near and further periphery, except for one and five laser pulses, Figures 5B2, C3, D3, and (3) surrounding rim of the expelled material at the near periphery, particularly prominent after irradiation with 50 and 100 laser pulses, Figure 5C1, D1; (4) creation of plasma in front of the sample not as intensive as in the case of high fluence.
Micrographs show that the craters obtained using lower fluence have less prominent rim, without visible cracking. SEM images also indicate narrowing of the craters toward depth (Fig. 5C1, C2). If we take a look inside the crater, we can see the presence of some hydrodynamic effects and wrinkling of the material especially after 100 pulses (C2, D2). Periodic surface structures (PSS) at the periphery (B2, C1, C3, D1, D3) occurred after 10 or more laser pulses. These structures are characteristic for lower laser fluences which explains their absence in case of 300 J/cm2 energy density. PSS had the periodicity of about 1–2 µm (C3) and were oriented perpendicularly to each other. The presence of PSS increases the roughness of the material surface, which could be essential for biointegration of medical implants, for instance, in dentistry (Fan et al., Reference Fan, Jia and Su2010).
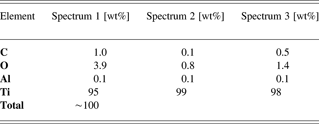
EDX elemental analysis of the titanium specimen after irradiation in vacuum atmosphere at the reduced laser intensity of I 2 = 5 × 10¹³ was performed as well. The measuring locations are given in Figure 6. At this intensity there is a similar tendency of local cleaning as in the case of high intensity (Table 3).
Local EDX elemental analysis of the irradiated spot. Measuring locations are given in Figure 6. Spectrum 1 = non-irradiated zone; spectrum 2 = crater rim, spectrum 3 = periphery (PSS)
Considering laser-metal interaction generally, three operational regimes, depending on the laser intensity used, can be distinguished, i.e., low (I ~ 1010 W/cm2), high (I ~ 1015 W/cm2), and ultra high laser intensity regime (I ~ 1019 W/cm2) (Torrisi, Reference Torrisi2011). In all of the stated regimes, the target is ablated but while the fractional ionization is relatively low in the first one, it reaches value of 95 and 100% in the second and third regime. Also, ion energy, temperature and electron densities are different. In the first regime, these values are 100 eV/charge state, 100 eV and 1016/cm3, in the second 100 keV/charge state, 10 keV and 1020/cm3, and in the third 1–10 MeV/charge state, 10 keV and 1022/cm3 (Torrisi, Reference Torrisi2011). The initial step of ablation in all three intensity regimes, including the regime used in our experiment (I ~ 1015 W/cm2), is the absorption of laser radiation by free electrons in the conduction band of the material. The energy is deposited in the region of thickness δ (skin depth). Then the energy is transported by electron thermal conduction and diffusion process into the material. This is followed by the electron subsystem thermalization that is a function of the used laser intensity and fluence and is on the order of few picoseconds (Dou et al., Reference Dou, Knobbe, Parkhill, Irwin, Matthews and Church2003), heating of atoms, breaking of chemical bonds, and finally ablation of the material with formation of plasma. The surface plasma reaches very high temperatures typically above the Fermi energy of the material (the energy characterizing electrons in the conduction band). Namely, if the average energy per electron in the initial plasma is E e < E F the characteristics of the material are not affected and this is the so-called “cold solid approximation.” However, if E e > E F which is the case in high intensities applied here, target characteristics change and we enter the “plasma regime.” In this regime, formulas for heat transfer obtained from solid-state physics do not apply anymore (Batani, Reference Batani2010). Plasma in front of the target can sometimes cause the so-called shielding effect, where it absorbs large part of the incoming laser radiation (Mao et al., Reference Mao, Chan, Shannon and Russo1993). This effect, however, is characteristic for pulses in nano- and picosecond time domain, while for femtosecond pulses it is not present, or drastically reduced, since the pulse is terminated before plasma formation. The pulse energy is therefore deposited in the matter without any participation of a laser-plasma interaction (Semerok et al., Reference Semerok, Salle, Wagner and Petite2002). Aside from this thermal mechanism, another mechanism of ablation is also present under the action of high intensity femtosecond laser pulses (Gamaly et al., Reference Gamaly, Rode, Luther-Davies and Tikhonchuk2002). When an intensive field of laser acts on the material it causes significant electron photo-emission from the surface. The surface is no longer quasineutral, which causes generation of the electric field. When this field exceeds the binding energy of atoms and molecules the material is disintegrated and removed from the surface. This phenomenon is known as electrostatic ablation.
CONCLUSIONS
A study of local morphological changes of titanium surface in vacuum induced by femtosecond Ti:sapphire laser operating at 800 nm with 60 fs pulse duration is presented. Experiments were conducted in high (1015 W/cm2) and reduced (1013 W/cm2) intensity regime, with 1, 5, 10, 50 and 100 successive pulses. It was shown that both corresponding laser fluences induce specific morphological changes of the titanium surface. Treatment at high intensity of 1015 W/cm2 resulted in deep crater formation already after five pulses. The reduced intensity of 1013 W/cm2 led also to the creation of shallow crater after ten pulses, while after fifty and hundred pulses craters were deep with periodic surface structures on their periphery. The presence of craters and PSSs can have application in mechanical industry (very precise apertures with small diameter) as well as biomedicine. Namely, these features increase the roughness of the material surface, which is favorable for biointegration of titanium implants. Chemical analysis of the titanium after irradiation indicates local cleaning of the surface under high laser intensity. Also, laser intensities this high induce plasma radiation in UV and X-ray spectral region which can provide additional sterilizing effect useful in some applications.
ACKNOWLEDGMENTS
The research was sponsored by the Ministry of Education and Science of the Republic Serbia through project “Effects of Laser Radiation on Novel Materials in Their Synthesis, Modification, and Analysis” (project No. 172019); European Scientific Foundation, project “Super-Intense Laser-Matter Interactions” (SILMI); and Ministry of Education, Youth and Sports of the Czech Republic (project No. LC528).



