




No CrossRef data available.
Article contents
Risk taking during decision-making in normal volunteers changes with age
Published online by Cambridge University Press: 01 July 2004
Abstract
Risk taking in a large cohort of adults (N = 177; ages 17–73) decreased with age, demonstrated by performance on a computer based gambling task, which has previously been shown to be sensitive to certain pharmacological manipulations including tryptophan depletion, lesions of the orbitofrontal cortex and neuropsychiatric disorders such as mania. Aging was also associated with longer deliberation times, poorer decision making, reduced risk taking, but no significant change in delay aversion. Subjects with a higher (NART-estimated) IQ were faster to make decisions and showed a greater modulation of risk-taking. Both sexes showed similar patterns of decision making, although male participants exhibited a greater modulation of risk-taking in response to the probability of winning. The Decision-Gamble task provides a variety of behavioral measures, corresponding to different aspects of impulsivity. Factor analysis of these measures suggested that two independent traits underlies performance on the task in normal individuals: one associated with risk tolerance, and a second associated with delay aversion. Age was related to decreases in the risk tolerance factor, but unrelated to the delay aversion; neither factor was significantly related to verbal IQ. This study thus provides support for the concept that impulsivity can be fractionated into 2 or more components. (JINS, 2004, 10, 590–598.)
Information
- Type
- Research Article
- Information
- Journal of the International Neuropsychological Society , Volume 10 , Issue 4 , July 2004 , pp. 590 - 598
- Copyright
- 2004 The International Neuropsychological Society
INTRODUCTION
Folk psychological notions such as the “recklessness of youth” associate conservatism (in terms of reduced risk-taking behavior) with increasing age. Risk-taking behavior is one component of the general concept of impulsivity, which may also comprise a variety of other traits. Personality researchers (Barratt, 1985; Eysenck & Eysenck, 1978) have tried to quantify traits of impulsivity using self-report questionnaires, whereas a variety of behavioral approaches have attempted to index impulsivity with a single measure. Recent attempts to bring together these disparate approaches have highlighted a number of behavioral components of impulsivity, which we will discuss under three main headings: risk tolerance, reflection impulsivity, and delay aversion.
Risk tolerance has been measured in terms of reduced judgments of personal risk; sensation seeking for rewards that may be associated with aversive consequences; risky or cautious behavior in imaginary management scenarios (see Sanfrey & Hastie, 2000, for a review) or in gambling paradigms (e.g., Bechara et al., 1999; Rogers et al., 1999a). Reflection impulsivity is defined as a tendency to make rapid decisions on the basis of limited information (e.g., Huq et al., 1988; Kagan et al., 1964) or search less for relevant information (Sanfrey & Hastie, 2000). Delay aversion has been widely investigated, both in terms of measurements of the discounting of delayed rewards, and performance on tasks that require withholding of responses for a delay (IRT and DRL; see Evenden, 1999, for review).
Although questionnaire studies have traditionally shown a decrease in general impulsivity in adults with age (see Okun, 1976, for a review), this is not consistently mirrored within these behavioral components of impulsivity. Green et al. (1994) found that delay aversion in terms of reward discounting decreases with age, but in a recent review, Sanfrey and Hastie (2000) conclude that older subjects tend to search for and consider information less, consistent with an increase in reflection impulsivity, whereas there are no consistent changes in risk attitude or actual risk taking habits across the adult post-adolescent lifespan.
However, there is less consistent evidence for age-related conservatism from laboratory behavioral studies: for example, Dror et al. (1998) failed to find significant changes in risk taking with age using a task based on the card game pontoon, whereas Denberg et al. (1999) showed that older subjects are slower to avoid high-risk choices in a computer based gambling scenario, a finding that does not suggest increasing risk aversion with age. Similarly, MacPherson et al. (2002) found no significant difference between old and young groups on the same task, although the oldest group performed worst and the youngest group best.
These studies were based upon the Iowa Gambling Task (Bechara et al., 1999) in which participants are required to repeatedly choose cards from one of four different decks. To succeed, participants must learn to avoid choosing from the high risk decks (which tend to produce high rewards, at risk of a severe cost), in favor of cards from the low risk decks (which give lesser rewards, but with a lower risk of losing). However, as the participants are required to abstract this information through experience of the decks, slower avoidance of the high-risk decks could be attributed to a factor other than a higher tolerance of risk. For example, it may be that older subjects have a general deficit in learning the contingencies between deck choice and outcome or a tendency to perseverate with originally rewarded responses (earlier cards in the high-risk decks are rewarded by higher gains than those in the low-risk decks). Indeed, the older subjects in MacPherson et al. (2002) appeared not to have learned to avoid the high-risk choices even by the end of task.
The primary aim of our study was to characterize the behavioral changes in risk taking with age, in a manner that would be minimally sensitive to individual differences in other variables, such as rate of learning, while continuing to use a measure of risk taking which has an established validity and sensitivity. We analyzed performance on another computer based gambling paradigm (Rogers et al., 1999a). This paradigm has previously been shown to be sensitive to certain neuropsychiatric disorders including mania (Murphy et al., 2001) and psychopharmacological manipulations such as tryptophan depletion, and lesions of the orbitofrontal cortex (Murphy et al., 2001; Rogers et al., 1999a). Learning is not a prerequisite in this task, as participants are asked to make judgments about options that have their probabilities displayed on the screen.
A characteristic feature of this task is that it allows several different scores relating to decision making to be extracted, and these measures have been shown to be differentially sensitive to pharmacological agents and neuropsychiatric disorders. As these measures have different interpretations within the suggested components of impulsivity, a secondary aim of the study was to investigate the way in which these different scores vary across a population of normal adults.
METHODS
Decision-Gamble Task
(Rogers et al., 1999a) The subject is told that the computer has hidden a yellow token inside one of 10 red or blue boxes arrayed in a horizontal row at the top of the screen. The subject chooses whether they believe the token is hidden in a red or blue box, and then decides how many of their points they wish to gamble on being correct. A winning choice is rewarded by the total of points risked, whereas a losing choice costs that number of points.
The likelihood of each choice being correct is therefore indicated to the subject on each trial by the ratio of red to blue boxes displayed. This produces a range of situations from one in which one outcome is much more likely (9:1) to those in which the two outcomes are almost equally likely (6:4). As soon as the subject has chosen, a proportion of their total points appears in the right-hand box. On certain trials (the ascend condition) this starts with 5% of the current points, and moves progressively up a sequence of values as follows: 5%, 25%, 50%, 75%, 95%. On other trials (the descend condition), the value starts at 95% of available points and decreases through the same sequence to 5%. The subject is required to tap this box at any point to bet the displayed amount of points, and a failure to press before the final value is displayed results in that final value being bet.
Sequences of trials were run in blocks, with the subject starting each block with 100 points. All subjects received two sets of blocks, with a break in between. All of the trials within the first set of blocks were conducted either in the ascend or descend condition with those in the second set of blocks in the other condition. Further, specific details of the procedure may be found elsewhere (Mavaddat et al., 2000; Murphy et al., 2001; Rahman et al., 1999; Rogers et al., 1999a; Rubinsztein et al., 2000).
Measures of Performance
The five principal measures in this task are the following:
Deliberation time
The mean latency to choose red or blue. Rapid decisions are a component of reflection impulsivity, although this is generally in the context of situations in which delay produces more information, which does not apply to this design.
Quality of decision making
The proportion of trials on which the subject chooses the outcome associated with the greater number of boxes (the more likely outcome). Thus a winning choice of red is only counted as a good decision if there were more red boxes than blue boxes on that trial. This measure is not obviously related to the different proposed components of impulsivity, although most definitions of impulsivity include a notion of “poorly conceived [actions] inappropriate to the situation” (Daruna & Barnes, 1993).
Risk taking
The mean proportion of available points that a subject stakes on each trial. This measure is unequivocally a measure of risk tolerance.
Delay aversion
The difference between the risk-taking score in the descend condition and the ascend condition. To the degree that the subject has difficulty in withholding a response over a delay, they will tend to select an amount to bet which occurs early in the sequence, that is a large bet in the descend condition, and a small bet in the ascend condition. This measure reflects delay aversion, but may also reflect motoric impulsivity.
Risk adjustment
The degree to which a subject varies their risk taking in response to the ratios of red to blue boxes on each trial (e.g., 9 red:1 blue vs. 6 red:4 blue). Participants typically show a tendency to bet larger proportions of their scores on the larger ratio trials, behavior which can be interpreted as an adjustment of the risk they wish to take according to the probability of winning. To quantify this risk adjustment, a score was calculated in a manner designed to be as independent as possible of the overall level of risk taking. This risk adjustment score was calculated as the degree to which the risk differed across the ratios, as a proportion of the overall amount risked by that subject: risk adjustment = [2*(% bet at 9:1) + (% bet at 8:2) − (% bet at 7:3) − 2*(% bet at 6:4)]/average % bet.
A risk adjustment score of approximately zero reflects no systematic tendency to take differential risks across the ratios, whereas a positive score indicates a tendency to bet a larger proportion of the available points on the high ratio trials (9:1 and 8:2) than on the lower ratio trials (7:3 and 6:4). A low risk adjustment score could be interpreted as a failure to use the available information when making a decision, and therefore may relate to reflection impulsivity.
Research Participants
A large cohort (N = 177) of healthy adult volunteers was recruited as control subjects. All subjects had their age, sex, and NART score estimated1
1Verbal IQ is relatively stable over adulthood (see Mackintosh, 1998). Age-related changes in decision making may be due to changes in cognition that would also influence performance on a more general IQ battery. Due to the cross-sectional nature of the design, this could lead to Type II error if a general IQ score were included as a regressor in subsequent analysis.
As there were no a priori reason to presume linearity in any age-related changes, the subjects were quartile split to produce four equally sized groups (Table 1). These age groups enabled investigation of the profile of age-related change on decision making measures, without assuming a monotonic, or even linear, change with age.
Subject characteristics of the age groups derived from a quartile split

RESULTS
The proportion of good choices, mean deliberation time and mean percent bet were recorded for each subject for each equivalent trial type, in terms of ratio and ascending or descending bet condition. Risk taking (RT), risk adjustment (RA) and delay aversion (DA) measures were calculated from these mean percent bet scores. Standard transformations (arcsine transformation for proportion good choice; logarithmic transformation for deliberation time) were found to be appropriate to reduce non-normality, and applied to the score from each ratio condition; the means of these transformed scores gave the deliberation time (DT) and quality of decision making (QDM) scores.
Three forms of parametric analysis were undertaken: The overall linear relationship between each of the five scores and age and estimated IQ within the cohort was assessed by means of Pearson's correlation; factorial analyses of covariance (ANCOVA) were used to investigate the relationship between the scores and age group, gender, and IQ. Finally, interrelationships between the different scores were investigated using factor analysis: the data were reduced by principal components analysis, with varimax factor rotation.
Hypothesis tests are assessed according to a Type I error rate of 5%; all analyses were conducted using SPSS v11.0 for Windows.
Effects of IQ on decision making
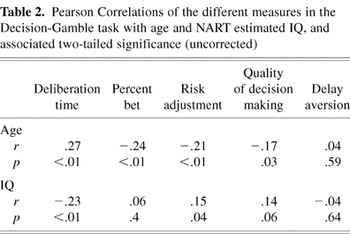
Table 2 shows the correlations between IQ and the five measures. Individuals with higher IQ were quicker at making decisions, and tended to adjust their risk taking more in response to the changing likelihood of a win, although the latter effect does not survive correction for multiple comparisons. Participants with higher IQ showed a non-significant trend to higher percentage choice of the most likely option, but no relationship was evident between IQ and either the RT or DA scores. Although there was a tendency for NART IQ to increase with age groups, there was no significant correlation with IQ across the sample (r = .12; p = .1).
Pearson Correlations of the different measures in the Decision-Gamble task with age and NART estimated IQ, and associated two-tailed significance (uncorrected)

Effects of age on decision making
Correlations between decision making measures and age are shown in Table 2. These reveal that decision making by older participants tended to be slower, exhibit both less risk taking and less risk adjustment, and be of poorer quality; only the trend to make poorer decisions does not survive Bonferroni correction. Age had no significant effect upon the delay aversion measure. More detailed investigation of the way in which decision making changed across age was investigated by means of separate ANCOVA, contrasting the mean score in each age group, with NART-estimated IQ as a covariate.
Figure 1 shows the pattern of risk taking and risk adjustment across the four age groups. The older groups tended to risk less than the younger groups, and increased their bets less in response to the higher ratios of boxes, as measured by the risk adjustment score. ANCOVA confirmed that the groups differed significantly on risk taking and risk adjustment [smaller F(3,172) = 3.426, p = .018].

Risk taking and adjustment in each age group. The average percent bet is a measure of risk taking. The average percent bet at each ratio is displayed in the left-hand panel. The average percent bet irrespective of ratio is shown in the middle panel. The degree to which subjects modulated their betting in response to the different ratios is shown in the right hand panel. Risk adjustment is calculated [2 × (average percent bet at a 9:1 ratio of boxes) + (average percent bet at an 8:2 ratio of boxes) − (average percent bet at a 7:3 ratio of boxes) − 2 × (average percent bet at a 6:4 ratio of boxes)/average percent bet]. Error bars represent 1 SEM.
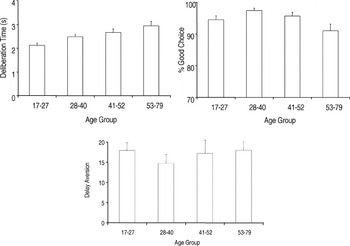
Figure 2 shows that participants in the older age groups showed a greater latency to respond along with a tendency to make poorer decisions. ANCOVA confirmed group differences on both these measures [smaller F(3,172) = 4.330, p = .006]. Most subjects bet more in the descend condition than the ascend condition but the extent to which subjects did this was not modulated by age group [F < 1].

The average deliberation time compared between age groups is shown in the left upper panel. The proportion of the time subjects selected the most likely outcome is displayed in the right upper panel. Delay aversion compared between age groups. Delay aversion is measured by the average bets placed in the descend condition minus the average percent bet in the ascend condition. Error bars represent 1 SEM.
Effects of gender on decision-making
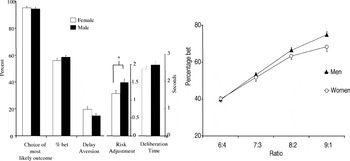
Figure 3 shows the mean score for male and female subjects in each age group, on each measure. Owing to the uneven dispersion of ages within the sample, some care must be taken interpreting any observed differences, as gender and age are clearly confounded (see Table 1). In the light of this, the significance of hypotheses concerning estimated influence of sex differences, accounting for group differences in IQ and age, were tested using ANCOVA, contrasting the means in the two sexes, with both age and IQ as covariates.

Differences between the sexes on performance on the Decision-Gamble task. Men and women do not differ in the percentage of times that they choose the most likely to win option, in the average percent bet, nor in their delay aversion. Women adjust the amount they risk in response to different odds of winning significantly less than men. Error bars represent 1 SEM.
Women tended to show less risk adjustment than men [F(1,173) = 5.630, p = .019] increasing their bets less as the ratio increased, but the two sexes did not differ on overall risk taking [F(1,173) = 2.011, p = .158]. Perhaps surprisingly, there was a non-significant trend for women to show greater delay aversion than their male counterparts [F(1,173) = 3.428, p = .066], by betting more in the descend condition than the ascend condition. The sexes did not differ in the estimated mean speed or quality of decision-making outcome [Fs < 1].
Relationships Between the Measures
A factor analysis of the five behavioral measures was conducted, producing a model containing two explanatory factors with Eigenvalues >1, which account for 66% of the variance. The loadings are plotted in the left hand columns of Table 3, along with the Pearson correlation for the derived factors with age and IQ within the cohort.
Rotated component matrix for two explanatory factors found during principal components analysis, along with their correlations with age and NART estimated IQ

Examination of the loading matrix suggests that the first factor accounts for covariation in increased delay aversion with decreases in both quality of decision making and risk adjustment. This factor does not correlate with either age or IQ (smaller p > .4, corrected). The second factor explains increases in speed of decision making and risk-taking, along with some increases in quality of decision making. This factor has a significant negative correlation with age (p < .001, corrected) but the tendency for a negative correlation with IQ does not quite survive Bonferroni correction (p = .053, corrected).
DISCUSSION
Age had a clear influence upon decision making in this task: Older subjects deliberated for longer before making a choice, and were then less likely to pick the optimal choice, took smaller risks and adjusted their risks less, gambling similar amounts on different odds of winning. There was no effect of age on the delay aversion measure. Two components emerged from a principal components analysis: The first factor accounts for co-variation in quality of decision making and risk adjustment, whereas delay aversion loads negatively on this factor; the second factor accounts for co-variation in speed of decision making and risk tolerance across the population. Age loaded negatively on the second factor, confirming that increased age is associated with increasing deliberation time and decreased risk taking. IQ was not related to either factor. The factor analysis demonstrated two separate sources of variation in risk taking behavior in the normal adult population, neither of which have a significant relationship with NART IQ.
Risk Tolerance
The factor analysis suggests that the impact of age upon decision making can regarded as primarily reducing risk tolerance. Yet this finding has not been consistently reported in other paradigms. In a review of the literature, Sanfrey and Hastie (2000) concluded that they could discern no consistent changes in risk attitudes or actual risk taking habits across the adult, post-adolescent lifespan. The reduced betting of older subjects is also inconsistent with a risk-tolerance interpretation of the finding that older subjects are slower to avoid high-risk bets in the Iowa gambling task (Denberg et al., 1999). In the light of the results reported here this finding might be better interpreted as due either to slower learning of the contingencies or to a tendency to persevere with the responses initially rewarded. Perhaps the proportion of bad choices in the Iowa gambling task is more akin to the quality of decision making measure in the Decision-Gamble task. However, a recent paper (Monterosso et al., 2001) found no significant correlations between poor choices in the Iowa gambling task and the Decision-Gamble task, although this may have been due to the small sample size (N = 30) and lack of variance in the subjects' choices in the Decision-Gamble task. Important differences between these tasks should be noted. The Iowa gambling task measures decisions between contingencies that have to be learned whereas the Decision-Gamble task measures choices between options in which learning is not a prerequisite. Thus, not only are older subjects slower to learn to make more optimal choices, subjects are less able to make optimal choices when all the information necessary for the choice is presented in front of them. However, this paper further illuminates this deficit; older subjects may be slower to learn to avoid high risk choices, but when asked to place a bet on a probabilistic outcome will tend to be more conservative than their younger counterparts.
Delay Aversion
There was no effect of age on the delay aversion measure. In the factor analysis delay aversion and deliberation time were found to load on different factors, suggesting that this measure does not reflect simply motoric impulsivity.
Quality of Decision Making
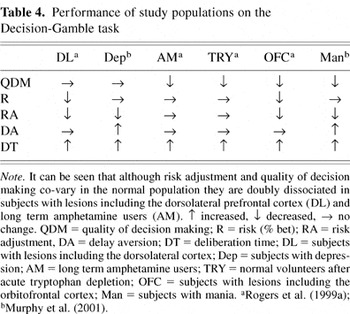
Both quality of decision making and risk adjustment are reduced with age and in the factor analysis both were found to load on the two underlying factors in a similar fashion. This could be seen as evidence that these two factors are in some sense equivalent (see Table 3). However risk adjustment and quality of decision making seem to be affected independently in psychopharmacological studies and patient populations. There are reported double dissociations between quality of decision making and risk adjustment on this task (Table 4). In some groups, including subjects with lesions of the orbitofrontal cortex or mania (Murphy et al., 2001; Rogers et al., 1999a), quality of decision making and risk adjustment are both reduced, whereas in other conditions such as those following tryptophan depletion and long-term amphetamine abuse (Rogers et al., 1999a), quality of decision making has been shown to be reduced but with no effect on risk adjustment. Furthermore, in subjects with lesions of dorsolateral prefrontal cortex (Rogers et al., 1999a) or depression (Murphy et al., 2001) quality of decision making is intact and risk adjustment is reduced. This suggests that these two measures may be tapping two different processes which happen to co-vary in the normal population. A potential resolution would be for a future study to employ factor analysis with a larger but similar population of subjects.
Performance of study populations on the Decision-Gamble task

Deliberation Time
Sanfrey and Hastie (2000) in their review conclude that older individuals search for information less before making a decision, suggesting that older subjects are less reflective. We find no support for this conclusion. In the present study older subjects spent longer deliberating before they made a response, which could even be interpreted as decreased reflective impulsivity, although the quality of decision making did not increase concomitantly, in fact it was impaired. Similarly in a study using the Matching Familiar Figures Test (MFFT) which has been used as a measure of reflective impulsivity (Kagan et al., 1964) older individuals had longer latencies, yet made more errors than younger individuals (Denney & List, 1979). Increased deliberation time on the Decision-Gamble task has been observed in a wide variety of groups studied: patients with depression, mania (Murphy et al., 2001), frontal variant frontotemporal dementia (Rahman et al., 1999), lesions of the orbitofrontal or dorsolateral prefrontal cortex, long term drug addicts (including specific opiate and specific amphetamine abusers) as well as normal subjects acutely depleted of central tryptophan (Rogers et al., 1999a). The increase in deliberation time with age appears to follow a different time course from the more continuous change in risk taking. Changes in speed of performance may be due to general factors rather than specific to the decision-making process: increased RT with age is found in a large variety of other neuropsychological tasks (Robbins et al., 1994; Salthouse, 2000), and performance on IQ sub-tests requiring processing speed generally deteriorates in over the 40–70 age range whereas performance on other IQ tests remains comparatively stable (Mackintosh, 1998).
Effect of IQ
IQ did not load significantly on either of the two factors, although the initial correlation analyses show that subjects with lower NART estimated IQs made slower decisions and failed to adjust their betting as greatly in response to different levels of risk. Slower decisions and decreased risk adjustment are also seen in depressed subjects (Murphy et al., 1999). This suggests that higher IQ subjects are following a strategy of risking more when the odds are more favorable. Although this strategy seems intuitively reasonable, it is easy to demonstrate that the highest expected win would come from risking as much as possible on each trial. Although this strategy leads to the highest average win across trial blocks, it also leads to a higher probability of losing everything, which the subjects are instructed to avoid. Using Eysenck and Eysenck's (1978) terminology, betting high on all trials (low risk adjustment) could also be considered “venturesome,” as well as an exhibition of impulsive risk tolerance.
Gender
There were no differences between the sexes on any measure except that men had a more responsive betting style than women. Previous studies suggest that any differences between the sexes on measures of decision making and impulsivity depend upon the test used and the precise characteristics of the population sample. In a sample of 100 adults, Denney and List (1979) found no differences between adult men and women on the MFFT. However in a sample of 65 undergraduates males took longer and made fewer errors on the MFFT, indicating men to be more reflective than women (Malle & Neubauer, 1991). However, there were no differences between the proportion of impulsive males compared to females at the average age of 10 years (Barrett, 1977). From a review of reflective impulsivity research, Messer (1976) concluded that there were no consistent gender effects. In a sample of 735 boys and 312 girls, aged between 6–16, Slovic (1966) found that boys tended to risk more than girls in a task with some affinity to the present Decision-Gamble task. However this finding has not been replicated in subsequent studies with smaller samples (N = 84, Jamieson, 1969; N = 60, Kopfstein, 1973). In summary, we find no convincing evidence of a difference in risk taking between the sexes.
Causes of Conservative Response Bias Seen in Old Age
The increasing conservatism shown by the elderly in this study could be a generational effect, or it is possible that youthful impulsivity is a predictor of earlier mortality. However, subjects exhibiting some forms of obvious risk taking behavior in certain natural settings, such as those engendering long term heroin or amphetamine use, have normal risk taking scores on the Decision-Gamble task (Rogers et al., 1999a). Alternatively, the changes seen in the Decision-Gamble task could be due to the effects of brain aging.
While performance on tests of frontal lobe function declines, there is no convincing evidence that such fronto–executive function is specifically affected by age (Robbins et al., 1994, 1997). However, the tests used in those studies were primarily sensitive to damage to the dorsolateral prefrontal cortex rather than the orbitofrontal cortex, which has been postulated to be more implicated in this Decision-Gamble task (Rogers et al., 1999a, 1999b). Indeed, there is some evidence that regions of the frontal lobe, the orbitofrontal cortex (as well as the superior frontal gyrus) may be specifically affected by age (Convit et al., 2001) which could therefore be related to the changes we have observed. It does not seem plausible, however, to attribute all of the differences in performance in the older age groups to a single underlying change; the measures alter at different rates, with speed and quality measures declining gradually after approximately 45 years, whereas risk taking and adjustment show a smooth trend towards conservative response bias throughout adult life.
Summary
Older subjects deliberate for longer before making a choice, and are then less likely to choose the optimal choice. Contrary to other behavioral and questionnaire studies (Denberg et al., 1999; Sanfrey & Hastie, 2000) we found that older subjects were risk averse. Older subjects also adjusted their risks less, gambling similar amounts on different odds of winning. There was no effect of age on delay aversion. There were no differences between the sexes on any of the measures in the Decision-Gamble task except that men had a significantly more responsive betting style. The risk aversion seen in old age is unlikely to be due to a general decline in intelligence, as this factor had no relation to IQ. The factor analysis demonstrated two separate sources of variation in risk taking behavior in the normal adult population, both of which are largely independent of IQ. The differential effect of age on the risk taking and quality of decision making measures in this task thus provide supporting evidence for the concept that the impulsivity construct can be fractionated into at least two distinct components.
ACKNOWLEDGMENTS
Funding was provided by a Wellcome Trust Programme Grant (019407) to Prof. T.W. Robbins, Prof. B.J. Everitt, Dr. A.C. Roberts and Prof. B.J. Sahakian. The research was conducted within the MRC Centre in Behavioural and Clinical Neuroscience. J.B.D. was funded by Merck Sharp and Dohme, a James Baird Award from the University of Cambridge School of Clinical Medicine and an Oon Khye Beng studentship. The authors would like to thank Danielle Turner, Judy Rubinsztein, Nahal Mahavaddat, Facundo Manes, Laura Watkins, Luke Clark, Robert Rogers and especially Evangelos Bazanis for assisting in the testing of the subjects.
References
REFERENCES
Barratt, E.S.
(1985).
Impulsiveness defined within a systems model of personality. In
E.P. Speilberger &
J.N. Butcher (Eds.),
Advances in personality assessment (pp.
113–132).
Hillsdale, NJ:
Lawrence Erlbaum Associates.
Barrett, D.E.
(1977).
Reflection-impulsivity as a predictor of children's academic
achievement.
Child Development,
48,
1443–1447.CrossRefGoogle Scholar
Bechara, A.,
Damasio, H.,
Damasio, A.R., &
Lee, G.P.
(1999).
Different contributions of the human amygdala and ventromedial
prefrontal cortex to decision-making.
Journal of Neuroscience,
19,
5473–5481.CrossRefGoogle Scholar
Convit, A.,
Wolf, O.T.,
de Leon, M.J.,
Patalinjug, M.,
Kandil, E.,
Caraos, C.,
Scherer, A.,
Saint Louis, L.A., &
Cancro, R.
(2001).
Volumetric analysis of the pre-frontal regions: Findings in aging
and schizophrenia.
Psychiatry Research,
107,
61–73.CrossRefGoogle Scholar
Daruna, J.H. &
Barnes, P.A.
(1993).
A neurodevelopmental view of impulsivity. In
W.G. McCowan,
J. Johnson, &
M.B. Shure (Eds.),
The impulsive client: Theory research and treatment (pp.
40–45).
Washington, DC:
American Psychological Association.
Denberg, N.,
Bechara, A.,
Tranel, A.,
Hindes, A., &
Damasio, A.
(1999).
Neuropsychological evidence for why the ability to decide
advantageously decreases with age.
Society for Neuroscience Abstracts,
21,
24.Google Scholar
Denney, N.W. &
List, J.A.
(1979).
Adult age differences in performance on the Matching Familiar
Figures Test.
Human Development,
22,
137–144.CrossRefGoogle Scholar
Dror, I.E.,
Katona, M., &
Mungur K.
(1998).
Age differences in decision making: To take a risk or not? Gerontology,
44,
67–71Google Scholar
Evenden, J.L.
(1999).
Varieties of impulsivity.
Psychopharmacology,
146,
348–361.CrossRefGoogle Scholar
Eysenck, S. &
Eysenck, H.J.
(1978).
Impulsiveness and venturesomeness: Their position in a dimensional
system of personality description.
Psychological Reports,
43,
1247–1255.CrossRefGoogle Scholar
Green, L.,
Fry, A.F., &
Myerson, J.
(1994).
Discounting of delayed rewards: A lifespan comparison.
Psychological Science,
5,
33–36.CrossRefGoogle Scholar
Huq, S.F.,
Garety, P.A., &
Hemsley, D.R.
(1988).
Probabilistic judgements in deluded and non-deluded subjects.
Quarterly Journal of Experimental Psychology A,
40,
801–812.CrossRefGoogle Scholar
Jamieson, B.D.
(1969).
The influences of birth order, family size, and sex differences on
risk-taking behaviour.
British Journal of Social and Clinical Psychology,
8,
1–8.Google Scholar
Kagan, J.,
Rosman, B.L.,
Day, D.,
Albert, J., &
Philips, W.
(1964).
Information processing in the child: Significance of analytic and
refective attitudes.
Psychological Monographs,
78.CrossRefGoogle Scholar
Kopfstein, D.
(1973).
Risk-taking behavior and cognitive style.
Child Development,
44,
190–192.CrossRefGoogle Scholar
Mackintosh, N.J.
(1998).
IQ and human intelligence.
Oxford, UK:
Oxford University Press.
MacPherson, S.E.,
Phillips, L.H., &
Della Sala, S.
(2002)
Age, executive function, and social decision making: A dorsolateral
prefrontal theory of cognitive aging.
Psychology of Aging 17,
598–609CrossRefGoogle Scholar
Malle, B.F. &
Neubauer, A.C.
(1991).
Impulsivity, reflection, and questionnaire response latencies: No
evidence for a broad impulsivity trait.
Personality and Individual Differences,
12,
865–871.CrossRefGoogle Scholar
Mavaddat, N.,
Kirkpatrick, P.J.,
Rogers, R.D., &
Sahakian, B.J.
(2000).
Deficits in decision-making in patients with aneurysms of the
anterior communicating artery.
Brain,
123,
2109–2117.CrossRefGoogle Scholar
Messer, S.B.
(1976).
Reflection-impulsivity: A review.
Psychological Bulletin,
83,
1026–1052.CrossRefGoogle Scholar
Monterosso, J.,
Ehrman, R.,
Napier, K.L.,
O'Brien, C.P., &
Childress, A.R.
(2001).
Three decision-making tasks in cocaine-dependent patients: Do they
measure the same construct? Addiction,
96,
1825–1837.Google Scholar
Murphy, F.C.,
Rubinsztein, J.S.,
Michael, A.,
Rogers, R.D.,
Robbins, T.W.,
Paykel, E.S., &
Sahakian, B.J.
(2001).
Decision-making cognition in mania and depression.
Psychological Medicine,
31,
679–693.CrossRefGoogle Scholar
Murphy, F.C.,
Sahakian, B.J.,
Rubinsztein, J.S.,
Michael, A.,
Rogers, R.D.,
Robbins, T.W., &
Paykel, E.S.
(1999).
Emotional bias and inhibitory control processes in mania and
depression.
Psychological Medicine,
29,
1307–1321.CrossRefGoogle Scholar
Okun, M.
(1976).
Adult age and cautiousness in decision: A review of the literature.
Human Development,
19,
220–233.CrossRefGoogle Scholar
Rahman, S.,
Sahakian, B.J.,
Hodges, J.R.,
Rogers, R.D., &
Robbins, T.W.
(1999).
Specific cognitive deficits in mild frontal variant frontotemporal
dementia.
Brain,
122,
1469–1493.CrossRefGoogle Scholar
Robbins, T.W.,
James, M.,
Owen, A.M.,
Sahakian, B.J.,
McInnes, L., &
Rabbitt, P.
(1994).
Cambridge Neuropsychological Test Automated Battery (CANTAB): A
factor analytic study of a large sample of normal elderly
volunteers.
Dementia,
5,
266–281.CrossRefGoogle Scholar
Robbins, T.W.,
James, M.,
Owen, A.M.,
Sahakian, B.J.,
McInnes, L., &
Rabbitt, P.
(1997).
A neural systems approach to the cognitive psychology of ageing
using the CANTAB battery. In
P. Rabbitt (Ed.),
Methodology of frontal and executive function
(Vol. 10, pp.
215–238):
Hove, UK:
Psychology Press.
Rogers, R.D.,
Everitt, B.J.,
Baldacchino, A.,
Blackshaw, A.J.,
Swainson, R.,
Wynne, K.,
Baker, N.B.,
Hunter, J.,
Carthy, T.,
Booker, E.,
London, M.,
Deakin, J.F.,
Sahakian, B.J., &
Robbins, T.W.
(1999a).
Dissociable deficits in the decision-making cognition of chronic
amphetamine abusers, opiate abusers, patients with focal damage to
prefrontal cortex, and tryptophan-depleted normal volunteers: Evidence
for monoaminergic mechanisms.
Neuropsychopharmacology,
20,
322–339.Google Scholar
Rogers, R.D.,
Owen, A.M.,
Middleton, H.C.,
Williams, E.J.,
Pickard, J.D.,
Sahakian, B.J., &
Robbins, T.W.
(1999b).
Choosing between small, likely rewards and large, unlikely rewards
activates inferior and orbital prefrontal cortex.
Journal of Neuroscience,
19,
9029–9038.Google Scholar
Rubinsztein, J.,
Michael, A.,
Paykel, E., &
Sahakian, B.
(2000).
Cognitive impairment in remission in bipolar affective disorder.
Psychological Medicine,
30,
1025–1036.CrossRefGoogle Scholar
Salthouse, T.A.
(2000).
Aging and measures of processing speed.
Biological Psychology,
54,
35–54.CrossRefGoogle Scholar
Sanfrey, A. &
Hastie, R.
(2000).
Judgement and decision making across the adult life-span: A
tutorial review of psychological research. In
D. Park &
N. Schwarz (Eds.),
Cognitive Aging: A Primer (pp.
253–273).
Philadelphia, PA:
Psychology Press.
Slovic, P.
(1966).
Risk-taking in children: Age and sex differences.
Child Development,
37,
169–176.CrossRefGoogle Scholar

Subject characteristics of the age groups derived from a quartile split
Pearson Correlations of the different measures in the Decision-Gamble task with age and NART estimated IQ, and associated two-tailed significance (uncorrected)

Risk taking and adjustment in each age group. The average percent bet is a measure of risk taking. The average percent bet at each ratio is displayed in the left-hand panel. The average percent bet irrespective of ratio is shown in the middle panel. The degree to which subjects modulated their betting in response to the different ratios is shown in the right hand panel. Risk adjustment is calculated [2 × (average percent bet at a 9:1 ratio of boxes) + (average percent bet at an 8:2 ratio of boxes) − (average percent bet at a 7:3 ratio of boxes) − 2 × (average percent bet at a 6:4 ratio of boxes)/average percent bet]. Error bars represent 1 SEM.
The average deliberation time compared between age groups is shown in the left upper panel. The proportion of the time subjects selected the most likely outcome is displayed in the right upper panel. Delay aversion compared between age groups. Delay aversion is measured by the average bets placed in the descend condition minus the average percent bet in the ascend condition. Error bars represent 1 SEM.
Differences between the sexes on performance on the Decision-Gamble task. Men and women do not differ in the percentage of times that they choose the most likely to win option, in the average percent bet, nor in their delay aversion. Women adjust the amount they risk in response to different odds of winning significantly less than men. Error bars represent 1 SEM.

Rotated component matrix for two explanatory factors found during principal components analysis, along with their correlations with age and NART estimated IQ
Performance of study populations on the Decision-Gamble task
 You have
Access
- 236
- Cited by