The present study focuses on the adaptation into Spanish and on the validation of the Eating Attitudes Test-40 (EAT-40; Garner & Garfinkel, Reference Garner and Garfinkel1979). The EAT-40 was originally developed for measuring eating behavior and attitudes commonly observed in patients with Anorexia Nervosa (AN) on the basis of Feighner’s diagnostic criteria (Feighner et al., Reference Feighner, Robins, Guze, Woodruff, Winokur and Muñoz1972). Scores on the EAT-40 proved to be useful for differentiating between AN and control females. A cut-off score of 30 provided a low false positive rate (7%) for identifying cases of AN (Garner & Garfinkel, Reference Garner and Garfinkel1979). Exploratory factorial analyses suggested that the items cover seven dimensions: Food Preoccupation, Body Image for Thinness, Vomiting and Laxative abuse, Dieting, Slow Eating, Clandestine Eating, and Perceived Social Pressure to Eat.
Previous research has proved that the EAT-40 features adequate internal consistency in clinical and general population samples, with Cronbach’s alpha coefficients ranging from .79 to .94 across the studies (Alvarez et al., Reference Alvarez, Mancilla, Vázquez, Unikel, Caballero and Corona2004; Castro, Toro, Salamero, & Guimerá, Reference Castro, Toro, Salamero and Guimerá1991; Garner & Garfinkel, Reference Garner and Garfinkel1979; Pereira et al., Reference Pereira, Maia, Bos, Soares, Marques, Macedo and Azevedo2008; Raciti & Norcross, Reference Raciti and Norcross1987; Smead & Richert, Reference Smead and Richert1990). Carter and Moss (Reference Carter and Moss1984) reported on a high test-retest reliability (r = .84) over a two to three-week period. The EAT-40 total score has also proved to be useful to differentiate between subjects with and without eating disorders (ED) (Alvarez et al., Reference Alvarez, Mancilla, Vázquez, Unikel, Caballero and Corona2004; Castro et al., Reference Castro, Toro, Salamero and Guimerá1991; Gross, Rosen, Leitenberg, & Willmuth, Reference Gross, Rosen, Leitenberg and Willmuth1986; Irala et al., Reference Irala, Cano-Prous, Lahortiga-Ramos, Gual-García, Martínez-González and Cervera-Enguix2008; Mintz & O´Halloran, Reference Mintz and O´Halloran2000; Pereira et al., Reference Pereira, Maia, Bos, Soares, Marques, Macedo and Azevedo2008), on one hand, and among different ED, including AN, Bulimia Nervosa (BN), and Eating Disorders Not Otherwise Specified (EDNOS; Alvarez et al., Reference Alvarez, Mancilla, Vázquez, Unikel, Caballero and Corona2004), on the other hand.
Even though the above findings suggest that the EAT-40 could be a reliable and valid tool for screening ED, two main issues concerning the psychometric properties of the questionnaire still remain controversial. First, empirical evaluation of the factorial structure of the EAT has yielded discrepant findings. In this regard, previous research including clinical patients with ED did not confirm the original seven factor solution proposed by Garner and Garfinkel (Reference Garner and Garfinkel1979). Indeed, in a second study aimed at further exploring the psychometric properties of the EAT, Garner, Olmsted, Bohr, and Garfinkel (1982) reported on a three-factor solution (Dieting, Bulimia and Food Preoccupation, and Oral Control) among females meeting Feighner’s criteria for AN. This more parsimonious structure explained 40.2% of the variance. Fourteen items were then eliminated from the EAT-40, and a shorter version of the questionnaire was proposed (the EAT-26).
Castro et al. (Reference Castro, Toro, Salamero and Guimerá1991) also reported on a three factor solution for the EAT-40 in Spanish females meeting DSM-III criteria (American Psychiatric Association; APA, 1980) for AN. However, factors identified in this study differed from those proposed by Garner and Garfinkel (Reference Garner and Garfinkel1979). Items covered three domains labeled Dieting and Food Preoccupation, Social Pressure, and Psychobiological Disorders, which explained a total of 41% of the variance (Castro et al., Reference Castro, Toro, Salamero and Guimerá1991). Furthermore, Alvarez et al. (2004) found a five factor solution explaining 46.6% of the variance in a sample of females meeting DSM-IV-R criteria (APA, 1994) for ED.
Hence, while the most commonly obtained factor solution in females with AN consists of three factors (Castro et al., Reference Castro, Toro, Salamero and Guimerá1991; Garner, Olmsted, Bohr, & Garfinkel, Reference Garner, Olmsted, Bohr and Garfinkel1982), this factorial structure has not been replicated in females with any ED (Alvarez et al., Reference Alvarez, Mancilla, Vázquez, Unikel, Caballero and Corona2004). Moreover, research exploring the factorial structure of the EAT-40 in community samples has also provided discrepant results, with different studies obtaining three (Nasser, Reference Nasser1994; Pereira et al., Reference Pereira, Maia, Bos, Soares, Marques, Macedo and Azevedo2008), five (Eisler & Szmukler, Reference Eisler and Szmukler1985; Nasser, Reference Nasser1994), and six (Smead & Richert, Reference Smead and Richert1990; Wells, Coope, Gabb, & Pears, Reference Wells, Coope, Gabb and Pears1985) factor solutions. Overall, these results suggest that the factorial structure of the EAT-40 is even more unstable in community samples than in clinical samples but, nevertheless, they pose a threat to the external validity of the questionnaire.
Various reasons could account for these inconsistent findings, including differences in factor selection and diagnostic criteria for ED across studies, the use of small samples in some studies, as well as differences in eating behavior and attitudes across cultures. The fact that the EAT-40 was developed to measure AN – instead of any ED- on the basis of Feighner’s criteria – instead of on the basis of DSM diagnostic criteria- may also contribute to instability in the factor structure. Indeed, as Mintz & O’Halloran (2000) have highlighted, given the changes over time in diagnostic criteria for AN as well as the broadening of the range of ED included in the classifications, the EAT is probably no longer a measure of AN, but an assessment tool for capturing undifferentiated ED.
From this broader point of view, high scores on the EAT would therefore indicate the presence of any ED (AN, BN, or EDNOS) or of abnormal eating behavior and attitudes that do not necessarily reach threshold criteria for a clinical diagnosis. Indeed, findings from previous research on the Spanish version of the EAT-26 (Rivas, Bersabé, Jiménez, & Berrocal, Reference Rivas, Bersabé, Jiménez and Berrocal2010) would be consistent with a conceptualization of the EAT as a general measure of abnormal eating behavior and attitudes. Rivas et al. (Reference Rivas, Bersabé, Jiménez and Berrocal2010) explored the factorial structure and internal consistency of the EAT-26 in Spanish samples of females recruited from community (Study 1) and from clinical and community settings following a case-control design (Study 2). ED diagnosis was established using the Q-EDD in both studies. Even though findings from both studies suggested that several items of the EAT-26 should be revised, both Study 1 and 2 supported a unidimensional structure underlying the EAT-26 items, and the internal consistency for the short version of the questionnaire was excellent (Cronbach’s α coefficient > .90).
A second major concern in the field is the cut-off score often used to identify subjects with ED according to results from the EAT-40. Several studies suggest that a cut-off point of 30 provides the best proportion of sensitivity and specificity (Mann et al., Reference Mann, Wakeling, Wood, Monck, Dobbs and Szmukler1983; Nasser, Reference Nasser1986). Previous research also suggests, however, that this threshold might be too high for Hispanic samples. In this regard, Castro et al. (Reference Castro, Toro, Salamero and Guimerá1991) found that a cut-off point of 20 gave the best compromise between sensitivity (91%) and specificity (69.2%). In females with AN, BN or EDNOS, Canals, Carbajo, and Fernández (2002) proposed a cut-off point of 25 (sensitivity = 100%; specifity = 93%), while Irala et al. (Reference Irala, Cano-Prous, Lahortiga-Ramos, Gual-García, Martínez-González and Cervera-Enguix2008) found that the best diagnostic prediction was obtained with a cut-off point of 21 (sensitivity = 73%; specifity = 85%). Along similar lines, Alvarez et al. (Reference Alvarez, Mancilla, Vázquez, Unikel, Caballero and Corona2004) reported on a cut-off score of 28 in a sample of females with AN and BN (sensitivity = 86%; specifity = 94%), and a cut-off point of 22 in a sample of females with EDNOS (sensitivity = 83%; specifity = 82%). Similar inconsistencies concerning the cut-off score for discriminating between subjects with and without ED have been found for the short version of the questionnaire (Rivas et al., Reference Rivas, Bersabé, Jiménez and Berrocal2010). Furthermore, findings from the Study 2 by Rivas et al. (Reference Rivas, Bersabé, Jiménez and Berrocal2010) indicate that the EAT-26 features good specificity but moderate sensitivity to discriminate between subjects with and without ED in Spanish samples.
In sum, despite changes in diagnostic criteria for ED over time, the EAT-40 has proved to have some sound psychometric properties, and it has probably become one of the most widely used self-reports in the field of ED across a number of cultures (Irala et al., Reference Irala, Cano-Prous, Lahortiga-Ramos, Gual-García, Martínez-González and Cervera-Enguix2008). In particular, research shows that the EAT-40 is a reliable and valid tool for differentiating between subjects with and without ED in Hispanic samples. Nevertheless, the lack of replicability of the factorial structure warrants further research. In this regard, the hypothetical unidimensionality of the questionnaire - supported on a new and broader conceptualization of the EAT-40 - deserves empirical attention. In addition, several authors have suggested a review of the commonly used EAT-40 cut-off scores for detecting ED in order to improve accuracy values (Koslowsky, Scheinberg, Bleich and Mark, Reference Koslowsky, Scheinberg, Bleich and Mark1992). Indeed, findings suggest that the accuracy values of the EAT-40 are higher if a cut-off score lower than 30 is used for detecting any ED among clinical and non-clinical Hispanic females.
According to the above considerations, the present study was conducted in order to further evaluate the psychometric properties of the EAT-40 in both clinical and community Spanish samples. In particular, the main objective of the study was to explore the dimensionality of the questionnaire as well as the cut-off score for differentiating between subjects with and without ED. The internal consistency, test-retest reliability, criterion-related and convergent validity of the EAT-40 were also addressed. Concerning, in particular, the convergent validity of the scale, it was predicted that the EAT-40 total score would be positively correlated with scores from other scales measuring similar constructs.
Method
Participants
The sample consisted of a group of females with ED (clinical group) and a group of females without ED (control group). Participants in the clinical group were recruited from a larger sample of patients consecutively presenting to receive clinical assistance for ED at several clinics over a 47-month period (N = 118). Patients meeting DSM-IV-R criteria for ED were selected to participate in the study. A total of 16 out of 118 patients were excluded from the study: 11 patients were symptomatic, and 5 were asymptomatic. A total of 7 additional patients were excluded since they did not complete all the EAT-40 items. Hence, the clinical group consisted of 95 patients: 37 with AN (Restrictive AN = 19, Purgative AN = 18), 47 with BN (Purgative BN = 41, Non Purgative BN = 6), and 11 with EDNOS (Menstruating AN = 1, Subthreshold BN = 6, Subthreshold Nonbinging BN = 1, and Binge Eating Disorder = 3). Patients’ age ranged from 12 to 54 years, with a mean age of 23 years (SD = 7).
A total of 95 females recruited from the general population and matched for age with participants in the clinical group were selected to participate in the study. A total of 6 out of the 95 females were excluded from the study since they did meet DSM-IV-R criteria for ED (n = 1 EDNOS) or did not complete all the EAT-40 items (n = 5). Hence, the control group consisted of 89 females (Symptomatic = 12, Asymptomatic = 77) with a mean age of 22 years (SD = 7, range = 8–49).
Measures
In addition to the EAT-40, participants completed the following self-report questionnaires.
The Questionnaire for Eating Disorder Diagnoses (Q-EDD; Mintz, O´Halloran, Mulholland, & Schneider, Reference Mintz, O’Halloran, Mulholland and Schneider1997; Spanish version developed by Rivas, Bersabé, & Castro, Reference Rivas, Bersabé and Castro2001) is a 50-item questionnaire that operationalises DSM-IV criteria for ED (APA, 1994) and, hence, provides an external criterion to classify participants in the study. Diagnoses are generated by flowchart decision rules. Subjects who meet diagnostic criteria for an ED are classified into the following categories: AN, BN, or EDNOS. Subjects without an ED are classified as “Symptomatic” or “Asymptomatic”. Some psychometric properties of the Spanish version of the Q-EDD have been explored in two previous studies comprising high school students and outpatients with ED (Rivas et al., Reference Rivas, Bersabé and Castro2001). Q-EDD diagnoses demonstrated high inter-scorer agreement as well as good convergent and divergent validity with respect to scores from the EAT-26 and the Bulimic Investigatory Test Edinburgh (BITE; Henderson & Freeman, Reference Henderson and Freeman1987; Spanish version developed by Rivas, Bersabé, & Jiménez, Reference Rivas, Bersabé and Jiménez2004).
The Bulimia Test-Revised (BULIT-R; Thelen, Farmer, Wonderlich, & Smith, Reference Thelen, Farmer, Wonderlich and Smith1991; Spanish version by Berrios-Hernández et al., Reference Berrios-Hernández, Rodríguez-Ruíz, Perez, Gleaves, Maysonet and Cepeda-Benito2007) consists of 36-items aimed at measuring behavior and attitudes related to BN as defined by the DSM-IV. The Spanish version of the BULIT-R covers four main components ( α calculated in this study) labeled Body Image (.97), Binging (.96), Diuretics (.66), and Laxatives (.82)- and features adequate internal consistency (Berrios-Hernández et al., Reference Berrios-Hernández, Rodríguez-Ruíz, Perez, Gleaves, Maysonet and Cepeda-Benito2007).
The Eating Disorder Inventory-II (EDI-II; Garner, Reference Garner1991) assesses attitudes and behavior related to AN and BN. It is comprised of 91 items organized into 11 subscales ( α calculated in this study): Drive for Thinness (.95), Bulimia (.88), Body Dissatisfaction (.95), Ineffectiveness (.94), Perfectionism (.77), Interpersonal Distrust (.84), Interoceptive Awareness (.91), Maturity Fears (.85), Asceticism (.78), Impulse Regulation (.88), and Social Insecurity (.91). Findings have further demonstrated the internal consistency and construct validity of the Spanish version of the scale (Corral, González, Pereña, & Seisdedos, Reference Corral, González, Pereña, Seisdedos and Garner1998).
Procedure
Participants in the clinical group were recruited from several Psychology Clinics and Community Mental Health Centers situated in several Andalusian towns (Spain). After providing informed consent, patients were interviewed with the Structured Clinical Interview for DSM-IV-R Axis I disorders (SCID-I/P - Module H; First, Spitzer, Gibbon, Gibbon, & Williams, Reference First, Spitzer, Gibbon, Gibbon and Williams1994). An experienced psychologist certified in the use of the SCID conducted the assessments. Subjects meeting DSM-IV-R criteria for ED were then selected to participate in the study. Participants were asked to complete the EAT-40 as well as several additional self-report measures for assessing the criterion and convergent validity of the questionnaire. Height and weight measurements of all participants were also taken in order to estimate the Body Mass Index (BMI = Kg/m2) and therefore to confirm the diagnosis of AN.
Participants in the control group were recruited by a “snowball” technique. Students attending the psychology curriculum at the University of Malaga were requested to identify adults (e.g., relatives, colleagues, etc.) - who were matched for age with participants in the clinical group- willing to participate in the study. Participants meeting DSM-IV-R criteria for ED according to results from the SCID-I were excluded from the study. Selected participants were then asked to complete the EAT-40 and the other measures included in the study. Only data from those respondents who completed all of the items of the EAT-40 were selected for this study.
In order to explore the test-retest reliability of the EAT-40, 147 participants (68 and 79 from the ED and the control group, respectively) completed all the EAT-40 items twice over a mean interval of two weeks.
Statistical analyses
Factorial structure of the scale was addressed by means of exploratory analyses, since no previous study tested the unidimensionality of the EAT-40 with similar samples. A Parallel Analysis of the EAT-40 items was conducted by means of the fa.parallel function (Horn, Reference Horn1965; Humphreys & Montanelli, 1975) included in the R environment (R Development Core Team, 2008) of the psych package (Revelle, Reference Revelle2010). The factorial structure of the EAT-40 was explored by Principal Component Analysis (PCA). Unfolding Analysis was then performed by the Prefscal procedure included in the Statistical Package for the Social Sciences (SPSS, 2006).
Cronbach’s alpha coefficients and Homogeneity Indices were also explored in order to assess the internal consistency of the questionnaire. Pearson correlation coefficient was calculated to evaluate the test–retest reliability of the scale. Case-control differences on the EAT-40 scores were explored by means of the Student-Welch t test for independent samples. Differences in the EAT-40 scores among the five Q-EDD groups were also explored in order to assess the validity of the questionnaire using an external criterion (DSM-IV-R diagnostic resulting from the Q-EDD). Between-group comparisons were conducted by means of the Brown-Forsythe (B-F) robust test. Post-hoc comparisons were performed by means of the Tamhane test.
The Receiver-Operating Characteristic (ROC) curve analysis was conducted in order to explore the optimal cut-off value in the Spanish version of the EAT-40 for differentiating between subjects with ED and normal controls. Finally, the convergent validity of the questionnaire was further evaluated by examining the Pearson correlation coefficients between the EAT-40 total scores and data from psychometric measures assessing similar constructs.
Results
Factor Structure
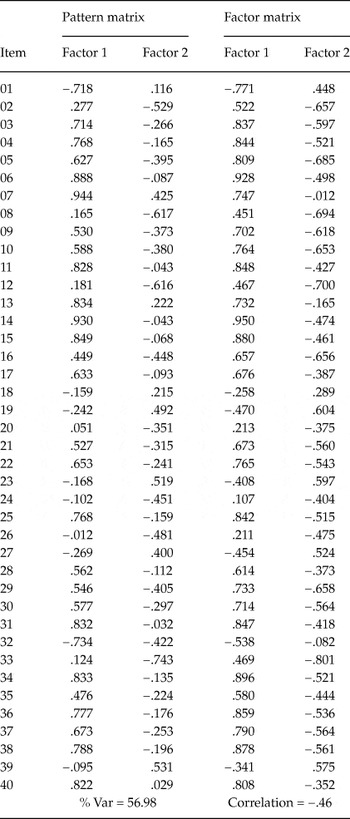
Results from the Parallel Analysis suggested two components. These were then obtained by means of the PCA and transformed into an oblique solution (oblimin rotation). This solution showed a structure in which item loadings were very high and with opposite signs (+/-) in each component. The correlation coefficient between the component scores was −.46 (see Table 1). This structure could suggest that bipolar concepts underlie the items. According to van Schuur & Kiers (1994), one of the two factors could be redundant and, therefore, a single dimension would be sufficient to explain the underlying dimensionality of the EAT-40.
Pattern and structure matrices (Oblique solution, two dimensions; N = 184)

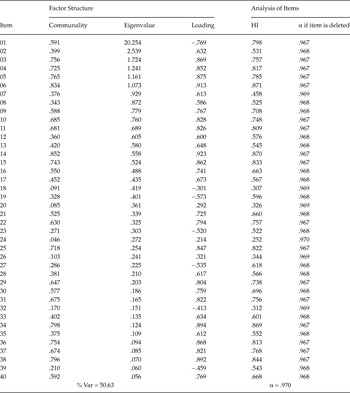
Results from the Unfolding Analysis suggested that either two opposite dimensions or one dimension could explain all the items. Index of goodness of fit model-data (Normalized Stress = .165) showed that an one-dimension solution is adequate. Moreover, the Unidimensionality Index (UI = 20.254/2.539 = 7.98 > 5) also suggested a one-dimension structure.
Regarding sampling adequacy, even though the sample size in this study did not satisfy the subject to item ratio of at least 5:1 (Gorsuch, Reference Gorsuch1983), it did satisfy other alternative and accepted criteria. Indeed, there is no single ratio that will work in all cases of exploratory factorial analysis. In this regard, the sample satisfied the essential criteria for good exploratory factorial analysis of at least 100 subjects, and a variable to subject ratio of at least 2:1 (Kline, Reference Kline2000). Furthermore, Kaiser-Meyer-Olking (KMO) index was .957 in this study.
Additionally, as MacCallum, Widaman, Preacher, & Hong (Reference MacCallum, Widaman, Preacher and Hong2001) argued (cfr. Osborne & Costello, Reference Osborne and Costello2004), the number of items per factor and communalities and item loading magnitudes can make any particular ratio either overkill or hopelessly insufficient. In this regard, the one-factor solution showed a high number of moderate to high communalities and item loadings. It yielded 32 moderate (greater than .30) or high (greater than .50) communalities, and only eight low communalities (ranging from .085 to .286). Items with moderate to high communalities yielded high loadings, and items with low communalities showed loadings greater than .30 (except item 24 whose loading was .214) (see Table 2). Hence, based on study of MacCallum, Widaman, Zhang, and Hong (Reference MacCallum, Widaman, Zhang and Hong1999), a sample size comprising between 100 and 200 (184 subjects in this sample) can be considered adequate for a one-component solution.
Unidimensional factor structure and item analysis (N = 184)

HI: Homogeneity Indices.
The one-component solution accounted for 50.63 % of the variance. As noted above, most items showed high factorial loadings (close to or greater than .30), except item 24. It should also be noted that item 32 showed a negative loading (−.413), while it showed a positive loading in the three-factor solution reported by Garner et al. (Reference Garner, Olmsted, Bohr and Garfinkel1982).
Internal Consistency
All the items showed high Homogeneity Indices greater than .30 (see Table 2, Column 5). Cronbach’s alpha coefficient was .97, and decreased if any of the items was deleted (see Table 2, Column 6).
Test-retest Reliability
Correlation coefficient for the relation between the EAT - 40 total score at Time-1 (M = 37, SD = 32, Range 3 – 107) and at Time-2 (M = 35, SD = 32, Range 2 – 109) was excellent (r = .96).
Criterion-related validity (known-groups)
Results from the Levene F-test showed that the variance of the two groups (ED and control group) departed from the homogeneity (F(1, 182) = 80.34; p < .001). Between-group comparisons by Student-Welch t-test showed that the two groups differed significantly on the EAT - 40 total score (t(120,15) = 52.59; p < .001), with participants in the ED group yielding higher scores (M = 63, SD = 23.55, Range = 3–108) than subjects in the control group (M = 10, SD = 8.61, Range = 1–51). According to Cohen’s criteria (Cohen, Reference Cohen1988), the effect size for these two independent groups was considerable: η2 = .811
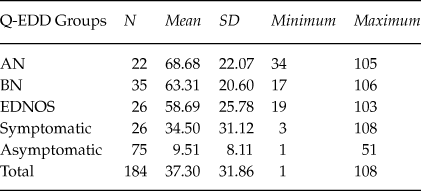
Table 3 shows the descriptive statistics of the EAT-40 for the Q-EDD groups. Results from the Levene F-test indicated that the variances of the EAT - 40 scores departed from homogeneity (F(4, 179) = 27.559, p < .001). Results from the Brown-Forsythe (B-F) robust test showed that the EAT - 40 mean scores did significantly differ across the five groups (F(4.92, 573) = 52.122, p < .001). The effect size of this between groups difference was considerable: η2 = .841
Descriptive statistics of the EAT-40 scores for the Q-EDD groups

Q-EDD: Questionnaire for Eating Disorder Diagnoses; AN: Anorexia Nervosa; BN: Bulimia Nervosa; EDNOS: Eating Disorders Not Otherwise Specified.
Post-hoc analyses indicated that differences among the AN, BN and EDNOS groups were not statistically significant. However, participants in the ED groups yielded significantly higher EAT-40 scores than participants in both the Symptomatic and the Asymptomatic groups. EAT-40 score mean was also significantly higher in the Symptomatic than in the Asymptomatic group (see Table 4).
p-values for post-hoc comparisons on the EAT-40 scores

Q-EDD: Questionnaire for Eating Disorder Diagnoses; AN: Anorexia Nervosa; BN: Bulimia Nervosa; EDNOS: Eating Disorders Not Otherwise Specified.
Convergent Validity
A total of 175 participants (87 in the ED group, and 88 in the control group) completed all the BULIT-R items. Results showed high correlations between the EAT-40 total score and the Body Image (r = .90, p < .001) and the Laxatives (r = .75, p < .001) dimensions of the BULIT-R. Correlation coefficients for the remaining subscales were moderate (r = .51 for the Diuretics, and r = .59 for the Binging domain; p < .001).
A total of 152 participants (74 in the ED group, and 78 in the control group) completed all the EDI-II items. All the EDI-II dimensions correlated significantly with the EAT-40 scores (p < .001). Results showed high correlations between the EAT-40 total score and the Drive for Thinness (r = .90), Body Dissatisfaction (r = .74), Ineffectiveness (r = .84), Interoceptive Awareness (r = .82), Asceticism (r = .83), Impulse Regulation (r = .74) and Social Insecurity (r = .84) dimensions of the EDI-II. The correlations with the remaining domains of the EDI-II were moderate (r = .56 for Bulimia, r = .67 for Perfectionism, r = .64 for Interpersonal Distrust, and r = .51 for Maturity Fears).
Cut-off point
The ROC analysis was conducted taking into account the proportion of participants with ED (52 %) in the total sample. The effect of the proportion of participants with ED on the EAT-40 efficacy has been adjusted using the ROC MACRO PROGRAM for SPSS (Bonillo, Doménech, & Granero, Reference Bonillo, Doménech and Granero2000).
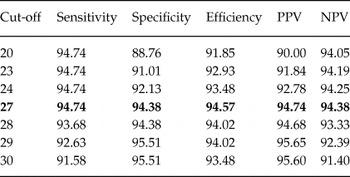
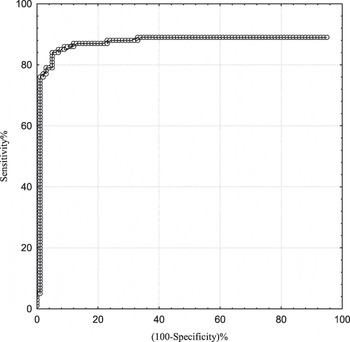
Results indicated that an optimal cut-score of 27 provided the point of maximal efficiency to differentiate between ED and control participants (see Table 5). The efficacy indices for the cut-score of 27 were: Sensitivity = 94.74% (False Negative = 6.26%), Specificity = 94.38% (False Positive = 5.62%), Overall Efficiency = 94.57%, Positive Predictive Power = 94.74%, and Negative Predictive Power = 94.38%. The Area Under Curve (AUC) was high (.979), supporting the accuracy of this cut-off to classify subjects with and without ED (see Figure 1). Correlation coefficient between the group categories (ED and control groups) and classifications given by the EAT-40 (cut-off score = 27) was φ = .88.
Results from ROC Analysis*

* Accuracy values in bold print indicate the optimal cut-off score to differentiate between the ED and the control group.
PPV: Positive Predictive Value; NPV: Negative Predictive Value.
ROC curve of the EAT40 to identify ED.

Discussion
The EAT-40 was developed as a multidimensional and clinically based questionnaire for measuring AN phenomenology according to Feighner’s criteria. However, over the years the questionnaire has been widely used to measure abnormal eating behavior and attitudes in subjects meeting DSM criteria for any ED. Even though the EAT has proved to have some sound psychometric properties, the underlying factor structure of the scale and the optimal cut-off score to identify subjects with ED have never been well established. This study addressed both controversial issues in the field.
Results from this study did not support the multidimensional approach that has widely characterized most research on the psychometric properties of the EAT. On the contrary, the results from this study suggest that the EAT-40 possesses an underlying unidimensional structure. Indeed, while the multidimensional models tested in the present study provided poor fit for the data, the oblique unifactorial model fits the data much better.
Furthermore, the results of reliability analyses provide evidence for the high internal consistency of the questionnaire (α = .97), and suggest that a coherent and meaningful representation of eating behavior and attitudes has been sampled by the EAT-40. The overall coefficient did not increase significantly by removing any of the items. These findings bring evidence in favor of maintaining all the items considered, and further support the fact that the questionnaire consists of a group of items measuring a unitary construct. It should be highlighted, however, that item 32 yielded a negative –instead of a positive- loading, indicating that when the EAT-40 is used in samples with undifferentiated ED, it should be negatively scored.
Lastly, results concerning the test–retest reliability of the EAT-40 are in line with previous findings (Carter & Moss, Reference Carter and Moss1984) and suggest that the questionnaire has high levels of stability over a two-week period. Nevertheless, it is worth noting that recall effects could also account for the high temporal stability of the EAT scores, given the short test-retest interval in this study.
Overall, the above findings are consistent with previous research reporting on the unidimensionality of the Spanish version of the EAT-26 (Rivas et al., Reference Rivas, Bersabé, Jiménez and Berrocal2010) and may also explain, at least partially, the high instability of the factorial structure of the scale across studies (Alvarez et al., Reference Alvarez, Mancilla, Vázquez, Unikel, Caballero and Corona2004; Castro et al., Reference Castro, Toro, Salamero and Guimerá1991; Eisler & Szmukler, Reference Eisler and Szmukler1985; Garner et al., Reference Garner, Olmsted, Bohr and Garfinkel1982; Nasser, Reference Nasser1994; Pereira et al., Reference Pereira, Maia, Bos, Soares, Marques, Macedo and Azevedo2008; Smead & Richert, Reference Smead and Richert1990; Wells et al., Reference Wells, Coope, Gabb and Pears1985). That is, a single dimension –instead of multiple factors– could better represent EAT items for measuring undifferentiated ED. These findings have several important implications, not only for research but also for theory and clinical practice in the field of ED.
Firstly, the results support the fact that the EAT-40 total score does provide an interpretable measure of a general factor related to abnormal eating behavior and attitudes in subjects with undifferentiated ED. In this regard, and as Mintz & O´Halloran (Reference Mintz and O´Halloran2000) have thoroughly discussed, the EAT is probably no longer a measure of AN, but an assessment tool for capturing undifferentiated (i.e., AN, BN and EDNOS) rather than specific ED. Indeed, these authors noted that when the EAT-40 has been used in nonclinical samples, high false positive rates have been reported, most of them identified as subjects with AN. Furthermore, if the unidimensional structure fits better the data, the multiple and different factors identified in previous research might lack sufficient power to strongly relate to other variables and, therefore, bias the results from empirical works in the field. Hence, further research of this issue is warranted.
Findings supporting the unidimensional structure of the EAT may also reflect that the core ED symptomatology is similar in the three main diagnostic categories (AN, BN, EDNOS) and subthreshold cases. Moreover, some consistencies across previous factorial structures obtained in different samples -with Dieting, Food Preoccupation, Bulimic behavior and Social Pressure to Eat being the main dimensions replicated – may actually result from overlapping symptomatology across different conditions. These considerations would also be consistent with the continuity model for understanding ED (Mintz & O´Halloran, Reference Mintz and O´Halloran2000), in contrast to a categorical or discontinuity approach.
The continuity perspective actually tends to minimize the sharp differences between subjects with full ED and subjects classified as subthreshold or symptomatics, as well as among the different full ED categories, highlighting that subthreshold and full forms differ quantitatively, rather than qualitatively. In other words, instead of being represented by discrete entities, ED are conceived as falling along a continuum/dimension from normal eating behavior and concerns to severely disturbed patterns of behavior and attitudes. Results related to the unidimensionality of the EAT provide preliminary support to the EAT-40 items as representing such a continuum as well as to the total score as a valid and reliable measure of dysfunctional eating attitudes and behaviors. Findings concerning the criterion-related validity of the questionnaire described below provide further support to the continuity ED approach. Nevertheless, these considerations are not incompatible with the use of the EAT dimensions to better characterize the group and/or individual clinical specificities.
On the other hand, clinical participants displayed higher EAT-40 scores than subjects in the control group, supporting the criterion-related validity of the questionnaire. Furthermore, when participants were classified according to an external criterion (i.e., the Q-EDD), results from the between-group comparisons showed that differences across the ED groups on the EAT-40 scores were not statistically significant, while participants with ED did significantly differ from the symptomatic and the asymptomatic groups. These findings replicate those reported by Mintz and O´Halloran (Reference Mintz and O´Halloran2000) for both the EAT-40 and the EAT-26, and add support to the validity of the questionnaire as a continuous measure of subthreshold and undifferentiated forms of ED. Increasing EAT-40 scores seem to be indicative of increased eating pathology, with full ED all considered to be at one end of the hypothesized eating pathology continuum and asymptomatics at the opposite end.
The EAT-40 also showed an appropriate convergent validity with respect to other scales which assess behavior and attitudes related to ED. The EAT-40 total score correlated with the Body Image scores from the BULIT-R. Indeed, concern about body image is one of the main features of ED, in general, and of BN, in particular. Similarly, the EAT-40 total score correlated with Binging, Diuretics and Laxatives scores on the BULIT-R. These results are consistent with the idea that the EAT-40 may also be useful to assess some particular features of BN (Gross et al., Reference Gross, Rosen, Leitenberg and Willmuth1986).
The EAT-40 also showed a high convergence with other relevant features of ED assessed by the EDI-II, such as Drive for Thinness, Body Dissatisfaction, Ineffectiveness, Perfectionism, Interoceptive Awareness, Asceticism, Impulse Regulation, and Social Insecurity. The EAT-40 also showed moderate correlations with the Maturity Fears and the Interpersonal Distrust domains of the EDI-II, which may or may not be present in subjects with ED. These results are consistent with previous studies reporting high correlations of the EAT-40 with general features of ED and AN, and positive and moderate correlations with particular features of BN measured by the EDI (Gross et al., Reference Gross, Rosen, Leitenberg and Willmuth1986; Raciti & Norcross, Reference Raciti and Norcross1987). It is worth noting that previous research used the EDI-I, while findings in this study showed that the EAT-40 also correlated with the three new subscales included in the EDI-II. In sum, the EAT-40 showed a high convergence with several features for both ED, AN and BN, also supporting the idea that the EAT-40 could be used as a global measure of any DSM-IV ED.
Hence, taken together, findings concerning the EAT-40 in this study and the EAT-26 in previous research (Rivas et al., Reference Rivas, Bersabé, Jiménez and Berrocal2010) suggest that both versions of the questionnaire may be used without cut-off scores as continuous measures of abnormal eating behavior and attitudes. Nevertheless, it should be highlighted that previous research on the short version of the questionnaire did not address the convergent validity of the questionnaire (Rivas et al., Reference Rivas, Bersabé, Jiménez and Berrocal2010). Hence, available evidence on the validity of the EAT total score is stronger for the long than for the short version of the questionnaire.
On the other hand, results from the ROC analyses indicate that when the EAT-40 is used to identify subjects with undifferentiated ED (i.e., full forms of BN, AN or EDNOS), it yields high accuracy estimates for specificity and sensitivity. A cut-off score of 27 provides the point for better differentiating between subjects with and without full forms of ED. Indeed, a large majority of subjects in the control group displayed a maximum score of 27. In particular, a percentage of 94.38% was correctly classified as subjects without ED when this cut-off score was used, and only a low percentage of participants without ED (5.62%) exceeded the estimated threshold of 27. Similarly, scores above 27 accurately indicated the presence of full forms of ED. The percentage of subjects correctly classified into the original group (ED) using the threshold of 27 was high (94.74 %), and the false negative rate was low (6.26%).
The aforementioned results are similar to those reported by Mintz & O’Halloran (2000), who also found high specificity and sensitivity values when the EAT-40 score was used to differentiate between subjects with and without ED, and provide further support to the hypothesis that the accuracy rates may improve if the questionnaire is used as a tool for measuring undifferentiated rather than specific ED (Mintz & Kashubeck-West, Reference Mintz and Kashubeck-West2004). Additionally, these findings indicate that the commonly used EAT cut-off score for detecting ED should be reviewed. Indeed, the accuracy values of the test are higher if a cut-off score lower than 30 is used for detecting any DSM eating disorder, which is consistent with previous results concerning the Spanish version of the EAT-40 (Alvarez et al., Reference Alvarez, Mancilla, Vázquez, Unikel, Caballero and Corona2004; Canals et al., Reference Canals, Carbajo and Fernández2002; Castro et al., Reference Castro, Toro, Salamero and Guimerá1991; Irala et al., Reference Irala, Cano-Prous, Lahortiga-Ramos, Gual-García, Martínez-González and Cervera-Enguix2008).
The above results are in contrast with those obtained for the Spanish version of the EAT-26 (Rivas et al., Reference Rivas, Bersabé, Jiménez and Berrocal2010), which indicated that the short version of the questionnaire features good specificity but moderate sensitivity (59.74%). Therefore, taken together, these findings suggest that, even though longer, the EAT-40 is a more suitable tool than the short version for detecting full forms of ED. Nevertheless, it should be highlighted that the lower sensitivity of the EAT-26 when compared with the EAT-40 could result from differences in the diagnostic tools across the studies. While ED diagnosis was established according to results from the Q-EDD in the Study 2 by Rivas et al. (Reference Rivas, Bersabé, Jiménez and Berrocal2010), participants in this study were assessed through the Structured Clinical Interview for DSM-IV-R.
Several shortcomings of this study, which in turn suggest future research issues, should be noted. Firstly, the wide age range of the sample, the inclusion of the binge eating category –which is still subject of debate because of its controversial clinical validity and phenotypic specificity (Wonderlich, Gordon, Mitchell, Crosby & Engel, Reference Wonderlich, Gordon, Mitchell, Crosby and Engel2009), as well as the Classical Test Theory on which this study is based, limit the generalizability of our findings. Hence, further research aimed at exploring and replicating the unidimensionality of the EAT-40 overall score in larger and different samples would be needed in order to thoroughly support the validity of the total score of the test.
Secondly, the optimal cut-off score has been obtained with two groups (with and without an ED) of a similar size. The selection of an optimal cut-off is influenced by the study design, and depends on the prevalence, the consequences of correct and incorrect classifications, and the distributions of scale scores among normal subjects and cases. Consequently, this cut-off score should not be used to detect an ED in a general population where the ED prevalence is very small, and the two subject groups have a very different size. Future studies could focus on establishing the optimal cut-off score for the total score in subject samples drawn from the general population. These results would allow the use of the EAT-40 as a “screening” instrument. Future research might also focus on the divergent validity of the test, which has not been analyzed in this study.