

Introduction
The region with which this article is concerned is not easy to define. South-east Europe, as a geographical entity, covers a territory that from north to south runs from the Danube to the Sea of Crete and from west to east from the Adriatic and Ionian seas to the Black and Aegean seas. In this article, it refers to a region comprising countries that, prior to 1990, had not been part of capitalist Europe or the then European Communities. However, it is a region wider than that defined by the European Union to be the West Balkans. The latter refers only to pre-accession and candidate countries and places them all firmly into the western half of the Balkan Peninsula. This article refers not only to more recent EU member states such as Slovenia and Croatia, but also to Bulgaria and Romania. All the countries discussed here are those in which the European Bank for Reconstruction and Development (EBRD) has an interest – the bank describes them as countries where it “works” (EBRD, n.d.).
With the exceptions of Bulgaria, Romania and Albania, all the countries covered were once parts of the former Yugoslavia. Moreover, all had been “socialist,” even if Yugoslavia was not part of the “Soviet sphere.” Romania was in many respects outside that sphere, and Albania was peculiarly independent. However, all the countries had characteristics that are pertinent to understanding how their current pension systems came into being and the challenges these pension systems continue to face.
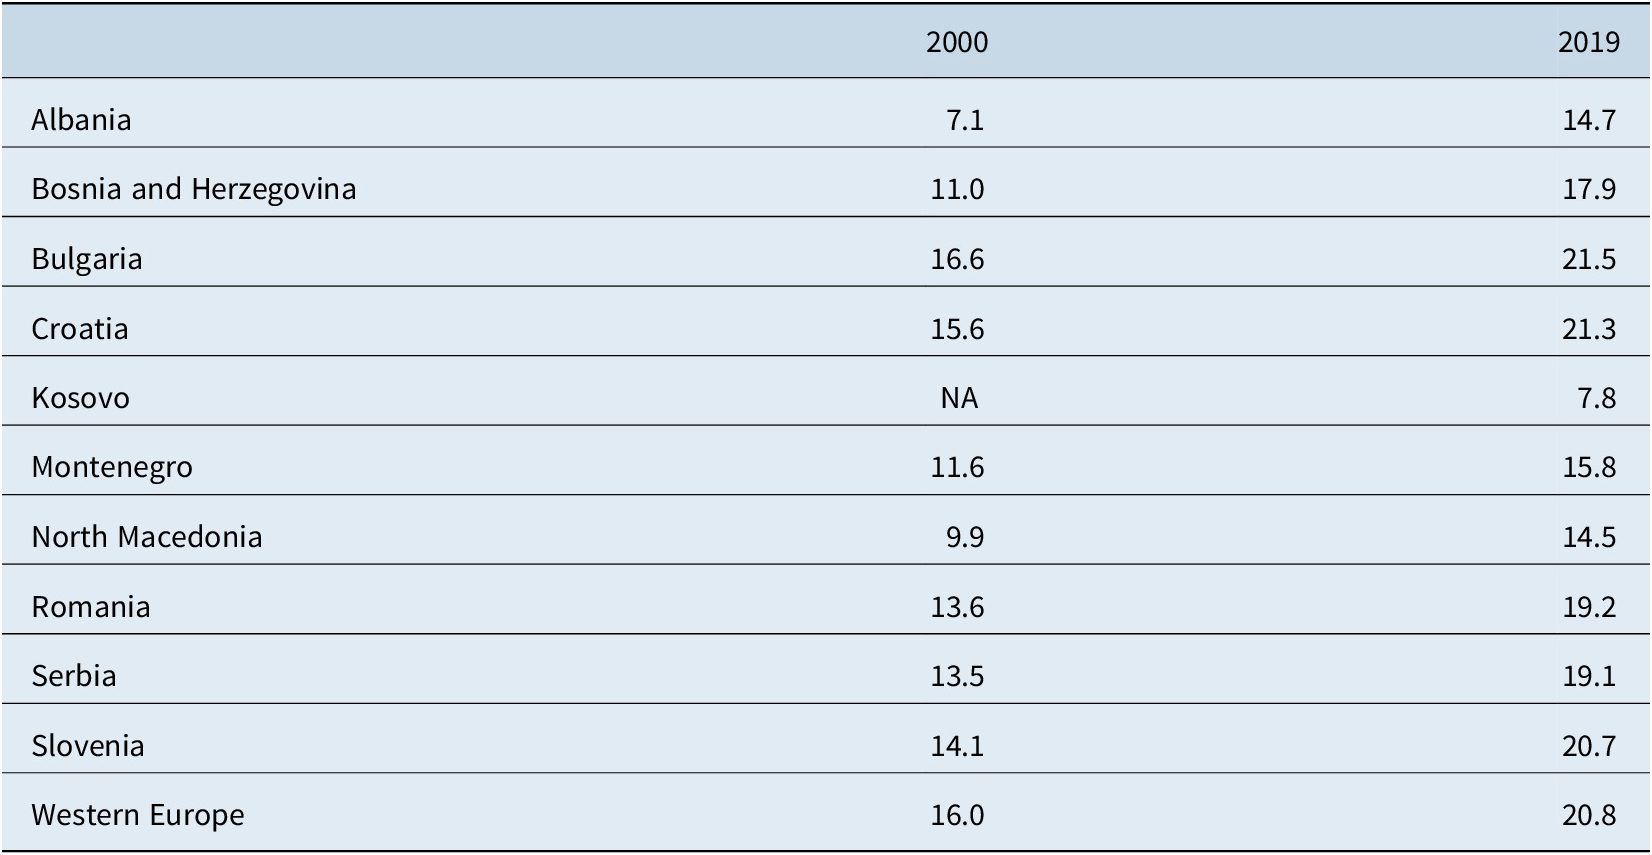
First, the countries of the region have demographic structures not dissimilar to those of Western Europe. They are all relatively old societies and their populations are ageing. The only exception is Kosovo, which has a much younger population (Table 1).
Age structure of the population (%65 and over).

Source: UN population statistics, except Kosovo where source is CIA World Factbook.
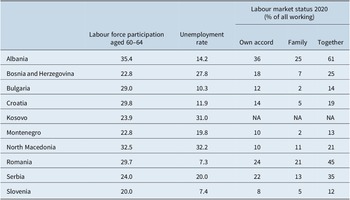
Second, all the countries have rather low levels of labour force participation. Of the population of “working age,” a much lower proportion is “active” in the labour market and an even lower proportion have jobs. The low level of activity is partly a function of inherited lower retirement age in public pension systems – usually as low as 60 for men and 55 for women – and it has been exacerbated by resort to early retirement programmes that were instituted following the economic deteriorations many experienced in the post-1990 period. The low level of employment follows from this. Unemployment levels are high in many of these countries. Finally, of those who do have jobs at all, many are in the primary agricultural, sector, and many of these jobs are “informal,” and so not registered for social insurance and, thus, pension purposes (Table 2).Footnote 1

Third, most of these countries suffer from low rates of effective tax collection. This is related not only to the extent of informality of employment but also to the non-registration of wages and of “envelope payments” – payments in cash that supplement wages but are not recorded by tax and social security collection authorities (Williams, Reference Williams2010). All this diminishes the ability of the state to meet pension promises it might have made.
Fourth, and related to the low tax-take and the economic difficulties many of the countries are confronted with, the governments of many of them face or have faced, substantial fiscal problems. Moreover, in all the countries governments have sought to restructure their economies away from being state-supported to being market-oriented, and most of them have sought guidance and support in doing this. Many have turned to the international financial institutions (IFIs) – especially the World Bank and the IMF – for assistance, and this assistance is not offered unconditionally. Pension reform is a frequent component of the advice offered (see, eg, Casey, Reference Casey2009; Orenstein, Reference Orenstein2008). Those who are aspiring to, or have achieved, EU membership, has also been subject to the strictures of EU fiscal policy that, up to the onset of the covid-19 pandemic, placed controls upon the size of deficits and the size of debt that countries could or should build up.Footnote 2
Fifth, all the countries suffer from underdeveloped capital markets. This is both because they are newly capitalist and because they are small. These two characteristics limit the extent to which these countries can issue products such as shares and bonds that are of sufficient quality that pension funds can invest in them.
The legacy pension systems
Whatever their heterogeneity under “socialism” the pension systems of all the countries shared certain commonalities, and these proceeded from a Bismarckian tradition that had influenced their pre-second world war existence. They provided pensions to employees based upon years of working and, to a more limited extent, upon earnings. Pensions operated on a pay-as-you-go basis, and they were financed out of a tax on wages.Footnote 3 Public pensions institutions existed, and these were the ultimate collectors of revenue and the payers of benefits – even if their income could be supplemented by transfers from general taxation. Pensions were not indexed but were subject to ad hoc increases, sometimes for political reasons as governments sought to placate or favour the population. Sometimes, however, the incomes of pensioners fell far behind those of the working population. Prima facie, public pensions were more progressive than earnings, but certain groups received special pensions – ranging from categories such as judges, senior academics, the military and the police, and also sportspeople and dancers – and for the last, pension ages were also very much lower (Luković, Reference Luković1998; Pejovich, Reference Pejovich1979).Footnote 4
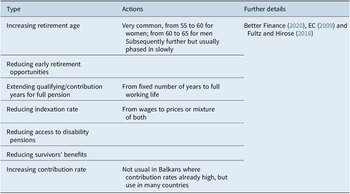
The breakup of Yugoslavia and the decided shift by all the countries in the region towards a more market-oriented economy had an impact on the pension system in many of them. There were, however, some countries where little change occurred – viz. Slovenia, the first of the states of Yugoslavia to declare itself independent; Serbia, which saw itself as the de facto inheritor of Yugoslavia; and Albania, which had always been an independent nation state. Each of these maintained a “defined benefit” (DB) pension with benefits tied to earnings and years of contributions and financed by contributions on wages (often supplemented by transfers from general revenue). Changes were made, but these changes were essentially “parametric” – they involved details to the system in terms of the amount of pension, at what age it was paid, how much was contributed, etcetera – rather than any structural change of the system (Table 3.).Footnote 5
Examples of parametric reforms.

The reformed pension systems
As the successor countries to Yugoslavia emerged, many of them sought to reformulate their pension systems. That they did this was not particularly surprising. Governments wished to assert their sovereignty, and this included “social sovereignty.” The establishment of social security systems has been recognised as part of the nation-building process (Rokkan, Reference Rokkan and Tilly1974). They were a part of national identity and as a sign of asserting this.Footnote 6 Moreover, countries wished to show that not only their economies were appropriately “free market” and open to foreign direct investment, but also their pension schemes accorded with “modern” principles of operation. Since the mid-1990s, the World Bank, in particular, had propagated the benefits of funded pension systems (WB, 1994). The reforms it advanced, it described as “paradigmatic.” They involved changes in the basic way in which pensions would work – relying on capitalisation, the building up of returns on individual investments, and the rewarding of higher earnings and longer periods of contribution with higher benefits. The approach was encapsulated in what became known as the “three pillar model” – a mandatory, contributions-based, pay-as-you-go pension, a mandatory, savings-based or funded pension and a voluntary, savings-based supplementary pension. The latter two components are also referred to as “defined-contribution” (DC), as opposed to DB, pension systems.Footnote 7
Adopting systems reflecting such an approach was one way that governments could show they were attuned to belief systems of the IFIs (Müller, Reference Müller1999). Of those countries that did not change, some, such as Serbia, had a system that they wished to preserve. Equally, Montenegro, once it separated from Serbia, saw the social partners rejecting proposals for radical reform. Also resistant to pension reform was Slovenia, which was peculiar amongst the Balkan states in perpetuating a form of corporatism that could be explained by its historical affinities to Austria (Feldmann, Reference Feldmann2014). Albania, like Serbia and Slovenia, was reluctant to engage with international lenders. Into the bargain, at least in the 1990s and early 2000s, neither Serbia nor Slovenia was an “indebted country,” so neither had a need to turn to the IFIs for loans.Footnote 8 Romania was more reluctant than was Bulgaria to turn to the IFIs, but both made reforms – the latter on a more scale than the former (Adascalitei, Reference Adascalitei2015).
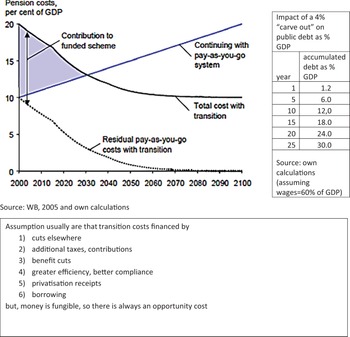
Of the countries that did adopt a new pension system, they did so by diverting a proportion of contributions to mandatory personal accounts. These accounts would take contributions and invest them in approved financial products – those of “investment grade” – on which, it was assumed, a positive return would be made. At retirement, the sum invested would become free, and it would be turned into an annuity to finance years in retirement. The initial amount of contributions diverted was relatively small. However, diversion had its own fiscal consequences, as shown in Figure 1.
Illustration of “transition costs.”

This is because the contributions diverted do not flow into the social security administration’s own accounts but rather into the private, personal accounts of each member. Yet, out of the reduced contributions they now receive, these administrations still have to pay benefits to existing pensioners. In other words, the pay-as-you-go principle is undermined. Consequently, deficits are built up and these have to be covered – either out of other sources of taxation or out of borrowing. Insofar as countries were seeking to make themselves attractive to outside investors, their governments wished to avoid increasing tax burdens. And insofar as they wished to appear fiscally responsible, their governments did not wish to be seen going out on borrowing binges. At least in the short- and medium-term, the reforms place stress upon public finance, even if, in the much longer term, public expenditure on pensions should fall.Footnote 9
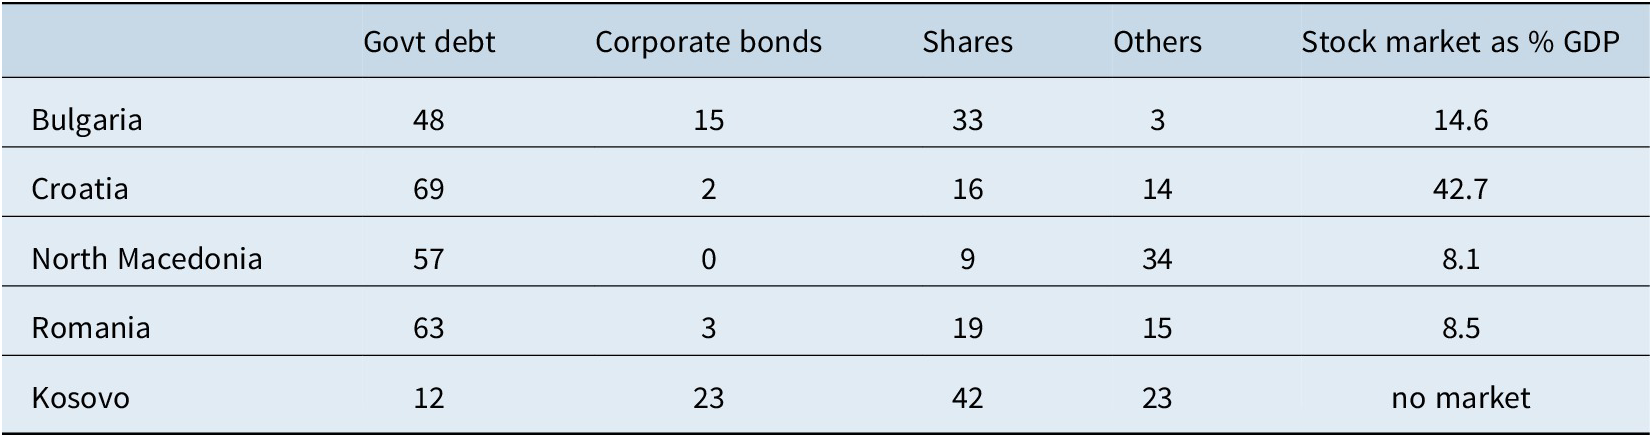
In fact, although a part of pension provision has been “privatised,” in many cases, the privatisation that occurred was not “real.” The lack of developed capital markets frustrated this. Pension plans were encouraged to invest internally, and in some cases, they were even forbidden to invest abroad, since this meant they were exporting capital. Capital exports are the same as investing abroad, whilst investing internally would facilitate economic development and, so help pension reform to pay for itself.Footnote 10 Yet, in the absence of investable products, the funds could often do little more than investing in government debt – including debt that had to be issued to meet the transition costs of the pension reform. As Table 4 shows, even by 2018, nearly 70 per cent of the holdings of Croatian private pension funds were in government debt.
Asset allocation (%) of 2nd pillar funded pension schemes (mid/late 2018) and stock market size (2010).

Note: US Stock market stood at 104% and UK market at 108% of GDP in 2010.
Source: National pension authorities; World Bank and Fed Reserve of St Louis.
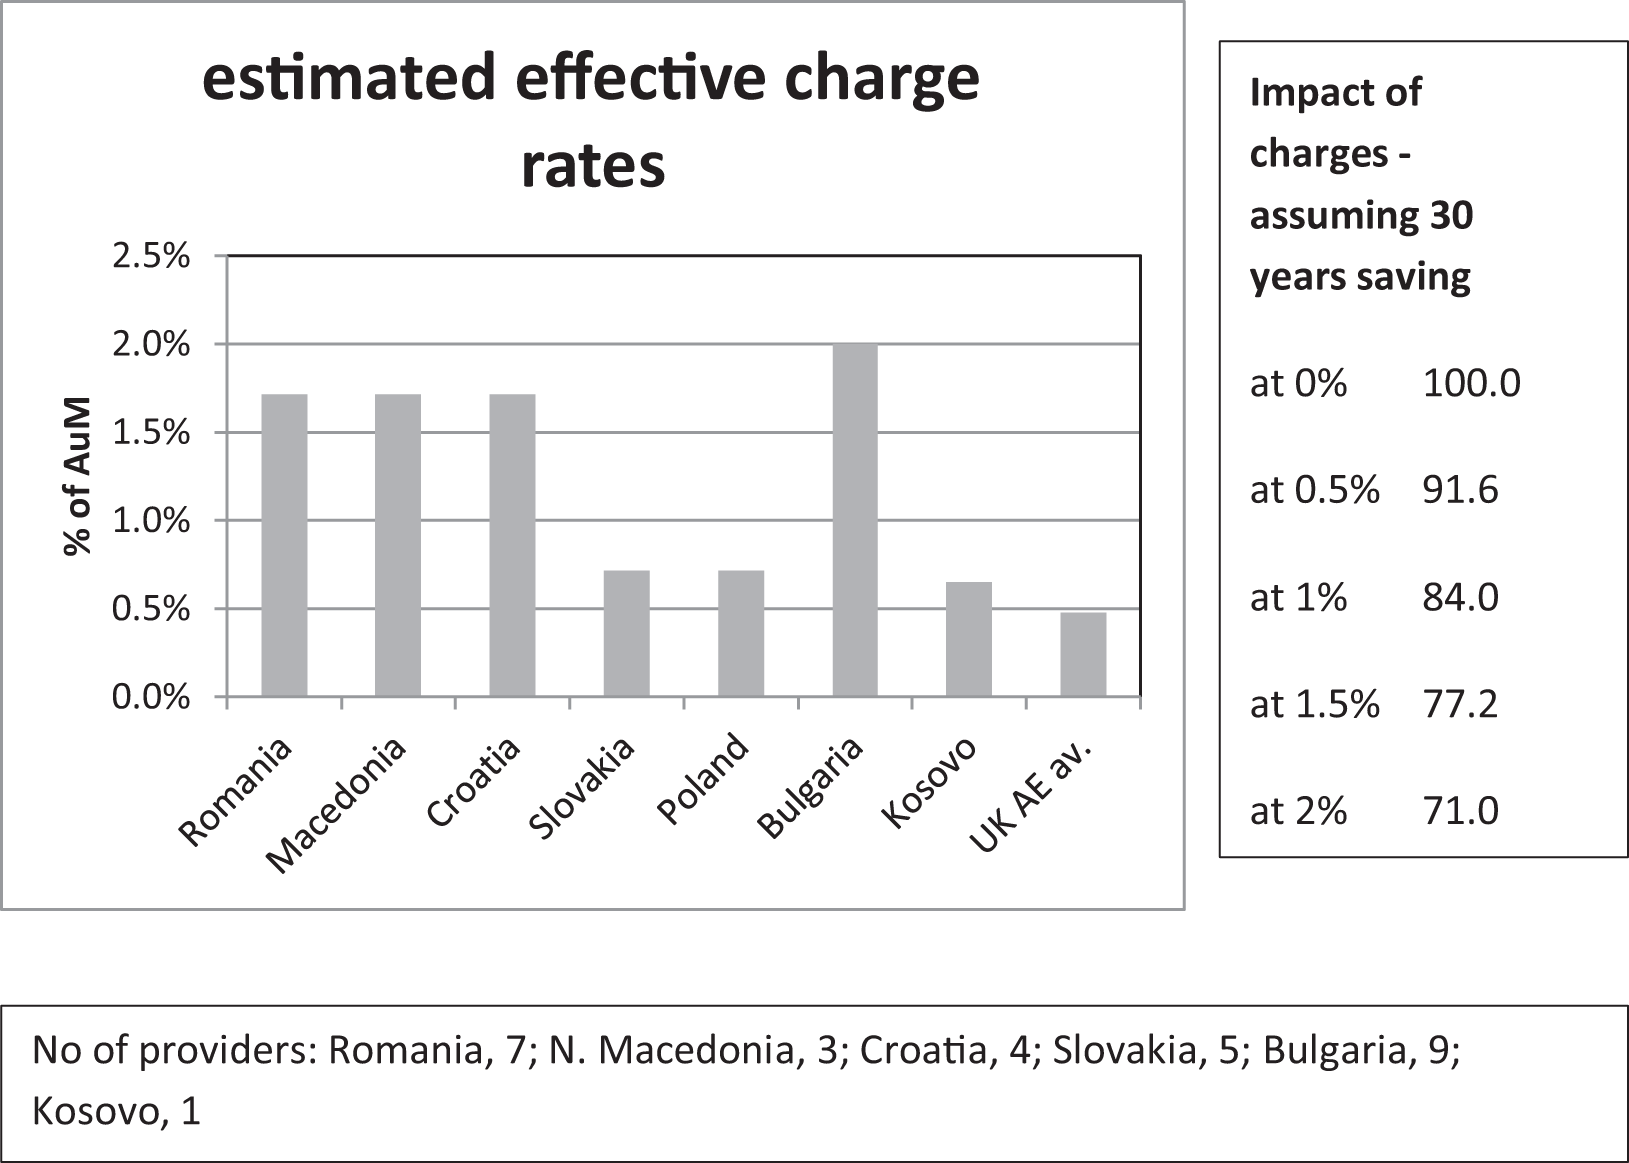
Even in the absence of the potential fiscal problems the reforms generated, the pension plans established have to prove they are able to generate adequate returns. Here, they are dependent on the performance of the products in which they invest, but also on the charges the providers’ levy. In a perfect market, providers might be expected to compete with one another, and this should drive charges down. In practice, this has rarely happened. First, there are few providers in many of the countries. Oligopolistic rather than competitive behaviour is more likely to prevail.Footnote 11 Second, there have been few efforts to cap charges, which are high relative to those of some other countries with quasi-mandatory supplementary pension systems. Such charges eat heavily into what has been saved.Footnote 12
Charges and providers.
Source: Schwartz et al, Reference Schwartz, Arias, Zviniene, Rudolph, Eckardt, Koettl, Immervoll and Abels2014; Kosovo, national authories, UK, average for DC auto enrolled plans; naonal authories for number of providers; own calculaons for effect of charges.

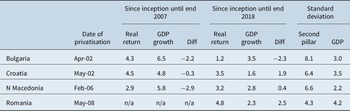
Analyses of actual scheme performance, measured in terms of real returns, have suggested this has not always been satisfactory. Returns have, perhaps, outperformed GDP growth, but they have been much more volatile than the latter. Such volatility can have an impact on the sum that is available once the retirement age is reached. This can lead to substantial variations in the pensions paid to people who had identical employment and savings histories (Table 5).
Performance of mandatory funded pension schemes.

Note: Real returns represent semi-net returns. They exclude asset-based fees but include contribution-based fees.
Source: Altiparmakov and Nedeljković (Reference Altiparmakov and Nedeljković2021).
The most dramatic restructuring of pensions came in Kosovo whilst it was under the United Nations administration. There, the legacy Yugoslavian and Serbian pension scheme was repudiated completely.Footnote 13 Instead, all qualifying workers have been required to participate in a funded scheme, with the state limiting itself to providing a basic, minimum pension for those whose resources were inadequate. This pension scheme would not seek to invest internally – rather only external assets were to be purchased. The sole exception was Kosovan government debt. What is more, investment of the fund was delegated to external managers.
Re-reforming pensions
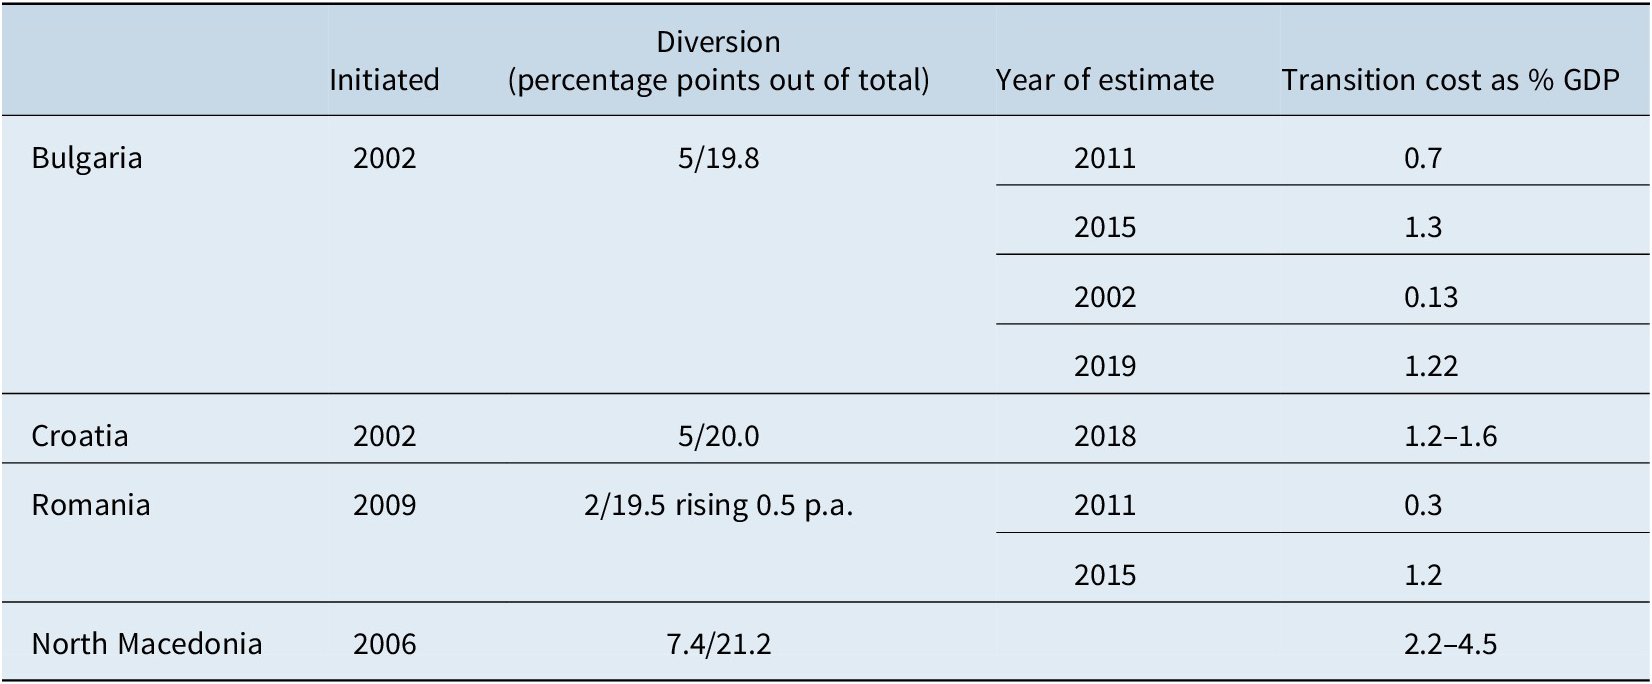
The size of the transition costs generated by the imposition of mandatory funded accounts caused many of the countries to backtrack on, or at least slow down, the changes that had been made. Approximations of transitions costs have been made in a few cases, although in at least one country – Croatia – they were studiously avoided (Bezovan, Reference Bezovan2018). Nonetheless, it was because of fiscal concerns that a smaller diversion than had initially been planned – five instead of 10 percentage points of contributions – was adopted (Table 6).
Fiscal consequences of mandatory funding.

Source: Bulgaria and Romania 2011, Soto et al (Reference Soto, Clements and Eich2011); ibid 2015, Better Finance (2020); Bulgaria 2002 and 2019, Petkov (Reference Petkov2020); Croatia, Samodol (Reference Samodol2020); N. Macedonia, Bornarova (Reference Bornarova, Stambolieva and Dehnert2011).
The so-called re-reforms were largely initiated in the context of the “great recession” of 2018 onwards when many governments found themselves under acute fiscal pressure. Bulgaria, which was generally recognised as enjoying a more sustainable fiscal situation, made no changes. Romania held back proposed increases in the amount to be allocated towards individual accounts, and the amount diverted still remains below the level initially foreseen. In the case of Croatia, the government threatened pension funds with the suspension of transfers at all if they failed to invest directly in a planned toll road – an investment that would have relieved the government of paying for the project itself. Eventually, the government withdrew its proposals, having found external partners (Krzyzak, Reference Krzyzak2015).
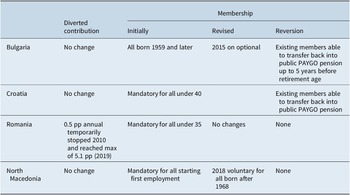
The extent to which participation in the funded pension was mandatory has also been relaxed. In some countries, members of funded pension plans had the opportunity to revert to the pay-as-you-go public pension scheme if their prospective total pension was less favourable than it would have been had they not had to divert their contributions. In such cases, they did have to sacrifice the funds they had built up. In other countries, workers were offered the alternative of joining a funded pension or making all their contributions to the public scheme (Table 7).
Revisions to mandatory funded schemes.

Challenges that are to be faced
Few, if any, of the south-east European countries were ripe for the sort of sophisticated pension systems that a number of them experimented with in their post-socialist period. They do not have the capital markets to sustain such systems. Moreover, on many indicators of governance – from those of the World Bank to those of organisations such as Transparency International – they lack the capacity to manage them.Footnote 14 Trust in financial institutions is not high. In some cases, there is the legacy of past scandals – of which the pyramid scandals in Albania, which culminated in 1997, are merely the most prominent (Jarvis, Reference Jarvis2000). Governments, themselves, have proved frail and, whether for good reasons or bad, they have failed to commit themselves to what they enacted. This, in itself, does not contribute to confidence.Footnote 15
International institutions and lenders have hardly been of assistance. Some of them actively encouraged reforms that were unsuitable. Some of them compounded the problem by not offering relief when fiscal problems that ensued manifested themselves. Here, the principal culprit was the World Bank, although organisations such as the European Commission and the OECD were also broadly supportive of “three pillar” solutions (EC, 2010; OECD, 2005). The EBRD, which has directed some of its energies to the region, has only addressed pension reform rather indirectly. Where it did so, it took the position of supporting the development of financial services and so, indirectly at least, endorsed the sort of reforms the WB and others had promoted.Footnote 16
In general, and like the EBRD, the IFIs favoured fiscal rectitude. In so far as they spoke about pension systems more generally, they tended to point to the costs of public pension schemes and their looming insolvency. This made them, if nothing else, advocates of the sort of parametric reforms that reduced pension benefits and increased retirement ages. On the issue of poverty in old age, they were largely silent. The main exception was the European Union, where those interested in social policy at least monitored the relative level of older people’s financial well-being and often found it deficient.Footnote 17
This is not to say that some of the IFI’s proposals were without merit. Over the years, the World Bank put increasing emphasis on the role that could, or should, be played by tax-financed minimum pensions. Fiscal pressures on public pension schemes, together with these schemes incorporating a basic minimum, might well result ultimately in the state pay-as you-go pension effectively playing this role. Developments in this direction have been observed in countries with ostensibly very different systems to those of the countries of south-east Europe – for example, Germany and Sweden.Footnote 18 They have also been observed in Serbia, where a break with the Bismarckian tradition has been commented upon (Matković & Stanić, Reference Matković and Stanić2020). The role of the state might better be restricted to the provision of a tax financed, minimum pension that ensured that those in retirement had a minimum income sufficient to keep them out of poverty – perhaps more on the lines of the World Bank’s “fifth pillar” pension (Holzmann & Hinz, Reference Holzmann and Hinz2005). Were increased retirement income to be sought, voluntary, funded pensions could play a part – along the lines of the World Bank’s “third pillar” and alongside a minimum pension.Footnote 19 Here, the Kosovan case also provides some indication of how a system might function. There, there was no pretence that pension resources be used to invest in the country itself. Rather, investment returns should be sought abroad. On the face of it, this proposition might appear to be an example of falling for the fallacy of aggregation. This would be the case if all countries were to act in this fashion, but it would not be if only a handful of small countries were to do so.Footnote 20 Small is what many of the Balkan countries are.
Nonetheless, this would still require the establishment of an effective voluntary pension structure that was not distorted by high charges or open to seduction to lend to the government. On this latter point, the Kosovan system appears to have stumbled. The fund did experience the same downturns that other capitalised schemes in the 2008 downturn, but this did not provoke any changes in its investment approach. A change did, however, occur in the late 2010s. The extent to which the fund invested in domestic government bonds increased substantially – from 6 per cent in 2016 to 29 per cent in 2020.
Although the south-east European countries are members, or aspirant members, of the European Union, they should not necessarily aspire to the standards of social protection that prevailed in the member countries during the 1960s and 1970s. These standards have already proved problematic in those countries. Rather, the south-east European countries should concentrate on improving their economies and, thus, their ability to pay for old age. This requires them to tackle more deep-rooted problems than pension systems alone.
Acknowledgements
Thanks are due to participants at earlier seminars in Opatija, London, Belgrade, and Skopje, where elements of this article had been presented. Further thanks are due to Nikola Altiparmakov, Will Bartlett, Artan Mustafa, and Merita Xhumari. I have benefited over the years from work I undertook whilst a senior economist at the OECD working on pensions in Central and Eastern Europe, from participation in seminars organised by the EBRD and the European Commission, and from numerous events organised by the London School of Economics (LSE).
Disclosure statement
No potential conflict of interest was reported by the authors.
Notes on Contributors
Bernard H. Casey is a retired academic, a former staff member of OECD, and was a frequent consultant to European Commission. His research interests cover the economic implications of societal aging.