Introduction
The alternating and often reciprocal changes in nasal airflow, termed the ‘nasal cycle’, have been actively studied over the last century, with the first scientific study reported by Kayser in 1895.Reference Kayser1 Kayser used an objective measure of nasal airflow and measured the time taken to draw equal volumes of air through each nasal passage.
Different objective measures of nasal airflow have been used over the last century to study the nasal cycle, such as the Glatzel mirror,Reference Davis and Eccles2 rhinomanometry,Reference Eccles3 acoustic rhinometry,Reference Roithmann, Cole, Chapnik, Shpirer, Hoffstein and Zamel4 peak nasal airflow and rhinospirometry.Reference Hanif, Eccles and Jawad5 However, they all have the same restriction in that they require the subject to be supervised in using the equipment when measuring nasal airflow. The Glatzel mirror is the simplest method of studying the nasal cycle, but it is best used in the laboratory or clinic environment in order to standardise measurements, as the positioning of the mirror below the nose is critical for reproducible measurements.Reference Price and Eccles6
Previous studies using subjective assessment have failed to assess nasal airflow within the nasal cycle with any accuracy beyond that of left and right nostril dominance.Reference Funk and Clarke7 The subjective assessment of nasal airflow between nostrils is limited by the lack of any direct physiological sensation of nasal airflow. Nasal airflow is instead perceived indirectly by cold receptors in the nasal cavity.Reference Eccles8 The Nasal Obstruction Symptom Evaluation (‘NOSE’) scale has been validated for global subjective assessment of nasal airflow, and can be used clinically to aid decisions on surgical intervention.Reference Sen, Dutta, Haldar and Sinha9 However, it is likely that a more sensitive method of subjective nasal airflow is required to detect such changes in the nasal cycle.
This study investigated a simple subjective scale that may be used to study the nasal cycle. The subjective ordinal scale is a method of subjective nasal airflow assessment that was first used by Boyce and Eccles in a study on the selection of patients for nasal septal surgery.Reference Boyce and Eccles10 It can be used to calculate a nasal partitioning ratio: a measure of −1 to +1 indicating whether airflow predominates in the left or right nostril and to what extent this is the case. The subjective ordinal scale is assessed in this paper as a method of studying the nasal cycle by comparing subjective measurements of nasal asymmetry with those obtained by the objective method of rhinomanometry.
The nasal cycle has been classically described as an alternating pattern, in which, over a prolonged observed period, there is roughly equal distribution of airflow between the left and right nasal passages; during this time, reciprocal changes in nasal airflow are expected to be observed with a regular periodicity.Reference Stoksted11 When measuring the nasal cycle, these classical changes are often searched for, but are not always seen. Where a nasal septal deviation exists, equality in nasal airflow is unlikely to be achieved. Sometimes, changes in nasal airflow can occur in a more in-phase relationship, and thus reciprocal changes may not necessarily be seen.Reference Fisher, Palmer and Lund12
Ancient Yoga texts first observed the subjective changes in nasal airflow brought about by the nasal cycle, but documented scientific studies in this area have only been performed in the last century. Funk and Clarke, in 1980,Reference Funk and Clarke7 found that subjective assessments of nostril dominance (i.e. self-assessment of which nostril felt more patent), were concordant with rhinomanometric assessment in 114 out of 123 measurements (93 per cent); however, they were not able to use these assessments to demonstrate a ‘classical’ nasal cycle.Reference Funk and Clarke7
Gungor et al., in 1999,Reference Gungor, Moinuddin, Nelson and Corey13 combined the technique of acoustic rhinometry with a visual analogue scale (VAS) to monitor the nasal cycle. Gungor and colleagues looked for a correlation between ‘CSA2’ measurements (the cross-sectional area of the nasal cavity at the anterior tip of the middle turbinate) taken using acoustic rhinometry and the VAS, but were unable to find any correlation, indicating that the VAS is a poor tool for monitoring the nasal cycle.Reference Fisher, Palmer and Lund12 It is likely that this tool provides nasal cycle measurements which are too simplistic for nasal airflow assessment, by examining only the relative airflow between the two nostrils.
The subjective ordinal scale is a self-assessment tool for nasal patency, whereby the individual assigns a numerical value for how freely they feel air flow through each nostril. It was created by Boyce and Eccles in 2006;Reference Boyce and Eccles10 the scale is presented in Figure 1. The scale has a high sensitivity, of 81 per cent, and specificity of 60 per cent, for detecting an abnormal nasal partitioning ratio.Reference Sen, Dutta, Haldar and Sinha9 Whereas the VAS only gives the user the opportunity to rate where they feel nasal airflow predominates, the subjective ordinal scale allows the user to rate airflow for each nostril individually, and so has the potential to be more sensitive to the often subtle changes that can occur within the nasal cycle.
The subjective ordinal scale for assessment of nasal patency.Reference Sen, Dutta, Haldar and Sinha9

The nasal partitioning ratio represents relative airflow between the left and right nasal passages. Hanif et al. first described this measure in 2001.Reference Hanif, Eccles and Jawad14 A value of −1 indicates complete obstruction of the left nasal passage and a value of +1 indicates complete obstruction of the right nasal passage.Reference Roblin and Eccles15 The nasal partitioning ratio can be calculated objectively using rhinospirometry or rhinomanometry, and is comparable for both.Reference Gungor, Moinuddin, Nelson and Corey13 It can also be calculated using subjective measurements recorded with the subjective ordinal scale.Reference Sen, Dutta, Haldar and Sinha9 A weakness of the nasal partitioning ratio is that in representing airflow asymmetry it does not reflect any obstruction that is shared in both nostrils, as may be seen with an S-shaped nasal septum.Reference Hanif, Eccles and Jawad5 However, as this is a stable anatomical factor, it will not affect the physiological changes seen within the nasal cycle. The nasal partitioning ratio can also be used as an independent measure of nasal airflow.
The nasal partitioning ratio can be calculated using the following formulae (where ‘vol’ refers to the volume of airflow passing through an individual nostril and ‘SOS’ refers to a subjective measurement (subjective ordinal scale) taken for airflow for each nostril): (1) objective nasal partitioning ratio = left vol − right vol / right vol + left vol; and (2) subjective nasal partitioning ratio = left SOS − right SOS / right SOS + left SOS.
Materials and methods
Thirty healthy participants aged over 18 years were recruited from a university campus. Individuals were excluded if they had: any chronic nasal disease; active nasal disease; a history of nasal trauma; significant septal deviation; upper lip facial hair (that may interfere with the measurement of nasal resistance); a known allergy to surgical tape or rubber; or any disease, or medical or surgical history that the investigator deemed may affect nasal physiology and influence the results of the study (e.g. chronic respiratory disease or the intake of medicines known to affect the nose such as topical corticosteroids). Individuals who used tobacco daily, and those who consumed more than 4 units of alcohol within the 12 hours prior to nasal airflow measurement, were also excluded. All participants were educated in the use of the subjective ordinal scale and in rhinomanometry prior to the start of the study by the investigator.
Participants attended on two study days. A total of eight sets of nasal airflow measurements were taken on an hourly basis on each day. Participants were asked to refrain from smoking and eating any menthol-containing products such as mints, and only to consume the food and drink provided by study staff, which consisted of a simple lunch and water to drink as required. Participants were asked to remain within the laboratory environment during the day, and to refrain from exercise, sleep or lying down. Objective data were obtained using anterior rhinomanometry.
Nasal airflow measurements were taken using an Otopront® Rhino-Sys rhinomanometer by the method of anterior rhinomanometry, using a 75 Pa reference pressure. Two measurements (recorded in millilitres per second) were taken for each nostril and these were only accepted if the two measurements had a coefficient of variation of 15 per cent or less, otherwise they were repeated. Nasal airflow measurements were taken for each nostril sequentially.
Prior to taking each set of measurements using anterior rhinomanometry, each participant was asked to self-assess their nasal patency using the subjective ordinal scale, and the indicated values were recorded.
A nasal partitioning ratio was calculated for each set of nasal airflow measurements recorded for each participant, for both the objective (rhinomanometric) data and the subjective (subjective ordinal scale) data. Correlation coefficients were calculated using Pearson's method, to examine any relationship between the objective (rhinomanometric) data and the subjective (subjective ordinal scale) data.
Results
Thirty participants were recruited after screening a total of 39 people. Of these 30 participants, 13 were male and 17 were female, with a mean age of 22.7 years (range, 19–66 years). Complete data were recorded for 29 of the 30 individuals, with 1 participant only completing 6 out of the 8 measurements on the second study day. The nasal partitioning ratio was calculated for each participant at each time point, for both the subjective and objective data.
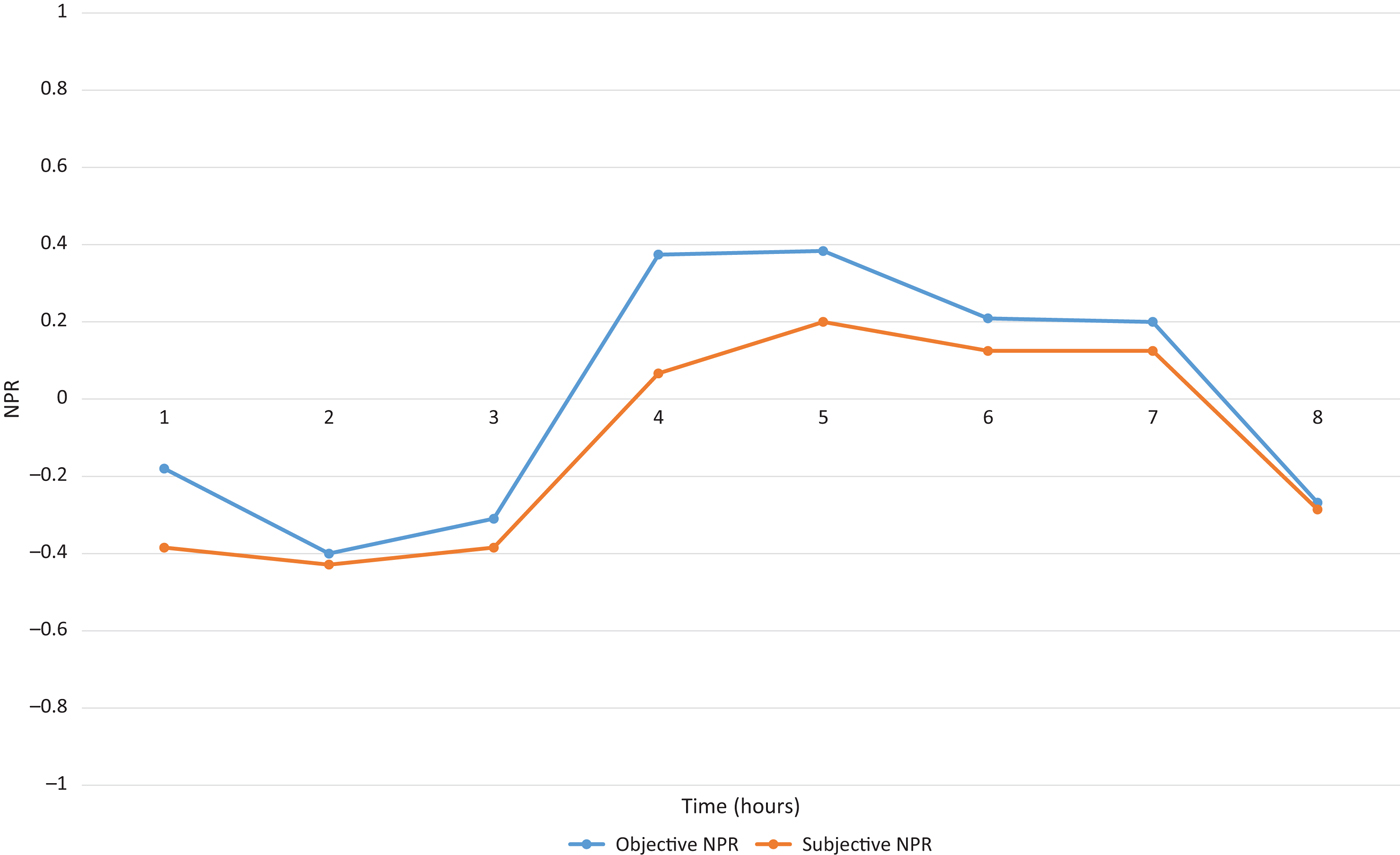
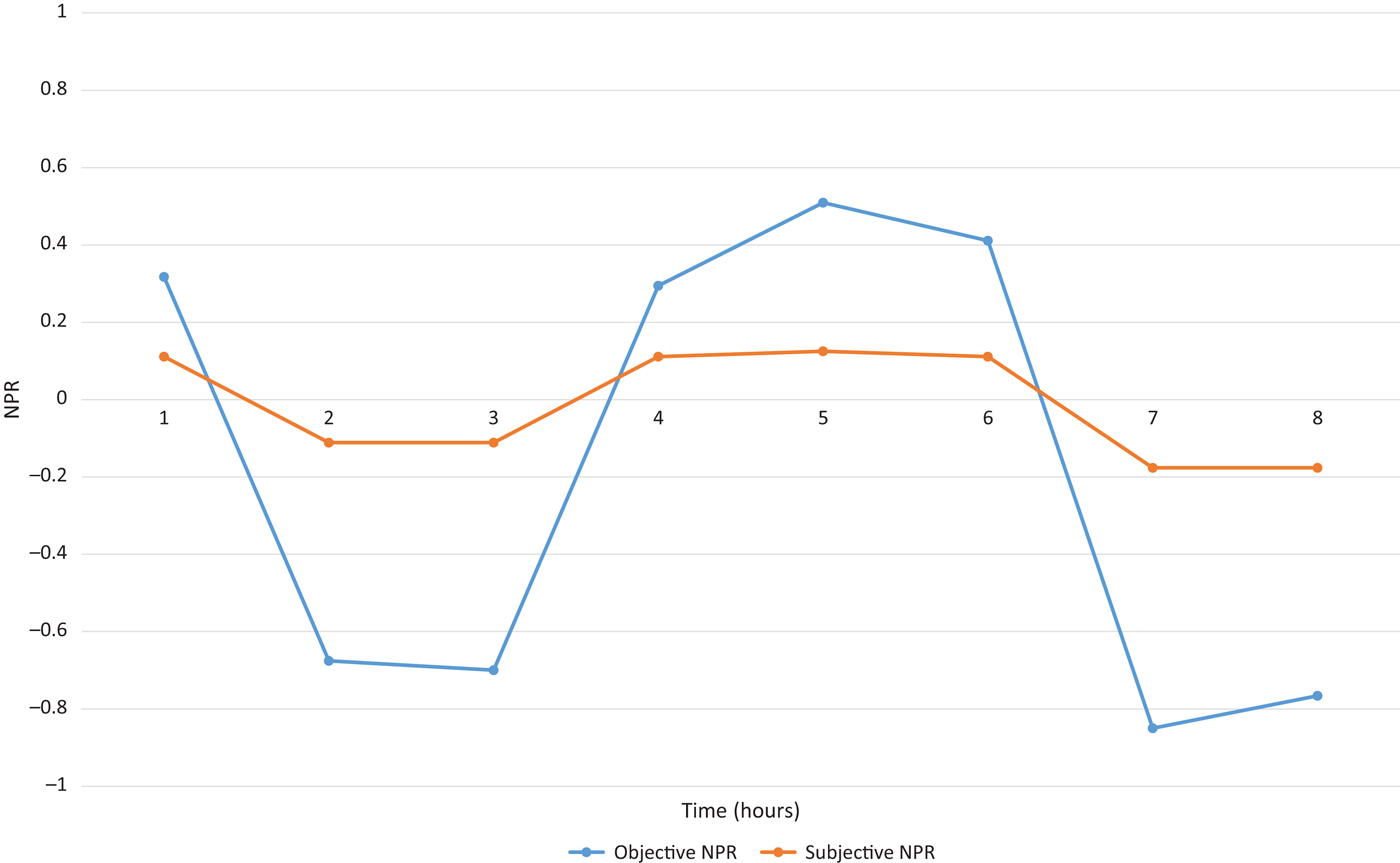
For all the data recorded for the nasal partitioning ratio, the subjective values were of a lower magnitude than the objective values, meaning that the two were rarely directly proportional. Participants tended to report less of a contrast between their two nostrils than was recorded using rhinomanometry for objective measurement. This did not, however, affect the sensitivity of the subjective measurements to detect changes in the nasal cycle. In Figure 2, it is clearly demonstrable that subjective and objective measures for the nasal partitioning ratio follow a similar pattern. This pattern demonstrates the periodicity seen in the nasal cycle, with changes in nostril dominance at 3.5 and 7.5 hours. The airflow distribution patterns are also similar. In some cases, the contrast between subjective and objective measurements was much higher, as shown in Figure 3.
A chart showing the comparative changes in the nasal partitioning ratio (NPR) for subjective and objective measures for participant 33 on day 1.

A chart showing the comparative changes in the nasal partitioning ratio (NPR) for subjective and objective measures for participant 27 on day 1.

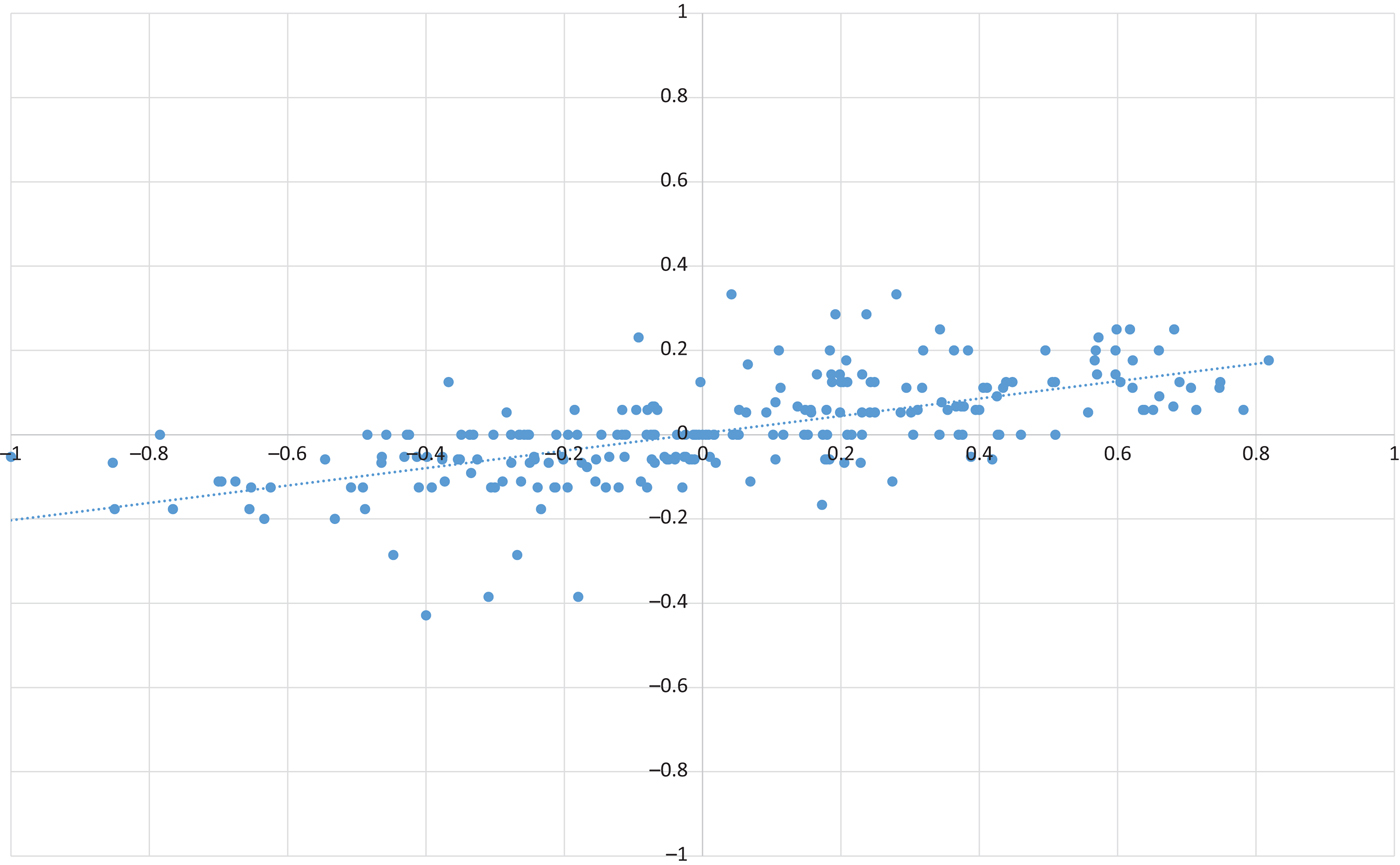
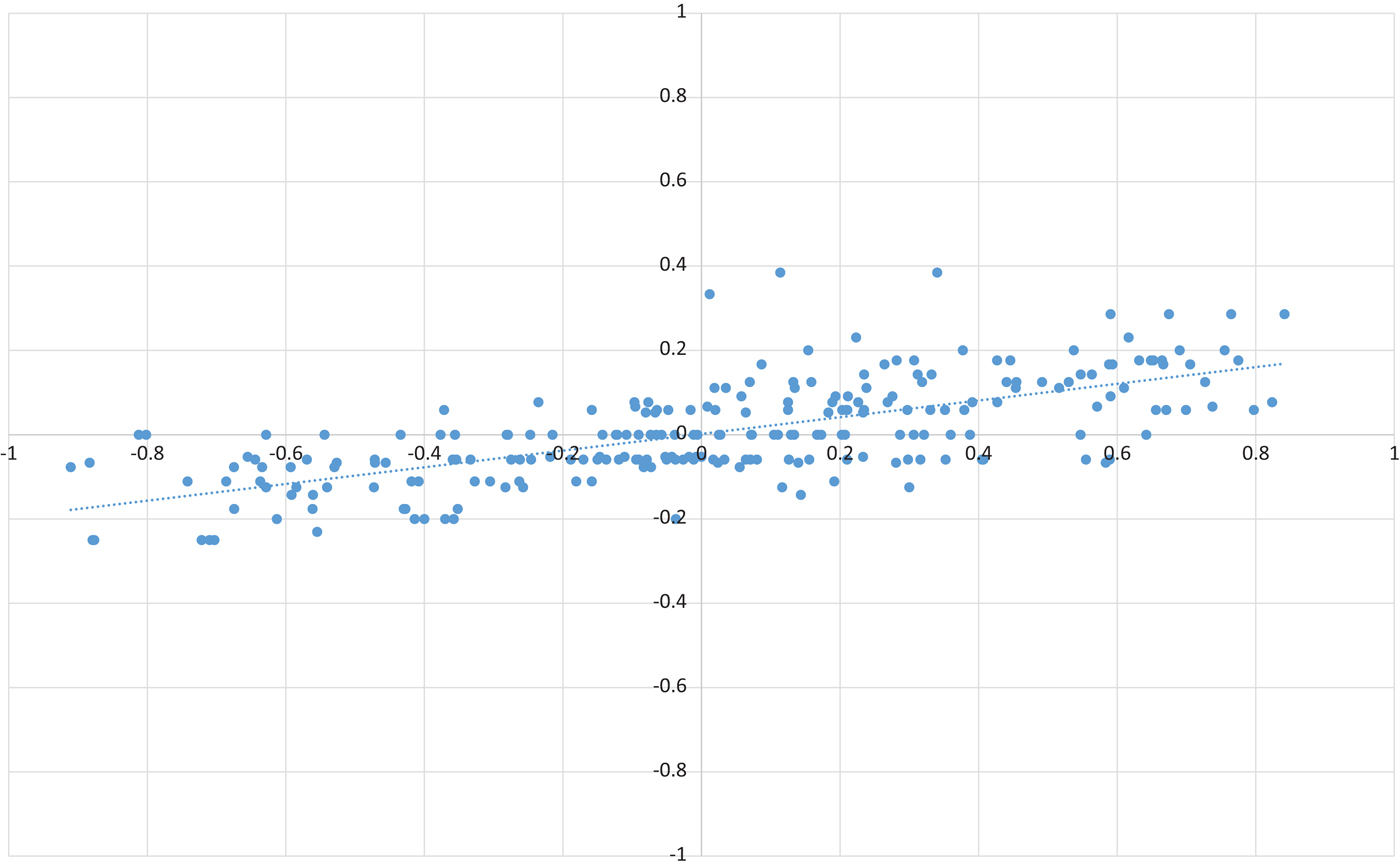
In order to compare the relationship between the objective and subjective measures of nasal airflow in this study, the subjective and objective values for the nasal partitioning ratio were plotted against each other to demonstrate their relationship over the two study days.
Figure 4 shows the relationship between the subjective and objective nasal partitioning ratios for the first study day. There is a trend towards a proportional relationship between the subjective and objective data. This is supported by a strong correlation coefficient of 0.64 (p < 0.00001).
A chart showing the trend in subjective (y-axis) and objective (x-axis) values for the nasal partitioning ratio on day 1.

Figure 5 shows the relationship between the subjective and objective nasal partitioning ratios for the second study day. Again, there is a trend towards a proportional relationship between the subjective and objective data. This is shown by a strong correlation coefficient of 0.68 (p < 0.00001).
A chart showing the trend in subjective (y-axis) and objective (x-axis) values for the nasal partitioning ratio on day 2.

Discussion
The results of this study clearly demonstrate that the subjective ordinal scale can be used to monitor changes in nasal airflow associated with the nasal cycle. The validation of the subjective scale was determined by the highly significant correlation (p < 0.00001) between the nasal partitioning ratio values for the subjective measurements and those obtained by the objective measurements of rhinomanometry. Correlation coefficients of 0.64 and 0.68 were obtained for the subjective and objective measurements of nasal airflow on days 1 and 2 of the study. Validation of the subjective ordinal scale means that it could be used in the future to monitor the nasal cycle through subjective measures.
• The nasal cycle represents normal changes in vascular tissues of the nasal septum and turbinates under autonomic control
• It is reflected in airflow changes through the two sides of the nasal cavity
• Rhinomanometry is recognised as the ‘gold standard’ for studies of the nasal cycle
• No prior study has been able to demonstrate a correlation between rhinomanometric data and a subjective measure of the nasal cycle
• The subjective ordinal scale and nasal partitioning ratio used to monitor the nasal cycle have a strong correlation with rhinomanometry data
Previous studies attempting to measure the nasal cycle with subjective assessment have not demonstrated any correlation beyond a simple determination of left or right nostril dominance.Reference Funk and Clarke7 No correlation was found when a VAS was tested against acoustic rhinometry.Reference Fisher, Palmer and Lund12 Thus, the more sophisticated subjective ordinal scale is more accurate in measuring the nasal cycle subjectively.
As the nasal partitioning ratio can be used independently with nasal airflow data when measuring the nasal cycle, it is likely that the nasal partitioning ratio can be used together with the subjective ordinal scale for future subjective measurement of the nasal cycle.
The subjective ordinal scale is a simple tool; a test subject can quickly be instructed on its use and then potentially continue to use it unsupervised. Subjective measurements using the subjective ordinal scale in combination with the nasal partitioning ratio would therefore allow for longer periods of data collection with more frequent intervals. The tool can be used anywhere, when an individual is without any test equipment beyond the subjective ordinal scale chart, and in a short period of time. This expands the scope for research on the nasal cycle, as it allows measurement of the nasal cycle in different environments and enables continuous monitoring over prolonged periods (e.g. one to two weeks rather than single days at a time). Such measurement would add to our knowledge of how the nasal cycle changes over time.
Acknowledgements
This study was supported by research funds from Cardiff University. The authors would like to thank Happersberger Otopront (Breithardt, Germany) for the generous loan of the Rhino-Sys Rhinometry System used for this research study.
Competing interests
None declared.