Implications
Polyethylene glycol (PEG) has been successfully tested as an external marker for total faecal output measurement with dry feeds. The present study aimed to compare PEG with ytterbium (Yb, the most frequently used rare earth external marker), indoors with total mixed ration or fresh forage, or at pasture. This study showed that PEG could replace Yb as a faecal output marker to estimate organic matter intake (OMI) in sheep with good accuracy, both with fresh forage and at pasture. PEG is easily prepared and administered, accurately and quickly determined with NIRS, and can satisfactorily estimate the OMI of a group of animals. It can be used on numerous animals, even at pasture.
Introduction
To assess ruminant intake at pasture through faecal measurements, it is necessary to know the diet digestibility (usually estimated from laboratory analysis) and total faecal output. The latter can be estimated with external markers when total faeces collection (e.g. with faecal bags) is not possible. Chromic oxide was used for many years as a faecal marker. However, it is no longer used because of its toxic and carcinogenic effects for laboratory workers during analytical procedures (Costa, Reference Costa1997; Sedman et al., Reference Sedman, Beaumont, McDonald, Reynolds, Krowech and Howd2006, quoted by Delagarde et al., Reference Delagarde, Perez-Ramirez and Peyraud2010). In place of chromic oxide, rare earth elements such as ytterbium (Yb) have been effectively used in chloride, oxide or acetate form in ruminant studies (Lund et al., Reference Lund, Weisbjerg and Hvelplund2006; Schlecht et al., Reference Schlecht, Richter, Fernandez-Rivera and Becker2007; Delagarde et al., Reference Delagarde, Perez-Ramirez and Peyraud2010). Polyethylene glycol (PEG) determined by NIRS can also be a valuable and accurate external faecal marker (Landau et al., Reference Landau, Friedman, Devash and Mabjeesh2002; Hassoun et al., Reference Hassoun, Viudes, Autran, Bastianelli and Bocquier2013). The faecal recovery rate of PEG was higher than 0.95 with dehydrated feed or hay (Landau et al., Reference Landau, Friedman, Devash and Mabjeesh2002; Hassoun et al., Reference Hassoun, Viudes, Autran, Bastianelli and Bocquier2013), but lower (0.82 and 0.87) with a diet including pasture plus hay and concentrate supplements given indoors, or only fresh forage, respectively (Caja et al., Reference Caja, Ralha and Albanell2009; Hassoun et al., Reference Hassoun, Viudes, Autran, Bastianelli and Bocquier2013). The objective of this experiment was to compare PEG and Yb as faecal output markers to predict organic matter intake (OMI) of sheep fed with total mixed ration (TMR) and fresh forage, indoors and at pasture, and to refine the guidelines for using PEG.
Material and methods
Experimental site
The experiment was conducted at the end of February to mid-June 2005 at the INRA-GA La Fage Experimental Farm (latitude 43.55°N, longitude 3.05°E). The farm rears dairy ewes that stay indoors during winter, from November to the end of March, and that are fed with a TMR. From the beginning of April until November, animals are allowed to graze pastures supplemented with hay and concentrate, depending on the pasture quality and the milk yield. The ewes are milked twice daily at 0800 and 1600 h.
The experiment was conducted in the framework of the Regional, Languedoc-Roussillon (France), Ethical Committee on Animal Experimentation – Agreement N°752056/00.
Experimental design, animals and feed
The experiment was conducted on 24 Lacaune lactating multiparous dairy ewes and divided into three periods on the basis of diet: TMR (Period 1, P1), green forage (Period 2, P2) and pasture (Period 3, P3). The average (±standard deviation (s.d.)) BW and milk yield measured at each period were: 80±5.8 kg and 2.0±0.45 l/day (P1); 73.1±5.4 kg and 0.89±0.31 l/day (P2), 70.2±6.4 kg; and 0.71±0.25 l/day (P3). During the indoor periods (P1 and P2), the ewes were reared in a group on wood shaving litter and were previously trained to access an individual feeding post controlled by an electronic device, which allows each animal to get into its right place using individual electronic identification.
In P1, the ewes were fed a limited amount (0.90 of ad libitum intake) of a TMR; in P2, the ewes had ad libitum access to fresh Italian ryegrass (IRG), allowing 10% to 15% refusal on the dry matter (DM) basis; and in P3, the ewes were allowed to graze a pure IRG pasture.
Period 1 (end of February until end of March) consisted of 5 weeks, including 2 weeks for animal adaptation to the individual feeding system and for individual dry matter intake measurements to calculate the quantities offered thereafter. Of the previous ad libitum intake of the TMR, 90% was offered on an individual basis to reduce the amount of refusal. During the 4th (marker adaptation) and 5th (measurement, 5 days) weeks, animals were dosed twice daily at milking time with both markers. During the 5th week, faeces were grab-collected at the two milking times to determine Yb and PEG content. Marker administration was interrupted until period 2. The TMR was offered in two meals, the first at 1600 h with 2/3 of the total amount, and the second at 0900 h the following morning, with 1/3 of the total amount.
Period 2 (middle of May until beginning of June) consisted of 4 weeks, including 1 week of adaptation to the fresh IRG forage, 1 week for individual faeces collection for further PEG calibration, 1 week for marker adaptation and the last week for measurements (5 consecutive days). Fresh IRG cut every morning from a pure pasture was offered in two meals as in P1, for an ad libitum intake allowing 10% to 15% refusal on the DM basis. The same procedure for marker administration and faeces collection was applied as in P1.
Period 3 (middle of June) consisted of 2 weeks, with 1 week for adaptation to the grazing management and to the pasture, followed by 1 week for measurements (5 consecutive days). Pasture was the same as that cut for P2. Because animals were led to the pasture just after P2, marker distribution was not interrupted between P2 and P3. Animals were allowed to graze a limited area with electric fences from 0830 to 0900 h (just after the morning milking) until 1600 h. Everyday, the ewes were allowed to graze on the previous paddock until 1200 h and were then moved to a new paddock until the afternoon milking time. This procedure was adopted to stimulate the intake with a new paddock offered at midday. When not in the grazing phase (i.e. at night), the ewes were kept indoors on wood shaving litter and had free access to water and a mineral block only.
Feed and intake
The TMR composition in terms of DM was as follows: IRG silage (36.2%); first- (25.4%), second- (14.6%) and third-cut (7.1%) alfalfa hay; barley grain (14.5%); and commercial protein concentrate (2.2%). Individual DM and OM intakes of TMR and IRG for P1 and P2, respectively, were measured daily. Refusals were recorded every afternoon before the following distribution. Offerings and refusals were sampled everyday to determine the DM content (48 h, 60°C). A sample of each TMR component and IRG offered (averaged over the week of measurements) was collected, dried as described above, and stored in a dry place until further analysis.
In P3, to determine the area that could be grazed daily by the animals, 3 square meter quadrates were cut at the ground level 2 days prior. The herbage cut was dried (48 h, 60°C) and the area determined to provide 2.5 to 3.0 kg DM/day per ewe. Each day before the animals were allowed to graze the new paddock, 3 sq.m quadrates were cut at random at the ground level. The same procedure was applied when the animals left the paddock to assess the refused biomass. The areas cut for assessing the biomass offered were identified through a white plate placed on the ground to prevent these areas from being cut for the refusals. Herbage samples (offer and refusal) were dried (48 h, 60°C) to further estimate the OMI. To control the homogeneity of the sward, the specific contribution (SC) was determined using the point-intercept method described by Daget and Poissonet (Reference Daget and Poissonet1971). Briefly, a 10-m tape was placed in each paddock the day before the entrance of the animals. Every 10 cm of the tape, a steel pin (2 mm diameter) was placed vertically into the soil. Each species in contact with the pin was identified and recorded. The SC (number of species in contact with the pin, irrespective of the number of contacts and expressed as a percentage, %) was calculated by the formula: number of pins contacted by 1 species divided by sum of number of pins contacted by each of the species ×100.
The daily OMI was assessed as follows:
OMI (kg OM/ewe)=[Woff (kg OM) – Wref (kg OM) ]×S (m²)/24 ewes, where Woff and Wref were the average weight of OM cut through the three quadrates before grazing and after grazing, respectively, and S was the daily area allowed to be grazed. The average OMI was calculated with the values of the 5 previous days with a 24-h delay.
In addition, a 10 m transect was installed the first 4 days of measurement, before the animals entered the paddocks to collect some 150 to 200 IRG tillers before and after grazing. Tillers were separated into dead material, leaves and stems each time. Each part was weighed, dried (48 h at 60°C) and stored in a dry place until further analysis. The composition of the estimated intake was determined taking the proportion of the three different parts before and after grazing into account. This information was further used to estimate the in vivo OM digestibility.
Faeces sampling
Total faecal output was not recorded but estimated with PEG and Yb as external markers. All of the faeces samples were obtained at both morning and afternoon milking times by collection at the rectal level (grab samples). For NIRS-PEG calibration in P1 and P2, faeces were collected from all of the ewes for several days and pooled to obtain an average sample that was representative of the group. Faeces for marker measurement were collected on 5 consecutive days from each ewe. Each sample was dried (48 h, 50°C) and stored until further analysis.
Marker preparation and administration
The PEG used was PEG 6000 (molecular weight: 6000 da; Panreac Qimica SA, Barcelona, Spain). The Yb used was in the form of Yb2O3 (Rhodia, La Rochelle, France). The PEG was used in solution form with a concentration of 333.33 g/l, prepared several days earlier in the laboratory with double distilled water. It was administered with two 30 ml drenching guns to theoretically provide 30 ml at each milking time. The two drenching guns were previously controlled to determine the actual volume provided. For Yb, a quantity of 0.175 g of Yb2O3 was weighed to the nearest 0.001 g with a high precision scale and transferred into a gelatine capsule (Willi Krüger KG, Ratingen, Germany) and stored in a dry place until use. Capsules were orally administered at the same time as PEG, using a bolus gun. Consequently, each animal received 0.350 g of Yb2O3 and 19.86 g of PEG per day. Both markers were administered every day starting 10 days before the experimental periods P1 and P2 until the last day of sampling.
Analytical procedures
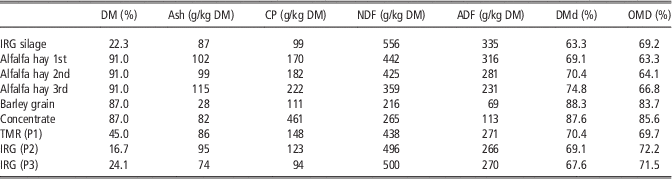
All forages, concentrate and faeces samples were ground through a 1 mm sieve before analysis. Ash content was determined by ashing in a muffle furnace for 5 h at 550°C. Total nitrogen was determined using the Kjeldahl procedure. Cell wall fractions (NDF, ADF) were determined sequentially according to the method of Goering and Van Soest (Reference Goering and Van Soest1970) with an amylolytic and protease pre-treatment. Cell wall fractions are expressed exclusive of residual ash. The in vitro DM digestibility (DMd) was determined according to the pepsin–cellulase method (Aufrère et al., Reference Aufrère, Baumont, Delaby, Peccatte, Andrieu, Andrieu and Dulphy2007). Because in vivo organic matter digestibility (OMD) could not be measured in the present experiment, it was estimated according to the equations proposed by Aufrère et al. (Reference Aufrère, Baumont, Delaby, Peccatte, Andrieu, Andrieu and Dulphy2007) for the forages, and by Giger-Reverdin et al. (Reference Giger-Reverdin, Aufrere, Sauvant, Demarquilly, Vermorel and Pochet1990) for the concentrates based on chemical composition and DMd. The OMD of TMR was calculated assuming no feed interaction. The chemical composition and the calculated OMD of the feeds and TMR are presented in Table 1.
Chemical composition and in vivo estimated OMD of the feed and diets used in periods 1 (P1), 2 (P2) and 3 (P3)

IRG=Italian ryegrass; CP=crude protein (total nitrogen×6.25); DMd=in vitro dry matter digestibility; OMD=estimated in vivo organic matter digestibility; TMR=total mixed ration.
Marker determination
The PEG content in faeces was estimated using the NIRS method as described by Hassoun et al. (Reference Hassoun, Viudes, Autran, Bastianelli and Bocquier2013). Briefly, a calibration database was built by updating an existing PEG calibration with new samples from the present trial. The final calibration database contained 370 samples. The new samples were obtained by adding known amounts of PEG in faeces samples collected before the first doses were administered (P1 and P2), to build a PEG+faeces database similar to the collected samples. PEG was added to the faeces in solution within a range of 0 to 100 g of PEG/kg DM by 5 or 10 g of PEG /kg DM steps. The PEG+faeces mixtures were dried (at 50°C until constant dry weight was reached) and ground through a 1 mm sieve.
The samples were scanned on a monochromator NIR spectrophotometer (NIRS 6500; Foss NIRSystems, Silver Spring, MD, USA). Spectral data were collected every 2 nm from 400 to 2500 nm. However, only wavelengths in the 1100 to 2500 nm range were used, because of the unstability of models built with visible wavelengths. Measurement was taken in reflectance mode in small circular cups (diameter: 50 mm) with quartz glass. Samples were scanned in duplicate (two different cup fillings), and spectra were averaged. The NIRS calibration was carried out using the partial least-square regression (MPLS procedure, WinISI software; Infrasoft Int., Port Matilda, PA, USA). Spectra were submitted to a mathematical pre-processing with detrending and normalisation (SNV) of data, and use of the second derivative calculated on five consecutive points with a smoothing also on a gap of five points. Calibration had a R 2 of 0.991, standard error of calibration of 3.05. A cross-validation was performed by splitting the calibration database into four groups, calibrating on three groups and validating with the remaining group. This procedure was repeated four times (alternating the validation group). The R² of cross-validation was 0.988, and the standard error of cross-validation was 3.47 g/kg DM.
In the case of Yb, daily faeces samples were collected (equal weight per sample per day) according to the period (morning and afternoon), for a total of two samples per ewe and per week. Samples (~0.5 g DM) were ashed in a muffle furnace at 550°C for 5 h. Ashes were then digested by boiling them for 3 min with a solution containing 7.08% HNO3 and 3.8 g/l KCl. Yb content was determined by the standard addition method to limit inter-element interferences (Marks and Welcher, Reference Marks and Welcher1970; Mazzucotelli et al., Reference Mazzucotelli, Galli and Frache1982) and a matrix effect. The Yb content was measured by atomic absorption spectrophotometry with a nitrous oxide/acetylene flame (AAS-F; AA-600 Varian, Melbourne, Australia), provided with a hollow cathode lamp (PHOTRON Victoria, Narre Warren, Australia) for Yb absorption at 398.8 nm, with a lamp intensity of 4 mA.
Total faeces output (Fec) assessed with PEG was calculated with the following formula (Hassoun et al., Reference Hassoun, Viudes, Autran, Bastianelli and Bocquier2013):
 $${\rm Fec}\left( {{\rm kg DM}} \right)=\left[ {{\rm PEG}_{{{\rm in}}} {\times}{\rm REC}{\times}\left( {{\rm REC}_{{\rm g}} /{\rm PEG}_{{\rm g}} /{\rm 1}000} \right){\minus}{\rm 1}} \right)]/{\rm 1}000$$
where PEGin (g) is the PEG dosed daily, REC the PEG recovery in total faeces, PEGg (g/kg DM) the PEG content measured in grab samples collected at 0800 or 1600 h, and RECg the PEG recovery in grab samples.
In a previous study (Hassoun et al., Reference Hassoun, Viudes, Autran, Bastianelli and Bocquier2013), both the average values of REC and RECg were 0.98 over four experiments and were 0.87 and 1.00, respectively, with fresh forage. Consequently, Fec was calculated assuming full recovery rate (i.e. REC=1.00 and RECg=1.00) or by applying either the average value (0.98) or specific values for fresh forages (0.87 and 1.00). For Yb, no correction was applied because it is usually assumed that the Yb recovery rate is almost 1.00 (Brandyberry et al., Reference Brandyberry, Cochran, Vanzant and Harmon1991; Delagarde et al., Reference Delagarde, Perez-Ramirez and Peyraud2010). The OMI was assessed from Yb (OMIYb) and from PEG measured in morning samples (OMIPEGm) or by averaging morning and afternoon samples (OMIPEGma), either by applying a recovery rate of 0.98 (OMIPEGm98, OMIPEGma98) or 0.87 (OMIPEGm87, OMIPEGma87) or not applying (OMIPEGm, OMIPEGma) the above corrections and from OMD. Finally, the OMI values assessed with PEG and Yb were obtained for each ewe and were compared with the OMI measured (OMIOBS).
Statistical analysis
The PEG and Yb contents measured in faeces samples collected in the morning (PEGm, Ybm) or in the afternoon (PEGa, Yba) were compared (PEGm v. PEGa and Ybm v. Yba) using the non-parametric test of Wilcoxon for paired samples (Sprent, Reference Sprent1992), because variables were not normally distributed and no transformation could lead to a normal distribution. For periods P1 and P2, 24 OMIs (average of measurements over 5 days) assessed with Yb (OMIYb) and PEG (OMIPEGm, OMIPEGma, OMIPEGm98, OMIPEGma98, OMIPEGm87, OMIPEGma87) were obtained and compared with OMIOBS with the non-parametric test of Wilcoxon for paired samples (Sprent, Reference Sprent1992). For P3, because there was only one average value of OMIOBS obtained from pasture measurement, the mean of each variable was compared with the mean measured from the pasture using the test of conformity (Schwartz, Reference Schwartz2009), after having previously applied the Naperian logarithm to transform the values to be normally distributed.
For periods P1 and P2, the Spearman rank correlation coefficient (also referred to as Spearman’s ρ) (Sprent, Reference Sprent1992) was calculated to assess whether the OMI estimated with PEG or Yb ranked the ewes in an order similar to that of OMIOBS.
All statistical analyses were performed using STATISTICA v9.1 for Windows (Statsoft 2010: www.statsoft.fr)
Results
The SC of IRG was 81%. Other species represented less than 5%, except dandelion (Taraxacum officinale) which represented 7%.
The average OMIOBS in P1 was 2.5±0.28 kg/day, with a range of 1.65 to 2.80 kg/day. Three ewes had a lower OMIOBS (1.7, 1.9 and 2.2 kg/day) compared with the others (⩾2.4 kg/day). The average OMIOBS in P2 was 1.57±0.06 kg/day with a very narrow range of 1.47 to 1.72 kg/day. During P3, the average OM available was 3.06±0.43 kg/day per ewe, and the OMIOBS calculated over 5 consecutive days was 1.52±0.63 kg/day per ewe.
The PEG and Yb content measured in P1, P2 and P3 in samples collected in afternoon (12.2, 23.9, 24.6 and 0.41, 0.58 and 0.67 g/kg DM, respectively) were significantly lower (P<0.001) than those of morning samples (24.1, 36.9, 40.9 and 0.46, 0.67 and 0.81 g/kg DM, respectively).
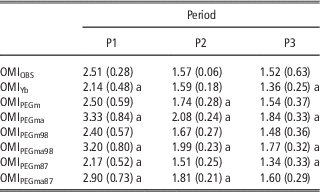
The means of OMIOBS and estimated with Yb or PEG are summarised in Table 2. In P1, the OMIPEGm and OMIPEGm98 did not differ (P>0.05) from OMIOBS. All OMIPEGma, with or without recovery correction, were higher (P<0.001) than OMIOBS, whereas OMIYb was lower (P<0.001).
Mean and standard deviation (in parentheses) of actual organic matter intake (OMIOBS) and estimated organic matter intake with ytterbium (OMIYb) or with PEG determined on the basis of morning or pooled morning and afternoon values without PEG recovery correction (OMIPEGm, OMIPEGma), or using the value of 0.98 (OMIPEGm98, OMIPEGma98) or of 0.87 (OMIPEGm87, OMIPEGma87) recovery correction in P1, P2 and P3

All values are expressed in kg OM/day per ewe. In P1 and P2, each estimated OMI was compared with OMIOBS with Wilcoxon’s test; in P3 they were compared with OMIOBS with the test of conformity (see text for details). Within a column, values with a letter are significantly different (P<0.001) from the OMIOBS.
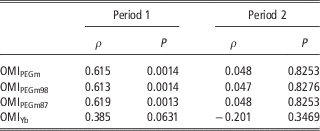
In P2, the OMIPEGm98, OMIPEGm87 and OMIYb did not differ (P>0.05) from OMIOBS. In P3, OMIPEGm, OMIPEGm98 and OMIPEGma87 did not differ (P>0.05) from the OMIOBS. Spearman’s ρ calculated in P1 and P2 and the variables from which OMI is predicted did not differ from OMIOBS (OMIPEGm, OMIPEGm98, OMIPEGm87 and OMIYb), and are summarised in Table 3. In P1, all of the variables were correlated (P<0.01) with OMIOBS, except OMIYb (P=0.0631). In P2, none of the variables was correlated (P>0.05) with OMIOBS.
Spearman’s ρ and the probability (P) of the Spearman rank correlation test between actual OMI and estimated OMI with PEG determined without PEG recovery correction (OMIPEGm), with 0.98 (OMIPEGm98) or 0.87 (OMIPEGm87) recovery correction or with ytterbium (OMIYb)

Discussion
When external markers are dosed daily for intake prediction, their daily excretion must reach a steady state. In a previous study (Hassoun et al., Reference Hassoun, Viudes, Autran, Bastianelli and Bocquier2013), PEG excretion measured with sheep dosed with 20 or 40 g PEG/day achieved a steady state after 4 days. For Yb, it was assumed that the steady state was reached after the 7-day adaptation period because it was shown that the excretion of Yb is stable for 5 days after initiating Yb administration (Musimba et al., Reference Musimba, Galyean, Holecheck and Pieper1987; Brandyberry et al., Reference Brandyberry, Cochran, Vanzant and Harmon1991). In the three periods, faecal PEG and Yb contents were always higher in samples collected in the morning than in the afternoon, except for one ewe in P2 and P3 (the same ewe) with PEG, and one ewe in P3 for Yb. The same results were observed with sheep fed fresh permanent grassland and dosed twice daily with PEG (Andueza et al., Reference Andueza, Picard, Aufrère, Jamot, Béchet and Baumont2013) or fed natural grassland hay (Hassoun et al., Reference Hassoun, Viudes, Autran, Bastianelli and Bocquier2013). Albeit these diurnal fluctuations, this result confirms the hypothesis that a steady state was achieved when measurements were initiated (the 10th day after the first marker administration).
In P1, because OMIPEGm and OMIPEGm98 were not significantly different from OMIOBS, it was assumed that PEG recovery would be close to 1.00, as previously observed with calves fed TMR (Chandler et al., Reference Chandler, Kesler and Jones1966) or with dairy ewes fed hay and concentrate (Caja et al., Reference Caja, Ralha and Albanell2009), which is representative of the total faeces content. On the contrary, OMIYb was lower (−15%), suggesting that recovery rate would not be of 1.00 but 1.17 instead. Such a recovery rate is higher than the values (0.89 to 0.99) reported with beef cows (Prigge et al., Reference Prigge, Varga, Vicini and Reid1981) and lambs dosed once daily (Krysl et al., Reference Krysl, Galyean, Estell and Sowell1988) or dairy cows dosed twice daily (Delagarde et al., Reference Delagarde, Perez-Ramirez and Peyraud2010; Perez-Ramirez et al., Reference Perez-Ramirez, Peyraud and Delagarde2012) and fed with different diets (hays, TMR or maize silage, and concentrate). However, similar results (1.07 to 1.19) were observed when beef cows were dosed twice daily (Prigge et al., Reference Prigge, Varga, Vicini and Reid1981), and with lambs dosed once daily and fed hay supplemented with sorghum grain (Krysl et al., Reference Krysl, Galyean, Estell and Sowell1988). It seems that the Yb recovery rate may change, but in an unpredictable manner, depending on feeding management, species, dose frequency and the method used. In P1, the underestimated OMIYb could only be explained if excretion patterns of the marker are different with TMR compared with forage (fresh or hay). Total mean retention time in the digestive tract of dairy cows tended to increase with maize silage-based diet compared with green forage (Mambrini and Peyraud, Reference Mambrini and Peyraud1994). In sheep, the retention time of digesta decreases and, consequently, that of the marker as well, when intake increases (Coombe and Kay, Reference Coombe and Kay1965; Grovum and Hecker, Reference Grovum and Hecker1973). Such a modification might have occurred in the present experiment, changing the excretion pattern of Yb and leading to lower total faecal output and lower OMIYb. This explanation may also apply to the daily excretion pattern of other markers and partly explain the different marker recoveries observed in various situations. Variations of marker recoveries may also occur depending on the analytical procedure used (Vicente et al., Reference Vicente, Sarraseca, De Vega and Guada2004).
In P2, OMIPEGm87, OMIPEGm98 and OMIYb did not differ, but OMIPEGm87 was closer to OMIobs than OMIPEGm98, suggesting that the recovery of PEG was slightly lower with fresh forage, as previously observed with dairy ewes on IRG pasture plus hay and concentrate (Caja et al., Reference Caja, Ralha and Albanell2009), with green oat–vetch (Hassoun et al., Reference Hassoun, Viudes, Autran, Bastianelli and Bocquier2013), and with fresh natural grassland (Andueza et al., Reference Andueza, Picard, Aufrère, Jamot, Béchet and Baumont2013). The OMIYb did not differ from the OMIOBS, which means that the recovery rate was close to 1.00. In P2, the OMIOBS had a narrow range with 1.47 to 1.72 kg/day, and a r.s.d. of±3.8%, which is below the value observed within a given location (r.s.d. of 10.6% to 24.6%) as observed in a comparative study conducted on the same forages (Andueza et al., Reference Andueza, Picard, Pradel, Egal, Hassoun, Peccatte and Baumont2011). When OMI is expressed per metabolic weight (W0.75), the average OMI is 62.4 g/kg0.75 with a s.d. of±4.8 and a r.s.d. of±7.74% (results not presented). Once again, the r.s.d. is lower than that observed by Andueza et al. (Reference Andueza, Picard, Pradel, Egal, Hassoun, Peccatte and Baumont2011). However, the animals had ad libitum access to fresh forage and daily milk yield and BW ranged between 0.2 to 1.4 l/day and 64 to 87 kg, respectively, which means that neither BW nor milk yield influenced the OMI in this situation, which is unusual.
In P3, OMIPEGm and OMIPEGm98 did not differ from OMIOBS, whereas OMIYb and OMIPEGm87 were lower. It must be remembered that, in P3, the OMIOBS was an estimated value obtained from 5-day herbage cut with an s.d. of±0.63 kg OM/day per ewe. The main source of error might arise from the differences in cutting height before and after grazing (Peyraud, Reference Peyraud1997). According to this author, the herbage density at ground level in the temperate regions is ~500 kg OM/cm per hectare, and in the present experiment a 0.5 cm variation corresponded to an average error of 0.22 kg OM/day per ewe. In addition, it is possible that the area cut after grazing may represent refusal because of urine and faeces contamination, which decreases the OMI assessment. Consequently, it was not possible to ascertain which OMI, estimated either with PEG or Yb, is the closest to the real OMI. However, the OMIOBS was comparable to the 1.7 kg DMI measured in similar conditions (Hassoun et al., Reference Hassoun, Autran, Aurel, Jamot, Baumont and Bocquier2007) on cocksfoot pasture. When OMIYb was compared with OMIPEGm, OMIPEGm98 or OMIPEGm87 with the Wilcoxon test for paired samples (results not presented), OMIPEGm was the only one that was significantly different (P<0.05) from OMIYb.
The Spearman rank correlation showed that it is possible to rank animals on the basis of OMI using PEG when there is a wide range of OMIOBS (1.65 to 2.8 kg/day in P1), but not with a narrower range (1.5 to 1.7 kg/day in P2). However, as pointed out by Hatfield et al. (Reference Hatfield, Clanton, Sanson and Eskridge1990), it appears in the present study that external markers used for intake assessment should be considered useful for comparing homogenous animal groups (weight, performances and physiological stage) rather than for individually predicting intake. It appears that an individual quantification of intake is not possible because of several sources of variations that cannot be controlled or measured. The main sources of variations reported are the diurnal marker excretion pattern (Corbett et al., Reference Corbett, Greenhalgh, Gwynn and Walker1958), the marker recovery rate (Corbett et al., Reference Corbett, Greenhalgh, Gwynn and Walker1958, Hassoun et al., Reference Hassoun, Viudes, Autran, Bastianelli and Bocquier2013), and OM or DM digestibility (Orskov et al., Reference Orskov, Ojwang and Reid1988; Andueza et al., Reference Andueza, Picard, Pradel, Egal, Hassoun, Peccatte and Baumont2011). All may vary from individual to individual.
Conclusion
This experiment is in agreement with previous results stating that PEG can only be used for measuring faecal output through morning grab samplings. Furthermore PEG’s interest is that it makes it possible to measure a large number of animals with a minimum of effort, especially because PEG is easy to prepare (solution), to administrate (drench gun) and to measure (NIRS). Although Yb is a common external marker used for intake measurement at pasture, preparation and analytical procedures limit the number of animals that can be measured. Consequently, PEG can be used to estimate the intake of a group of animals with a simple sampling in the morning during drenching. However, PEG cannot quantitatively estimate individual intake. When PEG has to be used for different forages or mixed rations, it is recommended to introduce faeces (without PEG) into the NIRS calibration to better predict PEG content. Whenever possible, it is also recommended to measure the digestibility (in vivo) and the specific recovery rate at the same time. When specific recovery cannot be measured, it is recommended to apply the value of 0.98, which gives good results in various situations.
Acknowledgements
The authors would like to thank J.M. Capron and S. Douls, (UMR Selmet, INRA, Montpellier), S. Arnaud, Master’s student, (Enita-Bordeaux) for measurements, indoors and at pasture; M.R. Aurel, D. Porte and J.M. Meneras (La Fage Experimental Farm, INRA, UE321, St Jean-St Paul) for milking, feeding and care of the ewes throughout the experiment; L. Bonnal (CIRAD, Baillarguet) for his assistance in NIRS analysis, A. Debus for Yb laboratory preparations; and M. Clairotte (UMR Rhizosphere Symbiose, INRA Montpellier) for Yb atomic absorption spectrophotometry analysis. The authors would also like to thank Gail Wagman for revising the English and the reviewers for their constructive comments.