


Introduction
Early care and education (ECE) is a central environment in the lives of 60% of young children(Reference Redford, Desrochers and Mulvaney Hoyer1) in the USA and therefore critical to consider in establishing healthy lifestyle behaviours.(Reference Story, Kaphingst and French2) The ECE provider has a leading role in patterning both the social aspects of children’s health behaviours(Reference Birch and Roberts3–Reference Copeland, Kendeigh, Saelens, Kalkwarf and Sherman5) and the physical environment of the programme. This influence is especially strong in home-based ECE programmes, known as family child care homes (FCCH). With 6.4 million young children of the 12.6 million in non-parental care attending FCCH(6) (7), these small programmes are of particular interest regarding establishing healthy lifestyle behaviours. FCCH providers with higher nutrition knowledge have healthier nutrition practices in most(Reference Nahikian-Nelms4, Reference Patel, Sisson, Stephens, Williams, Hoffman and Salvatore8–Reference Francis, Perrin and Black10) but not all(Reference Halloran, Gorman and Fallon11) studies. FCCH provider nutrition knowledge scores range from 56–82% (out of 100%) indicating room for improvement.(Reference Nahikian-Nelms4,Reference Halloran, Gorman and Fallon11) FCCH programmes may be associated with elevated obesity risk in young children compared to more structured centre-based programmes.(Reference Swyden, Sisson and Lora12)
FCCH nutrition practices are a segment of the overall nutrition environment and typically include foods served, feeding style (i.e. authoritative, authoritarian, indulgent, and uninvolved),(Reference Blissett13–Reference Ventura and Birch15) and staff nutrition and feeding practices.(Reference Ammerman, Ward and Benjamin16,Reference Ward, Morris and McWilliams17) Healthier FCCH nutrition environments are associated with healthier child diets.(Reference Benjamin-Neelon, Vaughn and Tovar18) FCCH report participation in many desirable nutrition practices such as frequent service of healthy foods while family style meal service and providing nutrition education were less commonly reported.(Reference Francis, Perrin and Black10, Reference Dev, Williams and Iruka19–Reference Williams, Sisson and Padasas23) However, research demonstrates that there is room to improve these FCCH nutrition practices(Reference Francis, Perrin and Black10, Reference Dev, Williams and Iruka19–Reference Sisson, Eckart and Williams21, Reference Tovar, Risica and Mena24) and knowledge.(Reference Nahikian-Nelms4,Reference Halloran, Gorman and Fallon11) FCCH providers report a desire to serve healthy foods to children and engage in optimal feeding practices but experience barriers such as higher costs of healthy foods, time to prepare healthy foods, unhealthy home dietary intake, children’s food preferences, food waste,(Reference Sisson, Brice and Hoffman25–Reference Jiang, Tovar and Risica30) and a reluctance for children to serve themselves.(Reference Jiang, Tovar and Risica30) FCCH who report having more self-reported barriers have less healthy food practices(Reference Patel, Butzer and Williams29) and FCCH with higher self-efficacy or confidence for these behaviours have healthier food and nutrition practices.(Reference Patel, Sisson, Stephens, Williams, Hoffman and Salvatore8) Furthermore, reducing misconceptions around child nutrition and feeding such as engaging in family style meals without additional waste and how to provide positive encouragement may promote healthier feeding practices in ECE environments.(Reference Lanigan31)
Two recent reviews suggest that interventions that target FCCH provider nutrition practices demonstrated improvements in observed and self-reported food environment.(Reference Vorage, Vincze and Tudehope32,Reference Yoong, Lum and Jones33) These interventions have been delivered using a variety of approaches including multi-sector community interventions with targeted FCCH technical assistance(Reference Woodward-Lopez, Kao and Kuo34,Reference de Silva-Sanigorski, Elea and Bell35) and professional development training opportunities.(Reference Dev, Williams and Iruka19, Reference Trost, Messner and Fitzgerald20, Reference Kohel, Hatton-Bowers and Williams36–Reference Baumrind38) Large randomised controlled trials have also been used to enhance evidence.(Reference Gans, Tovar and Kang39,Reference Ward, Vaughn and Burney40) More research is needed to expand this growing body of evidence and to strengthen the evidence base for interventions with FCCH providers, especially those that improve adherence to Child and Adult Care Food Program (CACFP) best practice recommendations. The primary purpose of this randomised controlled study was to determine effectiveness of the Happy Healthy Homes (HHH) on FCCH provider’s nutrition practices. Secondary outcomes include nutrition confidence, barriers, and CACFP best practice knowledge. We hypothesised that HHH intervention would improve FCCH provider nutrition practices, confidence, barriers, and CACFP knowledge among providers who participated more than the matched attention control.
Experimental methods
Study design
This study examined the 3-month and 12-month effects of the HHH(Reference Sisson, Salvatore and Hildebrand41) randomised, attention-controlled trial on FCCH provider nutrition practices (primary outcome) and nutrition confidence, barriers, and CACFP best practice knowledge (secondary outcomes). Two delivery cohorts were analysed separately due to population differences (metro vs. rural) and intended delivery mode (university research personnel vs. community-based Cooperative Extension Educators). Cohort1 included FCCHs within 60 miles of the university campus in Oklahoma City and was delivered in-person by university research personnel (2017–2019). Cohort2 focused recruitment in rural areas, was conducted in collaboration with six Cooperative Extension Educators, and shifted to virtual implementation in response to COVID-19 (fall 2020–winter 2021). All participants in Cohort2 received fully virtual interventions. FCCH providers were randomly assigned by computer to two groups in blocks of four or six by the study statistician. The intervention group (NUT) aimed to enhance the nutrition environment and foods served and attention control group (CON) aimed to enhance environmental health in FCCH. No blinding occurred for providers or study personnel; however, intervention and evaluation staff were different. Intervention staff were trained over a series of workshops lasting approximately 16–20 h that focused on intervention content and delivery methods and included practice content delivery. In-person interventionists included nutrition and public health graduate students whereas the virtual interventionists included Cooperative Extensions Educators. Interventionists were observed during early delivery to ensure fidelity of delivery. The trial was retrospectively registered at Clinicaltrials.gov (NCT03560050). Additional file 1 includes the CONSORT checklist for randomised trials and Figures 1 and 2 contain the CONSORT flow chart for randomised trials for Cohort1 and Cohort2, respectively. Participant harms were determined by adverse events reported.
CONSORT 2010 flow diagram Happy Healthy Homes cohort1 (in-person) implementation.

CONSORT 2010 flow diagram Happy Healthy Homes cohort2 (virtual) implementation.

Figure 2. Long description
The flowchart details the stages of a study involving recruitment, allocation, follow-up, and analysis. Initially, 230 participants were called for recruitment. Out of these, 167 were excluded due to not meeting inclusion criteria, not responding, or not being interested. This left 63 participants who were randomized into two groups: Nutrition intervention (31 participants) and ECO intervention (32 participants). In the Nutrition intervention group, 14 received all allocated intervention, 7 received partial intervention, and 10 did not receive the allocated intervention for various reasons. In the ECO intervention group, 14 received all allocated intervention, 10 received partial intervention, and 8 did not receive the allocated intervention for various reasons. At the 3-month follow-up, some participants were lost to follow-up due to being unresponsive or overwhelmed. At the 12-month follow-up, additional participants were lost to follow-up for similar reasons. Finally, the analysis was conducted on the remaining participants, with 15 analyzed in the Nutrition intervention group and 21 in the ECO intervention group.
Participants
Participants were FCCH providers recruited through food programme sponsoring organisations and through direct phone calls from research staff. For eligibility, FCCH providers needed to participate in the CACFP, provide care for at least one 2-to-5-year-old child, and plan to remain in business for at least 12 months. All study procedures were approved by the University of Oklahoma Health Campus Institutional Review Board (#7551 and #10747). All participants voluntarily consented to participation prior to study enrolment.
In-person intervention delivery (Cohort1)
Providers operating within 60 miles of Oklahoma City were invited to participate. Providers were recruited and enrolled in three waves (October 2017, February 2018, November 2018). A total of 370 eligible FCCH providers were contacted; 72 eligible providers consented (Figure 1). Of these, 51 (68.9%) completed at least one day of baseline data collection. At three months, 45 providers (88% of those from baseline) remained. At 12 months, 40 (78% of those from baseline data) remained. Based on the USDA’s Rural Urban Commuting Area (RUCA)(42) codes, 6.7% of the in-person cohort participants were in non-metro (≥3) counties.
Virtual intervention delivery (Cohort2)
Providers were recruited through CACFP sponsoring organisations, word of mouth, and through direct phone calls. Participants were recruited and enrolled in fall 2020. A total of 230 providers were assessed for eligibility; 63 eligible providers consented to participate and were randomised into treatment arms (Figure 2). Of these, 46 providers (73.0%) completed baseline data collection. At three months, 36 providers (78% of those with baseline data) remained. At 12 months, 31 (67% of those with baseline data) remained. One third (33.3%) of Cohort2 participants were from non-metro counties, based on RUCA codes.(42)
Procedures
Following eligibility screening, providers were scheduled for baseline measures. Providers completed self-report paper or online surveys on demographic characteristics, nutrition environment, nutrition self-efficacy, and CACFP knowledge. Following baseline measures, the study statistician randomly assigned treatment in blocks of four or six. Providers completed immediate follow-up (3 months) and long-term follow-up (12 months). All participants received six free, prequalified, continuing education credits and toolkits valued at approximately $250. Toolkits included culinary spices, child education materials, culinary equipment, a small cook book, child-sized pitchers and scoops, CACFP shopping guide, preschool-sized MyPlates. In-person providers received compensation of $30 for baseline measures, $40 for 3-month measures, and $55 for 12-month measures. Virtual providers received compensation of $50 for baseline, $60 for 3-month measures, and $75 for 12-month measures. Compensation was increased due to facilitate enrolment during the time of COVID-19.
Intervention
The intervention was guided by a literature review,(Reference Sisson, Krampe and Anundson43) formative interviews with 30 FCCH providers,(Reference Sisson, Brice and Hoffman25) and Study Advisory Committee (local FCCH provider, Oklahoma State University Cooperative Extension state specialist, Department of Human Services Division of Early Childhood Professional Development, and the Department of Education Division of Child Nutrition) insight. The intervention was informed by the Social Ecological Model,(Reference Sallis, Owen, Fisher, K.Glanz and Viswanath44,Reference Bronfenbrenner45) Social Cognitive Theory,(Reference Bandura46) Social Support,(Reference Heaney, Israel and Glanz47) Self-Determination Theory,(Reference Ryan and Deci48) and Adult learning Principles.(Reference Bransford, Brown, Cocking, Donovan and Pellegrino49) Intervention goals were to enhance CACFP best practices and other ideal nutrition practices such as the feeding environment. Intervention constructs and activities are in Additional file 2.
Briefly, over three months, FCCH providers completed a total of 6 h of intervention activities including two-90-min individual, interactive education sessions, a 3-h small group cooking class, and a single 15–20 min phone call.(Reference Sisson, Salvatore and Hildebrand41) Individual sessions were designed to be delivered 4–5 weeks apart with a brief phone call half-way between sessions. The first individual session included core content which all providers received including: how to set SMART goals, CACFP best practices, portion size awareness, and staff feeding behaviours (role modelling, responsive feeding) A 15–20-min phone call occurred approximately 2 weeks following the first individual session to provide encouragement, trouble shooting, and touch base on goal attainment. The second individual session included four elective modules selected by each participant, from a menu of 8 options. All elective content reinforced primary goals of enhancing healthy nutrition practices and providing a healthy nutrition environment, nutrient-dense foods, and how to integrate children into meal preparation and cooking activities. Providers also completed a 3-h, small group, cooking class led by a chef. The small group cooking class offered complementary material rather than building on the individual sessions and could be delivered at any point in the participants’ intervention window. For virtual, all toolkits were shipped including all non-perishable items for the cooking class. To purchase non-perishable cooking class items, a shopping list and a $30 gift card to offset the cost related to buying the groceries was provided. All content was delivered by a trained interventionist in person or via Zoom®.(Reference Sisson, Salvatore and Hildebrand41)
Process evaluation
The RE-AIM framework included interventionist-reported fidelity to the intervention, dose delivered, and field notes. Adoption, implementation, and maintenance findings have been published.(Reference Williams, Sisson and Bhattacharya50,Reference Sisson, Hildebrand and Rolf51) For in-person, the fidelity of intervention dose delivery was high (100% of activities at the first individual session and the phone call and 85.7% of activities at the second individual session). Similarly, the fidelity of intervention dose for virtual was high (first individual class – 100%; follow-up call – 93.5%; second individual class – 97.4%; group class – 100%). For both cohorts,(Reference Williams, Sisson and Bhattacharya50,Reference Sisson, Hildebrand and Rolf51) FCCH provider feedback was favourable regarding the intervention content and suggested practice ideas. Cohort2 appreciated receiving most of the intervention at their FCCH home and according to their schedule. Most virtual participants were comfortable with fully remote intervention with only a few noting they would have preferred in-person delivery.
Measures
Nutrition practices (Primary outcome)
Nutrition practices and policies were self-reported using the validated FCCH Nutrition and Physical Activity Self-Assessment (NAPSACC).(Reference Ward, Morris and McWilliams17) There were 43 nutrition questions, each item with four response options. Responses are scored one through four, with a score of four representing ideal nutrition practice. An example nutrition item is, ‘My program offers fruit:’ with response options ‘≤3 times/week’ (1 point), ‘4 times/week’ (2 points), ‘once/day’ (3 points), and ‘≥2 times/day’ (4 points). The prevalence of ideal nutrition practices were calculated. Scores for the overall instrument and scores within each section were averaged and summed.
Nutrition confidence and barriers (secondary outcome)
FCCH Provider nutrition confidence (18 questions) and barriers (20 questions) were evaluated.(Reference Risica, Tovar and Palomo52) An example item assessing confidence is, ‘How sure are you that you can serve the children vegetables two or more time a day?’ Response options included ‘not at all sure’, ‘a little sure’, ‘sure’, and very sure’. An example item assessing barriers is, ‘You have enough time to prepare healthy food as often as you would like?’ Response options included ‘agree a lot’, ‘agree a little’, ‘neither agree or disagree’, ‘disagree a little’, and ‘disagree a lot’. Likert response options were given numerical values and summed across respective sections. Appropriate items were reverse scored. The possible range of scores for confidence was 0–18, with a higher score indicating higher confidence (Cronbach’s Alpha = 0.84 in our sample). ‘Sure’ and ‘very sure’ responses were collapsed for reporting. The possible range of scores for barriers was 20–60, with a lower score indicating fewer barriers (Cronbach’s Alpha = 0.70 in our sample). ‘Agree a little’ and ‘agree a lot’ were collapsed for reporting. Psychometric properties for this tool have not been established.
Child and Adult Care Food Program knowledge (secondary outcome)
Fourteen questions evaluated the provider’s knowledge specific to the CACFP requirements and best practices.(53) Example knowledge questions is, ‘Avoiding any fruit juice is a best practice’ (yes/no). The sum of correct answers and overall percent accuracy were calculated. The possible range of scores was 0–13, with a higher score indicating higher CACFP best practice knowledge. Psychometric values of this instrument are not available.
Statistical analyses
Sample size estimates were based on samples from Korenman et al.(Reference Korenman, Abner and Kaestner54) to estimate the percent of FCCH providers adherent to nutrition practices assuming a two-sided 0.05 α level. Demographic characteristics (means ± SD and frequency) were calculated for the overall sample and for each respective cohort. Per cohort, a total of 46 FCCH providers (23 per group), provides 80% power to detect a 40% difference between NUT and CON groups for a particular nutrition practice for foods served. Power Differences in baseline characteristics were examined using an independent t-test or Chi-Square analyses. All analyses were conducted using SAS 9.4. Participants with complete data were included.
In-person intervention delivery
Primary intervention analyses were conducted for the baseline to 12-month changes using a linear mixed model under a modified intent-to-treat paradigm to account for repeated measures on those 45 providers (NUT = 24; CON = 21) with 3-month outcomes (Figure 1). Fixed effects included time, treatment arm, and their interaction (time × arm). Repeated measures over time were accounted for by modeling time as a within-subject factor, with observations clustered by participant to account for within-subject correlation. If homes missed an assessment time point, then there was missing data for that home for that time point. If homes completed the assessment at a time point, very little data was missing and missing data was excluded. Sensitivity analyses were conducted for the 40 providers with 12-month outcomes (NUT n = 22; CON n = 18) to determine if there were differences in the intervention impact on those who did not have longer-term follow-up. A per-protocol analysis excluded FCCH that did not receive the full intervention for their respective arm. The prespecified analysis included comparison of the two arms across time points (NUT = 21; CON = 17). Two providers missed the small group class (NUT = 1, CON = 1) and were excluded in the per-protocol analysis. While primary analyses examined the group by time intervention effect, exploratory analyses included within-group comparisons. For example, this could include a significant change from baseline within a single group that was not reflected in a significant group by time effect. These within group exploratory analyses provide opportunity to observe possible changes within larger studies.
Virtual intervention delivery
Intervention analyses were conducted for the baseline to 12-month changes using the same approach described above (NUT = 15; CON = 21) with 3-month outcomes. These criteria were chosen to quantify the impact of the study interventions for those who completed short-term study goals. Due to high attrition, no sensitivity analysis or per-protocol analyses were conducted. Exploratory analyses included within-group comparisons.
Results
Demographic characteristics
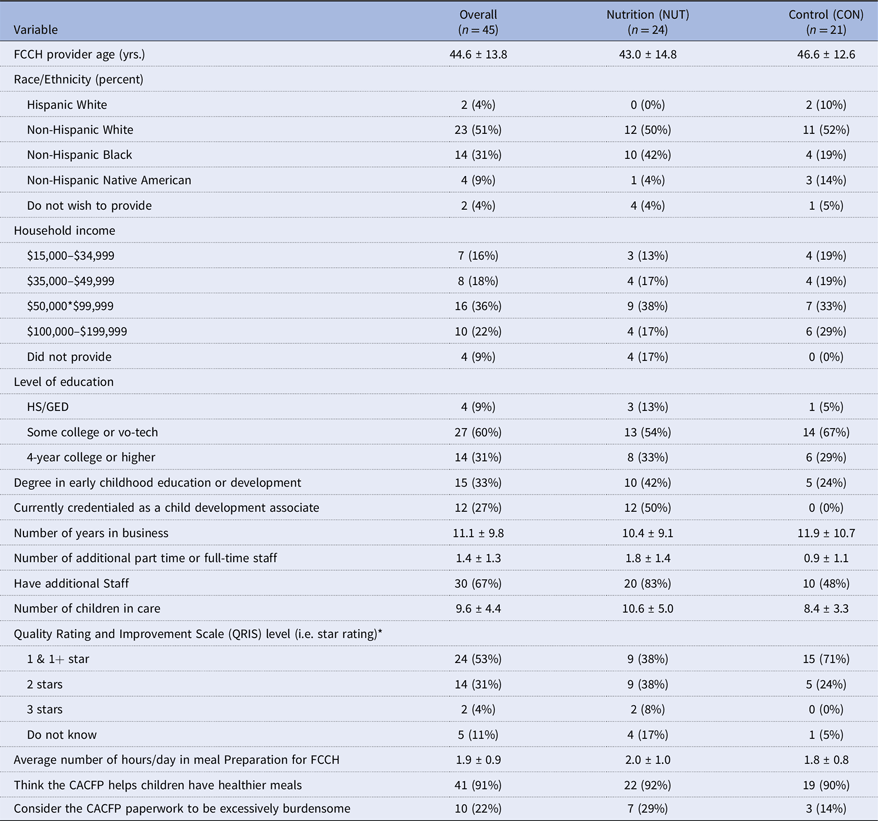
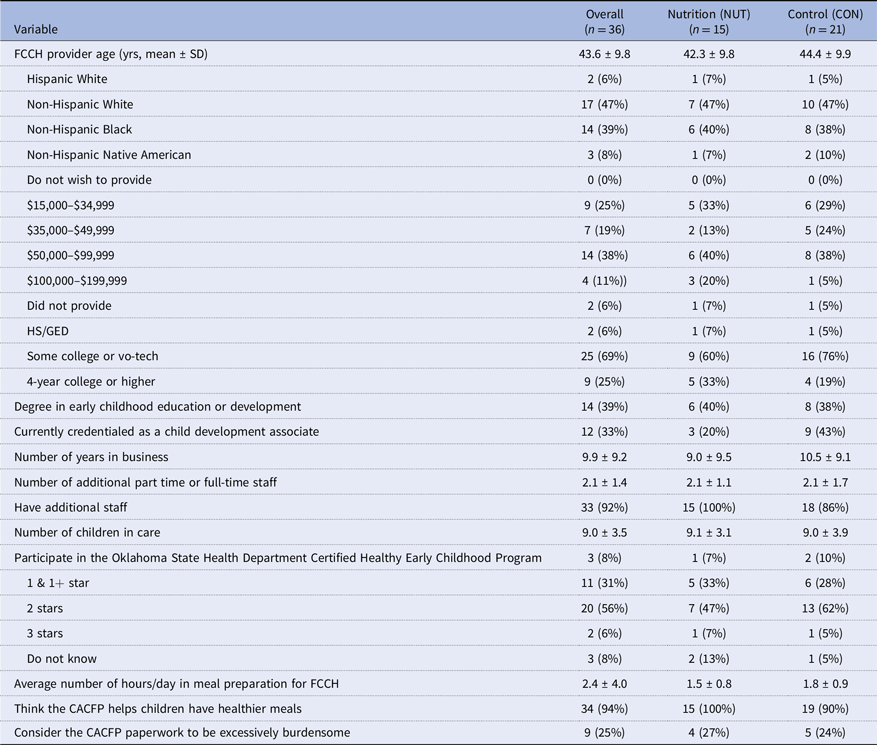
Tables 1 and 2 include demographic characteristics. Cohort1 and Cohort2 providers were 44.6 ± 13.8 and 43.6 ± 9.8 years of age, 100% women, and 51% and 47% were Non-Hispanic white, respectively. FCCHs in Cohort1 and Cohort2 had been in operation for 11.1 ± 9.8 and 9.9 ± 9.2 years and cared for 9.6 ± 4.4 and 9.0 ± 3.5 children, respectively. No intervention-related harms were observed.
Descriptive characteristics of family child care home providers (n = 45) completing the in-person Happy Healthy Homes intervention, Oklahoma City 2017–2019

Table 1 Long description
The table presents demographic characteristics of family child care home providers in two cohorts. It has 18 rows and 3 columns. The columns are labeled Overall, Nutrition (NUT), and Control (CON). The rows include variables such as provider age, race/ethnicity, household income, level of education, number of years in business, number of additional staff, number of children in care, Quality Rating and Improvement Scale (QRIS) level, average number of hours/day in meal preparation, opinion on the Child and Adult Care Food Program (CACFP), and perception of CACFP paperwork burden. Each row provides specific data points for each variable across the three columns. For example, the average provider age is 44.6 years overall, 43.0 years in the Nutrition group, and 46.6 years in the Control group. The table also includes percentages for race/ethnicity, household income brackets, education levels, QRIS levels, and opinions on the CACFP.
CACFP = Child and Adult Care Food Program.
* Quality Rating and Improvement Scale star level criterion for FCCH 1 star = minimum licensing requirements; 1+ star = meets few additional licensing and compliance standards; 2 stars = meets stronger additional licensing and compliance standards OR nationally accredited; 3 stars = meets additional licensing and compliance standards AND nationally accredited(59).
Descriptive characteristics of family child care home providers (n = 33) completing the virtual Happy Healthy Homes intervention, Oklahoma 2020

Table 2 Long description
A table comparing demographic characteristics of family child care home providers. The table has 33 rows and 3 columns. The columns are labeled Overall, Nutrition, and Control. The rows include variables such as provider age, race, income, education, degree, credential status, years in business, additional staff, number of children in care, program participation, star ratings, meal preparation hours, perception of CACFP, and paperwork burden. Each row provides specific data points for each column. For example, the mean provider age is 43.6 years overall, 42.3 years for Nutrition, and 44.4 years for Control. The table also includes percentages and counts for various demographic categories.
CACFP = Child and Adult Care Food Program.
* Quality Rating and Improvement Scale star level criterion for FCCH 1 star = minimum licensing requirements; 1+ star = meets few additional licensing and compliance standards; 2 stars = meets stronger additional licensing and compliance standards OR nationally accredited; 3 stars = meets additional licensing and compliance standards AND nationally accredited(59).
Longitudinal nutrition practice group by time effects
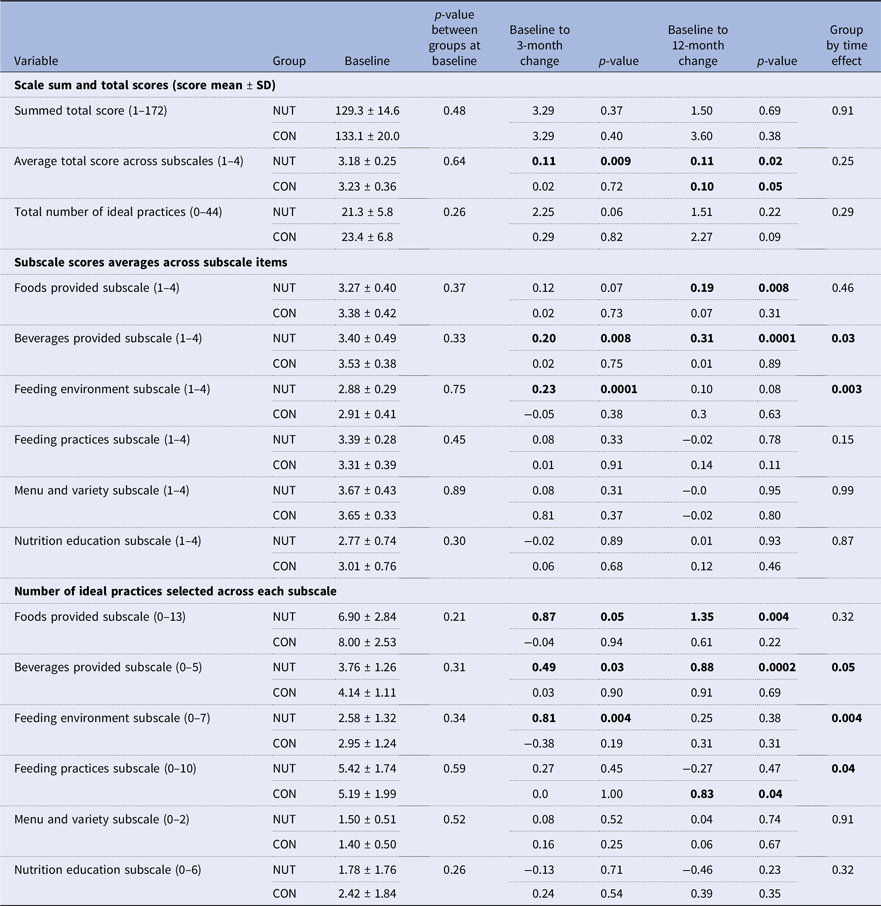
At 12 months in Cohort1, there were statistically significant group by time effects for the self-reported nutrition practices (Table 3) for beverages provided (3.40 to 3.71, p = 0.03) and feeding environment (2.88 to 2.98, p = 0.003). Similarly, the number of ideal practices around beverage (p = 0.05) and feeding environment (p = 0.004) increased in NUT, while CON was unchanged. The number of ideal feeding practices decreased in NUT while it increased in CON (p = 0.04).
Family child care home (n = 45) change in self-reported nutrition practices as reported on the Nutrition and Physical Activity Self-Assessment (NAPSACC) for family child care homes at baseline, three, and twelve months following the in-person Happy Healthy Homes intervention, Oklahoma City 2017–2019

Table 3 Long description
A table comparing nutrition practices in family child care homes at baseline, three, and twelve months. The table has 18 rows and 10 columns. Column headers are Variable, Scale sum and total scores (score mean ± SD), p-value between groups at baseline, Baseline to 3-month change, p-value, Baseline to 12-month change, p-value, Group by time effect. Row labels include Summed total score, Average total score across subscales, Total number of ideal practices, and various subscale scores and ideal practices. Each row provides data for two groups, NUT and CON, across different time points and statistical analyses. Notable trends include significant changes in beverages provided and feeding environment subscales over time.
* Comparisons made with independent t-tests with unequal variances to account for small sample size.
CON, Attention matched control environmental health intervention; NUT, nutrition environment intervention.
Bold text indicates statistical significance.
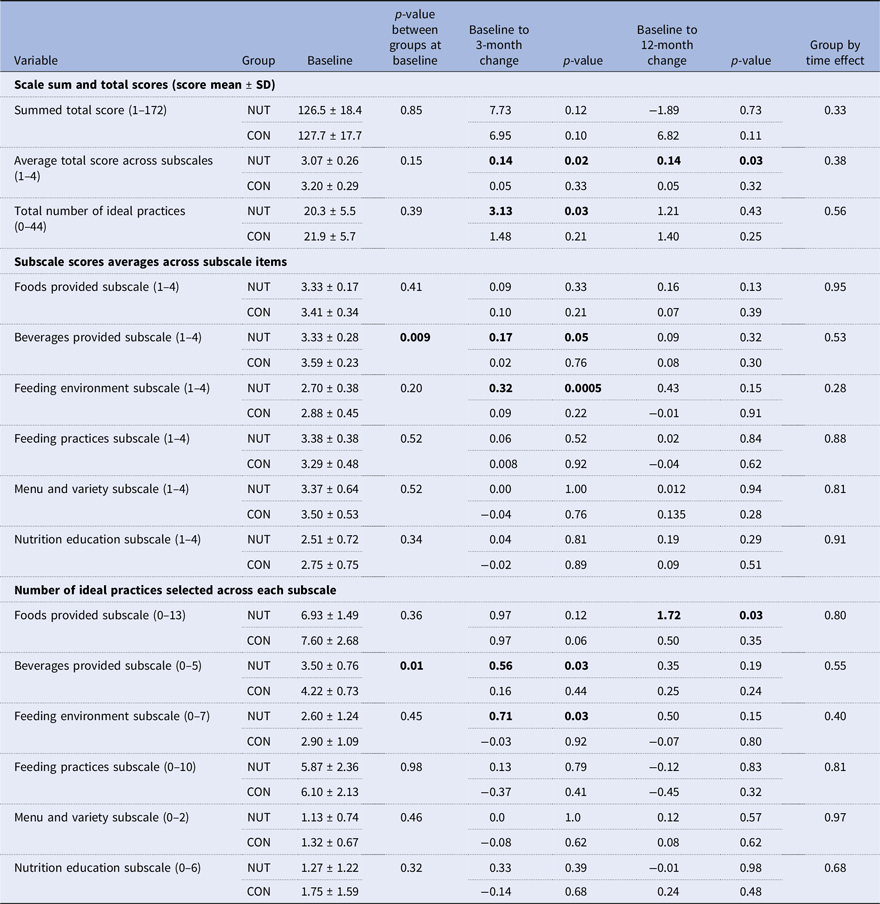
No significant group by time effects were observed for self-reported nutrition practices in Cohort2 (Table 4). These findings were consistent in the sensitivity and the per-protocol analyses (unreported).
Family child care home (n = 36) change in self-reported nutrition practices as reported on the Nutrition and Physical Activity Self-Assessment (NAPSACC) for family child care homes at baseline, three, and twelve months following the virtual Happy Healthy Homes intervention, Oklahoma 2020

Table 4 Long description
The table presents data on self-reported nutrition practices for two groups, NUT and CON, at baseline, 3-month change, and 12-month change. It includes scale sum and total scores, subscale scores averages, and the number of ideal practices selected across each subscale. The table has 18 rows and 9 columns. Column headers are Variable, Group, Baseline, p-value between groups at baseline, Baseline to 3-month change, p-value, Baseline to 12-month change, p-value, and Group by time effect. Row labels include Summed total score, Average total score across subscales, Total number of ideal practices, and various subscale scores and practices. Notable trends include significant p-values in the Beverages provided subscale and Feeding environment subscale for the NUT group.
* Comparisons made with Kruskal–Wallis tests to account for small sample size in rural extension of study.
CON, Attention matched control environmental health intervention; NUT, nutrition environment intervention.
Bold text indicates statistical significance.
Longitudinal confidence group by time effects
No group by time effects were observed for the overall confidence scores in either cohort. However, some significant intervention group effects over time for individual confidence items were observed (Tables 5 and 6). In Cohort1, NUT increased confidence in serving high fat and high sugar foods less often (87.5% to 95.7%, p = 0.04) while CON decreased (Table 5). NUT increased (83.3% to 89.3%) confidence in giving families nutrition and health information while CON increased to a larger degree (71.4% to 83.3%) yielding a group by time effect, (p = 0.006; Table 5). In Cohort2. NUT decreased confidence in serving vegetables multiple times/day (80.0% to 40.7%, p = 0.002) while CON slightly increased (Table 6). NUT increased confidence in serving high fat and high sugar foods less often (73.3% to 90.0%, p = 0.02) while CON decreased (Table 6). These findings were consistent in the sensitivity and the per-protocol analyses (unreported).
Family child care home (n = 45) change in nutrition confidence and barriers for family child care homes at baseline, three, and twelve months following the in-person Happy Healthy Homes intervention, Oklahoma City 2017–2019

Table 5 Long description
The table presents data on the changes in nutrition confidence and barriers for family child care homes at baseline, three, and twelve months following the in-person Happy Healthy Homes intervention in Oklahoma City from 2017 to 2019. The table has 10 rows and 11 columns. Column headers are: Variable, Group, Baseline, Response to 3-month follow-up, p-value, Response to 12-month follow-up, p-value, Group by time, and Group by time p-value. Row labels include Confidence, Beverages, Foods served, Meal environment, Nutrition education, Barriers, Beverages, Foods served, Meal environment, and Nutrition education. Each row contains data for NUT and CON groups at different time points and p-values indicating statistical significance. Notable trends include changes in confidence levels and barriers over time for specific nutrition-related items.
* Confidence score range 0–18, higher score indicates higher confidence.
** Barriers score range 20–60, lower score indicates lower barriers.
*** Comparisons made with Chi-Square or Fisher’s Exact test.
NUT, nutrition environment intervention; CON, Attention matched control environmental health intervention.
Bold text indicates statistical significance.
Family child care home (n = 36) change in nutrition confidence and barriers for family child care homes at baseline, three, and twelve months following the virtual Happy Healthy Homes intervention, Oklahoma 2020

Table 6 Long description
The table presents data on nutrition confidence and barriers for family child care homes at baseline, three, and twelve months following the virtual Happy Healthy Homes intervention. It includes scores and percentages for various items related to confidence and barriers. The table has 10 rows and 12 columns. Column headers include Group, Baseline, Baseline to 3-month change, p-value, Baseline to 12-month change, p-value, and Group by time p-value. Row labels include items such as Confidence, Beverages, Foods served, Meal environment, Nutrition education, and NutritionEducation. Each row provides data for two groups, NUT and CON, at different time points. Notable trends include changes in confidence in serving high fat and high sugar foods less often, serving vegetables multiple times/day, and giving families nutrition and health information.
* Confidence score range 0–18, higher score indicates higher confidence.
** Barriers score range 20–60, lower score indicates lower barriers.
*** Comparisons made with Chi-Square or Fisher’s Exact test.
NUT, nutrition environment intervention; CON, Attention matched control environmental health intervention.
Bold text indicates statistical significance.
Longitudinal barriers group by time effects
No group by time effects were observed for the overall barriers in either cohort. However, some significant intervention group by time effects for individual barriers in Cohort2 were observed (Table 6). Concern with food waste related to children not eating healthy foods decreased in NUT (80.0% to 42.0%, p = 0.03) while CON slightly increased (Table 6). Concerns around palatability of whole grains decreased in NUT (93.3% to 74.0%, p = 0.008) while CON decreased to a lesser degree (Table 6). These findings were consistent in the sensitivity and the per-protocol analyses (unreported).
Longitudinal CACFP knowledge group by time effects
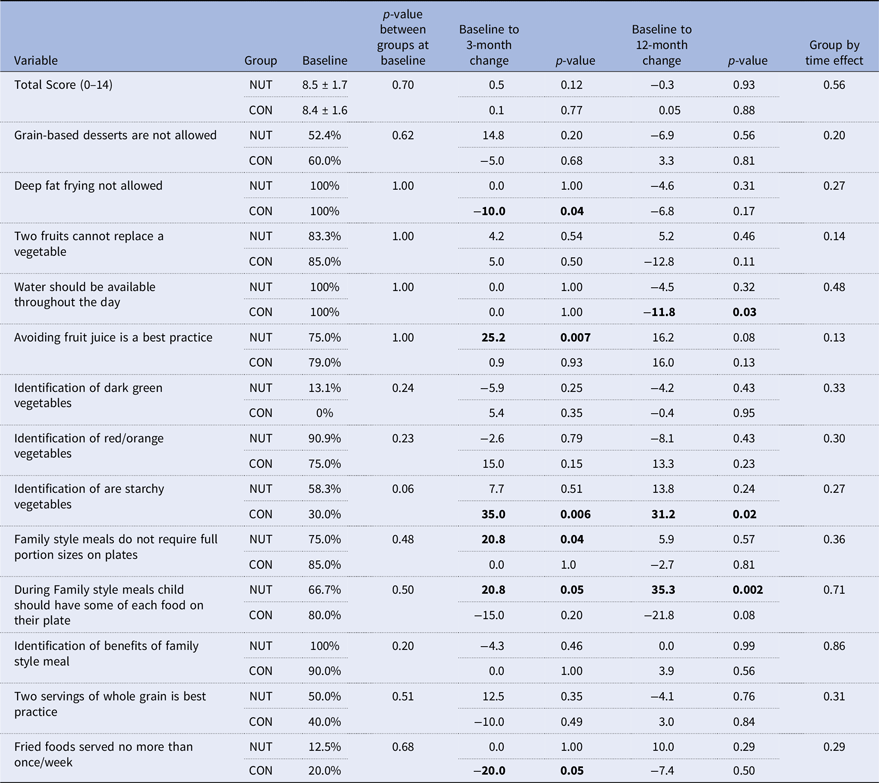
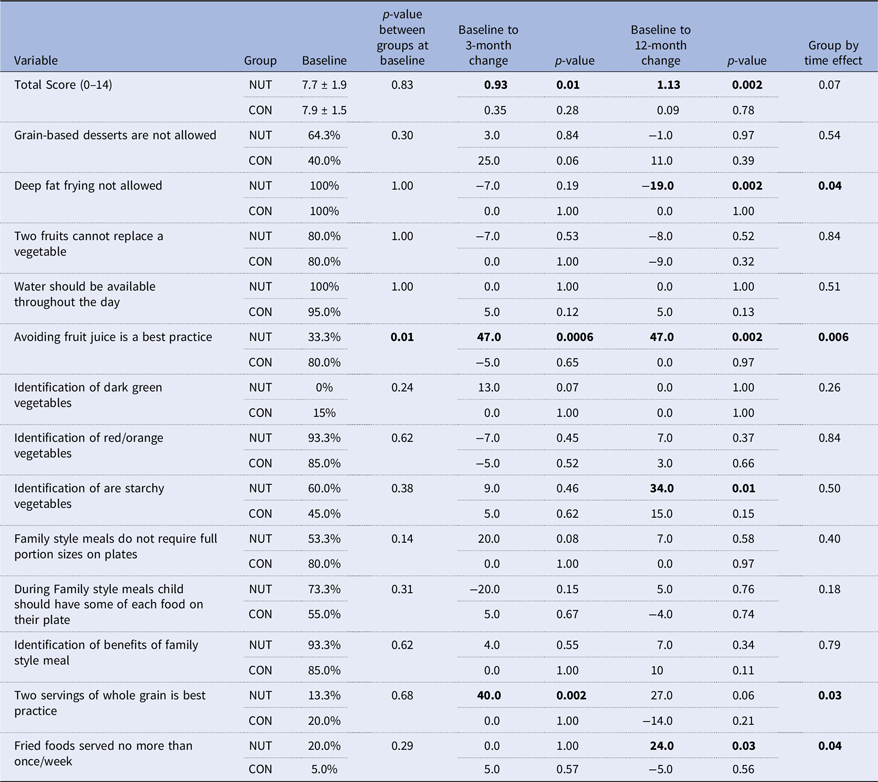
No group by time effects were observed for overall CACFP knowledge for either cohort (Tables 7 and 8). However, in Cohort2, there were some statistically significant intervention group by time effects for individual knowledge items. NUT group decreased knowledge on CACFP requirement on deep fat frying (100% to 81%, p = 0.04) while CON remained the same (Table 8). The NUT group improved knowledge in three aspects (Table 8) (i) serving whole fruit and avoid juice is a CACFP best practice (33.3% to 80.3%, p = 0.006) while CON decreased; (ii) serving two whole grains per day is a CACFP best practice (13.3% to 40.3%, p = 0.03) while CON decreased; and (iii) CACFP best practice recommends limited fried food service (20.0% to 44.0%, p = 0.04) while CON remained the same. These findings were consistent in the sensitivity and the per-protocol analyses (unreported).
Family child care home (n = 45) change in Child and Adults Care Food Program (CACFP) knowledge at baseline, three, and twelve months following the in-person Happy Healthy Homes intervention, Oklahoma City 2017–2019

Table 7 Long description
A table with 15 rows and 10 columns comparing changes in Child and Adults Care Food Program (CACFP) knowledge at baseline, three, and twelve months for two groups, NUT and CON. The columns include Variable, Group, Baseline, p-value between groups at baseline, Baseline to 3-month change, p-value, Baseline to 12-month change, p-value, and Group by time effect. Each row represents a different variable related to CACFP knowledge, such as Total Score, Grain-based desserts, Deep fat frying, and others. The table shows the percentage or score for each group at baseline, the change at three and twelve months, and the corresponding p-values indicating statistical significance. Notable trends include changes in knowledge about deep fat frying, serving whole fruit, serving whole grains, and limiting fried foods.
CON, Attention matched control environmental health intervention; NUT, nutrition environment intervention.
Bold text indicates statistical significance.
Family child care home (n = 35*) change in Child and Adults Care Food Program (CACFP) knowledge at baseline, three, and twelve months following the virtual Happy Healthy Homes intervention, Oklahoma 2020

Table 8 Long description
The table presents data on the change in Child and Adults Care Food Program (CACFP) knowledge at baseline, three, and twelve months for two groups, NUT and CON. It includes variables such as Total Score, Grain-based desserts, Deep fat frying, Two fruits cannot replace a vegetable, Water should be available, Avoiding fruit juice, Identification of dark green vegetables, Identification of red/orange vegetables, Identification of are starch vegetables, Family style meals, During Family style meals, Identification of benefits of family style meal, Two servings of whole grain, and Fried foods served. The table has 16 rows and 10 columns, with column headers including Group, Baseline, p-value between groups at baseline, Baseline to 3-month change, p-value, Baseline to 12-month change, p-value, and Group by time effect. Each row provides specific data points for the NUT and CON groups across different variables, showing changes and p-values over time.
* CON, Attention matched control environmental health intervention; NUT, nutrition environment intervention.
** There was 1 participant in the CON group who did not complete the General Nutrition Knowledge and CACFP Knowledge questionnaires and was excluded from this specific analyses.
Bold text indicates statistical significance.
Exploratory nutrition ideal practice within-group effects
In both cohorts, NUT improved subscale scores and the total ideal practices implemented in the foods and beverages provided and the feeding environment subscales, although not all these changes were sustained at 12 months (Tables 3 and 4).
Exploratory confidence within-group effects
In both cohorts, individual items improved in NUT including increased confidence to limit juice and unhealthy foods, to limit fried foods, to serve high fibre and whole grains, and to serve meals family style. In Cohort1, NUT person overall confidence increased. Counter to hypotheses in Cohort2, NUT decreased in confidence to serve vegetables two or more times/day (Tables 5 and 6).
Exploratory barriers within-group effects
NUT groups in both cohorts experienced fewer overall and individual barriers regarding child autonomy, messes and waste with family style meals (Tables 5 and 6). Counter to hypothesis in Cohort1, CON decreased barriers regarding difficulty of children eating healthy at FCCH while eating poorly at home and, in Cohort2, CON decreased barriers regarding fresh produce spoilage.
Exploratory CACFP knowledge within-group effects
Cohort 1 NUT did not change total CACFP knowledge (Table 7) while Cohort2 NUT did increase total CACFP knowledge scores over the intervention (Table 8). Both cohort’s NUT improved knowledge of limiting juice. In Cohort1, NUT increased knowledge of family style meal service practices. In Cohort2, NUT increased knowledge on vegetable identification, whole grain service best practices, and limiting fried foods. Two observations were counter to hypotheses: in Cohort1, CON increased knowledge about vegetable type identification and in Cohort2, NUT decreased knowledge about deep fat frying prohibitions.
Discussion
The hands-on, theory-driven nutrition intervention was a 6-h intervention delivered over 3 months to FCCH providers with the primary goal to improve children’s nutrition environment by enhancing caregiver nutrition practices. This intervention was modestly effective at enhancing aspects of FCCH practices, confidence, barriers, and nutrition and CACFP knowledge with varied outcomes across delivery modes. Observation of the patterns and trends of significance is prudent given the multiple analyses. For in-person delivery, the intervention demonstrated significant group by time effects for confidence in limiting less healthful foods in both cohorts. In Cohort2, significant group by time effects were observed for reducing barriers around food waste and healthy food palatability and increasing knowledge on CACFP best practices on healthy and unhealthy foods. While significant group by time effects for overall self-reported nutrition ideal practices, overall confidence and barriers scores, and overall CACFP knowledge scores were not observed, some individual items within these scales did demonstrate longitudinal group by time effects. Limited longitudinal between-group effects are likely driven by small sample size and attrition. Some spurious effects were also observed that were counter to hypotheses and without explanation. For example, Cohort1 CON increased confidence for talking with families about healthy practices and the Cohort2 decreased knowledge of CACFP best practices on serving multiple vegetables throughout the day and limiting deep fat frying. The favourable, significant, exploratory, within-group changes indicate the intervention’s potential for future interventions.
Nutrition ideal practices
The intervention observed average nutrition practices’ (i.e. NAPSACC) score (3.18–3.23) that was slightly higher than previous studies in preschool children’s nutrition practices in FCCH ranging from 2.9–3.1.(Reference Dev, Williams and Iruka19,Reference Trost, Messner and Fitzgerald55) Within the current sample, providers met approximately 50% (21.3–23.4 out of 44 total) of the nutrition practices at baseline. Previous studies support that FCCH providers report using many healthful food and nutrition practices.(Reference Gans, Tovar and Jiang22) Limited studies have shown that FCCH providers score high regarding serving healthy foods, however, score lower in using healthy feeding practices.(Reference Williams, Sisson and Padasas23) FCCH providers are generally motivated to serve healthy foods,(Reference Tovar, Risica and Mena24) however, those experiencing more barriers have poorer feeding practices.(Reference Patel, Butzer and Williams29) Within-group results for the NUT group in both cohorts indicated some desired improvements. Both cohorts demonstrated within-group improvements for the foods and beverages provided and the feeding environment subscales at 3 months, although these changes tended to attenuate by 12 months. This may indicate that practices may return to previous habits if key messages are not reinforced over time. To overcome this, future interventions can include booster sessions or a longer intervention period or dose to extend and reinforce positive behaviour changes.
The majority (77.8%; 7 of 9 studies) of previously published FCCH nutrition interventions summarised in a recent review(Reference Vorage, Vincze and Tudehope32,Reference Yoong, Lum and Jones33) demonstrated enhanced FCCH nutrition environments. Some integrated the training within ongoing professional training opportunities including those provided by Extension Educators(Reference Dev, Williams and Iruka19,Reference Kohel, Hatton-Bowers and Williams36) and early childhood resource and referral trainers (federally supported staff who provide training on various topics to ECE professionals and assist in connecting families to child care).(Reference Trost, Messner and Fitzgerald20) Training has ranged from 2 to 10 h with ongoing supporting and technical assistance coaching and toolkits and support materials.(Reference Vorage, Vincze and Tudehope32) Of the two studies in preschool-age children nutrition practices using the same assessment tool, statistically significant increases were observed form the overall NAPSACC nutrition scores from 2.8–2.9 before to 3.0–3.1 after the intervention(Reference Trost, Messner and Fitzgerald20) and numerous individual practices from 2.02–3.65 before to 2.73–3.89 after the intervention.(Reference Dev, Williams and Iruka19)
Nutrition confidence and barriers
Providers indicated relatively high levels of baseline confidence (score of 15 out of 18 maximum) and low barriers (score of 33 with possible range of 20–60 and lower score indicting fewer barriers) in both cohorts. Significant group by time effects were observed for several key confidence and barrier intervention target areas in both cohorts including limiting fruit juice and unhealthy foods and concerns about plate waste and palatability of healthy, whole grains. Exploratory within-group analyses demonstrated desired improvements in several targeted intervention topics of nutrition confidence and barriers. Providers with higher levels of confidence have healthier feeding and mealtime practices(Reference Patel, Sisson, Stephens, Williams, Hoffman and Salvatore8) and reducing nutrition misconceptions enhances the quality of meals(Reference Lanigan31) thus supporting the importance of including confidence building activities and discussing ways to minimise barriers. These findings align with previous qualitative work indicating that providers want to provide optimal nutrition for young children in their care but experience barriers that prevent them from reaching these goals.(Reference Tovar, Mena and Risica26–Reference Earnesty, Mphwanthe and Rau28) Frequent barriers include concerns about family style meals, higher costs of CACFP best-practice foods, food preparation time, unhealthy diets at home, and food waste.(Reference Earnesty, Mphwanthe and Rau28–Reference Jiang, Tovar and Risica30) Our intervention addressed individual barriers in the goal setting and coaching sessions whereas Gans et al.(Reference Gans, Tovar and Jiang22) provided written materials on addressing barriers mentioned by individual providers. Enhancing confidence and reducing barriers could support improved FCCH practices, and presents an ongoing opportunity to enhance FCCH programme quality.
CACFP knowledge
The overall baseline CACFP best practices knowledge was relatively low at 56–61%, but similar to the single other study examining CACFP knowledge in FCCH (60%).(Reference Rida, Burger and Dev56) Several exploratory within-group changes were observed in Cohort1 and Cohort2 including avoidance of juice and feeding practices around family style meal service and child autonomy. Taken together these findings are encouraging, albeit modest, that the intervention demonstrated effect on targeted components of CACFP best practices knowledge. Studies examining nutrition knowledge in FCCH indicate that higher nutrition knowledge is associated with more healthful nutrition practices,(Reference Loth, Shanafelt and Davey9,Reference Francis, Perrin and Black10,Reference Benjamin-Neelon, Vaughn and Tovar18,Reference Patel, Sisson and Sleet57) however, less is understood about CACFP knowledge impact on participation in nutrition ideal practices and CACFP best practices.
Strengths and limitations
Strengths of this study include the use of behaviour change theory and FCCH provider input for intervention design and delivery. Outcome measures include self-report assessments designed for the FCCH context. Another strength includes the examination of intervention effectiveness immediately following the intervention and 9 months later (12 months post-baseline) after offering insight into longer lasting effects. Data analyses included intent-to-treat analyses and examined group effects of the full sample and conducted sensitivity analyses among those who completed the longer-term follow-up, and among those who completed the full intervention protocol.
Limitations of this study include the limited sample size, retention, and self-report data. The attrition rate was higher than expected and thus the analytical sample of this pilot study was statistically underpowered. Attrition in Cohort2, which prioritised recruitment in rural areas, was larger than Cohort1. Given that Cohort2 took place during the COVID-19 Pandemic, it is possible that the attrition may be related to the context rather than virtual delivery mode. FCCH with limited staff were particularly vulnerable to COVID-19 impacts including shut downs, staff turn over, financial challenges of children leaving care, and food accessibility. The ability to complete participation in this trial during COVID-19 may indicate a level of bias in the support systems (i.e. technology literacy, familial/partner support, patron support, necessary to maintain the business and additional study demands). Despite random assignment, some pertinent group differences were observed at baseline. Self-reported data carries possible levels of social-desirability bias which may result in higher than actual reported nutrition ideal practices, confidence, and barriers. Future studies may seek to objective assessment of environment, behaviours, and outcomes through observation and use of technology.
The exploratory analyses can serve as a guide for future, larger, better powered studies. Additionally, intervention recruitment can be a challenge in a population with limited scheduling availability due to long hours in child care and often without support staff. Participant burden, discomfort with direct observation (Cohort1), stress with COVID-19 shut downs (Cohort2), novelty and learning curve of remote intervention delivery (Cohort2), and logistical issues with tool kit delivery (Cohort2) were deterrents to enrolment and retention. Given the current ubiquitous use of Zoom®, the population is much more accustomed to remote communication processes, including telehealth, and likely the early learning curve and drop out related to technology frustrations would be lower in the future.(Reference Kyle, Blendon and Findling58) Utilisation of remote evaluation measures may be advantageous to enhance recruitment and retention.
With few nutrition interventions focusing directly on FCCH providers, more work is needed. While changes were modest, these findings are promising. Future research could include variations on the intervention dose, such as inclusion of booster sessions, individual coaching, or longer overall duration. Given the recruitment and retention limitations identified, more research is needed to understand how best to recruit and retain FCCH providers in health intervention research, specifically with the inclusion of remote evaluation and/or intervention delivery modes outside of the immediate post COVID-19 shut down. While this study and others include self-reported assessment,(Reference Trost, Messner and Fitzgerald20,Reference Woodward-Lopez, Kao and Kuo34) development of assessment measures with lower social-desirability bias and low burden would increase veracity of study findings and reduce participant burden. To further understand intervention effectiveness on child overall health, future research can include measures of children’s height and weight, and/or at-home health behaviour. While this intervention focused on the FCCH provider and did not include outreach to families, future nutrition and obesity-prevention interventions may be strengthened by including components for both FCCH providers and caregivers at home.
Conclusion
This intervention is one of few FCCH-focused interventions seeking to enhance the nutrition environment for young children. The context of the FCCH presents training and education challenges based on providers’ limited availability and time to dedicate to professional development. Yet, these are important places to reach children given the number of children enrolled in FCCHS(7) and the elevated obesity risk of these contexts.(Reference Swyden, Sisson and Lora12) Reaching FCCH in rural areas presents additional challenges regarding location and logistics. Both in-person and virtual delivery modes demonstrated some potential to enhance the nutritional quality of FCCHs in some specific domains. Based on study findings and supporting literature, implications to consider in future interventions include use of self-directed goal setting; individual and small group learning opportunities. These provide opportunity for tailored assistance in addition to social support for FCCH providers working in settings typically isolated from peers. Inclusion of virtual intervention delivery and/or partnering with existing statewide infrastructure, such as Cooperative Extension may increase participant access especially in rural areas. Since we observed exploratory analysis significance at 3 months but this was not sustained as 12, inclusion of intervention booster activities may increase long-term intervention success.. Future studies are needed to refine these encouraging research findings and assess their generalizability to FCCH beyond Oklahoma given the small sample size and attrition.
Acknowledgements
We acknowledge the support and contributions of our community partners who all worked diligently to ensure successful recruitment efforts and enhance quality of data collection and processing. We appreciate the Happy Healthy Homes research team for support in recruitment, data collection and management. We are deeply grateful to the study participants and child care providers who allow us into their homes and who wish to create healthier spaces for young children. The public and participants were not involved in the trial design, conduct, or reporting. We would specifically like to acknowledge Dr. Dianne S. Ward for her scientific guidance and mentorship throughout this project.
Supplementary material
The supplementary material for this article can be found at https://doi.org/10.1017/jns.2026.10147.
Data availability statement
The datasets generated, used, and analysed during the current study are not publicly available since consent was not provided for public access. However, they are available from the Corresponding Author on reasonable request and with approval institutional data sharing agreements.
Data sharing Participant data and data dictionaries can be accessed by request of the PI and approval of data sharing use and agreement of the University of Oklahoma Health Sciences.
Author contributions
SBS is the Principal Investigator, designed the study and intervention, supervised intervention delivery, supervised data analyses, and was the primary author for the manuscript. JL conducted data analyses, wrote analyses section, and reviewed data interpretation. SH conducted data analyses, wrote analyses section, and reviewed data interpretation. BDW was the study coordinator, collected data, processed data for analyses, maintained trial records, contributed to writing and reviewing this manuscript for the in-person delivery. DP was the study coordinator, collected data, processed data for analyses, maintained trial records, contributed to writing and reviewing this manuscript for the virtual delivery. SV supervised data analyses reviewed and revised the manuscript. TP contributed to cooking class intervention development and manuscript review and revision. CC developed the intervention nutrition curriculum and contributed to manuscript review and revisions. DH contributed to study design, intervention development, and contributed to review and revision of the manuscript. ALS is the study Co-Principal Investigator and contributed to study design and intervention, contributed to analyses, writing, and reviewing the manuscript.
Financial support
This study is supported by Agriculture and Food Research Initiative grant no. 2017–68001-26355 from the USDA National Institute of Food and Agriculture and the National Institute of General Medical Sciences of the National Institutes of Health under award number U54GM104938. Any opinions, findings, conclusions, or recommendations expressed in this publication are those of the authors and do not necessarily reflect the views of the US Department of Agriculture or the National Institutes of Health. Funding agencies were not involved in design of the study and collection, analysis, interpretation of data, or in writing the manuscript.
Competing interests
The authors declare that they have no competing interests
Ethical standards
The University of Oklahoma Health Sciences Institutional Review Board reviewed and approved all study procedures prior to enrolment. All participants were informed of the study procedures their voluntary participation and provided informed consent prior to enrolment and baseline measures.
Consent for publication
Not applicable.
Authors’ information
SBS is a Professor of Nutrition at the University of Oklahoma Health Sciences. JL and SH are statisticians at the University of Oklahoma Health Sciences. BDW was a PhD student in Dr. Sisson’s research laboratory at the time of the study. BDW is currently a Research Associate at the Center for Science and the Public Interest. DP was a PhD student in Dr. Sisson’s research laboratory at the time of the virtual study and is currently a postdoctoral scholar at Case Western Reserve University. TP is a Chef and was a faculty at Oklahoma State University at the time of the study. She developed the recipes and cooking class content alongside SBS and DH. CC was a Master of Arts in Dietetics student and Graduate Research Assistant at the time of the study. CC is currently not in the work force. DH is a Professor of Nutrition and Extension Specialist at Oklahoma State University. ALS was an Associate Professor of Health Promotion Sciences at the time of the study and currently is an independent public health consultant and an Affiliated Associate Professor of Human Development and Family Sciences at the University of Delaware.






 Open access

