Quantification of antimicrobial utilization is an integral part of antimicrobial stewardship programs.Reference Dellit, Owens and McGowan 1 The defined daily dose (DDD) is an internationally recognized unit of measure that estimates the number of patients to whom a drug or class of drug is administered each day.Reference Hutchinson, Patrick and Marra 2 The World Health Organization (WHO) determines an assumed average daily dose as a DDD value, which may be divided into the sum of mass units of a specific drug. These units can be easily calculated without referring to individual patient data and as such are commonly derived from hospital pharmacy dispensing data.Reference Hutchinson, Patrick and Marra 2 However, it has been recognized for some time that DDD units have shortcomings when the doses used in clinical practice differ substantially from the DDD value set by WHO.Reference de With, Bestehorn, Steib-Bauert and Kern 3 – Reference Dalton, Sabuda and Conly 7 For example in pediatric or renal dysfunction patient groups, doses used are typically much smaller than in other adult populations, so the DDD based on usual doses underestimates the patient exposure to drugs.
In recent decades, electronic patient care management systems have become commonplace in acute care institutions. Electronic medical administration records (eMAR) are used by care staff to record administration of each dose of medication given to a patient and as such should be a better measure of patient exposure to drugs than pharmacy dispensing records and potentially easily used to calculate patient-days of antimicrobial exposure, known as days of therapy (DOT). Since DDD is a method to estimate DOT, DOT have been regarded as the preferable unit.Reference Morris, Brener and Dresser 8 Comparisons of pharmacy-derived DDD to eMAR DOT are potentially useful for comparison of antimicrobial utilization data based on these different units, and discrepancy may arise from either the difference in the units used, or differences in quantity recorded by the 2 data sources. Calculation of DDD from the eMAR data allows the quantification of these 2 sources of discrepancy. Accounting of doses sent from pharmacy (charging and crediting) of medication may be institutional- or healthcare system–specific because crediting of returned doses can be a laborious process and published data on the discrepancy between pharmacy utilization and eMAR data are difficult to find. As a result, we sought to determine the extent to which antimicrobial utilization quantified by DDDs from a pharmacy system (pDDD) agrees with DDDs from an eMAR system (eDDD) and DOT from eMAR (eDOT) in the measurement of total antimicrobial use and quantity of commonly used antimicrobial agents individually.
METHODS
Study Location and Time Frame
The Calgary Zone of Alberta Health Services serves a population of approximately 1.4 million in Southern Alberta, Canada. At the time of this study there were 3 acute care adult facilities in Calgary and 1 specialized pediatric hospital, where most pediatric patients are admitted. A regional computerized pharmacy system (Centricity, version 9.1; General Electric) has been in place since 1998 and is used to record drugs prepared and dispensed to individual patients. Sunrise Clinical Manager (version 5.8; Eclipsys) has been used for electronic physician order entry and medication administration recording, among other functions, since 2007. A direct electronic interface between the patient care management system and the pharmacy system is lacking in our region; therefore, changes in therapy in the pharmacy system encounter some delay. The study time frame was January 1 to December 31, 2012.
Inclusion and Exclusion Criteria
We included information from patients 18 years of age and older on 32 general internal medicine and internal medical subspecialty wards within Calgary zone, which included cardiology, general internal medicine, hospitalist, and geriatrics. Renal wards and pediatric patients were excluded because these populations are known to have large discrepancies between DDD and DOT units.Reference Polk, Fox and Mahoney 6 , Reference Morris, Brener and Dresser 8 , Reference Pakyz, Gurgle and Ibrahim 9
Data Collection
We obtained data from the eMAR and pharmacy system on all systemically administered antimicrobial drugs including antibacterial, antifungal, antiviral, antimycobacterial, and antiparasitic agents. Anti-infective drug names were identified from Centricity drug catalog variable “anti-infective” used in our system and drug products not given by a systemic route were deleted. We used this list of generic agents to filter drug administration data on the eMAR database. Data from the eMAR were linked to an individual health record number. Records of doses scheduled but not given were removed from the eMAR data set and drugs were categorized using the WHO Anatomic, Therapeutic, Chemical classification system. DOT were determined using the definition of Polk et al,Reference Polk, Fox and Mahoney 6 as a single patient receiving any dose of an agent by any route between 00:00 and 23:59 on a 24-hour clock. Cumulative mass units of each agent were determined from the pharmacy and the eMAR data for each ward and converted to DDDs using the 2013 online Anatomic, Therapeutic, Chemical/DDD Index as described by Hutchinson et al.Reference Hutchinson, Patrick and Marra 2 Tabulation and calculation of units were performed using a spreadsheet application (Excel 2007; Microsoft).
Statistical Analysis
Results were graphically presented by using ordinary least squares linear regression of the values for total antimicrobial utilization rate (defined as 1,000 patient-days) on all wards by pDDD against eDOT, eDDD against pDDD, and eDDD against eDOT. Slope was determined to represent the proportional difference between the types of measures and the correlation coefficient (Pearson r) was used to assess linearity of the relationships between pairs of measurements. Bland-Altman plots were used to assess the limits of agreement.Reference Bland and Altman 10 Multiple linear regression models were constructed in regression of eDDD against eDOT, pDDD against eDOT, and eDDD against pDDD. Hospital site and route of administration were coded as nominal variables and explored as potential covariates in total use data influencing the relationship of the metrics by stepwise addition to the model (enter method).Reference Alexopoulos 11
We also assessed differences in pairs of measures of use of individual systemic antimicrobial agents by determining the percentage difference of rate of use on each ward. We included only systemic antibacterials (Anatomic, Therapeutic, Chemical J01 category) and excluded drugs with fewer than 5 values (ie, agents where more than 27 of 32 wards had no use during the year). For eDDD to eDOT, pDDD to eDOT, and eDDD to pDDD differences we considered eDOT, eDOT, and pDDD, respectively, to be the reference values. All values for differences were plotted for each systemic antibacterial agent used on the wards and grouped by oral or parenteral administration. The t test was used to compare average discrepancies in different units by oral versus parenteral administration. Average percentage difference for all individual agents and 95% CIs for each route were determined to quantify the discrepancy between units of measure on an individual drug basis.
Graphs were constructed using Excel and correlation, slope, and intercept figures for linear regression were calculated with SPSS, version 19 (IBM).
RESULTS
Use of each individual drug on each ward yielded 1,395 data triplets by the 3 measures. The combined 32 medical wards had rates of total anti-infective use of 365, 394, and 442 for eDDD, eDOT, and pDDD per 1,000 patient-days, respectively. Individual ward rates of total antimicrobial use ranged from 45, 64, and 45 to 961, 951, and 1,132 as measured by eDDD, eDOT, and pDDD per 1,000 patient-days, respectively. In multiple linear regression analysis hospital site had a statistically significant predictive value in 1 model with eDDD as dependant variable and eDOT and hospital site as independent variables (P=.007). In other models, hospital site and route were not significant covariates in the relationship of pairs of units of measure.
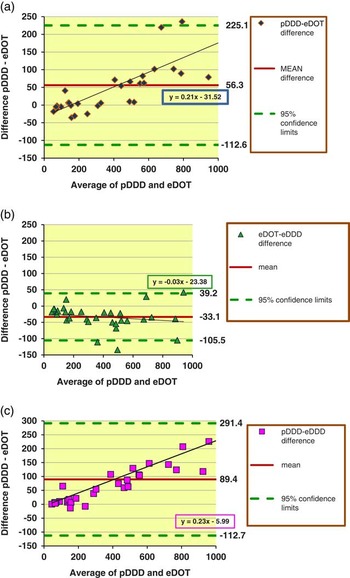
Ordinary least squares regression lines and a scatter plot of the measures of rate of total antimicrobials used on individual wards are provided in Figure 1. The pDDD/1,000 patient-days overall were 20% higher than eDOT values and eDDD values were only 77% of pDDD values, whereas eDOT and eDDD values for total antimicrobial utilization rates were very similar (eDDD 3% greater than pDDD) as indicated by the slope of the regression lines. Bland-Altman graphs of differences between metrics are shown in Figures 2a–c. The comparisons of pDDD vs eDOT and pDDD vs eDDD show obvious proportional bias in the difference with increasing average value (slope of trend lines; 0.21 and 0.23, respectively) and high values for the 95% CIs (−113 to 225 and −113 to 295, respectively), suggesting differences are clinically relevant (Fig 2a and 2c). In contrast, differences in eDOT and eDDD utilization (Fig 2b) rate were relatively low (average difference, −33), were constant, and had relatively narrow 95% CIs (−105 to 39).
Total anti-infective utilization on medical wards. Each point represents total antimicrobial utilization on 1 ward by 2 measures. Squares represent defined daily doses (DDD) from a pharmacy system (pDDD) on x-axis and DDD from electronic medical administration records (eDDD) on y-axis. Triangles represent days of therapy from electronic medical administration records (eDOT) on the x-axis and eDDD on the y-axis. Diamonds represent eDOT on the x-axis and pDDD on the y-axis.

Bland-Altman plots (difference versus average) of total antimicrobial use by different units or source of data on 32 medical wards. Outliers in Figure 2a, 2b represent short-stay medical wards where patients may not receive an entire defined daily dose (DDD) amount of drug, but an entire 24 h supply is sent from the pharmacy department. eDDD, DDD from electronic medical administration records; eDOT, days of therapy from electronic medical administration records; pDDD, DDD from a pharmacy system.

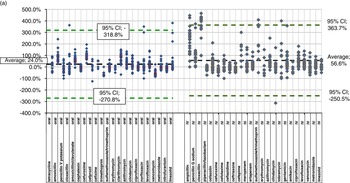
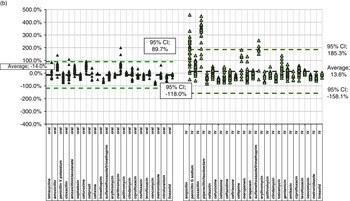
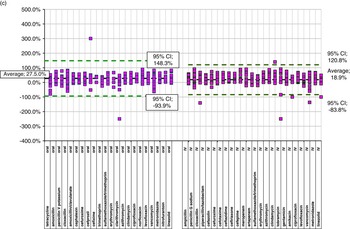
Figures 3a–c illustrate the scatter of differences of the measurement values of individual systemic antibacterial agents. The average discrepancy was 37.9%, 3.5%, and 17.7% for pDDD-eDOT, eDDD-eDOT, and pDDD-eDDD, respectively. The variability in differences seen for individual agents by different units of measure was considerable with 95% CIs of differences of −196.8% to 272.6%, −131.3% to 138.4%, and −63.9% to 99.2%, for pDDD-eDOT, eDDD-eDOT, and pDDD-eDDD, respectively.
Ward level utilization rates of J01 agents (systemic antibacterial); defined daily doses (DDD) from a pharmacy system (pDDD) – days of therapy from electronic medical administration records (eDOT) difference on 32 medical wards. Oral average, 24.0% (95% CI, −270.8 to 318.8). Parenteral average, 56.6% (95% CI, −250.5 to 363.7). Oral to intravenous (IV) comparison, 32.6% difference (P=6.7×10⁻⁷). Outliers: 5 greater than +500% discrepancy, 2 x cloxacillin and tobramycin parenteral, 1 parenteral azithromycin. Outliers are not shown but included in calculation of average and 95% CI values.

Ward level utilization rates of J01 agents (systemic antibacterials); DDD from electronic medical administration records (eDDD) – days of therapy from electronic medical administration records (eDOT) difference on 32 medical wards. Oral average, −14.0% (95% CI, −118.0 to 89.7). Parenteral average, 13.6% (95% CI, −158.1 to 185.3). Oral to intravenous comparison, 27.6% (P=3.2×10⁻⁶).

Ward level utilization rates of J01 agents (systemic antibacterials); defined daily doses (DDD) from a pharmacy system (pDDD) – DDD from electronic medical administration records (eDDD) difference on 32 medical wards. Oral average, −14.0% (95% CI, −118.0 to 89.7). Parenteral average, 13.6% (95% CI, −158.1 to 185.3). Oral to intravenous comparison, 46.4% (P=.52).

DISCUSSION
Our results from comparison of pDDD to eDDD indicate that the source of the data (nursing administration records vs pharmacy dispensing records) is a clinically relevant factor at the level of total antimicrobials (23.0% difference; Figure 1) and at the level of individual agents (average difference, 17.7%; Figure 3c) on general medical wards. This is reflected in the difference in the pDDD to eDOT comparisons for total antimicrobials (20% difference, Figure 1) and individual systemic antibacterial agents (average difference; 37%, Figure 3c), which involves both different units of measure and different data sources. We believe this is largely due to the discrepancy between quantity of drug dispensed versus quantity administered, which occurs because our pharmacy services, as with most centralized pharmacy acute care centers, provide a 24-hour supply of medication every day rather than real-time delivery of medication, and therefore orders may change from the time of dispensing to the time they are administered. In Canada, the most recent hospital pharmacy survey indicates that 70% of all acute care beds use a centralized unit dose system.Reference Hall and Wilgosh 12 Crediting of unused doses returned to pharmacy is a laborious process and practices by pharmacy staff in individual institutions may vary from institution to institution; however, the magnitude of difference we saw is within the same range as that observed in a Veterans Affairs hospital study in the United States.Reference Shirmer, Mercier and Ryono 13 These investigators compared centralized pharmacy dispensing data to medication administration records of nurses using the Veterans Affairs hospital system. Their analysis, using 7 different measures of utilization of 5 different parenteral antibacterial agents, found antimicrobial utilization using records of nursing administration accounted for an average of 13.5% fewer DOT and 24.7% fewer DDD (excluding 1 outlying value) compared with pharmacy records. Assessment by other measures also demonstrated poor agreement and the authors concluded that nursing administration records were a more accurate source of data for drug utilization surveillance.Reference Shirmer, Mercier and Ryono 13
One other study investigated the discrepancy between pharmacy data of centrally admixed intravenous antimicrobials (twice-daily delivery) and nursing administration by direct observation and paper medication administration record.Reference Itokau, Glowacki and Shwartz 14 In a sample of 463 doses that were randomly selected, Itokau et alReference Itokau, Glowacki and Shwartz 14 found that 35.0% of doses sent by pharmacy were not given because orders had been changed or patients were discharged or transferred. A further 9.3% were not administered by direct observation. Furthermore, they found the paper medication administration record versus direct observed discrepancy was 6.6%, suggesting that nursing records are associated with relatively reliable data. In our institution, a parallel investigation to this study examining the frequency and reasons for nonadministration of antimicrobials, found an overall rate of 3.49% of scheduled doses were signed off as not administered.Reference Dalton, Sabuda and Bresee 15 Since our findings corroborate those of Shirmer et alReference Shirmer, Mercier and Ryono 13 and Itokau et al,Reference Itokau, Glowacki and Shwartz 14 and owing to the impracticality of recording drug administration by direct observation, we believe medication administration records should be the gold standard for quantification of drug use in hospital inpatients.
Other factors, such as computer downtime, could contribute to discrepancy between the eMAR and pharmacy data, although we believe in our system such factors are unlikely to be of major importance. A growing trend in the use of automated dispensing cabinets (ADC), noted in CanadaReference Hall and Wilgosh 12 and the United States,Reference Pederson, Schneider and Schedkelhoff 16 , 17 could reduce the number of unused antimicrobial doses and produce data more closely aligned with nursing administration. The limitation of ADC as a source of data for antimicrobial utilization surveillance is that not all ADC can accommodate refrigerated centrally prepared intravenous admixtures, so capturing data on many intravenous antimicrobials would not be possible for those systems and many institutions that use ADC do not do so universally for all locations in the hospital. 17 , 18 Future investigations in this topic area should explore how ADC data influence antimicrobial utilization data.
We investigated the potential influence of hospital site but found site was predictive only of the eDDD to eDOT difference—that is, same source of data but different units of measure. This could reflect prescribing preferences at different hospitals, since the WHO-set DDD values for some agents differ significantly from the prescribed daily dose. Examples are the narrow-spectrum parenteral penicillins (ampicillin, cloxacillin, and penicillin G sodium), which have a notable positive difference between eDDD and eDOT and a wider range, compared with other agents (Figure 3b). These agents were the most divergent in terms of discrepancy of utilization values of individual agents, but differences between units of most individual agents were highly variable (Figure 3a–c) and the range of the upper and lower 95% confidence limits spanned −196.8 to +272.6% difference, in contrast to the relatively minor difference between values for total antimicrobial use when the source was the same (Figure 1).
Our study had several strengths. Firstly, we had a large dataset from general internal medicine and medical subspecialty wards at an integrated metropolitan healthcare institution using the same pharmacy and eMAR system over the course a whole calendar year. We examined records of many different antimicrobial agents rather than a small selection. We also used different methods to assess discrepancy which each have strengths and weaknesses. Scatter plots with linear regression lines are commonly used when comparing 2 datasets and have been previously used for comparison of DOT to DDD.Reference Polk, Fox and Mahoney 6 Many readers are familiar with these graphs and the interpretation is straightforward; perfect agreement would be demonstrated by a regression line with a slope of 1.0 and correlation of 1.0. However, Bland and AltmanReference Bland and Altman 10 have pointed out the limitations of this method of assessing agreement and devised an alternate method of assessing agreement by plotting the difference versus the average of pairs of data. This allows the determination of the average discrepancy and the 95% CIs of the differences. Visual inspection of the data within those confidence limits can aid determining outliers, proportional or constant bias, and precision.
This investigation is limited by the fact that it was conducted in only one healthcare setting, therefore in other types of institutions, findings may be different. Although the sample was from 32 wards, which is adequate to assess between-ward variation, there were only 3 hospitals involved and therefore, we had a limited ability to assess interhospital variation. Canadian hospitals are publicly funded and therefore billing for each dose for all individual patients is required only for case costing but accounts of charges are not scrutinized to the same degree as would be seen if private payers were invoiced.
Antimicrobial stewardship programs must measure the impact of their initiatives, identify targets and/or problem areas, provide feedback to antimicrobial prescribers, and benchmark against other institutions or jurisdictions.Reference Dellit, Owens and McGowan 1 Briefly stated, management is not possible without valid measurement. Large antimicrobial utilization surveillance projects have generally used DDD-based measures.Reference Ansari, Molana and Goossens 19 , Reference Finley, Glass-Kaastra and Hutchinson 20 The availability of eMAR data from patient care management systems in acute care greatly enhances the accessibility of data for the purposes of antimicrobial stewardship and is relatively easy to convert to DOT data. DOT have been regarded as the preferable metric,Reference Monnet 5 , Reference Polk, Fox and Mahoney 6 , Reference Morris, Brener and Dresser 8 since the deviation of dosages used clinically from the WHO-set DDD value does not impact this measure. We compared the international standard metric, the DDD, derived from both pharmacy dispensing records to nursing eMARs and also derived DOT from the latter source.
In conclusion, we found considerable discrepancy in anti-infective utilization based on what patients received versus what was dispensed as measured by the same units, suggesting that the DDD derived from nursing eMAR data should not be directly compared to pharmacy dispensing derived units. We have found that hospital antimicrobial utilization literature is often vague with respect to source of the data.Reference Hutchinson, Patrick and Marra 2 , Reference Polk, Fox and Mahoney 6 , Reference Morris, Brener and Dresser 8 For total anti-infective use on medical wards, the values of DOT utilization rate were similar to DDD utilization rates derived from the same data source but rates of use of individual agents varied considerably by both source of data or units used (DDD versus DOT). As institutions adopt antimicrobial utilization surveillance programs, attention to differences in these measures is required and the use of DOT units from nursing administration records may be the optimal measure.
Acknowledgments
We gratefully acknowledge the assistance of Kevin Lonergan for provision of data from the eMAR.
Financial support. None reported.
Potential conflicts of interest. All authors report no conflicts of interest relevant to this article.