Introduction
Grazed grass is the cheapest feed available to support milk production in a pasture-based system in Ireland (Finneran et al., Reference Finneran, Crosson, O'Kiely, Shalloo, Forristal and Wallace2012) and is of a superior feeding quality due to its higher digestibility and crude protein (CP) (French et al., Reference French, O’ Riordan, Monahan, Caffrey, Vidal, Mooney, Troy and Moloney2000; Kennedy et al., Reference Kennedy, O'Donovan, Murphy, Delaby and O'Mara2005), in general, compared to grass silage (Mayne and Laidlaw, Reference Mayne and Laidlaw1995; Kennedy et al., Reference Kennedy, O'Donovan, Murphy, Delaby and O'Mara2005). As a result of this, an important objective of grass-based milk production systems is to increase the proportion of grazed grass in the diet of lactating dairy cows, particularly in early lactation (Kennedy et al., Reference Kennedy, O'Donovan, Murphy, Delaby and O'Mara2005). If grass supply is deficient, supplementation of concentrate and/or conserved forage is needed to meet dietary requirements. However, this can result in an increase in variable costs of production by up to 40% (Shalloo et al., Reference Shalloo, Dillon, O'Loughlin, Rath and Wallace2004; Hanrahan et al., Reference Hanrahan, McHugh, Hennessy, Moran, Kearney, Wallace and Shalloo2018). In contrast to this, each 10% increase in the proportion of grazed grass in the diet can reduce the cost of milk production by €0.025/litre (Dillon et al., Reference Dillon, Roche, Shalloo, Horan and Murphy2005).
Due to the growth pattern of perennial ryegrass (Lolium perenne L; PRG), there is little grass growth during late autumn and early spring (Dillon et al., Reference Dillon, Crosse, Stakelum and Flynn1995; Hennessy et al., Reference Hennessy, O'Donovan, French and Laidlaw2008). Therefore, it is essential to adapt grassland management accordingly to achieve adequate grass availability in spring (February to April) to exploit the benefits of spring grass in the diet of the early lactation dairy cow (Dillon et al., Reference Dillon, Crosse, Stakelum and Flynn1995). While there is a body of work determining how grass availability in spring can be increased through autumn grassland management (Carton et al., Reference Carton, Brereton, O'Keeffe and Keane1988; Hennessy et al., Reference Hennessy, O'Donovan, French and Laidlaw2006; Ryan et al., Reference Ryan, Hennessy, Murphy and Boland2010), there is limited knowledge on how this will influence animal production in the subsequent spring.
The influence of grazed grass in early lactation on milk production has been widely acknowledged (Wales et al., Reference Wales, Doyle, Stockdale and Dellow1999; Dillon et al., Reference Dillon, Crosse, O'Brien and Mayes2002; Kennedy et al., Reference Kennedy, O'Donovan, O'Mara, Murphy and Delaby2007; McEvoy et al., Reference McEvoy, Kennedy, Murphy, Boland, Delaby and O'Donovan2008). Dry matter (DM) intake (DMI) is a critical factor in animal performance and increasing daily herbage allowance (DHA) in early lactation has been shown to support greater milk production (Wales et al., Reference Wales, Doyle, Stockdale and Dellow1999; Kennedy et al., Reference Kennedy, O'Donovan, O'Mara, Murphy and Delaby2007; McEvoy et al., Reference McEvoy, Kennedy, Murphy, Boland, Delaby and O'Donovan2008). Lewis et al. (Reference Lewis, O'Donovan, Kennedy, O'Neill and Shalloo2011) reported that DMI increases post-calving, from 10 kg DM/cow until peak DMI is achieved circa week eight of lactation (c. 18 kg DM/cow; 550 kg mature cow on grass only diet). As a result of this, it is essential that increases in DHA follow a similar pattern to increases in DMI demand, as previous studies have demonstrated that a lower DHA reduces immediate milk production as a result of reduced DMI (Wales et al., Reference Wales, Doyle, Stockdale and Dellow1999; Kennedy et al., Reference Kennedy, O'Donovan, O'Mara, Murphy and Delaby2007; Ganche et al., Reference Ganche, Delaby, O'Donovan, Boland and Kennedy2013b), if concentrate supplementation is not used to fill the feed deficit. However, increases in concentrate supplementation will result in an increase in the cost of production (Shalloo et al., Reference Shalloo, Dillon, O'Loughlin, Rath and Wallace2004).
Previous research (Bryant and L'Huillier, Reference Bryant and L'Huillier1986; Macdonald and Roche, Reference Macdonald and Roche2016) has shown that allocating a set area per day to grazing animals in the first rotation, commonly known as the spring rotation plan (SRP) tool (Teagasc, 2009), can ensure that an allocation of grass can be maintained in the diet to a point where grass growth equals the pasture demands of the herd. Bryant and L'Huillier (Reference Bryant and L'Huillier1986) reported that the spring rotation length (SRL) should be influenced by the level of herbage available on-farm at the beginning of the grazing season (measured as opening farm cover (OFC; kg DM/ha) in Ireland) and that growth should be routinely monitored to influence decision-making on the farm. However, there is limited work investigating the effects of rotation length following turnout in spring on animal performance (Bryant and L'Huillier, Reference Bryant and L'Huillier1986; Macdonald and Roche, Reference Macdonald and Roche2016).
The objectives of the current experiment were; (1) to determine the effect of spring grass availability, as a result of the autumn closing date, on early lactation milk production and (2) to determine the influence of SRL on animal and sward production in early lactation.
Materials and methods
Experimental site
This experiment was undertaken at the Teagasc, Animal & Grassland Research and Innovation Centre, Moorepark, Fermoy, Co. Cork (52°16′N; 8°25′W; 49 m a.s.l) from 6 February 2017 to 30 April in 2017 (year one) and 5 February to 29 April 2018 (year two). The soil type was a free draining, acid brown soil with a sandy loam to loam texture. Soils had a pH of 6.8 (±0.2), phosphorus (P) index of 3.8 (±0.4) and potassium (K) index of 3.3 (±0.8; scale 1–4; 1 = deficient, 4 = no response to the application of nutrient; Alexander et al., Reference Alexander, Black, Boland, Burke, Carton, Coulter, Culleton, Dillon, Hackett and Humphreys2008).
Meteorological data
Meteorological data were recorded at the experimental site using the automatic weather station of Met Éireann (2019). The daily rainfall (mm), air temperature (°C) and soil temperature to a depth of 100 mm (°C) were recorded throughout the experimental period.
Experimental design
A 3 farm cover × 2 rotation length factorial, randomized design farm-let experiment was established in autumn prior to the experiment beginning. The actual experiment was conducted over a 12-week period in the spring of year one (2017) and year two (2018). A total of 30.6 ha of permanent grassland were used for the experiment in both years. Paddocks were balanced and blocked based on previous year's herbage production (kg DM/ha), soil fertility, age of sward (avg. 4 years) and sown cultivars, where all paddocks remained on the same treatment for the duration of the two experimental years. The swards were predominantly made up of PRG (>85%; cv. Tyrella, Astonenergy, Meduno and Oakpark), while the remainder consisted of meadow grasses and clover (Poa, festuca pratensis and trifolium repens, cv. Chieftain). A separate farm-let (5.1 ha) of eight paddocks were created and permanently fenced for each of the six treatments. All blocks of paddocks were grazed in the same rotation for their final grazing in autumn and then closed until the following spring.
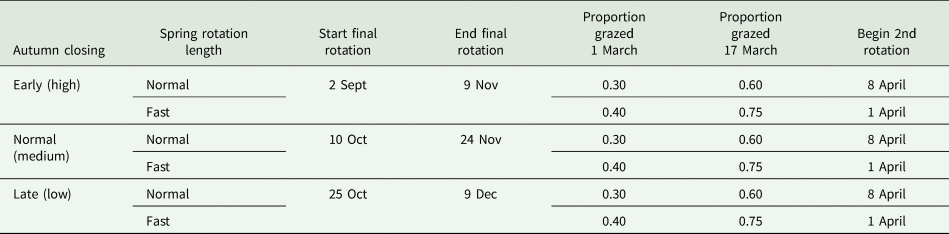
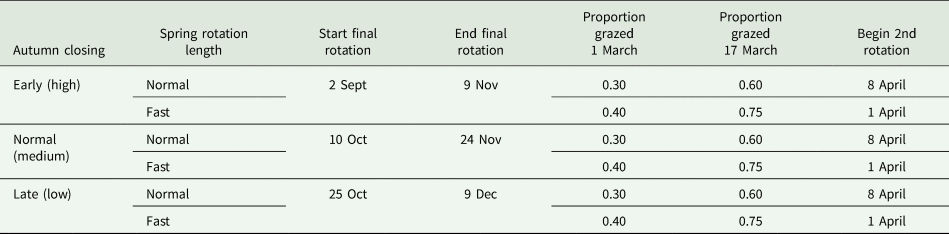
Three OFC (high, medium and low) were established. The three OFC were achieved by imposing three autumn closing managements to the farm-lets the previous autumn. The range in OFC was achieved by closing a proportion of the farm each day for the high, medium and low OFC within the following range of dates: high – 25 September to 9 November; medium – 10 October to 24 November and low – 24 October to 9 December, respectively (Table 1). Prior to the onset of grazing, pasture cover within each paddock was measured on 1 February to determine the average available grass per hectare (kg DM/ha; recorded on Pasturebase Ireland; Hanrahan et al., Reference Hanrahan, Geoghegan, O'Donovan, Griffith, Ruelle, Wallace and Shalloo2017) and to establish the OFC for each treatment (Table 2). Pasture cover was measured using a quadrat and shears and a visual assessment as described by O'Donovan et al. (Reference O'Donovan, Dillon, Rath and Stakelum2002).
A summary of the six grazing treatments consisting of three opening farm covers (high, medium and low) as a result of three autumn closing dates and two spring rotation lengths (normal and fast)
Summary of the opening farm covers (OFC; kg DM/ha) achieved on the six grazing treatments (high OFC, fast (56 days) spring rotation length (SRL); high OFC, normal SRL (63 days); medium OFC, fast SRL; medium OFC, normal SRL; low OFC, fast SRL; low OFC, normal SRL) on 1 February of years one and two

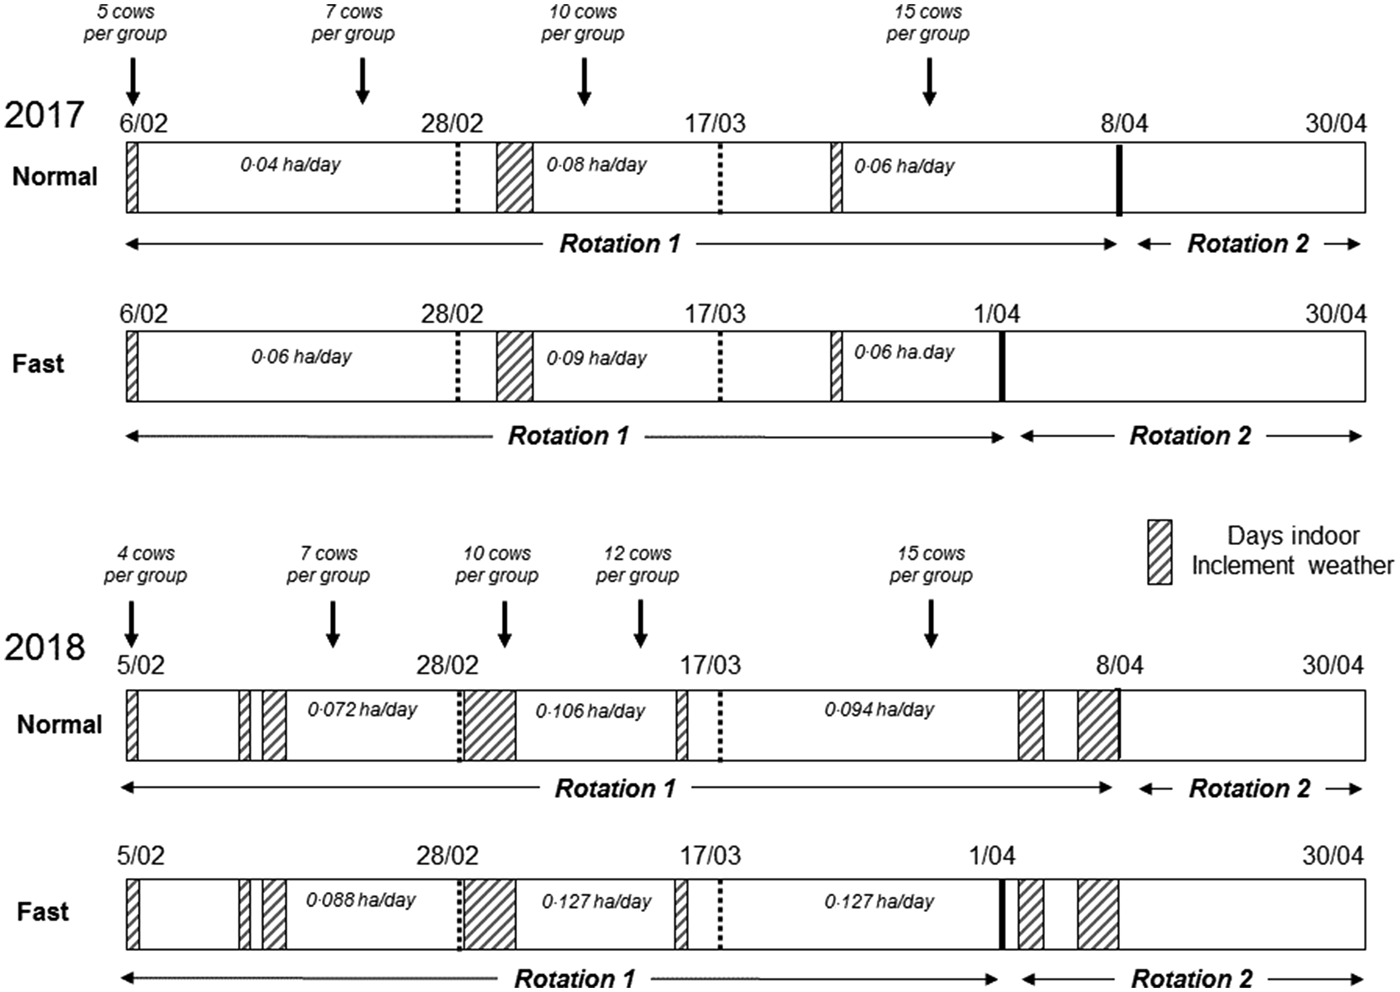
One of the two SRLs (normal – 63 days and fast – 56 days; Table 1) (Teagasc, 2009) was applied to each of the OFC treatments. To apply the two rotation lengths, the SRP was used (Fig. 1), which is a grazing management tool used to allocate a proportion of the available grazing area to cows on a daily basis to ensure that an allocation of grass can be maintained in the diet until the point where growth is equal to demand. The normal SRL consisted of grazing 0.3 of the available area by 28 February, 0.6 by 17 March and completing the first rotation on 8 April. The fast rotation consisted of grazing 0.4 by 28 February, 0.75 by 17 March and completing the first rotation by 1 April.
Experimental design capturing the periods over which the experiment was carried out; including the time points at which the targets had to be met according to the spring rotation planner tool; the area allocated per day; the cow numbers on the experiment within each week and the time points at which the animals had to be housed due to inclement weather for both years of the experiment.

The six grazing treatments were:
(i) High OFC, normal SRL (HcNr),
(ii) High OFC, fast SRL (HcFr)
(iii) Medium OFC, normal SRL (McNr; proposed as Control)
(iv) Medium OFC, fast SRL (McFr),
(v) Low OFC, normal SRL (LcNr),
(vi) Low OFC, fast SRL (LcFr).
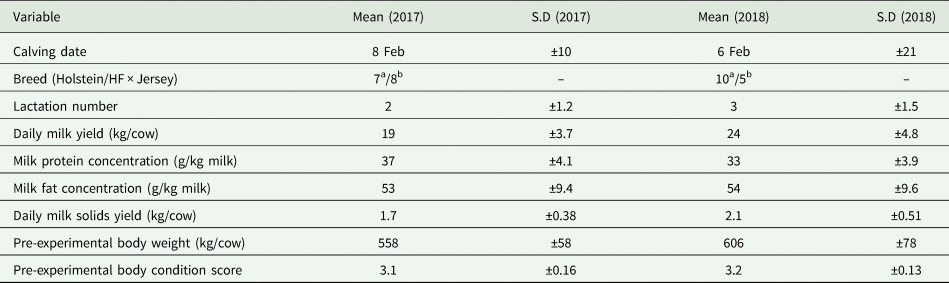
Ninety (24 primiparous and 66 multiparous) spring-calving dairy cows were selected and blocked according to calving date, lactation number, breed [Holstein Friesian (HF), or crossbred (Jersey × HF or Norwegian Red × HF)], pre-experimental milk production variables, pre-experimental body weight (BW) and body condition score (BCS) (Table 3), and randomly assigned to one of the six grazing treatments. All cows were calved for a minimum of 1 week before being assigned to a treatment: during this period they had access to fresh pasture by day (4 kg DM/cow), were allocated 4 kg of concentrate and received ad libitum grass silage by night. According to the herd calving pattern, the stocking rate (Fig. 1) increased gradually from turnout until the end of the first rotation, as would occur at farm level. At the end of the calving season, a total of 15 cows were assigned to each treatment in each year to maintain a common SR on each of the farm-lets (2.9 cows/ha). However, only cows which were on the treatment for at least 3 weeks in the first grazing rotation were used as part of the statistical analysis (n = 10 in year one and n = 12 in year two per treatment).
Initial herd characteristics for the animals used in the experiment in 2017and 2018
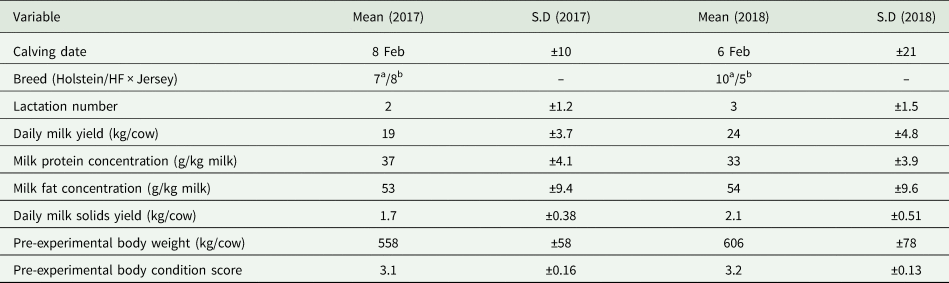
a Holstein.
b Holstein × Jersey.
Animal and grazing management
Cows were assigned and turned out to their respective grazing treatment on 6 February in year one and 5 February in year two. All cows were allocated a daily area in accordance with the normal or fast SRL (Fig. 1). All cows grazed the blocks of paddocks in the same order (each treatment grazed block 1, then 2, then 3, etc.) and they followed the same grazing rotation for the second rotation. Cows received fresh pasture after morning and evening milking. Back fences on previously grazed areas were used to minimize damage to paddocks and cows had access to water at all times. On-off grazing, as described by Kennedy et al. (Reference Kennedy, Curran, Mayes, McEvoy, Murphy and O'Donovan2011), was practised throughout the experimental period as necessitated by heavy rainfall (>10 mm/day) to avoid poaching damage. In severe weather conditions (snowfall or >15 mm/day rainfall) cows were housed and allocated an equal amount of concentrate and grass silage (Fig. 1).
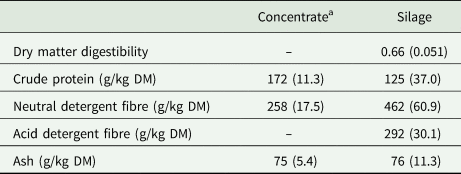
All cows were allocated an equal amount of concentrate per day (average 2.7 kg/cow/day, 221 kg/cow over the experimental period in year one and average 3.7 kg/cow/day, 339 kg/cow, over the experimental period in year two). Concentrate supplementation was determined by the requirement of the control group (McNr) to maintain a minimum post-grazing sward height (PostGSH) of 3.5 cm for the control group which is the recommended target for the PostGSH in the first grazing rotation (McEvoy et al., Reference McEvoy, Kennedy, Murphy, Boland, Delaby and O'Donovan2008; Ganche et al., Reference Ganche, Delaby, O'Donovan, Boland and Kennedy2013b). Concentrate supplementation (Table 4) was increased to a maximum of 5 kg/cow/day and if further supplementation was required on all treatment groups silage supplementation was introduced. Similarly, if the McNr PostGSH increased to 4 cm, concentrate supplementation was reduced. If PostGSH dropped to 3.0 cm or below for an individual treatment group, silage supplementation was introduced to ensure PostGSH was maintained above 3.0 cm as below this was determined to be a more severe restriction on DMI (Ganche et al., Reference Ganche, Delaby, O'Donovan, Boland and Kennedy2013b). When the PostGSH increased to the minimum PostGSH (3.5 cm), the silage supplementation was reduced or removed from the diet for that treatment.
Quality of concentrate and silage (s.d.) offered as supplement during the experimental period
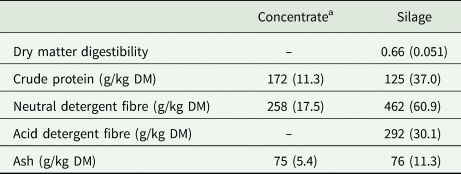
a Concentrate consisted of soybean meal (300 g/kg fresh weight), beet pulp/molasses (155 g/kg), barley (150 g/kg), maize (130 g/kg), maize distillers (120 g/kg), rapeseed meal (75 g/kg), megalac (33 g/kg), maize/beet (25 g/kg), acid buff (7 g/kg) and salt (5 g/kg).
Swards received 80 kg nitrogen (N)/ha during the experimental period, applied in the form of urea (46 g/kg N) (53.6 kg N/ha) in February and March and an application 18-6-12 was applied in mid-April (26.4 kg N/ha, 9.6 kg P/ha and 19.2 kg K/ha). Nitrogen fertilizer was broadcast using an Abbey fertilizer applicator (Abbey Machinery, Nenagh, Co. Tipperary, Ireland).
Following the assessment of OFC for each treatment on 1 February, pasture cover was measured on a weekly basis (as described above) to determine the average farm cover (AFC; O'Donovan et al., Reference O'Donovan, Dillon, Rath and Stakelum2002) per hectare (kg DM/ha). Grass supply for each treatment group was managed independently in the second rotation using the farm cover technique [a measurement of pre-grazing herbage mass was recorded on a per paddock basis, this was then adjusted to a per hectare basis (available herbage (kg DM) × paddock size (ha) = kg DM/ha; O'Donovan, Reference O'Donovan2000)]. In rotation 2, all cows were managed on the same rotation length (24 days) and surpluses and deficits were identified on an individual treatment basis. All data were recorded on Pasturebase Ireland (Hanrahan et al., Reference Hanrahan, Geoghegan, O'Donovan, Griffith, Ruelle, Wallace and Shalloo2017) to determine pasture cover, daily growth, cumulative herbage production and assist in grazing management decisions as described by Wims et al. (Reference Wims, Delaby, Boland and O'Donovan2014).
Sward measurements
Pre- and post-grazing compressed sward height
Pre-grazing sward height (PreGSH) was recorded daily by taking a minimum of 50 measurements in the area due to be grazed across the two diagonals of the area using the rising plate meter (Jenquip Rising Plate Pasture Metres, New Zealand; diameter 355 mm and 3.2 kg/m2). After grazing, PostGSH was determined above ground level following a similar procedure.
Herbage mass
Pre-grazing herbage mass (>3.5 cm) was determined twice weekly by cutting two strips 1.2 m wide and of a known length (approximately 10 m) in the area due to be grazed next with an Etesia mower (Etesia UK Ltd., Warwick, UK). The mown herbage from each strip was collected and weighed. A sample from each strip (c. 300 g fresh weight (FW)) was collected. From this, a further sub-sample of 100 g (FW) was collected and dried for 16 h at 90 °C (Beecher et al., Reference Beecher, Hennessy, Boland, O’ Donovan, Lewis, Michalk, Millar, Badgery and Broadfoot2013) to determine DM content. Compressed sward height was recorded pre- and post-cutting on each cut strip by taking ten measurements per strip using a rising plate meter. The average paddock pre-grazing herbage mass >3.5 cm was then calculated according to the following equation (O'Donovan et al., Reference O'Donovan, Dillon, Rath and Stakelum2002):

Sward density was calculated using the following equation (Tuñon et al., Reference Tuñon, Kennedy, Horan, Hennessy, Lopez-Villalobos, Kemp, Brennan and O'Donovan2014):

The average paddock pre-grazing herbage mass was then corrected to 3.5 cm according to the following equation (Delaby et al., Reference Delaby, Peyraud, Bouttier and Peccate1998):

Daily herbage allowance
Daily herbage allowance was determined as a result of the area imposed by the SRP for both the normal and fast cows and the herbage mass available above 3.5 cm within this area, measured as described above. Daily herbage allowance was calculated using the following equation:

Leaf, stem, dead proportion
Leaf, stem and dead proportion in the grazing horizon (Thomas, Reference Thomas1980) (>3.5 cm) was measured in each paddock prior to each grazing as described by McCarthy et al. (Reference McCarthy, Pierce, Delaby, Brennan, Fleming and Horan2013). Briefly, samples were cut to ground level, and a sub-sample was manually divided into leaf, stem and dead proportions (>3.5 cm) and dried at 90 °C for 16 h to determine the DM proportions of each fraction.
Herbage chemical composition
A selection of herbage, representative of that selected by the cows, was taken weekly from each treatment as described by Ganche et al. (Reference Ganche, Delaby, O'Donovan, Boland, Galvin and Kennedy2013a). Briefly, the sample was taken, noting the PostGSH achieved by the cows the previous day within each treatment. Samples were stored at −18 °C, bowl-chopped, freeze-dried at −50 °C for 120 h and milled before chemical analysis.
The chemical composition of the selected herbage samples was analysed by wet chemistry for DM, organic matter digestibility (OMD), CP, neutral detergent fibre (NDF), acid detergent fibre (ADF) and ash concentrations. The OMD was estimated using the in-vitro neutral detergent cellulase method as described by Morgan et al. (Reference Morgan, Stakelum and Dwyer1989) (FibertecTM Systems; Foss, Ballymount, Dublin, Ireland) and calculated with the equation published by Garry et al. (Reference Garry, O'Donovan, Beecher, Delaby, Fleming, Baumont and Lewis2018). Crude protein concentration was determined using an N analyser (Leco FP-428; Leco Australia Pty Ltd, Baulkham Hills B.C. NSW, Australia) based on the AOAC method 990-03 (AOAC, 1990). The NDF and ADF concentrations were determined using a fibre analyser (AOAC, 1995, method 973.18; Ankom Technology, Macedon, NY, USA) based on the method described by Van Soest et al. (Reference Van Soest, Robertson and Lewis1991). Amylase and a sodium sulphate solution were used in the NDF concentration determination process. Ash concentration was estimated by burning a sub-sample in a muffle furnace at 500 °C for 12 h (AOAC, 1995; method 942.05). A 250 g sample of silage offered to the cows was also sampled for DM and scanned via NIRS (Table 4) to predict dry matter digestibility (DMD), NDF, ADF and CP.
Animal measurements
Dry matter intake estimation
Individual grass DMI (GDMI) and total DMI (TDMI) were estimated on two occasions throughout the experimental period (March (13–22 in year one and 5–16 in year two) and April (3–14 in year one and 16–27 in year two)). Dry matter intake estimations were carried out using the n-alkane technique (Mayes et al., Reference Mayes, Lamb and Colgrove1986) as modified by Dillon and Stakelum (Reference Dillon and Stakelum1989). Cows were dosed twice daily with an alkane bolus (C32, indigestible marker) for 12 days and individual faecal samples were collected twice daily (prior to morning and evening milking) from day 7 to 12, while two forage samples per grazing treatment were also collected daily from day 6 to 11, taking note of the previous PostGSH of the animals. Four kg FW of concentrate was fed in measurement period one in year one and 5 kg FW was fed in measurement period one of year two. One kg FW of concentrate was fed during measurement period two in both years.
Milk production
Cows were milked twice daily at 07.00 and 15.30 h, with an average of 3 h/day spent off the paddocks in the collecting yard and the milking parlour. Individual daily milk yields (kg) were recorded at each milking (Dairymaster, Causeway, Co. Kerry, Ireland). Milk protein, fat and lactose concentrations were determined from one successive evening and morning milking weekly using mid-infrared spectroscopy analysis (Milkoscan 203, Foss Electric DK-3400, Hillerød, Denmark).
Body weight and body condition score
Body weight and BCS were recorded weekly throughout the experimental period. All cows were weighed using an electronic portable weighing scale and Winweigh software package (Tru-test Limited, Auckland, New Zealand). Body condition score was scored by an experienced independent observer using a 1–5 scale (where 1 = emaciated and 5 = extremely fat) with 0.25 increments (Edmonson et al., Reference Edmonson, Lean, Weaver, Farver and Webster1989).
Statistical analysis
All statistical analyses were carried out in SAS Version 9.4 (SAS Institute Inc., Cary, NC, USA, 2002). The analysis was carried out separately for rotation one and the carryover effect in rotation two. Pre-grazing herbage mass, PreGSH, PostGSH and DHA were analysed using PROC MIXED in SAS with the effect of OFC, SRL, year, week, paddock and rotation being used in the model. Paddock was the experimental unit, with paddock introduced as the random factor and week was the repeated measure. Data are presented as least square means ± standard error. These variables were analysed using the following model:

where μ = mean: F i = OFC (i = 1–3); S j = SRL (j = 1–2); Y k = year (k = 1 or 2); W n = week of experiment (n = 1 to 8/9 in rotation 1 and 1 to 3/4 in rotation 2); F i × S j = interaction between OFC and SRL; Y k × F i = interaction between year and OFC; Y k × S j = interaction between year and SRL; Y k × F i × S j = interaction between year, OFC and SRL; and e ijkn = the residual error term.
Average daily milk yield, milk fat and protein concentration and daily milk solids yield were analysed in PROC MIXED in SAS. The change in BW and BCS from the date an animal entered the experiment until the end of the first rotation and the change from the end of the first rotation to the end of the second rotation was also analysed. The model contained terms associated with production including breed, parity, treatment (OFC and SRL) and days in milk (DIM). The model also contained terms for week and year; and week was used as a repeated measure. Non-significant interactions were removed from the model. The individual cow was the experimental unit. Pre-experimental milk production and pre-experimental BCS and bodyweight were used as the co-variates in the model for the variable being analysed. These variables were analysed using the following model:

where Y hijklmn is the response of animal l of breed h, in parity i, in OFC j and SRL k in year m; μ = mean; B h = breed (h = 1 or 2); P i = parity (i = 1 or 2); F j = OFC (j = 1–3); S k = SRL (k = 1–2); Y m = year (m = 1 or 2); W n = week of experiment (n = 1 to 8/9 in rotation 1 and 1 to 3/4 in rotation 2); F j × S k = interaction between OFC and SRL; Y m × F j = interaction between year and OFC; Y m × S k = interaction between year and SRL; Y m × F j × S k = interaction between year, OFC and SRL; b1Xhijklmn = respective pre-experimental milk output or BW or BCS variable; b2DIMhijklmn = DIM; and e hijklmn = the residual error term.
Herbage DMI estimations were analysed using PROC MIXED in SAS. Treatment (OFC and SRL), measurement period, year and the associated interactions were included in the model. Individual cow was the experimental unit and measurement period (March and April) was the repeated measure.
Results
Data are presented as six individual treatments, however, where there was no three-way interaction present or two-way interaction present between treatments (OFC × SRL) or treatment and year (OFC × year and SRL × year), only main effects are reported. The results are also presented as the effects of rotation one and rotation two. Rotation two was considered the carryover period of the treatment applied in the first rotation.
Meteorological data
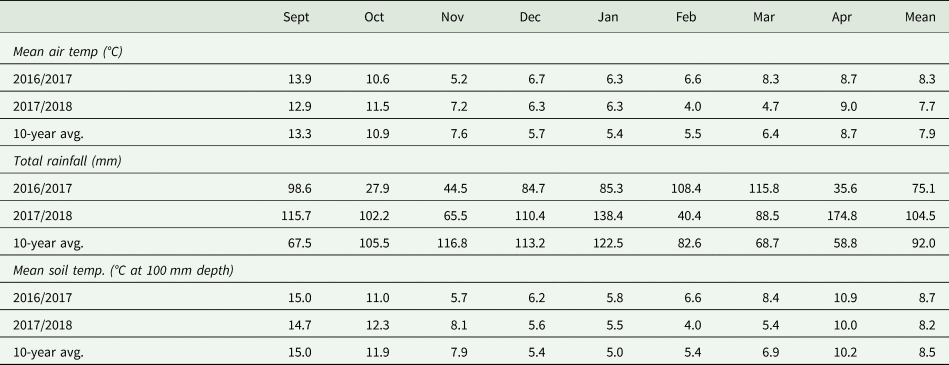
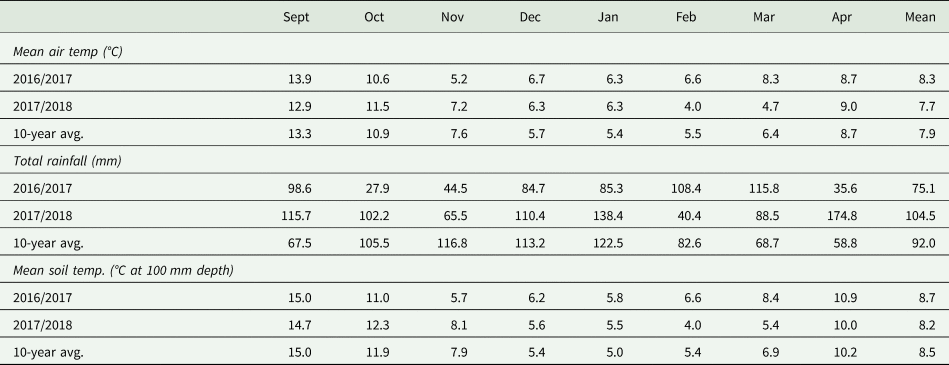
Meteorological data for the experimental period (September to April, 2016/2017 and 2017/2018) are presented in Table 5. The milder winter in year one resulted in increased levels of herbage on farm at turnout (OFC), while the colder weather had a severe impact on grass growth in the early spring of year two.
Meteorological data from September 2016 to April 2017 and September 2017 to April 2018 in contrast to the previous 10-year average (January 2006 to April 2016) measured at the experimental site
Herbage variables
The OFC achieved under the autumn closing dates are presented in Table 2. The high OFC did not vary from year 1 to year 2. However, there was a large variation in OFC between year 1 and year 2 on the medium and low OFC treatments, reducing by 140 and 210 kg DM/ha, respectively, in year 2.
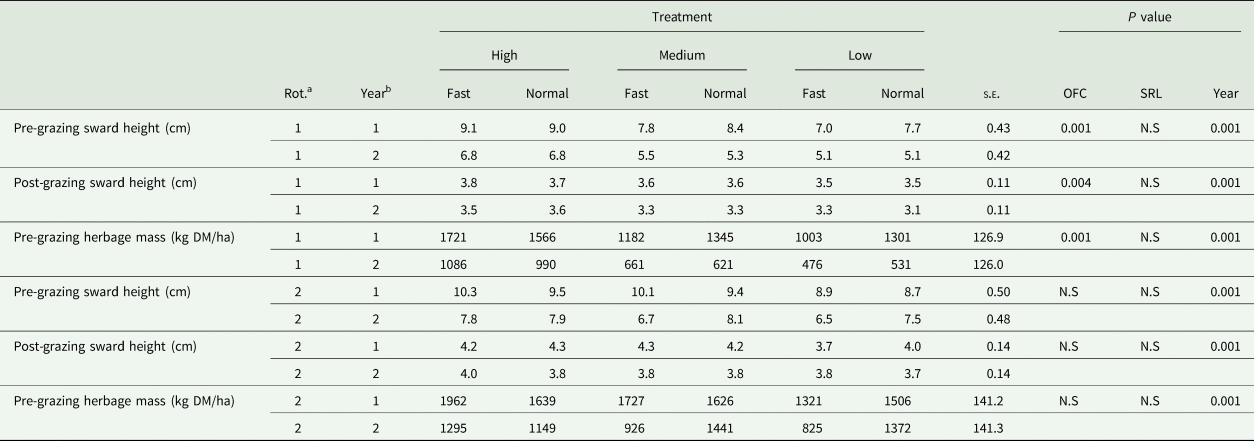
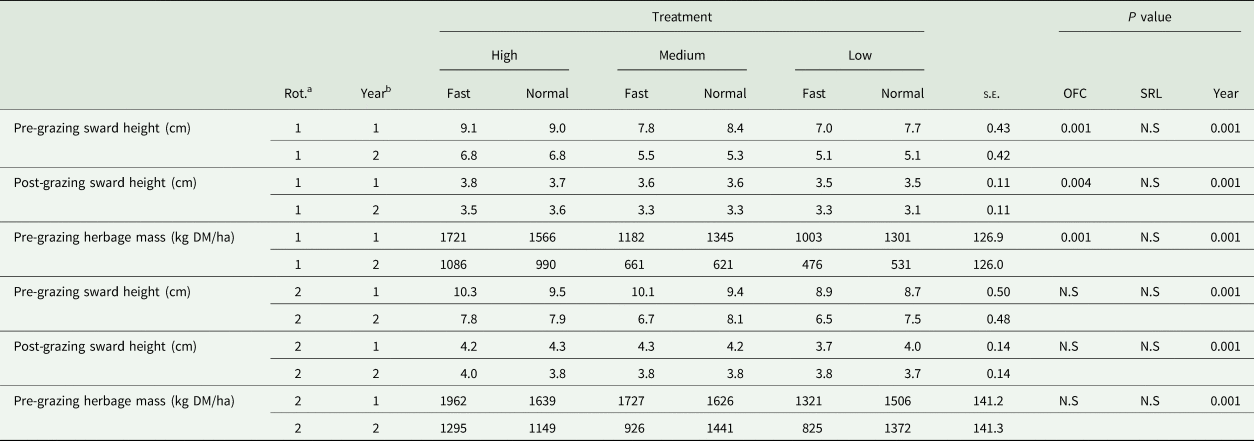
There was a significant effect of year on all of the herbage variables analysed (P < 0.001; Tables 6 and 7) as all herbage variables were lower in year two compared to year one across both rotation one and two.
The effect of opening farm cover (high, medium and low), spring rotation length (normal or fast) and year on pre- and post-grazing sward height and pre-grazing herbage mass in rotations one and two
a Rot. = rotation one or two.
b Year 1 = 2017 and Year 2 = 2018.
OFC, opening farm cover; SRL, spring rotation length; N.S, non-significant (P ⩾ 0.05).
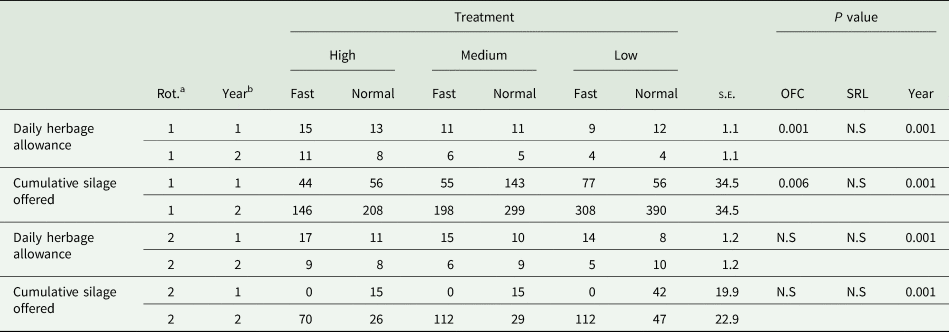
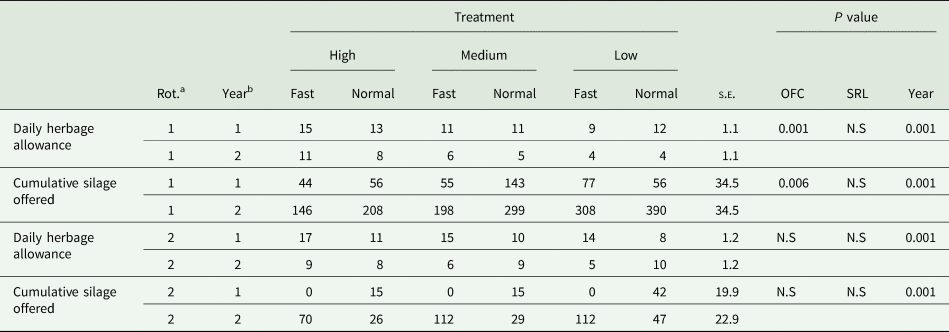
The effect of opening farm cover (high, medium and low), spring rotation length (normal or fast) and year on herbage allowance and silage offered (kg DM/cow) in rotations one and two
a Rot. = rotation one or two.
b Year 1 = 2017 and Year 2 = 2018.
OFC, opening farm cover; SRL, spring rotation length; N.S, non-significant (P ⩾ 0.05).
In rotation one (Table 6), the high OFC had a greater PreGSH (P < 0.001; + 1.4 cm) compared to the medium and low OFC treatments. The high OFC resulted in a greater PostGSH (P = 0.004; +0.3) compared to both the medium and low OFC treatments. There was a higher pre-grazing herbage mass on the high OFC (P < 0.001; +451 kg DM/ha) compared to both the medium and low OFC in both years. The cows on the high OFC treatment had a significantly higher DHA (Table 7; P < 0.001; +4.1 kg DM/cow/day) compared to the cows on the medium and low OFC treatments, which were similar. There was an interaction between year and OFC (P < 0.001) for grass silage offered per day. All treatments in year one had a similar cumulative allocation of grass silage, while in year two, the high and medium OFC were allocated less silage (−136 kg DM) compared to the low OFC. In rotation one, there was no effect of SRL on any of the aforementioned variables in year 1 as in year 2.
The effect of OFC on PreGSH, PostGSH, pre-grazing herbage mass, DHA and silage in rotation one was not present in rotation two in either year. There was, however, an interaction (P < 0.001) present between year and SRL for PreGSH. Both the fast and normal SRL had similar PreGSH in year one; however, in year two, the fast SRL had a lower PreGSH compared to the normal SRL (−0.8 ± 0.30 cm). Consequently, there was also a significant interaction (P < 0.001) between year and SRL on pre-grazing herbage mass as the fast and normal in year one had similar pre-grazing herbage mass but the fast SRL was lower (−319 kg DM/ha) compared to the normal SRL in year two. There was a significant interaction between SRL and year (P < 0.001) for DHA, both the normal and fast treatments were similar in year one, in year two, the fast SRL was lower (−3.5 kg DM/cow) compared to normal SRL. There was an interaction present between year and SRL (P < 0.001) for silage offered. In both years, the normal SRL received similar amounts of silage, while the fast SRL received more silage in year two (+98 kg silage DM/cow/day) compared to year one.
Leaf, stem and dead proportion
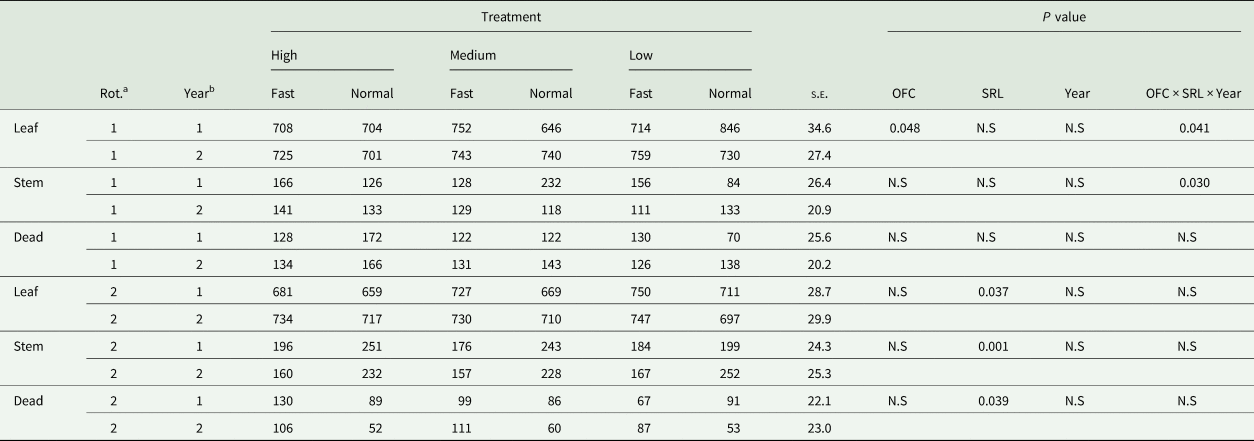
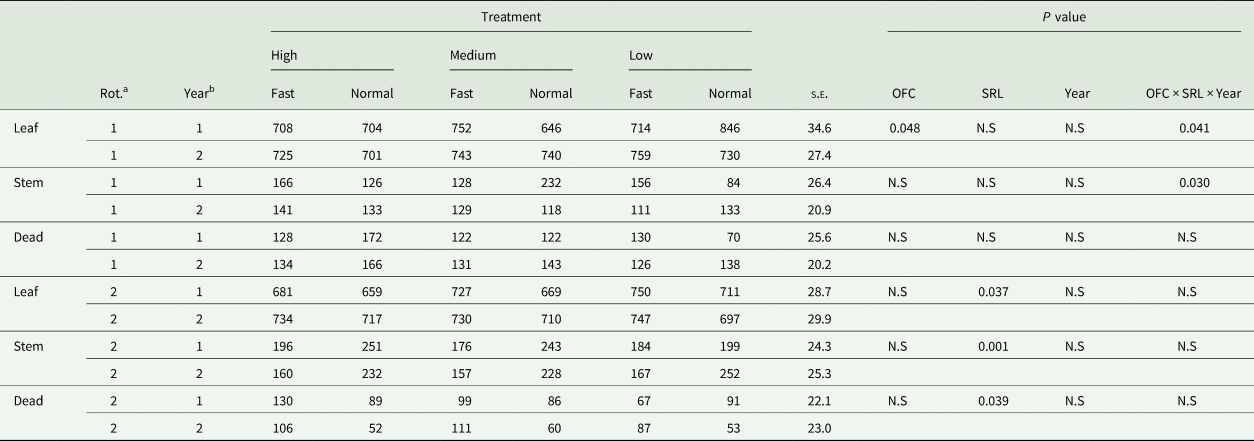
Year did not have an effect on leaf, stem or dead proportion of the sward in rotation one. In rotation one (Table 8), there was a significant interaction between year, OFC and SRL on leaf (P = 0.041) and stem (P = 0.030) proportion. The McNr treatment in year one had lower leaf proportion (−20 g/kg DM) compared to the LcNr, while the remaining treatments were intermediate to both. The McNr in year one had greater stem proportion (+128 g/kg DM) compared to the LcNr in year one and the McNr and LcFr in year two, while the remaining treatments were intermediate to both. There was no effect of OFC or SRL on the dead proportion of the sward.
The effect of opening farm cover (high, medium and low), spring rotation length (normal or fast) and year on leaf, stem and dead proportion (g/kg DM) in rotations one and two
a Rot. = rotation one or two.
b Year 1 = 2017 and Year 2 = 2018.
OFC, opening farm cover; SRL, spring rotation length; N.S, non-significant (P ⩾ 0.05).
In rotation two (Table 8), there was no effect of OFC on leaf, stem or dead proportion of the sward. There was a carryover effect from rotation 1 for SRL on leaf (P = 0.037) and stem (P < 0.001) proportions. The fast SRL had a higher leaf proportion (+35 g/kg DM) compared to the normal SRL, the fast SRL also had a lower stem proportion (−60 g/kg DM) compared to the normal SRL. Spring rotation length also had an effect on the dead proportion of the sward (P = 0.037), the fast SRL had a greater proportion of dead (+27 g/kg DM) material compared to the normal SRL. Year did not have an effect on the leaf, stem and dead proportion of the sward in rotation 2.
Sward composition
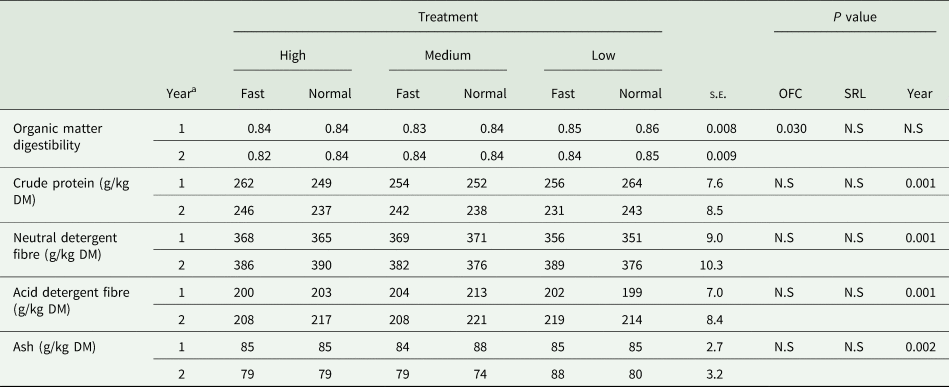
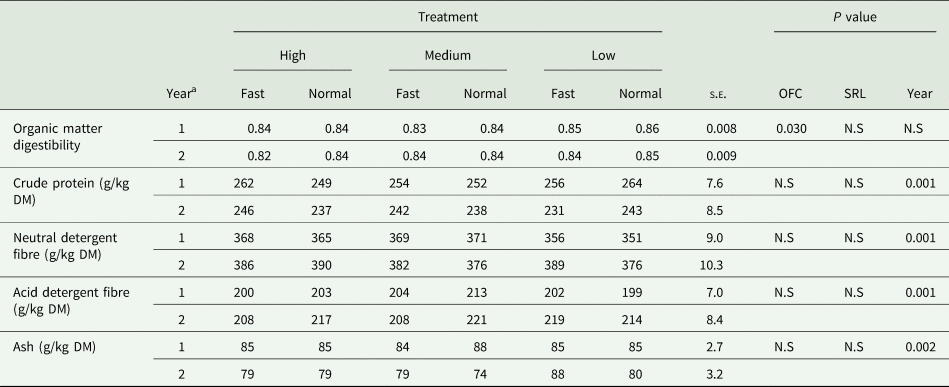
In rotation one (Table 9), there was a year effect on CP (P < 0.001) and ash (P < 0.01) which were both greater in year one (+16 and +6 g/kg DM, respectively). There was also a year effect on NDF and ADF (P < 0.001) which were both greater in year two (+20 and +11 g/kg DM, respectively). The low OFC treatment had a higher OMD value (P = 0.03; +0.014) compared to both the high and medium OFC, which were similar in both years. There was no effect of SRL on the OMD concentrations of the sward. Opening farm cover and SRL had no effect on the CP, NDF, ADF and ash concentration of the herbage (248 ± 8.1, 373 ± 9.7, 209 ± 7.7 and 83 ± 3.0 g/kg DM, respectively).
The effect opening farm cover (high, medium and low), spring rotation length (normal or fast) and year on sward composition in rotation one
a Year 1 = 2017 and Year 2 = 2018.
OFC, opening farm cover; SRL, spring rotation length; N.S, non-significant (P ⩾ 0.05).
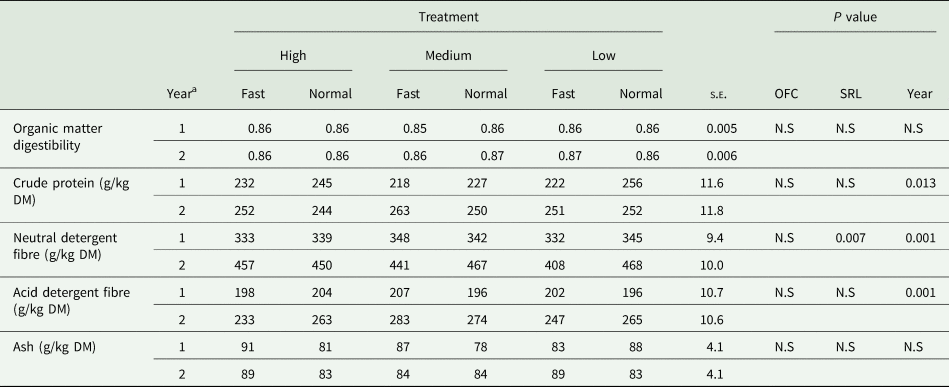
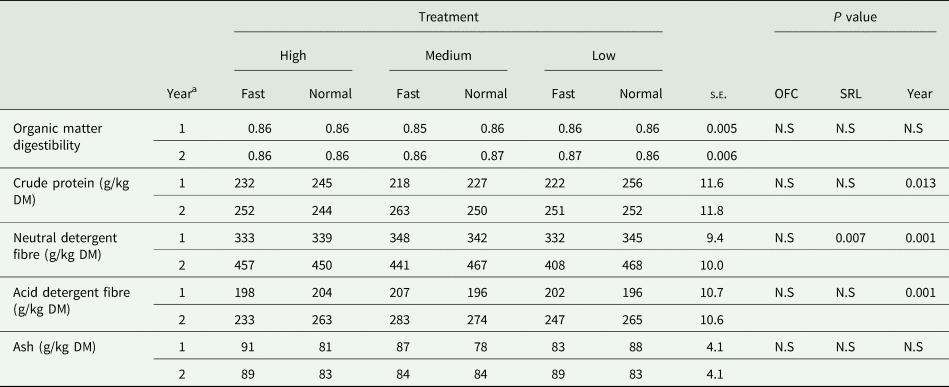
In rotation two (Table 10), year had an effect on CP (P < 0.05), ADF and NDF (P < 0.001) which were all greater in year two. Opening farm cover had no effect on OMD, CP, NDF, ADF and ash. Spring rotation length had an effect on NDF and ash concentrations; all other quality parameters were similar. The NDF concentration was lower (P = 0.021; −16 g/kg DM) on the fast SRL compared to the normal SRL in rotation 2. Spring rotation length also had an effect on the ash concentration of the herbage (P = 0.046) with the fast SRL having greater ash content (+4.4 g/kg DM) compared to the normal SRL.
The effect opening farm cover (high, medium and low), spring rotation length (normal or fast) and year on sward composition in rotation two
a Year 1 = 2017 and Year 2 = 2018.
OFC, opening farm cover; SRL, spring rotation length; N.S, non-significant (P ⩾ 0.05).
Animal production
Dry matter intake
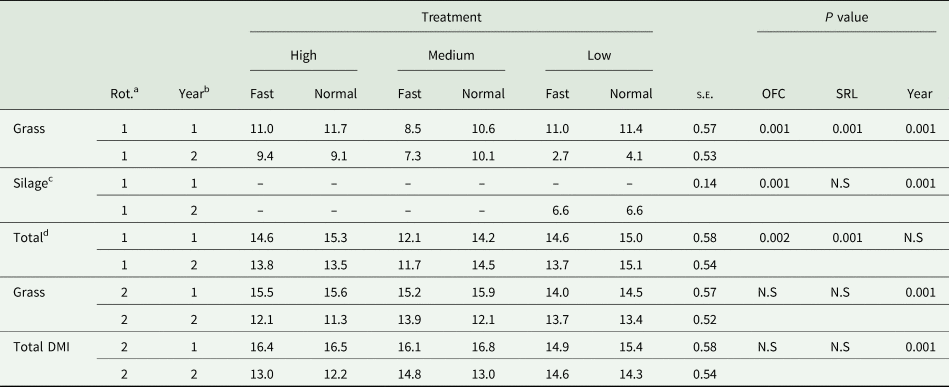
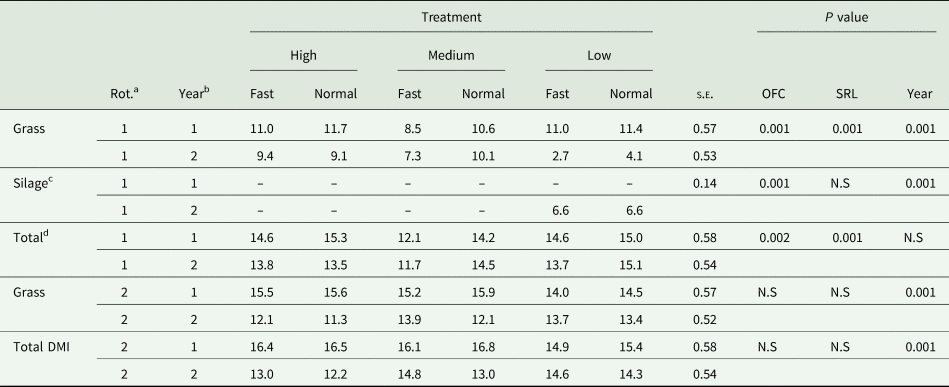
In measurement period one (rotation one, Table 11), there was a significant interaction between OFC and year (P < 0.001) on GDMI. The high and low OFC in year one had a greater GDMI (+1.8 kg DM/cow/day) compared to the medium OFC in year one. In year two, the high and medium OFC had greater GDMI (+5.6 kg DM/cow/day) compared to the low OFC. There was an interaction between year and OFC (P < 0.001) present, in year two the low OFC had a silage DMI of 6.6 kg DM/cow/day, there was no silage offered to the remaining treatments in years one and two during measurement periods one and two. The high and low OFC had a greater TDMI (P = 0.002; +1.4 kg DM/cow/day) in measurement period one compared to the medium OFC in both years. Spring rotation length also had an effect on TDMI as the normal SRL had a greater TDMI (P < 0.001; +1.2 kg DM/cow/day) compared to the fast SRL in rotation one.
The effect of opening farm cover (high, medium and low), spring rotation length (normal or fast) and year on mean dry matter intake (DMI; kg DM/cow) in rotations one and two
a Rot. = rotation one or two.
b Year 1 = 2017 and Year 2 = 2018.
c Silage was only offered to low OFC treatment in measurement period one of year two.
d Total DMI = grass DMI + concentrate fed + silage DMI.
OFC, opening farm cover; SRL, spring rotation length; N.S, non-significant (P ⩾ 0.05).
In measurement period two (rotation two), there was an interaction (P < 0.001) between OFC and year on GDMI and TDMI. The high and medium OFC had a greater GDMI and TDMI (+1.3 kg DM/cow/day) in year one compared to the low OFC. In year two, the high OFC had a lower GDMI and TDMI (−1.6 kg DM/cow/day) compared to both the low and the medium OFC in year two, which were similar. There was also an interaction present between year and SRL on GDMI (P = 0.024), the fast and normal SRL were similar in year one, while the fast SRL had a greater GDMI (+0.9 kg DM/cow/day) in year two compared to the normal SRL.
Milk production, bodyweight and body condition score
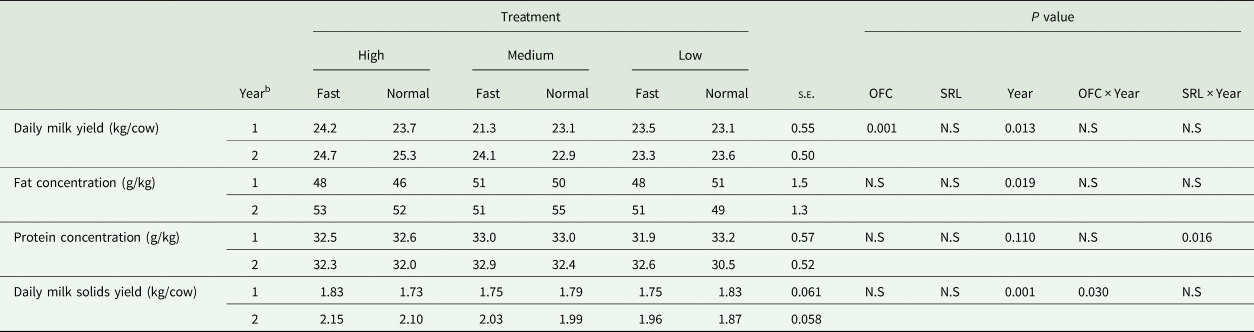
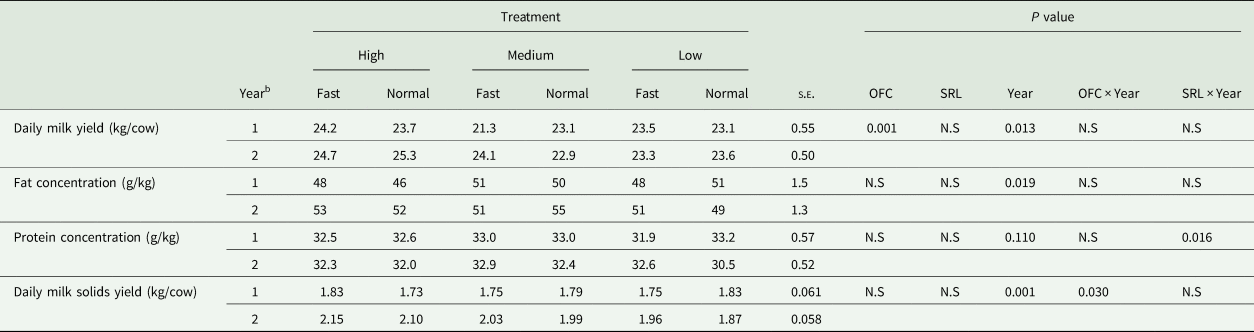
In rotation one (Table 12), OFC had an effect on average daily milk yield (P < 0.001) as the high OFC produced a greater milk yield (+1.4 kg milk/cow/day) compared to the medium and low OFC. There was no effect of SRL on daily milk yield. There was no effect of OFC or SRL on milk fat concentration. There was an interaction present (P = 0.016) between SRL and year on milk protein concentration. The fast and normal SRL had a similar milk protein concentration in year one, while the fast SRL tended (P = 0.091) to have a greater milk protein concentration (+1.0 g/kg milk) compared to the normal SRL in year two. There was an interaction present between OFC and year (P = 0.030) for daily milk solids yield, as all OFC treatments were similar in year one; in year two, the high OFC had greater milk solids yield (+0.21 kg milk solids/day) compared to the low OFC, while the medium OFC was intermediate to both. There was an effect of OFC on BW (P = 0.017) change as both the high and medium OFC had a greater increase in BW (+21 kg/cow) over the first rotation compared to the low OFC (+7 ± 4.4 kg/cow; data not presented). Spring rotation length had no effect on BW change in the first rotation. There was no effect of OFC or SRL on BCS change (+0.13 ± 0.028/cow; data not presented).
The effect of opening farm cover (high, medium and low), spring rotation length (normal or fast) and year on average daily milk production and composition for spring calving dairy cows during rotation onea
a Fast – turnout to 1 April, Normal – turnout to 8 April.
b Year 1 = 2017 and Year 2 = 2018.
OFC, opening farm cover; SRL, spring rotation length; N.S, non-significant (P ⩾ 0.05).
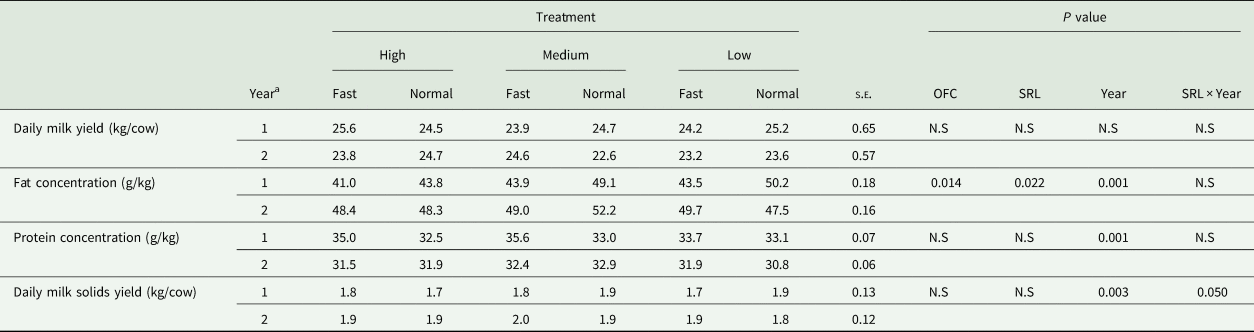
Opening farm cover did not have a carryover effect in rotation two (Table 13), on average daily milk yield. There was a carryover effect of OFC on milk fat concentration, the medium OFC had a greater milk fat concentration (P = 0.014; +3.1 g/kg milk) compared to the high OFC, with the low OFC intermediate to both. The normal SRL also had a higher milk fat concentration (P = 0.022; +2.1 g/kg milk) compared to the fast SRL. There was no effect of OFC on milk protein concentration; however, there was a tendency (P = 0.054) for SRL to have a carryover effect on milk protein concentration, the fast SRL had a slightly higher milk protein (+0.8 g/kg milk) compared to the normal SRL. There was an interaction present (P = 0.050) between year and SRL on daily milk solids in rotation two, the fast SRL had a greater milk solids yield (+0.21 kg/cow/day) in year two compared to year one, compared to the normal which was similar in year one and year two, and was intermediate to the fast SRL in both years. There was an effect of OFC (P = 0.016) on BW change in the second rotation as the high OFC had a greater increase (+8 ± 2.4 kg/cow; data not presented) compared to medium and low OFC (no change). There was no carryover effect of OFC or SRL on BCS change (+0.01 ± 0.025/cow; data not presented).
The effect of opening farm cover (high, medium and low), spring rotation length (normal or fast) and year on average daily milk production and composition for spring calving dairy cows during rotation two
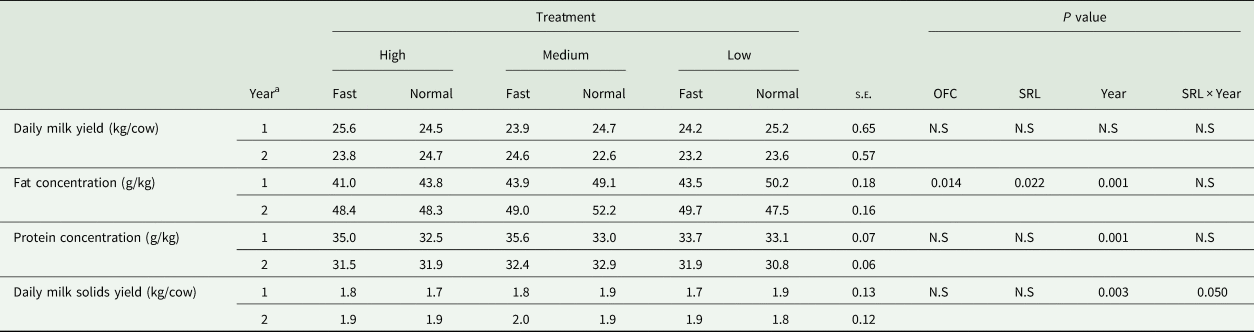
a Year 1 = 2017 and Year 2 = 2018.
OFC, opening farm cover; SRL, spring rotation length; N.S, non-significant (P ⩾ 0.05).
Discussion
The present experiment investigated the immediate effects of spring grass availability (high, medium and low OFC) and SRL (fast – 56 days and normal – 63 days) on animal production in early lactation of spring calving dairy cows and herbage variables. The current study demonstrates that despite a decrease in quality on early closed swards, there is an increase in milk production as a direct result of increased grass availability on-farm which can sustain a greater DHA in early lactation.
Meteorological influences had a strong effect on herbage production in the current study. Average soil temperature was on average 19% greater from December to March of year one when compared with the previous 10-year average. In year two, mean soil temperatures for February and March were 24% below the previous 10-year average. In year one, rainfall levels were 47% lower than the 10-year average for the period from October to January; however, rainfall levels for February and March of the same year were 48% greater than the 10-year average. In year two, rainfall levels for February and March were 15% below the 10-year average; however, in April of year two, rainfall levels were three times greater than the previous 10-year average and 80% greater than the same period in year 1. Increased levels of rainfall can result in challenging conditions for grazing and can impair animal DMI at grass (Cabrera Estrada et al., Reference Cabrera Estrada, Delagarde, Faverdin and Peyraud2004; due to lower internal DM of the grass).
Opening farm cover averaged 1036 kg DM/ha on the high OFC, 748 kg DM/ha on the medium OFC and 544 kg DM/ha on the low OFC across both years. However, the variation in OFC between year one and year two captures the extent of the challenges facing pasture-based dairy farmers in achieving a similar level of herbage on farm and in turn make feed budgeting and managing supplementary feeding in spring challenging. In the current study, a high OFC had a positive effect on daily milk production, compared to the medium OFC; and milk and milk solids production compared to the low OFC in the first rotation, as a result of an increase in DHA, similar to Kennedy et al. (Reference Kennedy, O'Donovan, O'Mara, Murphy and Delaby2007) and McEvoy et al. (Reference McEvoy, Kennedy, Murphy, Boland, Delaby and O'Donovan2008). For each 1 kg increase in DHA, there was an increase in daily milk yield of 0.35 kg/cow per day, despite the fact that silage supplementation made up for the shortfall in GDMI on the medium and low OFC resulting in similar TDMI in the current study. In contrast to the current study, Roche et al. (Reference Roche, Dillon, Crosse and Rath1996) found no difference in milk production between high and low herbage availability treatments in spring, when animals with low herbage availability were supplemented with silage to achieve similar TDMI. The difference observed in silage supplementation may have contributed to the lower milk production observed from the animals on the medium and low OFC treatments, as this led to a total reduction in energy intake in the current study. The high OFC treatment had an intake of 16.4 UFL/cow/day compared to 14.7 UFL/cow/day on the medium and low OFC during the first rotation, as the nutritive value of the silage was not comparable to that of the herbage on offer (0.73 and 1.00 UFL, respectively). Previous studies have reported no reduction in milk output as a result of offering grass silage to lactating dairy cows (Ferris et al., Reference Ferris, Gordon, Patterson, Kilpatrick, Mayne and McCoy2001; Kennedy et al., Reference Kennedy, O'Donovan, Murphy, Delaby and O'Mara2005) because overall energy intake requirements were compensated for by high levels of concentrate supplementation. However, this can signifcantly affect the costs of production and negatively impact on profitability (Shalloo et al., Reference Shalloo, Dillon, O'Loughlin, Rath and Wallace2004; Hanrahan et al., Reference Hanrahan, McHugh, Hennessy, Moran, Kearney, Wallace and Shalloo2018). Hanrahan et al. (Reference Hanrahan, McHugh, Hennessy, Moran, Kearney, Wallace and Shalloo2018) reports that a 10% increase in purchsed feed on farm reduces net profit by €97/ha.
Despite the difference observed in the current study, there was no carryover effect of the first rotation on second rotation milk and milk solids production similar to the aforementioned studies (Roche et al., Reference Roche, Dillon, Crosse and Rath1996; Kennedy et al., Reference Kennedy, O'Donovan, O'Mara, Murphy and Delaby2007; McEvoy et al., Reference McEvoy, Kennedy, Murphy, Boland, Delaby and O'Donovan2008) as DHA was not significantly different in the second grazing rotation between the three OFC treatments. The lower milk fat concentration observed in year one compared to year two (−3.8 g/kg milk) may be correlated to the lower PostGSH achieved in year two (3.3 cm; −0.3 cm compared to year one), as the stem proportion of the herbage consumed increases as PostGSH decreases and this can be linked to the increased NDF and ADF concentrations observed in the sward in year two also. In a meta-analysis of studies observing the relationship of fibre and milk fat, Zebeli et al. (Reference Zebeli, Tafaj, Steingass, Metzler and Drochner2006) reported a linear relationship between milk fat concentration and forage NDF. The greater proportion of silage offered in the diet in year two may have also contributed to the overall increased levels of NDF in the diet and elevation of milk fat, as observed in the study of Kennedy et al. (Reference Kennedy, O'Donovan, Murphy, Delaby and O'Mara2005) and Phillips and Leaver (Reference Phillips and Leaver1985). There was an increased NDF concentration observed in the swards from the normal SRL in the second grazing rotation, which could have attributed to the increased fat concentration observed on the normal SRL in the carryover period (rotation two; Zebeli et al., Reference Zebeli, Dijkstra, Tafaj, Steingass, Ametaj and Drochner2008).
Lewis et al. (Reference Lewis, O'Donovan, Kennedy, O'Neill and Shalloo2011) previously reported that the average herd DMI requirement (animals of similar breed, genetics and grazing management; similar to the current study) at grass in early lactation, for a similar period (first 8 weeks of lactation), was 13.4 kg DM/ha. This demonstrates that even with a high OFC, there may be a requirement for supplementation in early lactation to meet the energy demands of the cow (DHA 12.7 kg on high OFC over first rotation). There is also a much greater requirement for supplementation if high levels of herbage (>1000 kg DM/ha AFC) are not present in early spring (0.39 of diet made up of concentrate and silage supplementation on the medium and low OFC). The hypothesis put forward in the current study that a fast SRL will result in an increase in DHA in the first grazing rotation compared to the normal SRL can be rejected, as they had a similar DHA (10 kg DM/cow/day) and herbage availability on farm was the main driver of differences in DHA. However, the consequence of a fast rotation in spring on herbage availability became prominent in the second rotation as the DHA of the McFr and LcFr was greatly reduced compared to their normal SRL counterparts. This was directly related to the lower pre-grazing herbage mass available on these treatments. However, on the high OFC, the alternative was observed in the second rotation as both the HcNr and HcFr treatments had a similar pre-grazing herbage mass and DHA. Grant et al. (Reference Grant, Barthram and Torvell1981) reported that as PostGSH decreased, the concentration of water-soluble carbohydrates in the plant stubble was greatly reduced and in turn resulted in a reduction in regrowth. The observed differences in PostGSH between the high OFC (3.7 cm) compared to the medium and low OFC (3.4 cm) may have allowed for a greater regrowth potential on the high OFC swards and contributed to the variation in pre-grazing herbage mass observed in the second rotation of the current study. However, the PostGSH achieved on the high OFC was still within the recommendations for spring grazing management as outlined by Ganche et al. (Reference Ganche, Delaby, O'Donovan, Boland and Kennedy2013b). The lower PostGSH coupled with the shorter regrowth interval (−7 days) on the fast SRL may have contributed to the lower pre-grazing herbage mass observed on the McFr and LcFr treatments. Similar observations have been made during mid-season grazing management (Parsons and Penning, Reference Parsons and Penning1988; Wims et al., Reference Wims, Delaby, Boland and O'Donovan2014) with a reduction in pre-grazing herbage mass as a result of a short grazing interval.
As a result of the high OFC, the proportion of green leaf in the sward was reduced by 53 g/kg DM compared to the low OFC (709 and 762 g/kg DM, respectively). This was a result of the longer over winter closed period (112, 97 and 82 days from the mean closing date to turnout on the high, medium and low OFC, respectively) on the high OFC from final autumn grazing to turnout. The reduction in OMD concentration on the high OFC could be as a result of the reduction in the green leaf proportion as numerous studies have reported a reduction in sward quality in spring (reduction in DMD and CP) as a result of earlier closing of swards in autumn (Wales et al., Reference Wales, Doyle, Stockdale and Dellow1999; Hennessy et al., Reference Hennessy, O'Donovan, French and Laidlaw2006; Lawrence et al., Reference Lawrence, O'Donovan, Boland and Kennedy2017). Much of the previous literature has been reported on plot studies (Hennessy et al., Reference Hennessy, O'Donovan, French and Laidlaw2006; Lawrence et al., Reference Lawrence, O'Donovan, Boland and Kennedy2017) and as a consequence did not describe how this can influence animal performance. In the current study, the difference in sward quality did not have an effect on milk production which may be linked to the overall quality of the diet, resulting from the variation in DHA and requirement for silage supplementation, as discussed above.
Conclusion
The findings of the current study demonstrate that a high OFC is required in spring to have sufficient grass on farm to allocate a DHA close to meeting the animal's requirements solely from grass and results in an increased level of milk production in early lactation and reduced supplementation requirement. The variation between years however demonstrates that SRL must be flexible, and depends on grass availability at turnout and climatic conditions in early spring, as accelerating the first rotation can impair grass availability in the second rotation if regrowth capacity is impaired by the prevailing climatic conditions, highlighting the importance of routine measuring of herbage production in early spring. The findings of this study confirm that despite the negative impacts of increased levels of herbage mass on sward quality and levels of senescent material in the canopy, these may be outweighed by the overall impact of the increased herbage availability for grazing on animal performance in early lactation. However, further research is required to determine if the benefits of a high OFC in early lactation can persist throughout lactation as they did not persist beyond the first rotation in the current study and if a faster rotation (<56 days) combined with a high OFC could sustain the increased animal performance observed in the current study over a full lactation.
Acknowledgements
The authors wish to thank J.P. Murphy, A. McGrath and M. Liddane for their technical assistance and all the staff of Moorepark research farm for their care and management of the animals and assistance with measurements during the experiment.
Financial support
This experiment was funded by Irish Dairy Levy Funding administered by Dairy Research Ireland and the Teagasc Walsh Fellowship programme.
Conflicts of interest
None.
Ethical standards
All experimental procedures involving cows were approved by the Teagasc Animal Ethics Committee and were in accordance with the project authorization (AE19132/P059) received from the Health Products Regulatory Board (HPRA), which is the competent authority in Ireland responsible for the implementation of European Union legislation (Directive 2010/63/EU) for the protection of animals used for scientific purposes.