Implications
In grassland-based dairy production systems, which work on a moderate input level, a significant reduction of concentrate use is possible over a long time without any negative effects on animal health, fertility or average herd age. Concentrate reductions cause losses in milk yields, which are on average as high as 1.25 kg milk/kg concentrate, which may be economically acceptable, depending on the actual prices for milk, cereals and oilseeds.
Introduction
Dairy cow lactation performance has grown over the last decades, increasing 3.8 times since 1950 in the United States (Knaus, Reference Knaus2009). To reach such high-performance levels, concentrate amounts of >40% dry matter in feeding rations are essential (Knaus, Reference Knaus2009). However, if compared with direct human consumption or with the use in diets for monogastrics, the conversion efficiency of cereals, oilseeds and soya beans used as ruminant feedstuff is disadvantageous (Wilkinson, Reference Wilkinson2011). Feed–food competition for arable crops is increasingly becoming an issue for food security and global ecology (Eisler et al., Reference Eisler, Lee, Tarlton, Martin, Beddington, Dungait, Greathead, Liu, Mathew, Miller, Misselbrook, Murray, Vinod, Van Saun and Winter2014; Schader et al., Reference Schader, Muller, El-Hage Scialabba, Hecht, Isensee, Erb, Smith, Makkar, Klocke, Leiber, Schwegler, Stolze and Niggli2015). Measuring livestock feed efficiency in terms of human edible feedstuffs (Wilkinson, Reference Wilkinson2011; Ertl et al., Reference Ertl, Zebeli, Zollitsch and Knaus2015), reveals advantages of ruminant systems, but only if they are roughage-based and use low or no concentrate inputs. Against the background of increasing global pressure on the arable land for food productivity, it appears important to place more emphasis on grassland-based production systems, in order to make the best use of the particular ruminant digestive abilities.
European mountain regions, such as the alpine countries comprise a high share of permanent grasslands with swards of comparably high productivity (Smit et al., Reference Smit, Metzger and Ewert2008). On the other hand, due to small arable areas, these regions particularly depend on imports of concentrates. The Swiss landscape, for instance, consists of about 70% grassland, partly situated in upper regions. Almost 60% of concentrates fed in Swiss organic systems in 2013 needed to be imported (Schweizerischer Bauernverband (SBV), 2012), whereas self-sufficiency for concentrates and crude protein (CP) in organic farming in Switzerland is even worse; only 15% and 11% of concentrates and CP, respectively, are homegrown (Früh et al., Reference Früh, Schlatter, Isensee, Maurer and Willer2015). This is despite the fact that concentrate allowance for most Swiss organic dairy farms is maximum 10% of the yearly dry matter feed supplied to ruminants (Bio Suisse, 2016). For these reasons, the development and assessment of low-concentrate dairy systems gained interest and importance in European grassland regions (e.g. Sehested et al., Reference Sehested, Kristensen and Soegaard2003; Steinshamn and Thuen, Reference Steinshamn and Thuen2008; Ertl et al., Reference Ertl, Knaus and Steinwidder2014) including Switzerland (Hofstetter et al., Reference Hofstetter, Frey, Gazzarin, Wyss and Kunz2014; Ivemeyer et al., Reference Ivemeyer, Walkenhorst, Holinger, Maeschli, Klocke, Spengler Neff, Staehli, Krieger and Notz2014; Leiber et al., Reference Leiber, Ivemeyer, Perler, Krenmayr, Mayer and Walkenhorst2015a) in the recent years. However, concerns exist against concentrate-free dairy systems, many of them addressing questions about sustainability in terms of farm economy as well as animal health, fertility and efficiency. Long-term data from such systems are scarce, so far (Sehested et al., Reference Sehested, Kristensen and Soegaard2003; Weller and Bowling, Reference Weller and Bowling2004). This gap should be addressed by the present study with regard to animal performance, health and fertility.
The present study was based on a 6-year assessment of Swiss organic dairy farms which had voluntarily reduced their dietary concentrate applications to different degrees (‘Feed no Food’ project; Ivemeyer et al., Reference Ivemeyer, Walkenhorst, Holinger, Maeschli, Klocke, Spengler Neff, Staehli, Krieger and Notz2014). The initial project had been a combination of development, extension and assessments, which were intensively carried out in the years 2009–11 with a focus on animal health (Ivemeyer et al., Reference Ivemeyer, Walkenhorst, Holinger, Maeschli, Klocke, Spengler Neff, Staehli, Krieger and Notz2014). Due to a lack of studies describing long-term effects of low-concentrate dairy systems on performance, health and fertility, a subgroup of farms was visited and assessed again in 2013–15, and the effects of concentrate reduction over 6 years were evaluated by milk control data assessment, fertility data and records of veterinary treatments (VTs). The objective of our study was to investigate the long-term impact of different concentrate reduction levels under Swiss organic, low-concentrate and roughage-based dairy cow feeding conditions. The study focussed on the development of performance, health and fertility.
Material and methods
Study design
The presented analysis is based on data from a subgroup of farms of the on-farm project ‘Feed No Food’ (Ivemeyer et al., Reference Ivemeyer, Walkenhorst, Holinger, Maeschli, Klocke, Spengler Neff, Staehli, Krieger and Notz2014). The project was conducted to test the impact of low or zero concentrate feeding on performance, health and fertility of Swiss organic dairy herds. The project comprises an evaluation period of 6 years from November 2008 to October 2014. The 1st year was surveyed retrospectively and considered as a baseline (Y0); a reduction of concentrate feeding was realized from the 2nd year (Y1) to the 6th year (Y5). The study observed participating farms with regard to concentrate feeding, roughage feeding and animal health, fertility and performance. All parameters have been analysed at farm level. In the first part of the project (Ivemeyer et al., Reference Ivemeyer, Walkenhorst, Holinger, Maeschli, Klocke, Spengler Neff, Staehli, Krieger and Notz2014), 69 farms in Switzerland and Southern Germany voluntarily participated in the project. Farmers chose their individual degree of concentrate reduction, and were assessed and supervised by a fixed team of veterinarians and animal scientists for 2 years (Y1 to Y2). Subsequently, 42 of the farms (39 Swiss and 3 German farms) received a follow-up assessment by the same team after fulfilling one of the following criteria: (i) Farms fed <5% concentrates to their cows at the end of the first period or (ii) farms had reduced their concentrate amounts during the first period by >50%. During this follow-up period, farmers agreed to maintain or further reduce the concentrate level reached at the end of Y2. Moreover, during the follow-up period, the team members undertook monthly discussions with each farm to assess the current situation based on milk recording data via e-mail or phone. Details of the advisory process are described in Ivemeyer et al. (Reference Ivemeyer, Walkenhorst, Holinger, Maeschli, Klocke, Spengler Neff, Staehli, Krieger and Notz2014). The present paper reports data referring to these 42 farms monitored across all 6 years (Y0 to Y5) of the project.
Data assessment
Four different sources of data were available over the whole project period: (i) animal-based test day data for the cows of the project farms, revealed from the respective breeding associations (cows of the project farms were documented either in ‘swissherdbook’ or in ‘Braunvieh Schweiz’; cow data from German farms have been provided by the ‘Landeskontrollverband Baden-Württemberg’), including milk yields and composition, calving intervals (CIs) and lactation number (LN); (ii) obligatory recorded VTs; (iii) body condition scores (BCS, assessed as described by Isensee et al., Reference Isensee, Leiber, Bieber, Spengler, Ivemeyer, Maurer and Klocke2014 for each cow by the project team during farm visits, for Y0, Y2 and Y5); and (iv) concentrate amounts fed to dairy cows at farm level, roughage components and general feeding management as provided by the farmers.
All parameters were assessed at farm×year level. Information on daily milk yield (DMY), protein, fat and urea contents, somatic cell score (SCS), CI and average LN, were obtained from all test days of the official milk recording data (which are collected 11 times/year) and averaged per project year. The parameter fat-to-protein ratio >1.5 (FPR>1.5) was included as a proxy for insufficient energy supply and risk of ketosis (Ivemeyer et al., Reference Ivemeyer, Smolders, Brinkmann, Gratzer, Hansen, Henriksen, Huber, Leeb, March, Mejdell, Nicholas, Roderick, Stöger, Vaarst, Whistance, Winckler and Walkenhorst2012). The percentage of all cases of FPR>1.5 from all test day results was calculated. Data on total VTs, and specific treatments on udder health (treatments on mastitis and with antibiotics for drying off), fertility (e.g. placental retention) as well as metabolism (e.g. milk fever, ketosis) were taken from obligatory VT protocols and averaged as described in more detail in Ivemeyer et al. (Reference Ivemeyer, Walkenhorst, Holinger, Maeschli, Klocke, Spengler Neff, Staehli, Krieger and Notz2014).
Milk recording data from participating farms were also compared with the average of Swiss dairy cattle (conventional and organic). For that purpose, we analysed milk recording data of the databases of ‘swissherdbook’ and ‘Braunvieh Schweiz’ and calculated averages for each project year based on their complete documented data (>300 000 cows in each project year). About 55% of all Swiss dairy cattle, including most of the participating farms of our project, are documented in these two databases (SBV, 2012). The comparison showed that the farms involved in the project had DMY below the Swiss average by 4 to 8 kg/day, but similar milk solid concentrations, shorter CIs and higher average LNs.
Definition of farm groups based on concentrate reduction
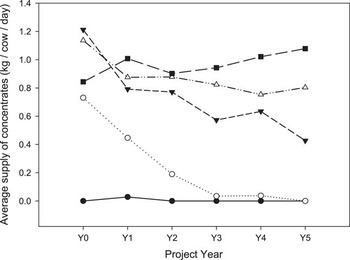
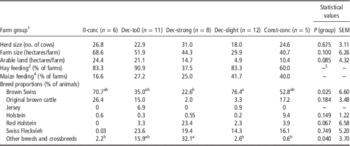
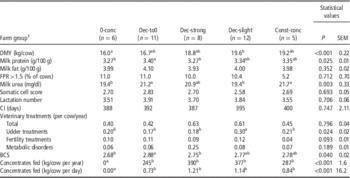
Farm groups are described in Table 1. Average concentrate amounts per cow at farm level were generated by dividing the farms’ concentrate amounts allocated to the dairy herds by the average number of dairy cows in the respective year. Farms were retrospectively allocated to five groups depending on their individual concentrate reduction. Groups were defined by comparing fed concentrate amounts of Y0 and Y5. The first group (0-conc, six farms) already fed no concentrates in Y0 and stayed at this level. The second group (Dec-to0, 11 farms) reduced concentrates to zero during the project period. The third group (Dec-strong, eight farms) decreased concentrate amounts by >50% comparing Y0 with Y5. The fourth group (Dec-slight, 12 farms) lowered concentrate amounts by <50% comparing Y0 with Y5. The fifth group (Const-conc, five farms) fed the same or a slightly higher amount of concentrates in Y5 than in Y0 (Figure 1). Concentrate reduction (kg/day) during the project was 0.73, 0.79 and 0.33 kg for groups Dec-to0, Dec-strong and Dec-slight, respectively.
Daily concentrate supply in five farm groups during the project years. Farm groups: black circles (●): 0-conc (no concentrates over all 6 years); light circles (○): Dec-to0 (concentrate reduction to 0); black triangles (▼): Dec-strong (concentrate reduction by >50%); light triangles (∆): Dec-slight (concentrate reduction <50%); black squares (■): Const-conc (no concentrate reduction).

Descriptors of five farm groups having reduced concentrate supply to cows by different degrees (status in project year 5; least squares means and percentages, where indicated)

a,bMeans within a line with different superscripts differ significantly at P<0.05.
1 Groups: 0-conc=no concentrates over all 6 years; Dec-to0=concentrate reduction to 0; Dec-strong=concentrate reduction by >50%; Dec-slight=concentrate reduction <50%; Const-conc=no concentrate reduction.
2 Percentage of farms feeding 50% hay or more in winter ration.
3 No statistics applied.
4 Percentage of farms feeding maize in winter ration.
Due to grouping the farms solely by the degree of concentrate reduction, the groups were not balanced for any other factors. In particular, the factors breed (highest number of Swiss Brown Cattle in group 0-conc and highest number of Holstein cattle in group Const-conc) and maize feeding (highest proportions in the groups Dec-slight and Const-conc) were biased between the groups (Table 1). These two factors, however, indicate differences in the production intensity, implying that it had been initially higher in group Const-conc than in group 0-conc. Thus, due to the on-farm, participatory character of the study, it was not possible to balance the groups for farm characteristics, nor to correct on such factors (like animal breeds, feed composition or location of the farm). These factors could only be used for descriptive empirical explanation in the discussion. The main purpose of the study was to compare, whether the executed changes in feeding intensity led to long-term effects in the parameters of performance, milk quality and animal health and fertility.
Statistical model
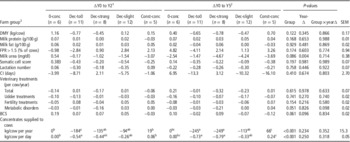
Data were evaluated at farm level. Data assessments were conducted with SPSS® V23. The first model compared the parameter means of the groups in Y0 (Table 2). A GLM with group as fixed factor was applied. The second model compared changes in the parameters across years between groups. Therefore the Δ was calculated for Y0 to Y2 and Y0 to Y5 (Table 3). Again, a GLM was used, applying group and year-Δ(Y2 to Y0, respectively, Y5 to Y0) as fixed factors. Year was set as a fixed factor in order to compare the short-term (Y0 to Y2) with the long-term effect (Y0 to Y5). Multiple comparisons between the group means within years were carried out by GT2-Hochberg post hoc test. All values in the tables are given as least squares means. In order to present the development across all project years, arithmetic group means are shown in Figures 1 to 3. Further, in Figures 2 and 3, the arithmetic means across all Swiss cows covered by the ‘swissherdbook’ and ‘Braunvieh Schweiz’ databases for the respective year are displayed for comparison.
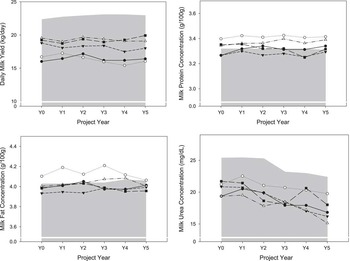
Daily milk yield and milk composition in five farm groups during the project years. Upper edge of grey plane: average of all Swiss cows comprised in the herdbooks used for the respective year. Farm groups: black circles (●): 0-conc (no concentrates over all 6 years); light circles (○): Dec-to0 (concentrate reduction to 0); black triangles (▼): Dec-strong (concentrate reduction by >50%); light triangles (∆): Dec-slight (concentrate reduction <50%); black squares (■): Const-conc (no concentrate reduction).

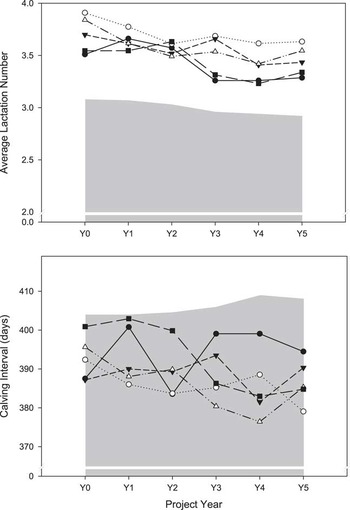
Lactation numbers (age) and calving intervals in five farm groups during the project years. Upper edge of grey plane, average of all Swiss cows comprised in the herdbooks used for the respective year. Farm groups: black circles (●): 0-conc (no concentrates over all 6 years); light circles (○): Dec-to0 (concentrate reduction to 0); black triangles (▼): Dec-strong (concentrate reduction by >50%); light triangles (∆): Dec-slight (concentrate reduction <50%); black squares (■): Const-conc (no concentrate reduction).

Least squares means of all measured parameters for year 0 (baseline) in farm groups, having reduced concentrate supply to cows by different degrees

1 Groups: 0-conc: no concentrates over all 6 years, Dec-to0: concentrate reduction to 0; Dec-strong: concentrate reduction by more than 50%; Dec-slight: concentrate reduction less than 50%, Const-conc: no concentrate reduction.
DMY=daily milk yield; FPR=fat-to-protein ratio in milk; CI=calving interval (calving date to calving date); BCS=body condition score as defined in Isensee et al. (Reference Isensee, Leiber, Bieber, Spengler, Ivemeyer, Maurer and Klocke2014).
a,b,cMeans within a line with different superscripts differ significantly at P<0.05.
Changes in performance, health and fertility from year 0 to year 2 as well as from year 0 to year 5 for five farm groups having reduced concentrate supply to cows by different degrees (least squares means)

1 Differences of values between year 0 and year 2.
2 Differences of values between year 0 and year 5.
3 Groups: 0-conc=no concentrates over all 6 years; Dec-to0=concentrate reduction to 0; Dec-strong=concentrate reduction >50%; Dec-slight=concentrate reduction <50%; Const-conc=no concentrate reduction.
DMY=daily milk yield; FPR=fat-to-protein ratio in milk; CI=calving interval (calving date to calving date); BCS=body condition score as defined in Isensee et al. (Reference Isensee, Leiber, Bieber, Spengler, Ivemeyer, Maurer and Klocke2014).
a,b,cGroup-means within a period with different superscripts differ significantly at P<0.05.
Results
Due to the design of the study and the definition of the farm groups, absolute concentrate amounts differed significantly for factor group (P<0.001; Table 2; Figure 1). Likewise, changes with time (Y2 to Y0 and Y5 to Y0) were significant for factor group (P<0.001) (Table 3). Mean values of all evaluated parameters for the base-year Y0 are shown in Table 2. Average DMY varied between the groups from 16 to 20 kg/cow, showing significant differences between groups already in Y0, as well as during the whole observation time (Figure 2; Table 2). Changes in DMY across years were small, not significantly different between farm groups and varied between +1.2 and −0.8 kg (Table 3; Figure 2). However, although not significant, DMY numerically dropped only in those groups which reduced concentrates (‘Dec-groups’). Milk protein and fat contents remained stable during all years; a group effect due to highest protein and fat contents in group Dec-to0 already existed in Y0 (Tables 2 and 3; Figure 2). Despite in Y0, milk urea concentrations were not different between groups, but declined significantly during the years (Tables 2 and 3). The same, however, happened within the overall dairy cattle in the herdbooks (Figure 2). Somatic cell score remained clearly below 3.0 and decreased with time for all groups except for group 0-conc, but differences were small, and changes were not significantly different between groups (Table 3). Changes in LN varied numerically between groups, and they were all negative when comparing Y5 with Y0, meaning that average LNs dropped by 0.2 to 0.3 within 5 years (Table 3). This reflected a similar decline in the total herdbook data as well (Figure 3). Calving interval remained stable and below 400 days for all years (Tables 2 and 3). Total VTs statistically remained stable during the observation years (Table 3). Treatments on udder health numerically declined for all groups by −0.01 to −0.17 treatments/cow and year (Table 3). The strongest decline appeared in group Dec-slight, which had started significantly higher than the other groups in Y0 (Table 2). Changes in VTs on fertility were <0.1 treatments/cow and year, and did not differ significantly for group or year. Changes in VTs on metabolic disorders varied more strongly (+0.16 Y0 to Y2 and −0.21 Y0 to Y5) in group Dec-strong than in all other groups; therefore, factor group tended to be significant (P=0.051; Table 3). In Y0, BCS was significantly different between groups, although the differences were numerically small (Table 2). Temporal changes in BCS tended to differ between groups (P=0.061; Table 3), however, also in a small range, between −0.12 and +0.19.
Discussion
Concentrate reduction and milk yields
In total, 42 organic dairy farms with different dietary concentrate levels and dynamics of concentrate reduction were observed during 6 years. All farms represented very moderate- or low-input production systems; initially the maximum dietary concentrate allowance was 6% of yearly feed dry matter. Daily milk yields on a yearly average ranged between 16.0 and 19.6 kg/day. On this background, the implications of further reducing concentrate inputs were tested. The data evaluation were based on an a posteriori classification of the farms, depending on their degrees of concentrate reduction. The data show that those farms, which reduced concentrates to zero (Dec-to0) were already initially on a lower concentrate level than those farms, which reduced their concentrates by a smaller proportion. This was also reflected in DMY, which was significantly lower in groups 0-conc and Dec-to0, compared with groups Dec-strong, Dec-slight and Const-conc across all years including Y0 (Table 2; Figure 2). This implies that the decision for complete omission of dietary concentrates was taken in those farms with generally lower milk yields.
The more intensively managed farms, indicated by the use of high-performance cattle breeds and high dietary maize proportions (Table 1), did not or only slightly reduce concentrate feeding (Const-conc and Dec-slight). In general, the production intensity was moderate; the average DMY between 16 and 20 kg; which was below the overall herdbook average (22 to 23 kg; Figure 2). However, these levels fit well into the range observed in other low- or zero-concentrate-based dairy systems (Sehested et al., Reference Sehested, Kristensen and Soegaard2003; Leiber et al., Reference Leiber, Dorn, Probst, Isensee, Ackermann, Kuhn and Spengler Neff2004). This also reflects the low-input character of the farms participating in the study due to the maximum concentrate allowance of 10% dry matter intake under Swiss organic dairy production (Bio Suisse, 2016).
In the temporal scale, DMY decreased numerically but without statistical significance by 0.65, 0.78 and 0.47 kg (Y0 to Y5) on average for groups Dec-to0, Dec-strong and Dec-slight, respectively. Related to the respective decrease of daily fed concentrates (0.73, 0.79 and 0.33 kg for groups Dec-to0, Dec-strong and Dec-slight, respectively), DMY declined by no more than 1.4 kg/kg concentrate reduction (0.88, 1.00 and 1.4 for groups Dec-to0, Dec-strong and Dec-slight, respectively). These values are in line with other studies: Bargo et al. (Reference Bargo, Muller, Delahoy and Cassidy2002) found concentrate input to milk output ratios between 0.96 and 1.36 kg milk/kg concentrate comparing three groups of cows on one farm fed different concentrate levels. Data from another Swiss organic farm (Leiber et al., Reference Leiber, Ivemeyer, Perler, Krenmayr, Mayer and Walkenhorst2015a) result in a milk per kg concentrate ratio of 1.25, as an average across all lactation stages. Ertl et al. (Reference Ertl, Knaus and Steinwidder2014) concluded milk output per kg concentrate input to be clearly below 1.5 kg. Data from a 3-year experiment on concentrate reduction in a Danish organic dairy system by Sehested et al. (Reference Sehested, Kristensen and Soegaard2003) showed very low-concentrate efficiency coefficients of 0.4 to 0.75 kg milk/kg concentrate, depending on the degree of concentrate reduction. It has to be mentioned that during the time period of the project, the Swiss national herd average DMY increased by 0.6 kg (see Figure 2). Theoretically, lack of this gain in the project’s farms should be considered when concluding about the effects of concentrate reduction. However, due to the low-input nature of the participating farms, which are in the most cases using regionally bred sires for natural mating (Spengler Neff and Ivemeyer, Reference Spengler Neff and Ivemeyer2016), it is unlikely they would have achieved a similar gain within the 5 years.
A main reason for the rather low apparent concentrate efficiency is assumed to be the compensation of concentrate omission by increased roughage intake, which is likely to be 1.0 to 1.4 kg roughage/kg concentrate under the given production conditions of the participating farms (Berry et al., Reference Berry, Sutter, Bruckmaier, Blum and Kreuzer2001; Leiber et al., Reference Leiber, Ivemeyer, Perler, Krenmayr, Mayer and Walkenhorst2015a). Furthermore, concentrate proportions can be negatively associated with fibre degradation in cattle (Tafaj et al., Reference Tafaj, Kolaneci, Junck, Maulbetsch, Steingass and Drochner2005; Leiber et al., Reference Leiber, Kreuzer, Jörg, Leuenberger and Wettstein2015b). Thus, when roughage quality is high, intake compensation and improved fibre degradation may diminish the effect of concentrate reduction (Tafaj et al., Reference Tafaj, Kolaneci, Junck, Maulbetsch, Steingass and Drochner2005). Body fat mobilisation can compensate for nutrient shortage to a considerable degree (Isensee et al., Reference Isensee, Leiber, Bieber, Spengler, Ivemeyer, Maurer and Klocke2014). This might have contributed to the results of the current study; however, on the long run, BCS values remained stable in the herds and no signs of physiological problems due to mobilisation occurred. Overall, under Swiss organic standards (Bio Suisse, 2016), which generally restrict concentrate use to 10% dietary dry matter, the within-farm comparison revealed low concentrate efficiency, both in the low-input farms of the current survey as well as in a maximum-input Swiss organic farm in an experimental study (Leiber et al., Reference Leiber, Ivemeyer, Perler, Krenmayr, Mayer and Walkenhorst2015a). Conclusions may not hold true for cows in the beginning of the lactation or for high-yielding cows in intensive systems, but as averages over whole herds and production years under the given low-input systems, they appear to be justified.
On the other hand, the group differences for DMY were significant. When comparing group 0-conc with group Const-conc across all years, a difference in DMY of 2.2 to 3.5 kg milk corresponds to a difference in concentrate application of 0.84 to 1.08 kg/day. This suggests a high concentrate efficiency of 2.4 to 3.2 kg milk/kg concentrate. However, a general difference in production intensity between the two groups has to be taken into account, reflected by different breed proportions and levels of dietary maize inclusion (Table 1). This implies that calculating concentrate efficiency coefficients by comparing different production systems without correction for breed and roughage composition reveals generally different (and probably erroneous) values compared with calculations based on changes in concentrate application within the same system (cf. Beever and Doyle, Reference Beever and Doyle2007).
Milk composition and nutrient efficiency
Fat and protein contents showed little variation across the years and fitted well into the overall herdbook average. The results indicating that concentrate reduction within farms did not decrease milk protein contents are in line with previous studies by Sehested et al. (Reference Sehested, Kristensen and Soegaard2003), Ertl et al. (Reference Ertl, Knaus and Steinwidder2014) and Leiber et al. (Reference Leiber, Ivemeyer, Perler, Krenmayr, Mayer and Walkenhorst2015a). Protein efficiency may increase due to efficient ruminal urea recycling, when CP supply is low (Rojen et al., Reference Røjen, Lund and Kristensen2008). This can be expected when protein-rich concentrates are reduced (Leiber et al., Reference Leiber, Ivemeyer, Perler, Krenmayr, Mayer and Walkenhorst2015a), and a decreasing milk urea concentration at maintained milk protein contents could be indicative for that (Spek et al., Reference Spek, Dijkstra, van Duinkerken, Hendriks and Bannink2013). However, in the current study, milk urea concentrations decreased in all groups and even in the average herdbook data during the years of investigation (see Figure 2). This suggests an increasingly careful use of protein concentrates or protein/energy proportion in Swiss cattle rations during the observed years. A specific indication of altered protein efficiency in the groups which reduced concentrates in our study was not found. Declining urea at constant protein concentrations in milk indicate that dietary energy was not deficient in any group. Moreover, the very small alterations in BCS indicate adequate dietary energy to protein proportions in all groups.
Health and fertility
Over the last decades, dairy cows’ milk yields largely increased, whereas longevity, fertility and health status decreased (Knaus, Reference Knaus2009). This development is associated with continuous progress in performance-directed breeding and considerably increased intensity of feeding. High-performing cows are more susceptible to alterations in nutrient supply (Knaus, Reference Knaus2009; Horn et al., Reference Horn, Steinwidder, Pfister, Gasteiner, Verstergaard, Larsen and Zollitsch2014), which requires high-input diets. On the other hand, the combination of high-yielding cows and high-density diets did obviously not prevent, but rather trigger the health and fertility problems (Knaus, Reference Knaus2009; Phuong et al., Reference Phuong, Blavy, Martin, Schmidely and Friggens2016). Extensification of production could therefore help stabilise production, but at the same time also poses a risk to animal health and fertility, depending on the fit between production system and genotype. Therefore, although the current study investigated low-input systems, it also addressed potential effects on dairy cow health and fertility when exposed to a decrease in dietary concentrate supply.
Negative energy balance (NEB) leads to mobilisation of body fat reserves and causes an increase of ketones in cattle blood which can reach pathological thresholds of ketosis (Dorn et al., Reference Dorn, Leiber, Sundrum, Holinger, Mayer and Walkenhorst2016). Fat-to-protein ratio >1.5 (FPR>1.5) in early lactation is one possible indicator to estimate an increased risk of subclinical ketosis (Ivemeyer et al., Reference Ivemeyer, Smolders, Brinkmann, Gratzer, Hansen, Henriksen, Huber, Leeb, March, Mejdell, Nicholas, Roderick, Stöger, Vaarst, Whistance, Winckler and Walkenhorst2012). In our study, the percentage of test day results with FPR>1.5 neither varied over time nor between groups. Percentage of cows with FPR>1.5 ranged from 5% to 11% at the beginning of the project and 6% to 16% at the end of the project. These levels were in the range of European organic dairy farms (Ivemeyer et al., Reference Ivemeyer, Smolders, Brinkmann, Gratzer, Hansen, Henriksen, Huber, Leeb, March, Mejdell, Nicholas, Roderick, Stöger, Vaarst, Whistance, Winckler and Walkenhorst2012). Correspondingly, VTs for metabolic disorders remained stable at a relatively low level of 0.06 to 0.08 treatments/cow per year in Y0 and 0.03 to 0.11 in Y5, which underlines that the reduction of concentrates did not increase the risk for metabolic disorders in our study.
Veterinary treatments on udder health slightly decreased and SCS remained stable at a low level during the whole project. The values were slightly lower than average values for organic farms in five European countries (mean SCS between 3.0 and 3.1), but on a comparable level with the Swiss organic farms, as reported by Ivemeyer et al. (Reference Ivemeyer, Smolders, Brinkmann, Gratzer, Hansen, Henriksen, Huber, Leeb, March, Mejdell, Nicholas, Roderick, Stöger, Vaarst, Whistance, Winckler and Walkenhorst2012) in an earlier study. Our findings support those of Ertl et al. (Reference Ertl, Knaus and Steinwidder2014), who reported less health problems and significantly lower veterinary costs for concentrate-free cows. Sehested et al. (Reference Sehested, Kristensen and Soegaard2003) also reported no indications of health problems over 3 years of feeding reduced concentrate levels in an organic dairy herd. Our study underlines that these earlier findings are also true when applied across a much larger sample of farms, and monitored over a longer time period. However, it also has to be acknowledged that this study was conducted in low-input systems and with cows possibly adapted to these systems. This might be illustrated by the distribution of dairy cow breeds on the farms of the current study, in which Holstein Friesian was clearly under-represented, and moderately yielding breeds such as brown Swiss, Original Brown and Swiss Fleckvieh dominated. The adaptation of the genotype to low-input or pasture-based systems is highly relevant for their response to altering energy balance due to dietary changes or lactation development (Horn et al., Reference Horn, Steinwidder, Gasteiner, Podstatzky, Haiger and Zollitsch2013 and Reference Horn, Steinwidder, Pfister, Gasteiner, Verstergaard, Larsen and Zollitsch2014). However, under these particular circumstances, the lack of health issues due to concentrate reduction was not surprising and it is not necessarily possible to expect the same for high-input systems.
Fertility is influenced by several factors, amongst them feeding. Unbalanced feeding, leading to NEB, ketosis (Roche, Reference Roche2006), or too low-protein supply may be a risk for low fertility (Westwood et al., Reference Westwood, Lean and Kellaway1998). Therefore, due to a low-concentrate quantity and the decrease of milk urea to 15 mg/dl, an increase of fertility problems could have been expected in the current study. In fact, the CI recorded in this study was 7 to 34 days shorter, compared with the Swiss average, without significant differences between groups (Figure 3), whereas all groups had lower milk urea concentrations than the herdbook means (differences were 2 to 7 mg/dl; Figure 2). Thus, we found no evidence for impaired fertility by concentrate reduction, which is in line with results from Ertl et al. (Reference Ertl, Knaus and Steinwidder2014) and Hofstetter et al. (Reference Hofstetter, Frey, Gazzarin, Wyss and Kunz2014).
A long productive lifespan is not only an ethical, but also an issue of economics and resource efficiency. Yearly milk yield improves up to the fifth or sixth lactation, increasing ecological efficiency (Grandl et al., Reference Grandl, Amelchanka, Furger, Clauss, Zeitz, Kreuzer and Schwarm2016). Therefore, the productive lifespan of a dairy cow, as expressed in numbers of finished lactations is highly relevant. Average LN in all groups was clearly higher than the overall average of the analysed herdbook data, however, this decreased, though not significantly, across the years with approximately the same trend for all groups and for the Swiss average (Figure 3). This shows that the global trend to shorter productive lifespan (Knaus, Reference Knaus2009) is less severe for Switzerland and in particular for the farms of the current study, but the trend is still occurring. Due to a stable number of overall VTs, slightly decreasing SCS and veterinary mastitis treatments, stable percentage of FPR>1.5 in early lactation, stable BCS, as well as no changes in milk yield and CIs within groups, it is not possible to deduce culling reasons from the current study, which would explain the decrease in LN.
Conclusion
Under the investigated low-input and grassland-based production conditions with dairy breeds of moderate productivity, reduction of concentrates on dairy farms had no negative impact on fertility parameters, veterinary treatments, body condition score or average lactation number. Calving intervals were clearly shorter and average lactation number was higher than in the population average of all cows in the respective herdbooks. Milk yield decreased by 0.9 to 1.4 kg/kg of concentrate restriction, whereas milk protein and milk fat concentrations remained stable. The project showed that during a 5-year period, a concentrate reduction did not cause health or fertility risks for farms operating under low-input conditions. Furthermore, it is obvious that the conversion efficiency of concentrates to milk in such systems is close to 1 kg/kg, which may be considered as rather low. Evaluation of protein and energy conversion rates in these systems is needed in order to differentiate efficiency coefficients between various concentrate types.
Acknowledgements
The authors thank all participating farmers for their cooperation, realisation of the study and sharing their data. The authors also acknowledge the COOP Sustainability Fund Basel, and the cantonal offices from Zürich, Graubünden, Aargau, Bern and Bio Grischun for financial support.