Clay minerals, traditionally employed in ceramics (Lisachuk et al., Reference Lisachuk, Shchukina, Tsovma, Belostotskaya and Trusova2013; Valásková, Reference Valásková2015), construction (Singh, Reference Singh2022) and industry (Ali et al., Reference Ali, Ahmed, Ahmed and Hefni2021), are now utilized in fields such as agriculture (Barré et al., Reference Barré, Velde and Abbadie2007; Garbowski et al., Reference Garbowski, Bar-Michalczyk, Charazinska, Grabowska-Polanowska, Kowalczyk and Lochynski2023), material manufacturing (Zhang et al., Reference Zhang, Tang, Yang and Ouyang2016; Scholtzová & Tunega, Reference Scholtzová and Tunega2020) and medicine (Kim et al., Reference Kim, Choi, Elzatahry, Vinu, Choy and Choy2016; Rodrigo et al., Reference Rodrigo, Cardiel, Fraile, Mayoral, Pablo and Garcia-Martin2024) with the advancement of science and technology. The performance of these clay minerals across all of these applications is fundamentally governed by their atomic structure and electronic and mechanical properties. Notably, kaolinite is one of the most frequently used clay minerals and is ubiquitous in both surface and subsurface soils (Ito & Wagai, Reference Ito and Wagai2017). Kaolinite is of significant value to multiple sectors, including medicine (Gianni et al., Reference Gianni, Avgoustakis and Papoulis2020), the paper industry (Morsy et al., Reference Morsy, El-Sherbiny, Hassan and Mohammed2014), cosmetics production (Kieling et al., Reference Kieling, Silva, Duvoisin, Neto, Melquíades and del Pino2022), catalysis (Rong & Xiao, Reference Rong and Xiao2002) and the manufacturing of synthetic materials (Kang et al., Reference Kang, Cao and Bate2019; Wang et al., Reference Wang, Meng, Tang and Yang2022). Consequently, the atomic structure and electronic and mechanical properties of kaolinite are being actively elucidated through various experimental methods and theoretical calculations.
Since Hendricks’ (Hendricks, Reference Hendricks1929) and Pauling’s (Pauling, Reference Pauling1930) pioneering proposals regarding the structure of kaolinite based on crystal chemistry theory, relevant experimental efforts have continually aimed to refine and study its crystal structure and key mechanical properties (Brindley & Keith, Reference Brindley and Keith1946; Wang et al., Reference Wang, Wang and Cates2001; Ameur et al., Reference Ameur, Robin and Hattab2016). More specifically, Welch et al. (Reference Welch, Montgomery, Balan and Lerch2012) investigated the structural evolution of kaolinite up to 9.5 GPa using synchrotron radiation infrared spectroscopy, providing direct spectral evidence of its mechanical response under high-pressure conditions. Bourret et al. (Reference Bourret, Tessier-Doyen, Guinebretiere, Joussein and Smith2015) used pulse-echo technology to perform in situ measurements of longitudinal-wave velocities under high temperature and pressure, and they established a fitting equation between the elastic modulus and temperature–pressure.
However, the direct and accurate experimental determination of the atomic, electrical and mechanical characteristics of clay minerals remains challenging due to the small particle size and poor permeability of clay minerals and inherent methodological limitations. As a result, theoretical approaches have become indispensable for probing these characteristics from a microscopic viewpoint. Specifically, first-principles calculation methods based on density functional theory (DFT) have proven to be valid and dependable for investigating the mechanical and electronic behaviours of kaolinite at the molecular scale (Liu et al., Reference Liu, Qin, Jiao, Liu and Z.T2016; Kumar et al., Reference Kumar, Chandra and Santosh2018; Gianni et al., Reference Gianni, Avgoustakis and Papoulis2020). For instance, Sato et al. (Reference Sato, Ono, Johnsto and Yamagishi2005) employed first-principles calculations to determine the bulk modulus (B) and Young’s modulus (Y) of kaolinite. Weck et al. (Reference Weck, Kim and Jové-Colón2015) investigated the influence of dispersion interactions on the elastic properties of kaolinite and compared standard DFT and DFT-D2 simulations. Additionally, Fang et al. (Reference Fang, Zhai, Z, Pan and Mo2017) and Zhao et al. (Reference Zhao, Wang, Luan and He2024) utilized DFT techniques to explore the electronic structure and mechanical properties of kaolinite under various pressure conditions. However, most previous theoretical studies on kaolinite have focused on ambient or high-pressure conditions. Temperature is a significant factor affecting the properties of clay minerals (Yang et al., Reference Yang, Han, Hu and He2019; Liu et al., Reference Liu, Dai, Ali, S, Sun, Peng and Naz2021; Qin et al., Reference Qin, Zhao, Wei, Cao and He2022), yet the influence of temperature on kaolinite has received limited attention. Therefore, the present study systematically investigated the atomic and electronic structures and mechanical properties of kaolinite at various temperatures (from 0 to 750 K) using first-principles calculations. The computed properties included elastic moduli, Vickers hardness, Poisson’s ratio, anisotropic indices, acoustic-wave velocities, lattice parameters, electronic band structure, density of states and charge density distribution. By analysing the thermal dependence of these properties, we clarified the fundamental influence of temperature on kaolinite. The results provide a comprehensive theoretical framework for understanding the pressure-dependent mechanical responses of kaolinite at the atomic level.
Calculation method
The atomic structure and mechanical properties of kaolinite at various temperatures in the present paper were calculated using DFT corrected for dispersion interactions utilizing the Vienna ab initio simulation package (VASP; Kresse & Furthmüller, Reference Kresse and Furthmüller1996). The exchange-correlation function implemented in the generalized-gradient approximation of Perdew–Burke–Ernzerhof function was utilized. The cutoff kinetic energy for the plane-wave function was 430 eV. The Monkhorst–Pack k-point grid mesh (Monkhorst & Pack, Reference Monkhorst and Pack1976) was 6 × 6 × 4 for sampling the Brillouin zone of kaolinite. All atoms were fully relaxed until the Hellman–Feynman forces became less than 0.01 eV Å–1 and the total energy change between two steps was smaller than 1 × 10⁻⁴ eV. The hydrogen 1s 1, oxygen 2s 22p 4, silicon 3s 23p 2 and aluminium 3s 23p 1 electrons were treated as valence electrons.
The temperature-dependent properties were computed using quasi-harmonic approximation (QHA; Dovesi et al., Reference Dovesi, Erba, Orlando, Zicovich-Wilson, Civalleri and Maschio2018) as implemented in Phonopy software, which integrated with VASP. Within QHA theory, a solid is treated as a collection of lattice vibration modes (phonons). The key assumption is that although temperature increases the amplitude of lattice vibrations, their fundamental character remains unchanged, meaning that these vibration modes are considered quasi-static. This allows the thermodynamic properties of a solid to be derived from the temperature-dependent behaviour of these phonon modes. The Helmholtz free energy F is given by Equation 1:
 \begin{equation}\begin{array}{*{20}{c}}
{F\left[ {X\left( {{\xi }} \right);p,T} \right] = E\left[ {X\left( {{\xi }} \right)} \right] + {A_{{\text{vib}}}}\left[ {X\left( {{\xi }} \right);T} \right] + {F_{{\text{ele}}}}\left[ {X\left( {{\xi }} \right);T} \right]}
\end{array}\end{equation}
where E[X(ξ)] is the total energy after applying strain ξ, F ele[X(ξ); T] is the electronic free energy after applying strain ξ at temperature T and A vib[X(ξ); T] is the vibrational Helmholtz free energy after applying strain ξ at temperature T.
The vibrational Helmholtz free energy can be calculated using Equation 2:
 \begin{equation}\begin{array}{*{20}{c}}
{A_{\text{{vib}}}}\left[ {X\left( {{\xi }} \right);T} \right] = \mathop{\displaystyle\int}\limits_{0}^{\infty} \left[ \frac{1}{2}\hbar {\unicode{x03C9}} + {\text{k}}_{\text{B}}T\ln \left(1 - \text{e}^{-\frac{\hbar{\unicode{x03C9}}}{\text{k}_{\text{B}}T}} \right)\right] g [X(\xi);\unicode{x03C9} ]\text{d}\unicode{x03C9}
\end{array}\end{equation}
where ω is the phonon frequency, kB is the Boltzmann constant,  $\hbar$ is the Planck constant and g[X(ξ); ω] is the phonon density of states.
The elastic constants were derived through the strain-energy method. A set of small, finite strains was applied to the equilibrium lattice structure, and the elastic stiffness constant Cij was derived from the corresponding change in the total energy of the unit cell. In the present study, strains ranging from –0.03 to 0.03 were applied in increments of 0.006.
The effective elastic moduli were calculated using the Voigt–Reuss–Hill averaging method, where the B and shear modulus (G) are derived from the arithmetic mean of the Voigt upper bound and Reuss lower bound of the true elastic moduli (Reuss, Reference Reuss1929; Voigt, Reference Voigt1966; Chung & Buessem, Reference Chung and Buessem1968). B and G are given by Equations 3 & 4:
 \begin{equation}\begin{array}{*{20}{c}}
{B = \frac{{{B_{\text{V}}} + {B_{\text{R}}}}}{2}}
\end{array}\end{equation}
 \begin{equation}\begin{array}{*{20}{c}}
{G = \frac{{{G_{\text{V}}} + {G_{\text{R}}}}}{2}}
\end{array}\end{equation}
where B V and B R denote the Voigt and Reuss bounds of B and G V and G R represent the corresponding bounds for the G.
The Y, Poisson’s ratio (μ), acoustic compression wave velocity (v p), shear wave velocity (v s), Vickers hardness (H v) and universal anisotropy index (A U) were obtained using Equations 5–10, respectively:
 \begin{equation}\begin{array}{*{20}{c}}
{Y = \frac{{9BG}}{{3B + G}}}
\end{array}\end{equation}
 \begin{equation}\begin{array}{*{20}{c}}
{\mu = \frac{{3B - 2G}}{{2\left( {3B + G} \right)}}}
\end{array}\end{equation}
 \begin{equation}\begin{array}{*{20}{c}}
{{v_{\text{p}}} = \sqrt {\frac{{3B + 4G}}{{3{{\rho }}}}} }
\end{array}\end{equation}
 \begin{equation}\begin{array}{*{20}{c}}
{{v_{\text{s}}} = \sqrt {\frac{G}{{{\rho }}}} }
\end{array}\end{equation}
 \begin{equation}\begin{array}{*{20}{c}}
{{H_{\text{v}}} = 2{{\left( {\frac{{{G^3}}}{{{B^2}}}} \right)}^{0.583}} - 3}
\end{array}\end{equation}
 \begin{equation}\begin{array}{*{20}{c}}
{{A^{\text{U}}} = 5\frac{{{G_{\text{V}}}}}{{{G_{\text{R}}}}} + \frac{{{B_{\text{V}}}}}{{{B_{\text{R}}}}} - 6}
\end{array}\end{equation}
Results and discussion
Effect of temperature on the atomic structure of kaolinite
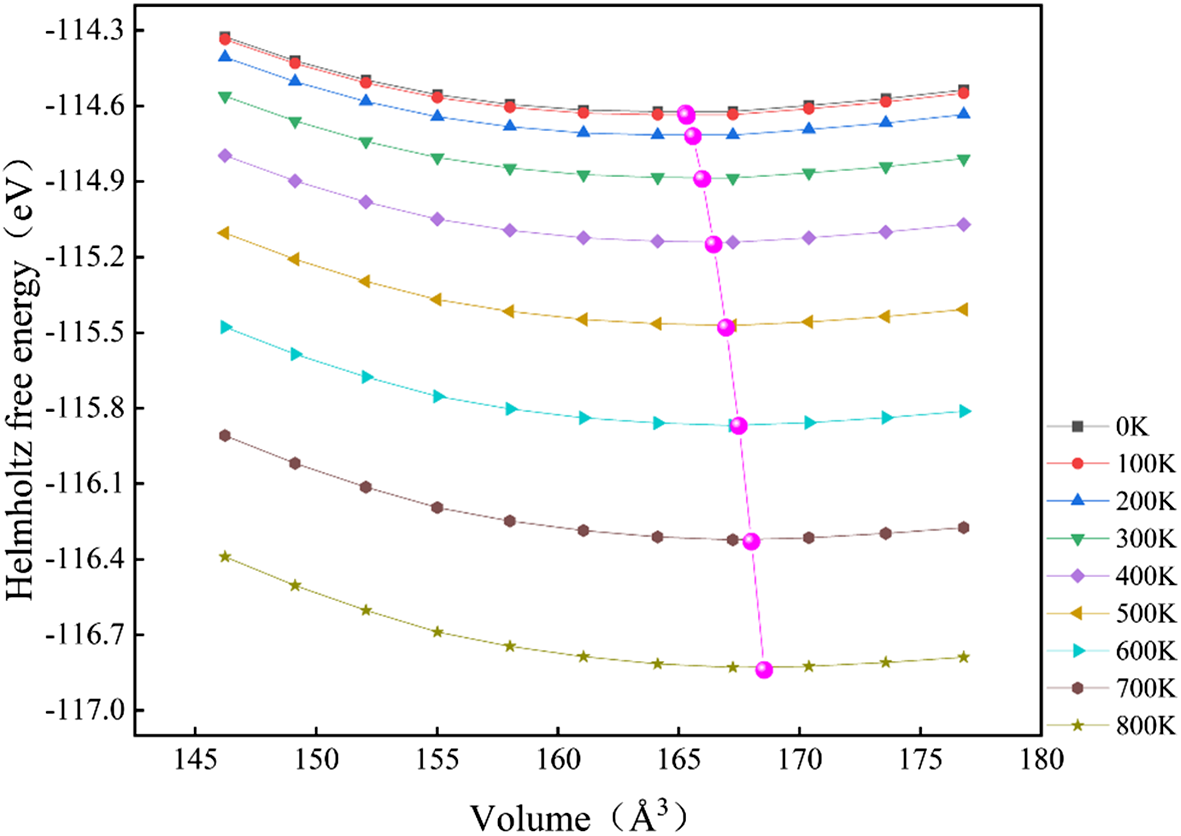
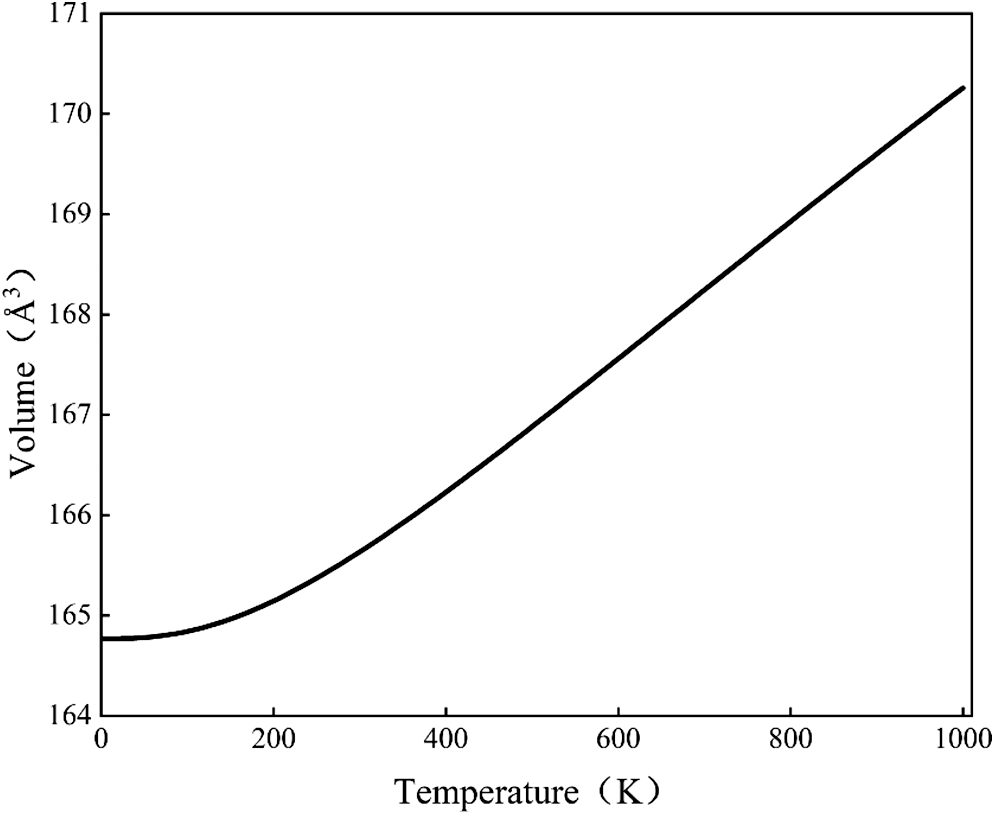
Based on previous research findings (Qiu et al., Reference Qiu, Jiang, Li, Fan and Huang2004), kaolinite will dehydroxylate within the temperature range of 500–550°C. Therefore, the temperature range selected for the study of the crystal structure and mechanical properties of kaolinite was 0–750 K in the present paper. The investigation of the atomic structure of kaolinite at various temperatures involved calculations of the Helmholtz free energy for a 1 × 1 × 1 unit cell at various volumes, as shown in Fig. 1. Then, the minimum of the Helmholtz free energy–volume curve was located for each temperature to establish the equilibrium state (marked by magenta spheres in Fig. 1). As spontaneous processes drive a system towards a minimum in Helmholtz free energy, the most stable state at a given temperature corresponds to the lowest value on the Helmholtz free energy–volume curve. Therefore, the magenta spheres in Fig. 1 mark equilibrium states for kaolinite at each temperature. The temperature dependence of the equilibrium volume was then obtained by fitting the locus of these energy minima, as shown in Fig. 2.
Relationship between Helmholtz free energy and volume of kaolinite at various temperatures.

Relationship between temperature and volume of kaolinite.

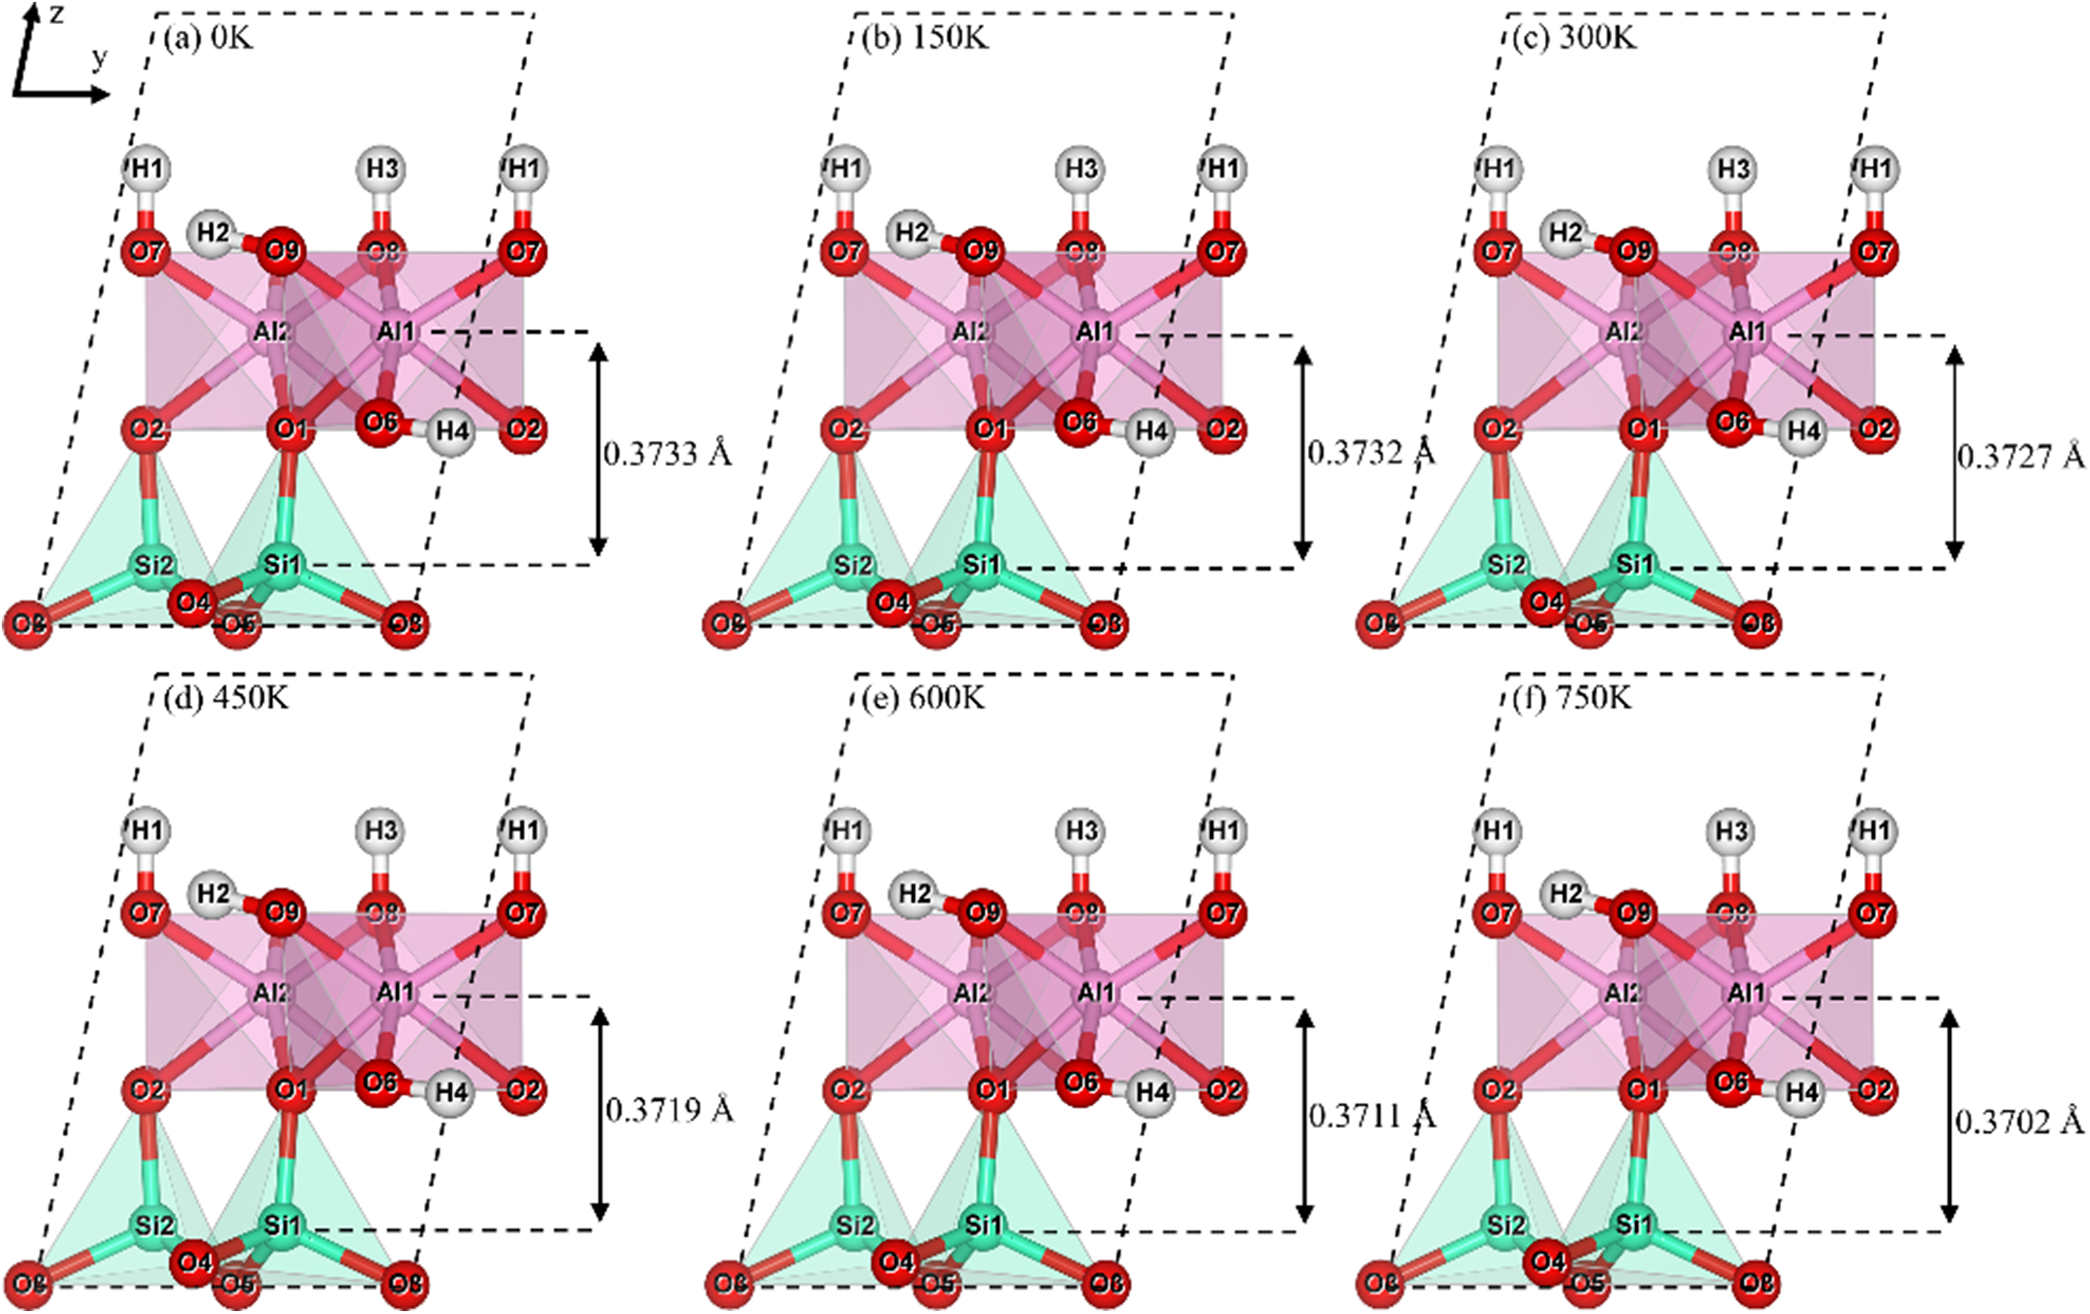
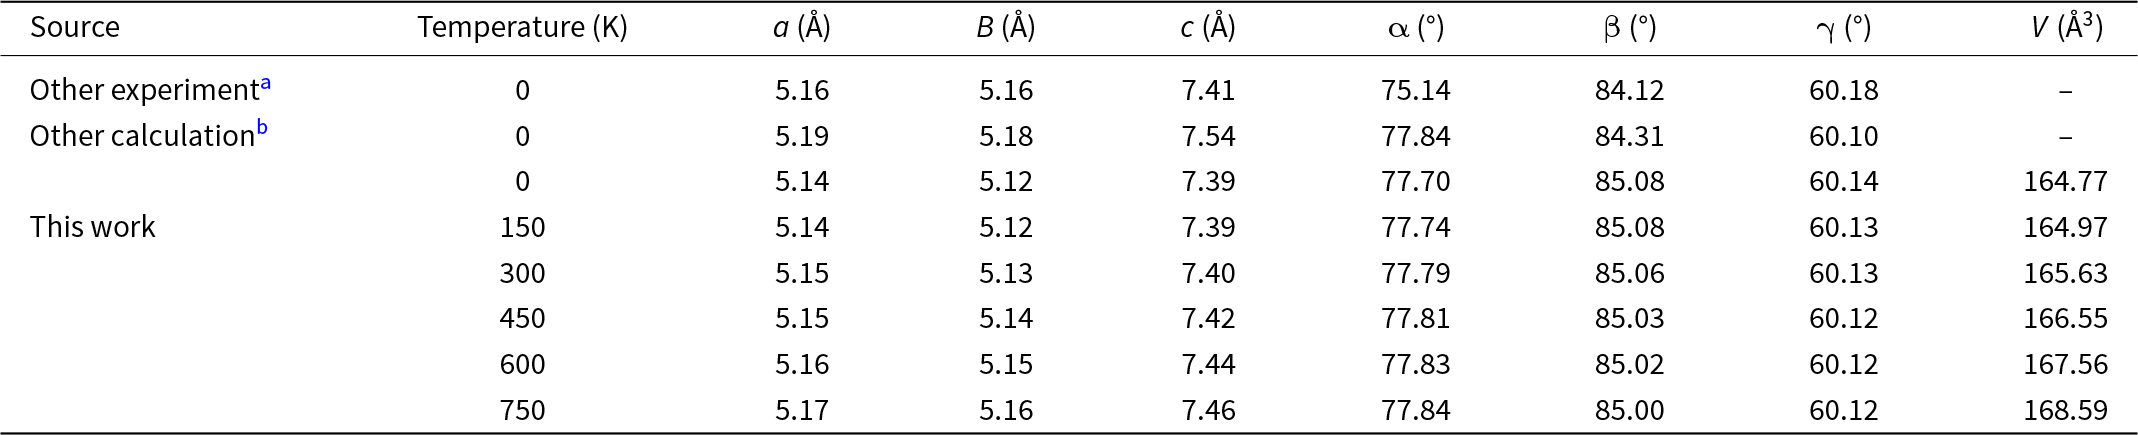
According to the fitted temperature–volume curve, the atomic structures of kaolinite at 0, 150, 300, 450, 600 and 750 K were fully relaxed. The optimized structures are shown in Fig. 3. The distance between the silica tetrahedral layer and the alumina octahedral layer exhibited a slight contraction with increasing temperature, which is attributed to the concomitant increase in the Al–O–Al angle and decrease in the Al–O–Si angle. The lattice constants for the optimization of kaolinite at various temperatures are listed in Table 1, where the lattice parameters at 0 K show good consistency with existing experimental data (Militzer et al., Reference Militzer, Wenk, Stackhouse and Stixrude2011) and theoretical calculation results (Shafei et al., Reference Shafei, Adhikari and Ching2021), verifying the reliability of the model established in this study. The lattice parameters a, b, c, α and cell volume V increased over the temperature range of 0–750 K, consistent with thermal expansion driven by the increased amplitude of atomic vibrations. The lattice parameters a increased by 0.58% (5.14–5.17 Å), b increased by 0.78% (5.12–5.16 Å) and c increased by 0.94% (7.39–7.46 Å). The most pronounced expansion along the c-axis was characteristic of layered aluminosilicates of kaolinite, arising from weak interlayer bonding dominated by hydrogen bonds and van der Waals forces. These results indicate that thermal effects disrupt these interlayer interactions more significantly than the stronger covalent bonds (Al–O, Si–O and H–O bonds) within the layers. In contrast, the angles β and γ displayed slight decreases with temperature, although the magnitudes of these changes were negligible.
The atomic structures of kaolinite at various temperatures:: (a) 0 K, (b) 150 K, (c) 300 K, (d) 450 K, (e) 600 K and (f) 750 K.

The lattice parameters of kaolinite at various temperatures.

a Militzer et al. (Reference Militzer, Wenk, Stackhouse and Stixrude2011).
b Shafei et al. (Reference Shafei, Adhikari and Ching2021).
Effect of temperature on the electronic properties of kaolinite
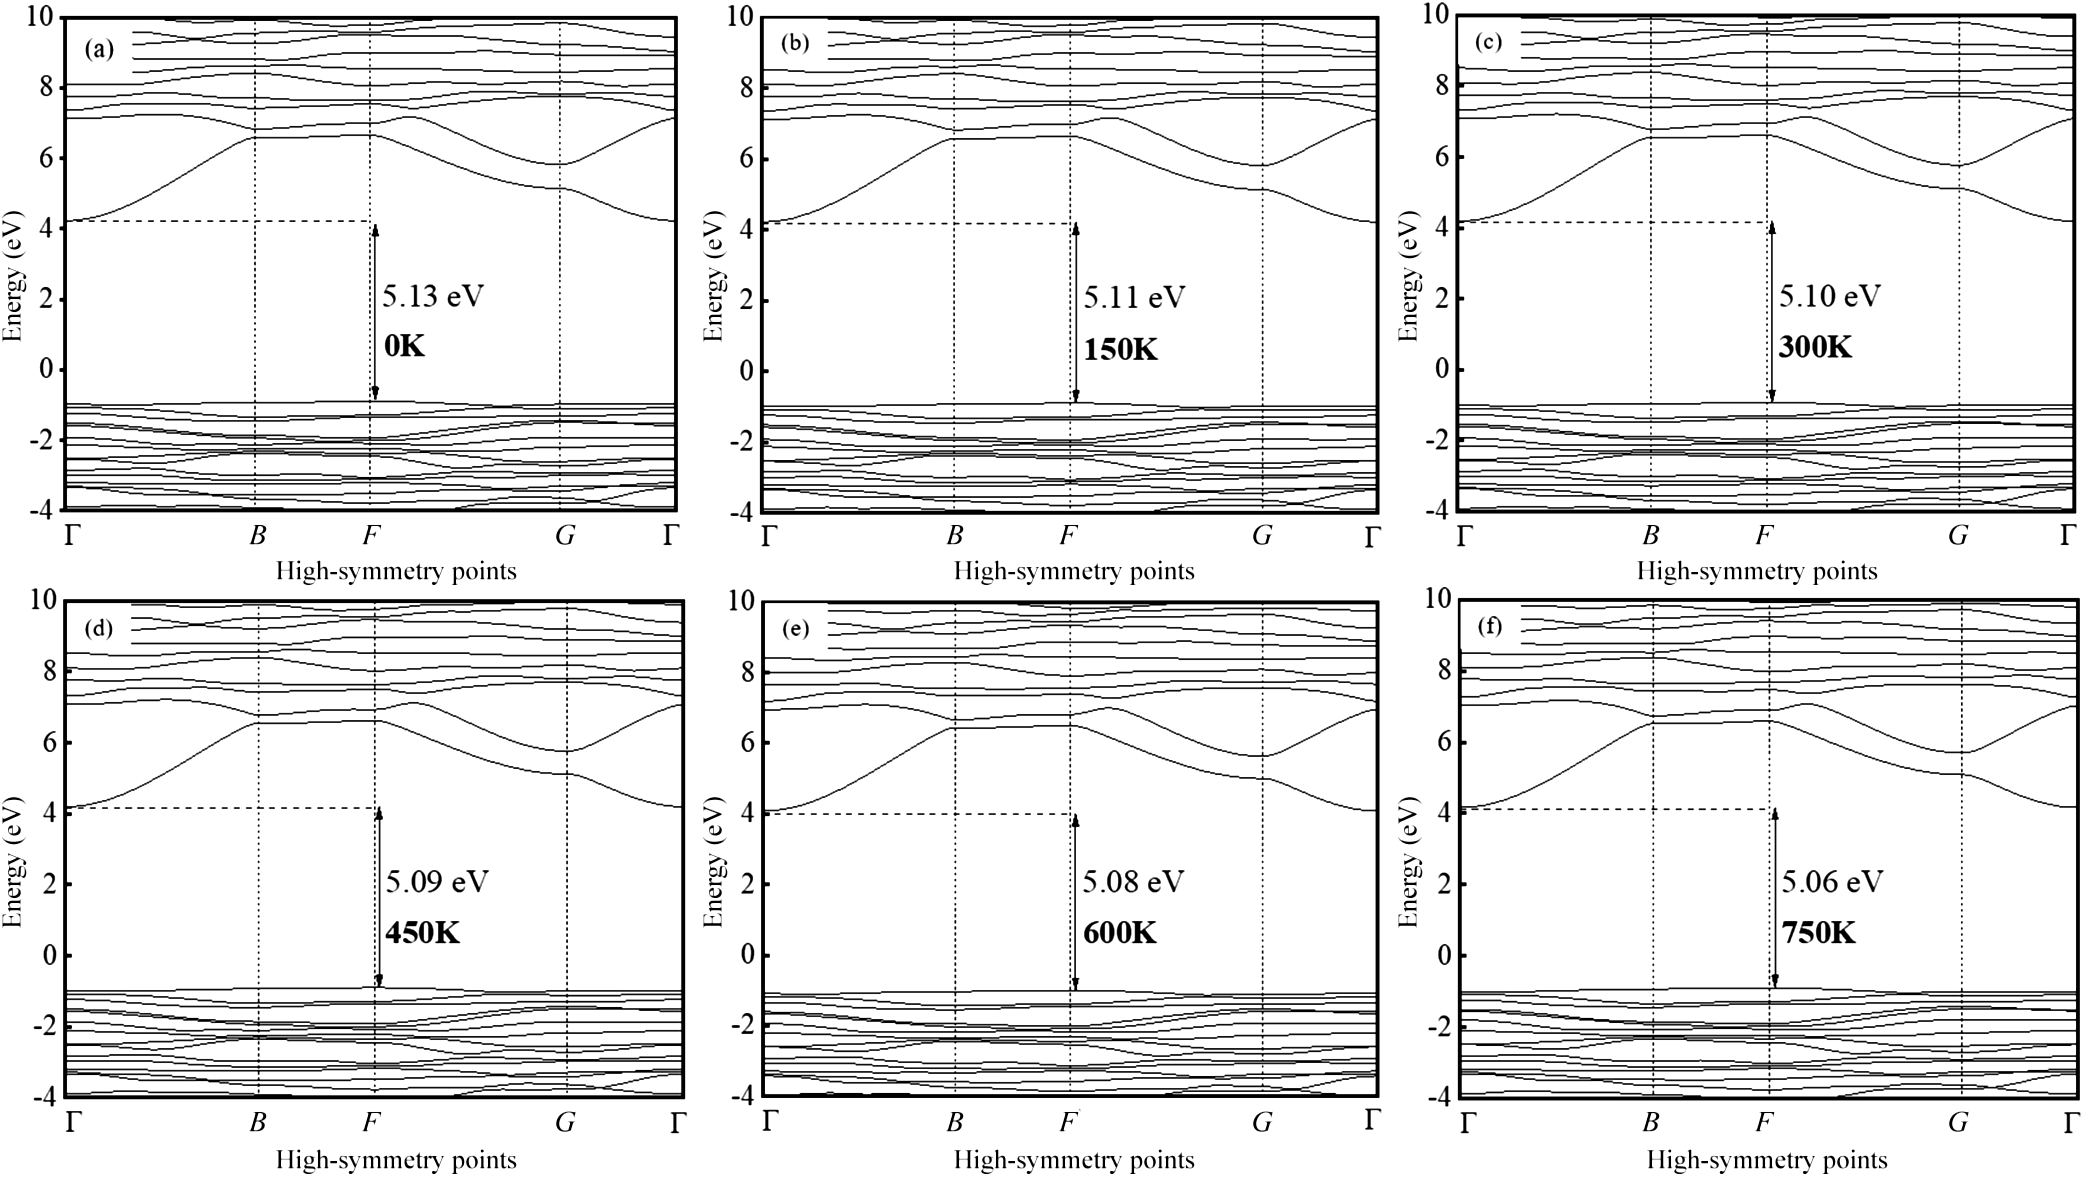
Changes in temperature altered the electronic properties of kaolinite by inducing atomic structure modifications. Therefore, the electronic structure evolution of kaolinite at various temperatures will be systematically examined. The band structures of kaolinite at various temperatures are shown in Fig. 4a–f. Across the temperature range of 0–750 K, the valence band maximum and conduction band minimum of kaolinite remained located at the F and Г points, respectively, confirming the persistence of an indirect band-gap character. Concurrently, the band gap of kaolinite narrowed from 5.13 to 5.06 eV, indicating a reduction in its electrical insulation capacity with increasing temperature.
The band structure of kaolinite at various temperatures: (a) 0 K, (b) 150 K, (c) 300 K, (d) 450 K, (e) 600 K and (f) 750 K.

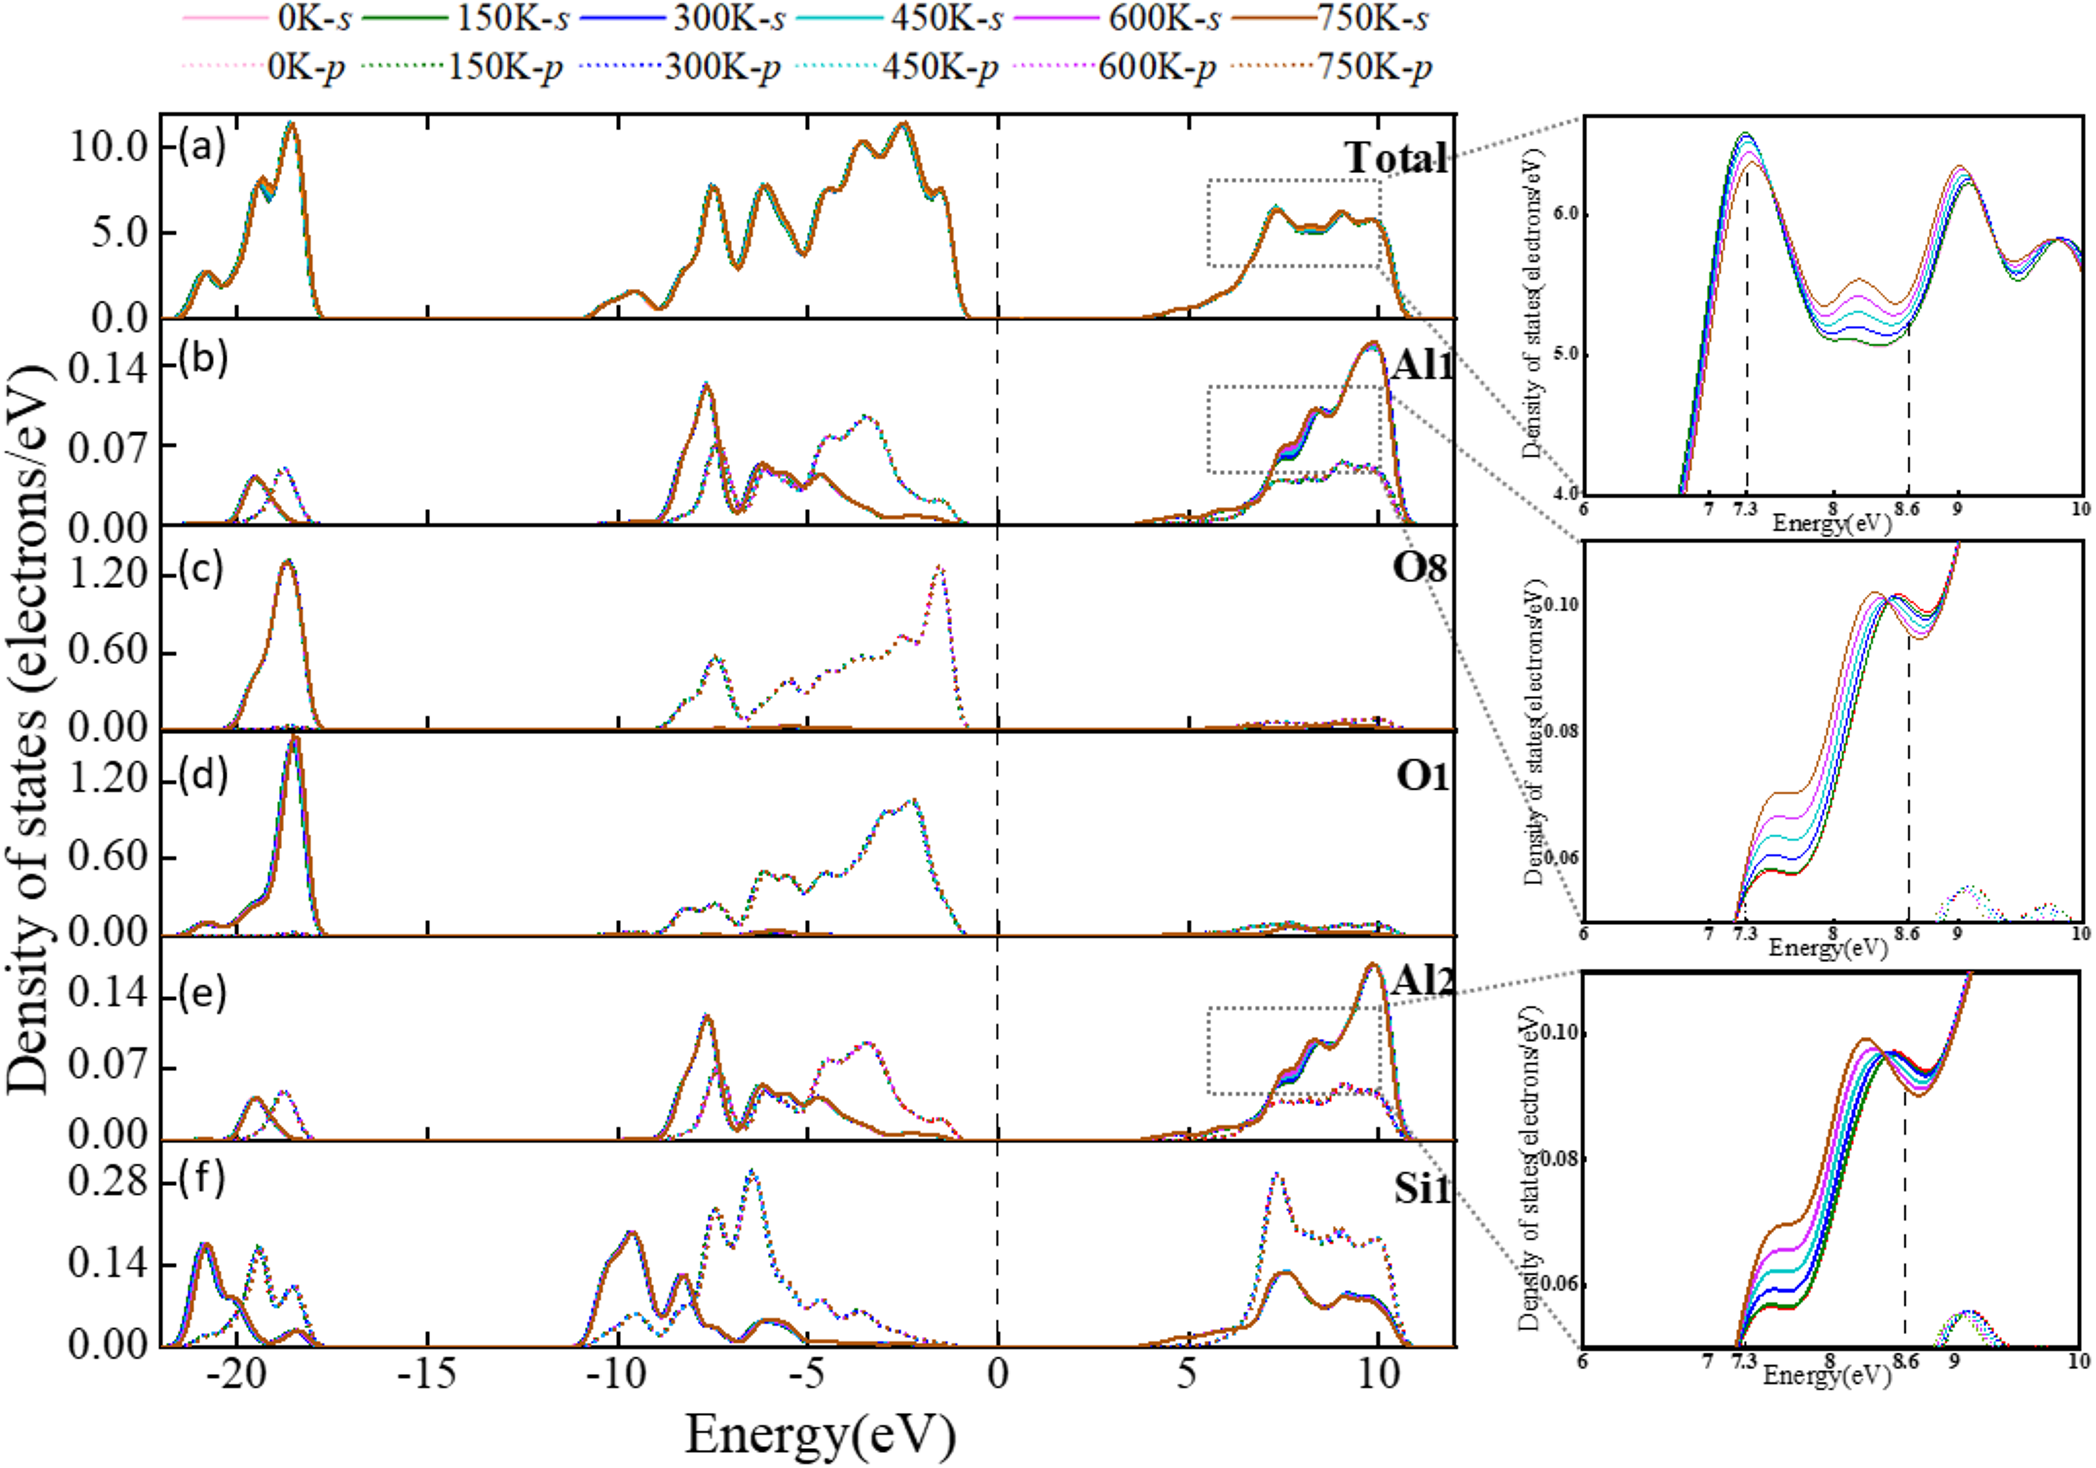
The total density of states (TDOS) and partial density of states (PDOS) of kaolinite over the temperature range of 0–750 K are plotted in Fig. 5. Within the energy interval from –22.3 to 11.4 eV, the Si atoms of kaolinite exhibited significant s–p orbital hybridization across all temperatures, indicating the persistent covalent character of the Si–O bonds under varying thermal conditions. Furthermore, both the TDOS and PDOS of kaolinite displayed minimal variation with increasing temperature in the valence band regions of –22.3 to –17.2 eV and –11.7 to –0.1 eV, as shown in Fig. 5a–f. However, within the conduction band between 7.3 and 8.6 eV, the TDOS and PDOS corresponding to the s orbitals of Al increased noticeably with temperature, whereas the PDOS of Si and O atoms showed only minor changes. These results indicate that elevated temperatures promote the excitation of a greater number of charge carriers into the conduction band of kaolinite, with these transitions primarily involving the s orbitals of Al.
The TDOS and PDOS of kaolinite at various temperatures: (a) TDOS, (b) Al1, (c) O8, (d) O1, (e) Al2 and (f) Si1.

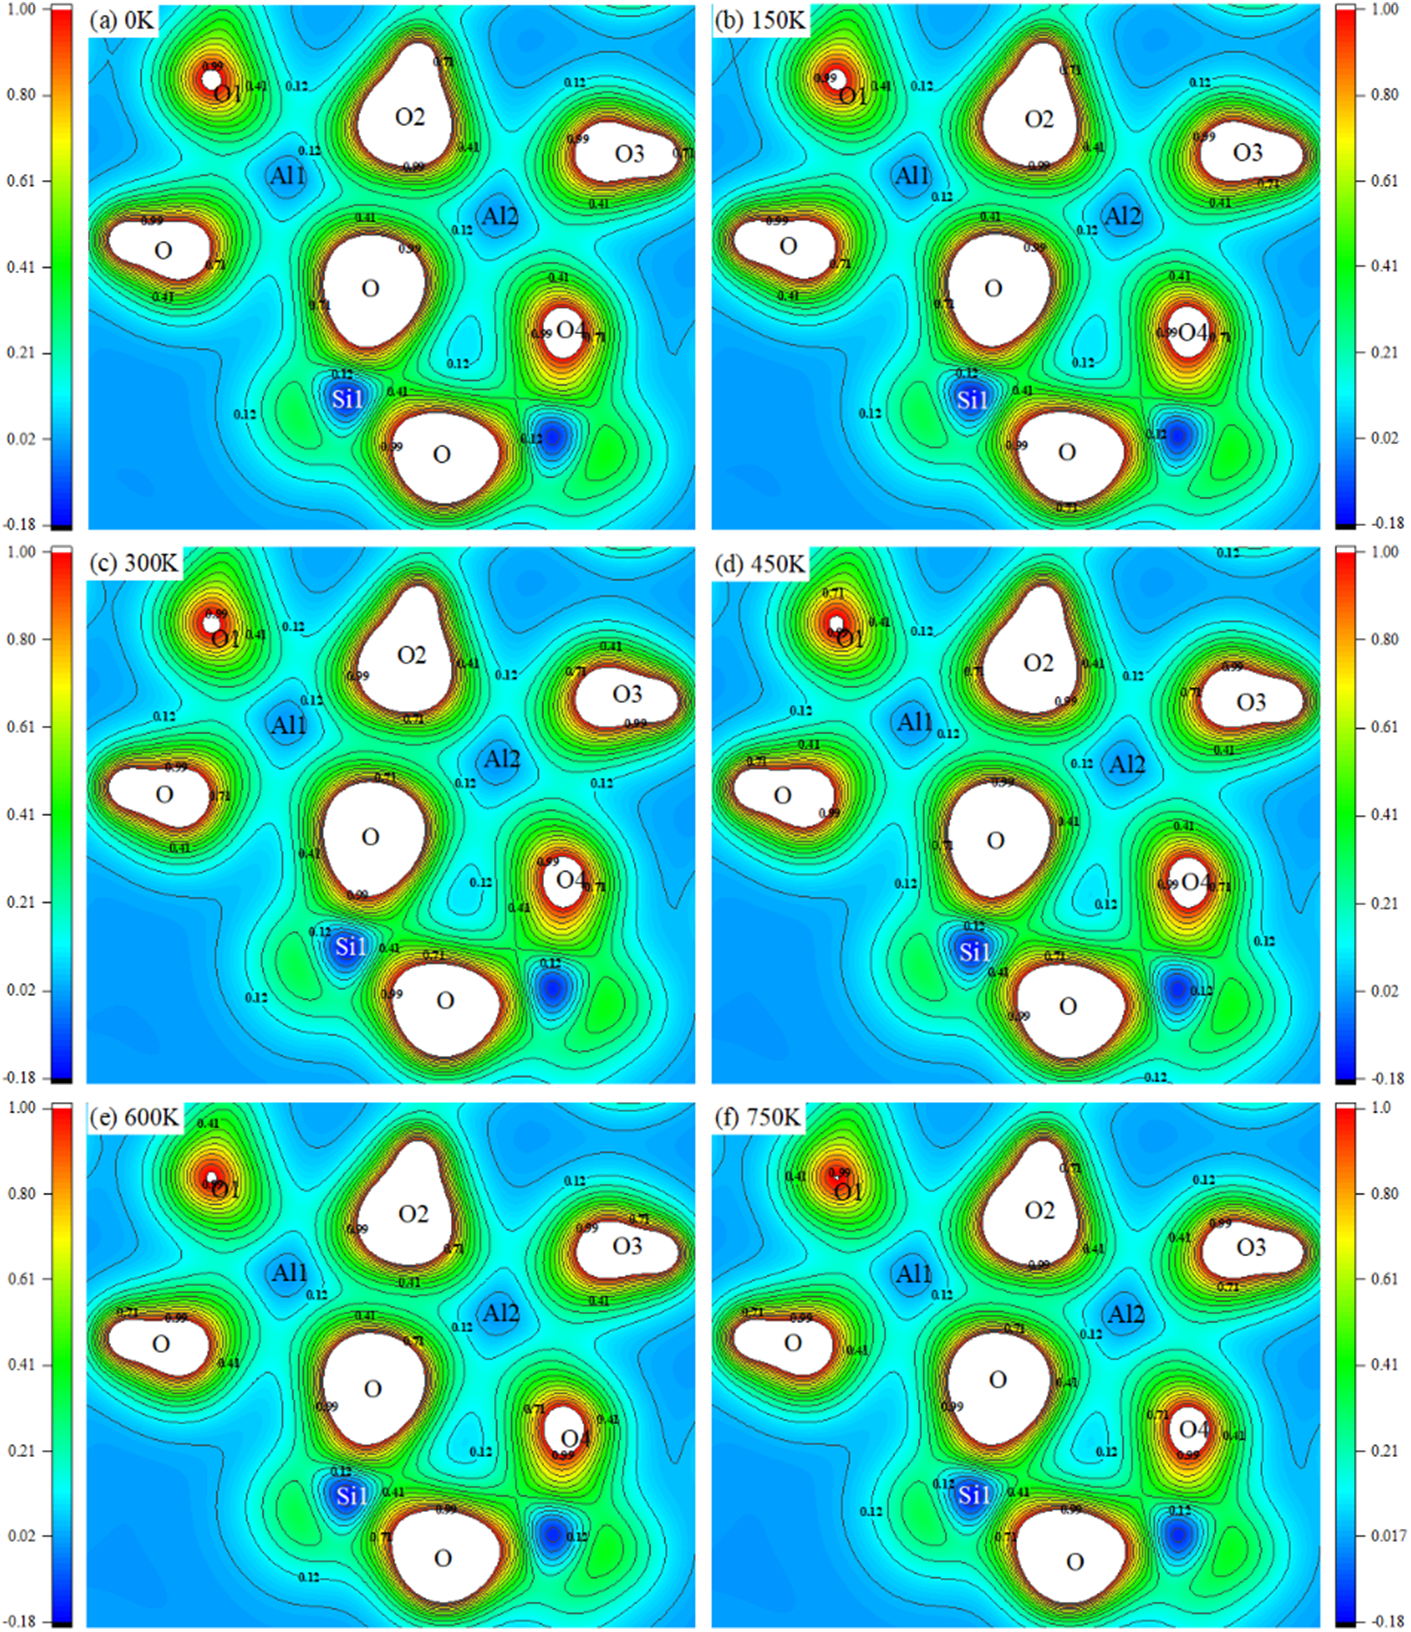
To further investigate the effect of temperature on the electronic structure of kaolinite, the two-dimensional charge-density distribution of the Al–Si–Al plane centred on an oxygen atom was analysed, as presented in Fig. 6. The Al–O bonds exhibited predominantly ionic characteristics, whereas the Si–O bonds displayed a covalent character. As illustrated in Fig. 6, no significant changes in the nature of these chemical bonds were observed with increasing temperature.
The charge-density distribution of kaolinite at various temperatures: (a) 0 K, (b) 150 K, (c) 300 K, (d) 450 K, (e) 600 K and (f) 750 K.

In kaolinite, the majority of electrons were localized around highly electronegative oxygen atoms. Specifically, O1, O2, O3 and O4 corresponded to oxygen atoms within hydroxyl groups. The hydroxyl groups associated with O1, O2 and O3 were orientated along the c-axis and were situated on the external surface of kaolinite, whereas the hydroxyl group involving O4 was located within the internal crystal structure along the a-axis. Although O1, O2, O3 and O4 all belonged to hydroxyl oxygen atoms, only the electron density around O1 exhibited a decreasing trend with increasing temperature, whereas the charge density around the other oxygen atoms remained relatively stable.
Calculation of the mechanical properties of kaolinite at various temperatures
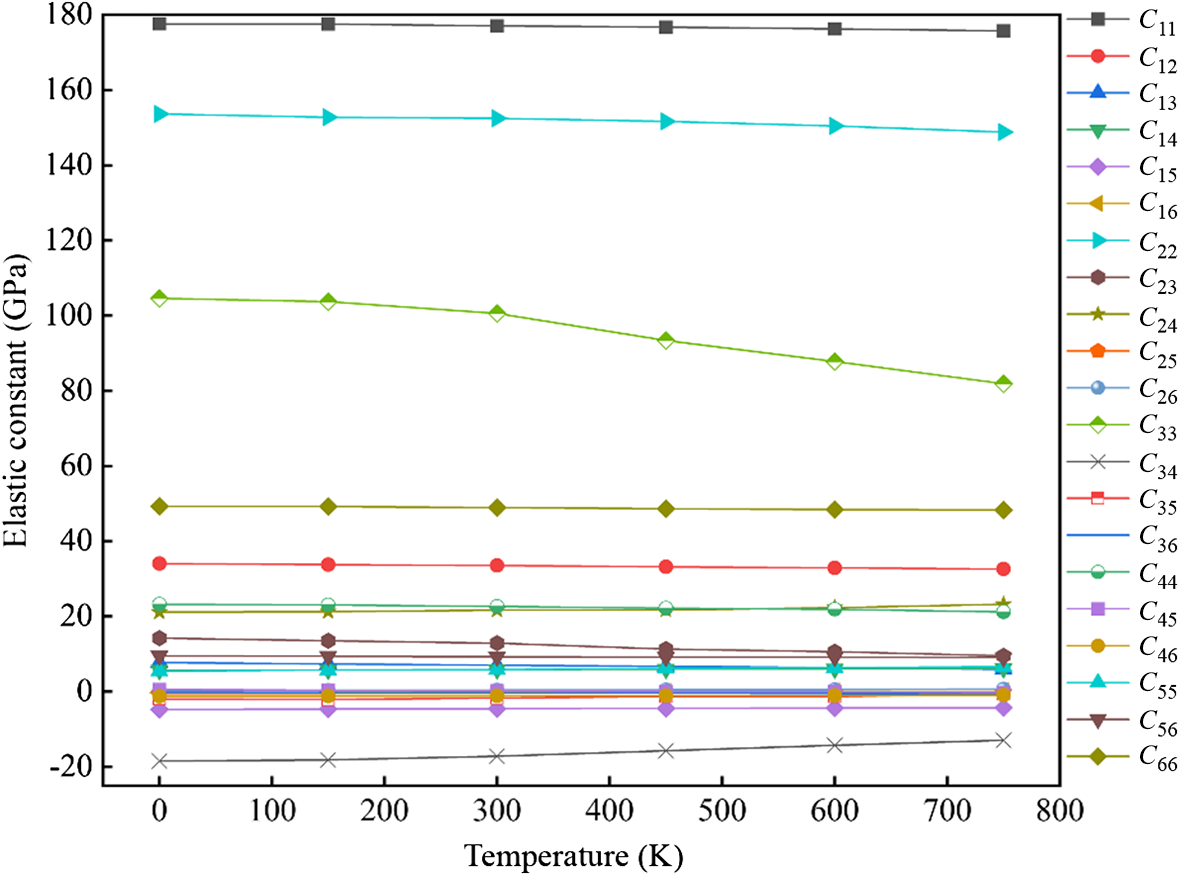
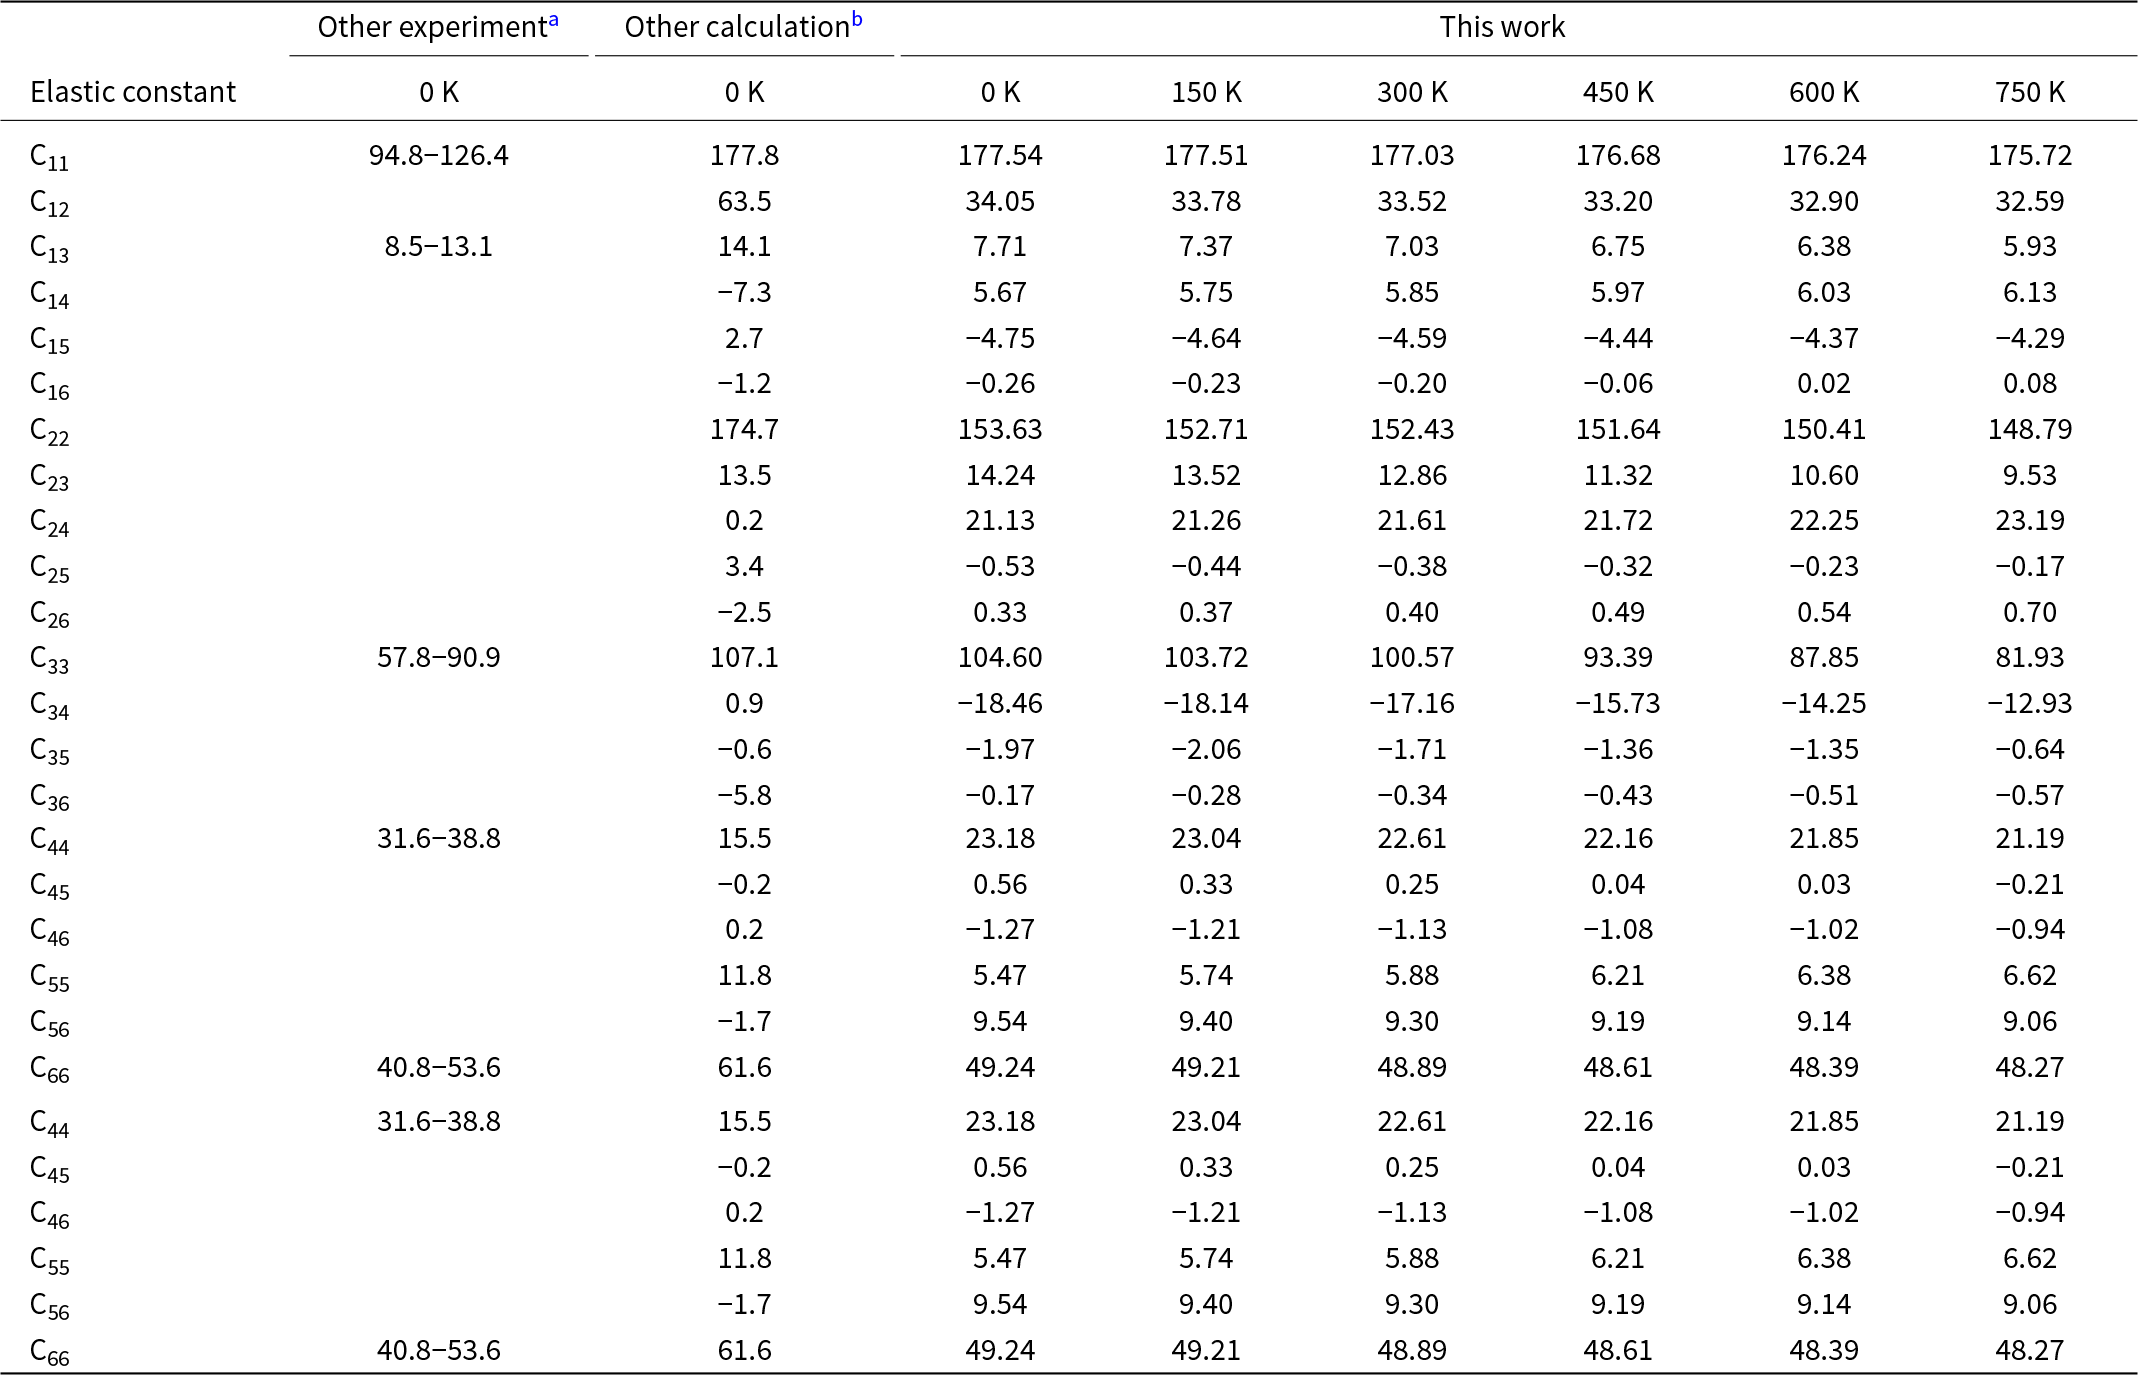
The elastic stiffness constant (Cij) is a fundamental parameter for describing the mechanical properties of crystals materials. For kaolinite, which possesses a triclinic crystal structure, all 21 independent Cij constants were calculated via a Taylor expansion of the total energy with respect to a small strain of the lattice. The calculated elastic constants of kaolinite at various temperatures, along with other experimental values (Wenk et al., Reference Wenk, Voltolini, Mazurek, Van Loon and Vinsot2008) and theoretical calculation results (Scholtzová & Tunega, Reference Scholtzová and Tunega2020), are listed in Table 2. In the temperature range of 0–750 K, all values of the elastic constants satisfied the Born–Huang criterion, confirming the mechanical stability of the kaolinite crystal structure across the investigated temperature range. Figure 7 clearly depicts the trend of the elastic constants of kaolinite with increasing temperature. As shown in Fig. 7, the elastic constant C33 exhibited the most pronounced temperature dependence, whereas the other elastic constants remained nearly invariant. As the Al–O octahedra in kaolinite are connected to adjacent Si–O tetrahedra primarily via hydrogen bonding, these results indicate that temperature exerts a considerably stronger influence on the hydrogen bonds than on the Al–O and Si–O bonds within the crystal structure.
Elastic constants as a function of temperature for kaolinite.

Calculated elastic constants of kaolinite at various temperatures.

a Wenk et al. (Reference Wenk, Voltolini, Mazurek, Van Loon and Vinsot2008).
b Scholtzová & Tunega (Reference Scholtzová and Tunega2020).
Between 0 and 300 K, the value of C33 decreased from 104.60 to 100.57 GPa, corresponding to a reduction of 3.85%. When temperature was above 300 K, the rate of decline in C33 increased significantly, dropping from 100.57 GPa at 300 K to 81.93 GPa at 750 K, representing a total reduction of 18.53%. These results indicate 300 K as a critical threshold in the thermodynamic properties of kaolinite. At temperatures below 300 K, the influence of thermal expansion on the mechanical properties of kaolinite was relatively minor, which can be attributed to the limited lattice vibration at low temperatures, leading to the gradual variation in the elastic constants. In contrast, once the temperature exceeded 300 K, increased lattice vibration and thermal expansion effects became more pronounced, which accelerated the change in the elastic constants. Furthermore, as shown in Fig. 7, throughout the temperature range from 0 to 750 K, the relationship C11 ˃ C22 ˃ C33 was consistently maintained, indicating that the stiffness along the c-axis was the lowest and that kaolinite was most susceptible to deformation in this direction. In addition, C66 remained larger than both C44 and C55 across the same temperature interval, indicating that the (001) plane possessed a greater resistance to shear deformation compared to the (100) and (010) planes, even under varying thermal conditions.
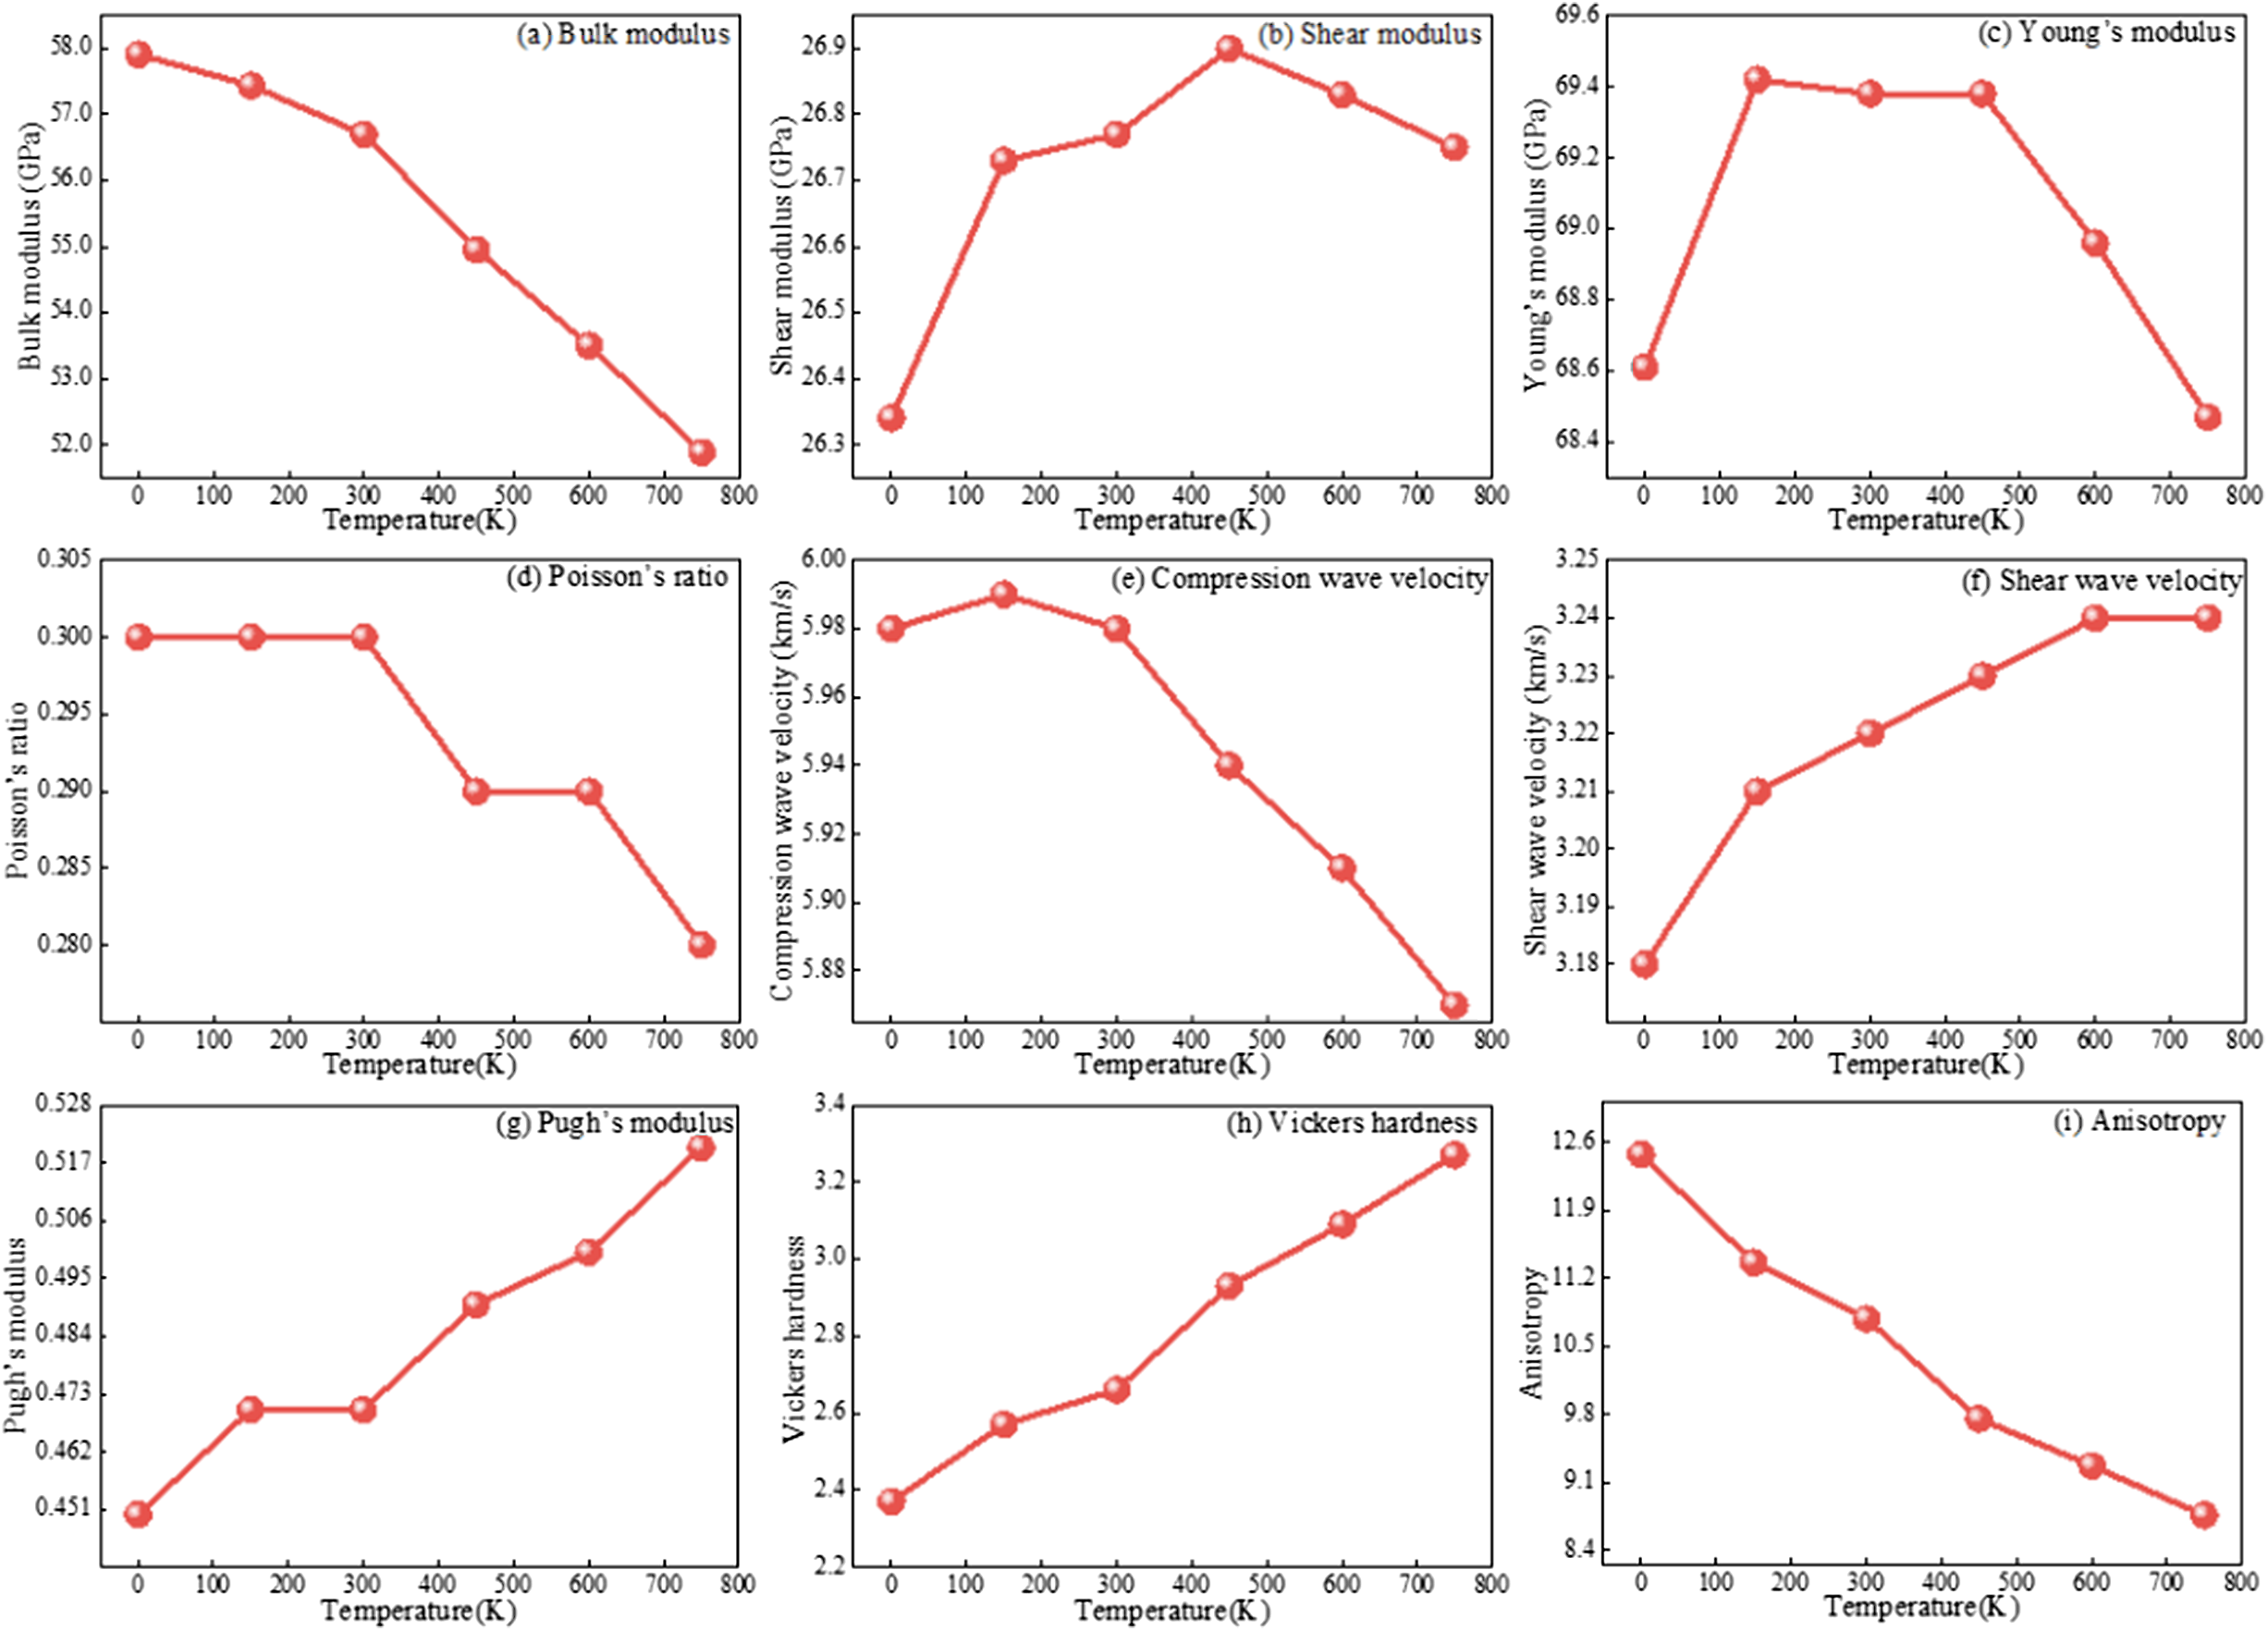
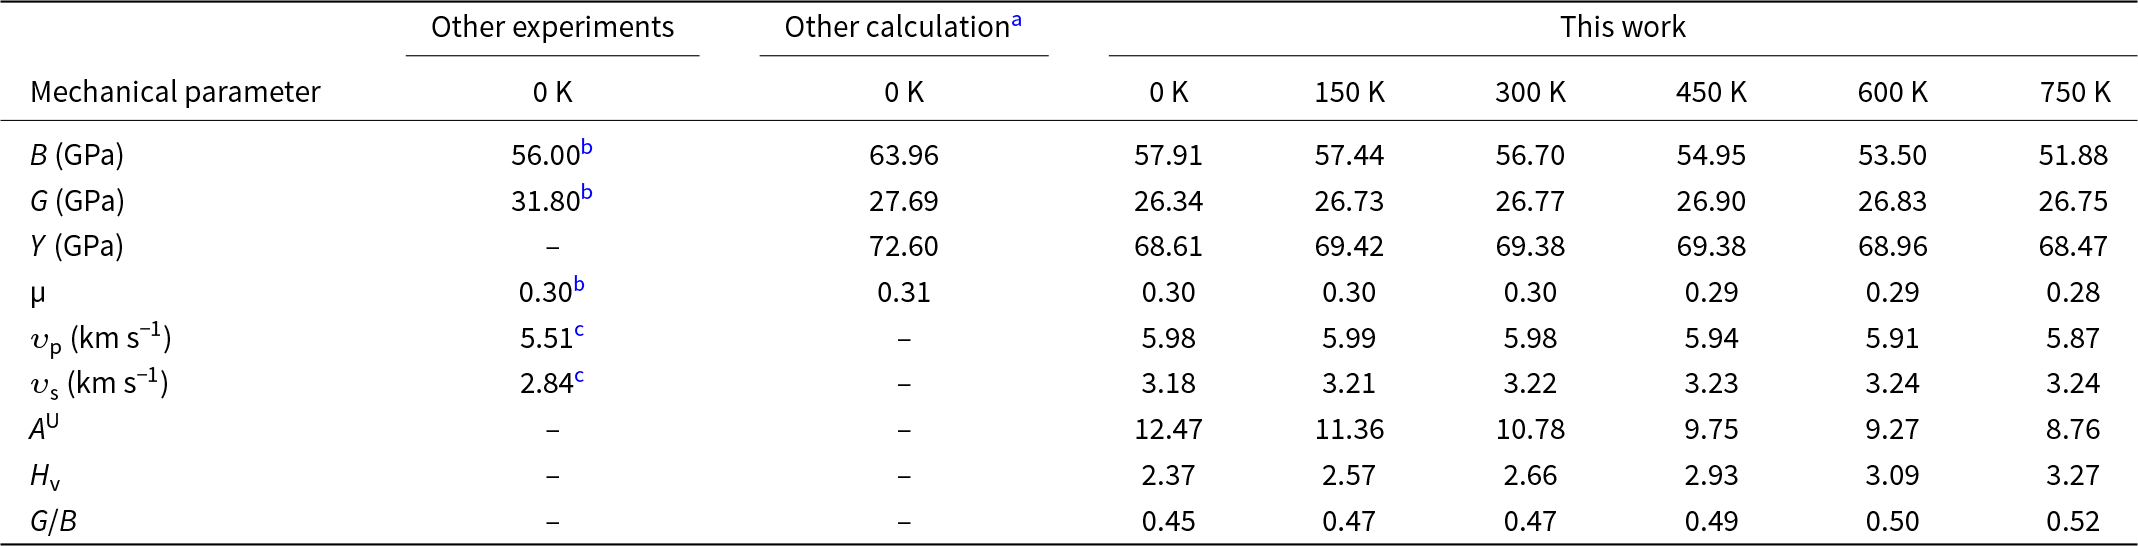
Table 3 summarizes the calculated mechanical parameters of kaolinite at various temperatures, together with experimental (Katahara, Reference Katahara1996; Wang et al., Reference Wang, Wang and Cates2001) and theoretical calculation (Zhang et al., Reference Zhang, Zheng, Wei, Diao and Yin2021) results from previous studies, and these data are also illustrated in Fig. 8a–i. Within the temperature range of 0–750 K, B of kaolinite decreased monotonically from 57.91 to 51.88 GPa, indicating a progressive weakening of the resistance of kaolinite to volume deformation with increasing temperature. In contrast, G exhibited a non-monotonic dependence on temperature. G increased from 26.34 GPa to a maximum 26.90 GPa, before decreasing to 26.75 GPa at higher temperatures, indicating that the resistance to shear deformation firstly strengthened and then weakened beyond ∼450 K. A similar non-monotonic trend of Y was observed, although its transition from increase to decrease occurred at a lower temperature of ∼150 K, which was smaller than the transition point of G at 450 K. In the temperature range of 0–750 K, B of kaolinite consistently exceeded G, indicating that kaolinite possesses a greater resistance to volumetric compression than to shear deformation. Figure 8d,i presents the temperature dependence of Poisson’s ratio µ and Pugh’s modulus ratio G/B of kaolinite. Poisson’s ratio µ exhibited a gradual decrease (from 0.30 to 0.28) with increasing temperature, whereas Pugh’s modulus ratio G/B showed an increasing trend from 0.45 to 0.52. These results indicate that the ductility of kaolinite decreases gradually across the temperature range of 0–750 K. This interpretation is further supported by the variation in Vickers hardness H v with temperature (Fig. 8h), which increased gradually from 2.37 to 3.27 H v with increasing temperature. In addition, the compressional-wave velocity υp and shear-wave velocity υs of kaolinite as functions of temperature are shown in Fig. 8e,f. The compressional-wave velocity initially increased slightly from 5.98 to 5.99 km s–1 and then decreased to 5.87 km s–1 with increasing temperature. In contrast, the shear-wave velocity increased from 3.18 to 3.24 km s–1 with increasing temperature, displaying a different trend from that of the compression-wave velocity.
Mechanical parameters as a function of temperature for kaolinite.

Mechanical parameters of kaolinite at various temperatures.

a Zhang et al. (Reference Zhang, Zheng, Wei, Diao and Yin2021).
b Katahara (Reference Katahara1996).
c Wang et al. (Reference Wang, Wang and Cates2001).
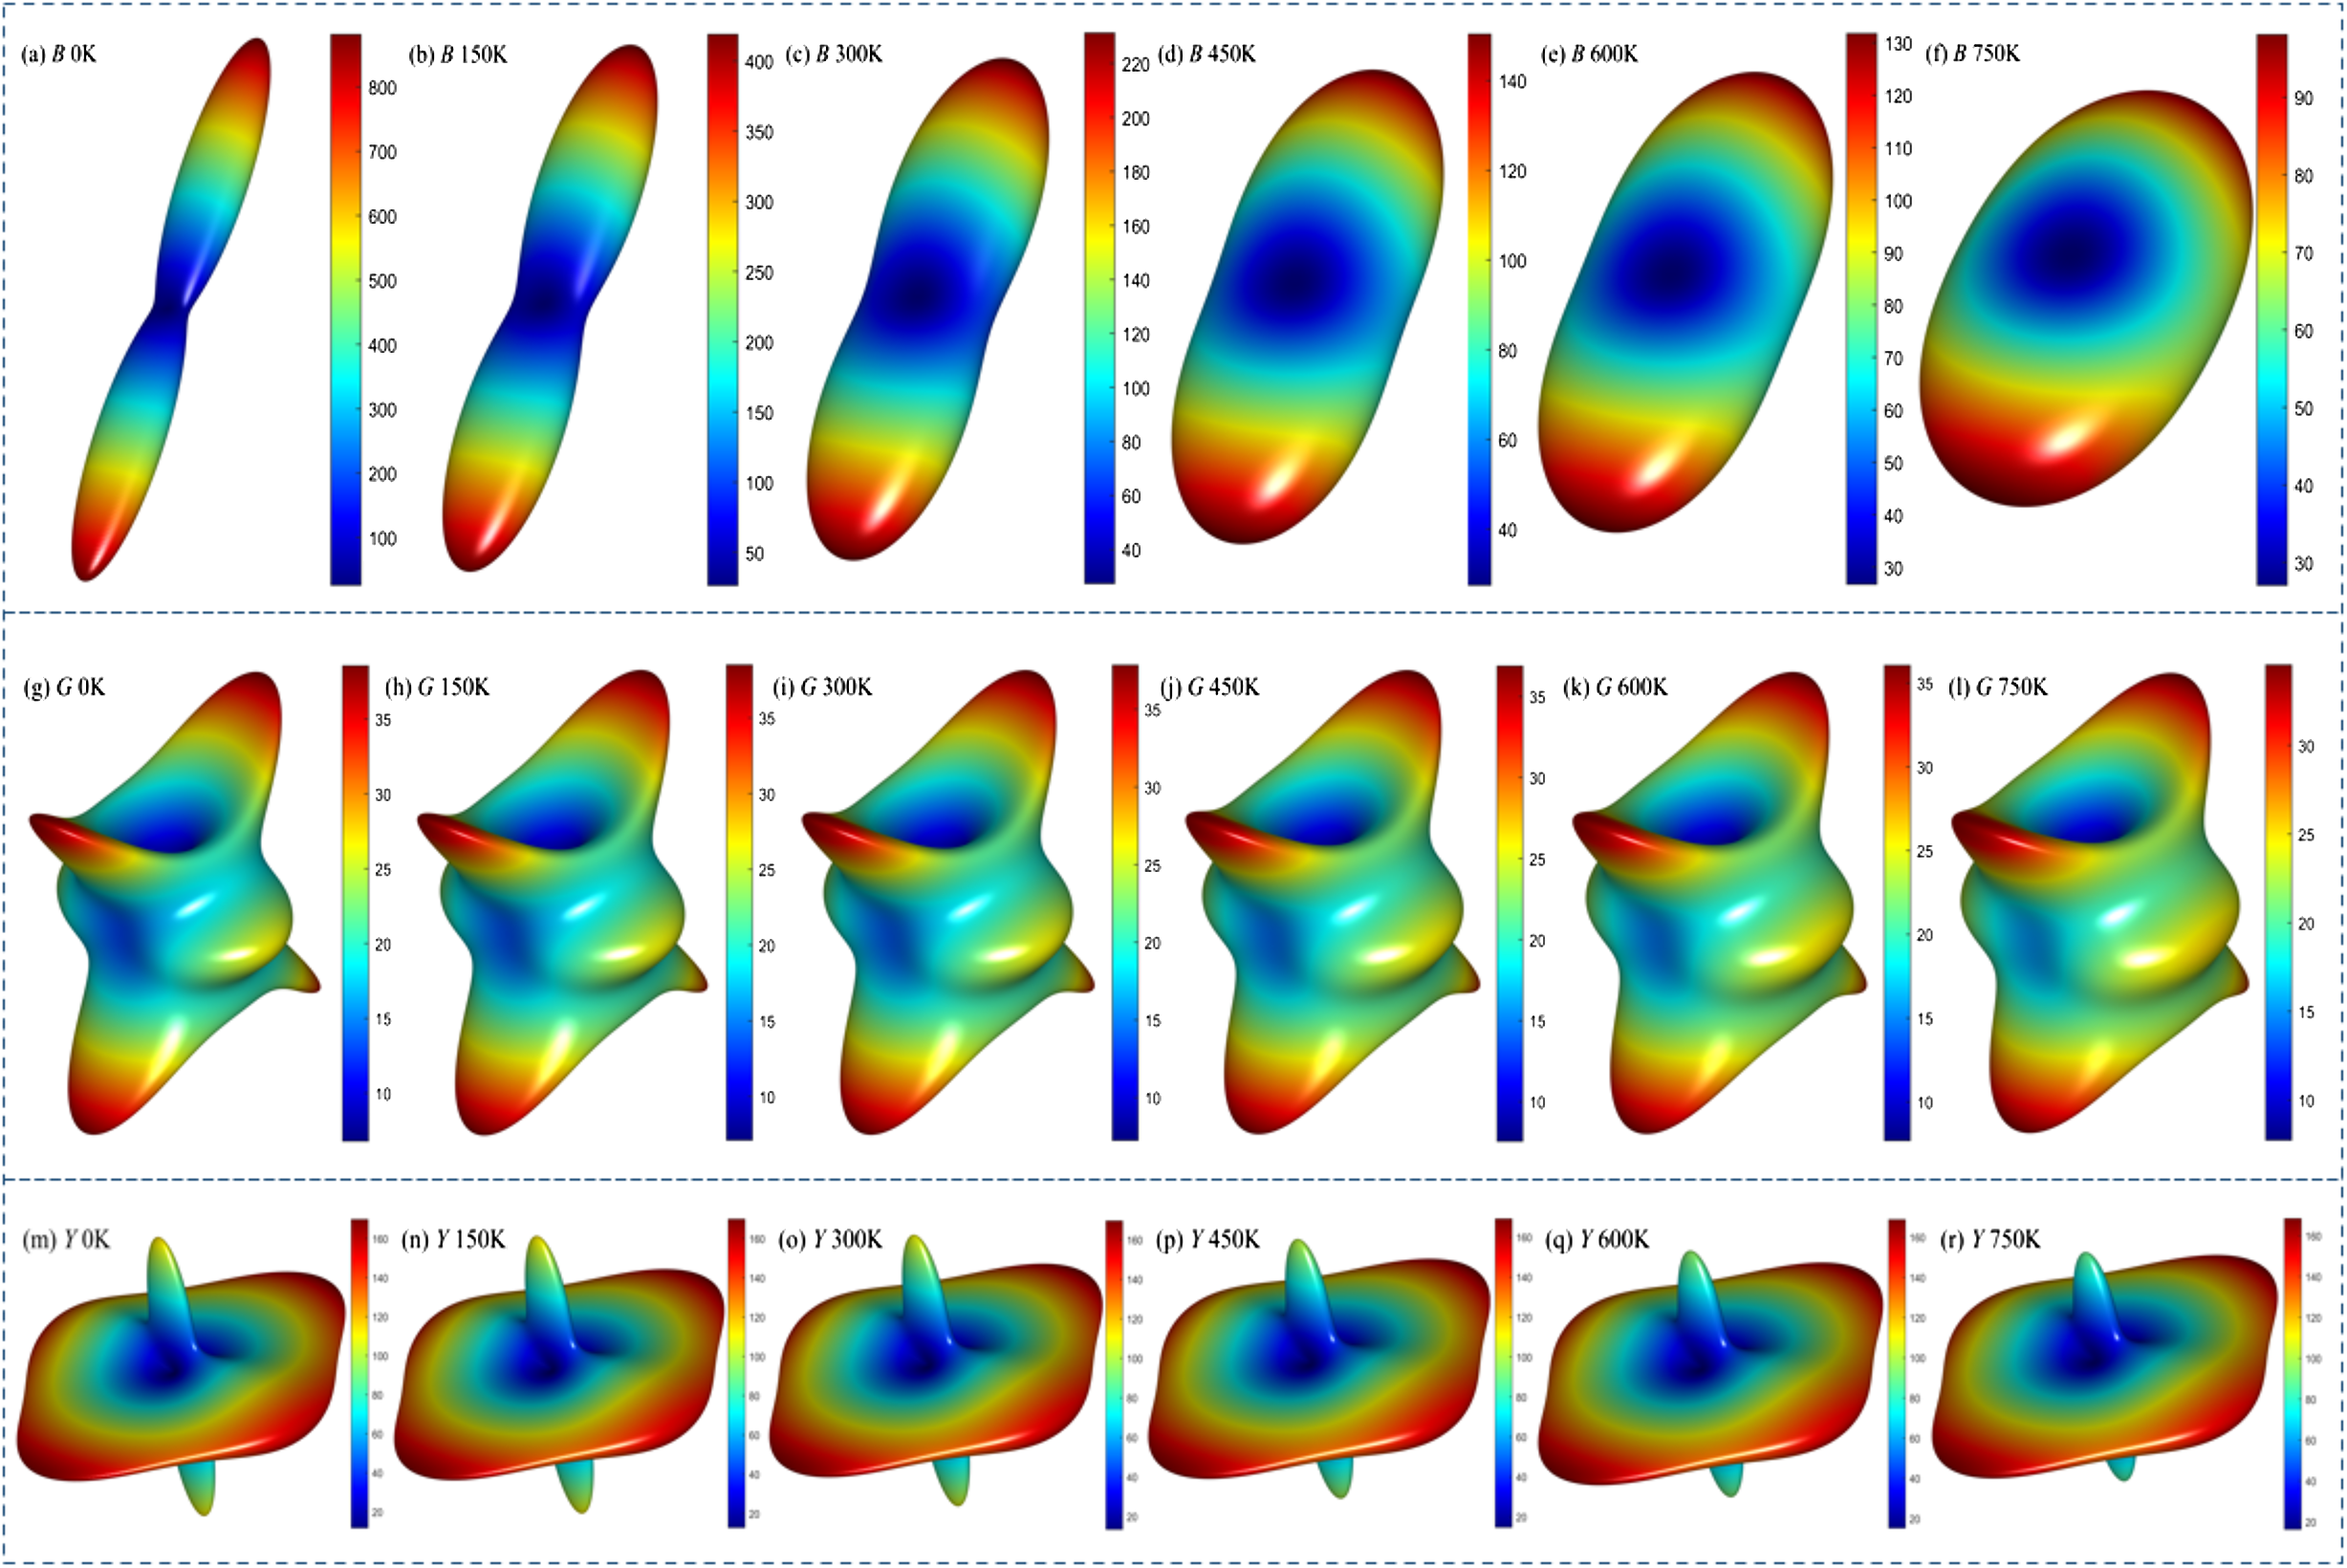
Following the analysis of the temperature dependence of the mechanical parameters of kaolinite, the anisotropic characteristics of kaolinite were examined. The universal anisotropy index A U, which quantifies the deviation from ideal isotropy (where A U = 0) in a symmetry-agnostic manner, reveals the magnitude of elastic anisotropy, with higher values indicating greater anisotropy. As plotted in Fig. 8i, the universal anisotropy index A U of kaolinite decreased markedly from 12.47 to 8.76 with increasing temperature, indicating a significant reduction in elastic anisotropy. Furthermore, the three-dimensional anisotropic representations of the B, G and Y of kaolinite at various temperatures, generated using ELASTICPOST software (Liao et al., 2018), are shown in Fig. 9. For an isotropic material, the three-dimensional anisotropy profile should ideally form a perfect sphere. The extent of deviation from a spherical shape reflects the degree of elastic anisotropy in the material.
The anisotropy of B of kaolinite decreased significantly with increasing temperature, as exhibited in Fig. 9a–f. In comparison, the anisotropies of the G (Fig. 9g–i) and Y (Fig. 9m–r) exhibited only minor reductions. These trends can be attributed to the dominant influence of the layered structure of kaolinite on the anisotropy of G and Y, which overshadowed the thermal effects. In contrast, the layered structure has a comparatively smaller effect on the anisotropy of B, meaning that B is more susceptible to temperature-induced changes.
Anisotropy of B, G and Y of kaolinite as a function of temperature.

Conclusions
This first-principles study investigated the effects of temperature (0–750 K) on the atomic structure, electronic structure and mechanical properties of kaolinite. The principal findings are summarized as follows.
With increasing temperature, the Al–O–Al bond angle increased, whereas the Al–O–Si bond angle decreased. This led to a slight decrease in the interlayer spacing between the Si–O tetrahedral and Al–O octahedral sheets. In addition, the lattice parameters (a, b, c), the angle α (between the b- and c-axes) and the volume V all increased. The most pronounced expansion occurred along the c-axis, indicating that temperature exerts a stronger influence on the interlayer hydrogen bonds than on the covalent bonds (Al–O, Si–O, H–O) within the layers.
The band gap of kaolinite decreased from 5.13 to 5.06 eV with increasing temperature from 0 to 750 K, implying a reduction in electrical insulation. Analysis of the charge-density maps revealed that this decrease can be primarily attributed to the electronic transitions from the Al-3s orbitals in the valence band to the conduction band.
Among the elastic constants, C33 exhibited the most significant temperature dependence. B decreased monotonically with temperature, indicating a diminished resistance to volume deformation. In contrast, G and Y initially increased before gradually decreasing. Regarding anisotropy, B anisotropy was markedly reduced with increasing temperature, whereas the anisotropies of G and Y decreased only slightly with increasing temperature.
These findings offer important insights into the temperature-dependent behaviour of kaolinite, and they are expected to inform and guide subsequent theoretical and experimental research.
Acknowledgements
The authors thank the State Key Laboratory for Tunnel Engineering, China University of Mining and Technology – Beijing and School of Mechanics & Civil Engineering, China University of Mining and Technology – Beijing.
Financial support
This work was supported by the National Natural Science Foundation of China (grant number 41702317) and the Fundamental Research Funds for the Central Universities (2023ZKPYSB01).
Competing interests
The authors declare that they have no known competing financial interests or personal relationships that could have appeared to influence the work reported in this paper.