



No CrossRef data available.
The Valencian revival: Why usage lags behind competence
Published online by Cambridge University Press: 20 February 2004
Abstract
This study of bilingual competence, linguistic attitudes, and language choice among secondary students in Valencia explores the effects of linguistic normalization since the removal of Franco's repressive measures against the Valencian language variety. The introduction of Valencian into the educational system and other measures have substantially reversed the decline of levels of competence and expanded its domains of usage but have only marginally decreased the dominance of Castilian. A survey of attitudes toward Valencian, Catalan (Barcelona variety) and Castilian reveals two distinct groups of patterns. One ascribes status and integrative value chiefly to Castilian, the other to Valencian and Catalan. Identifying the students manifesting the variants of these patterns according to socio-demographic, ideological, and behavioral factors shows how the current political dynamic between progressive nationalist forces and anti-Catalanist, Castilian-speaking forces is reflected in ongoing attitudinal divergence.Research was supported in part by grants from the Natural Sciences and Engineering Research Council of Canada. Sankoff is a Fellow of the Canadian Institute for Advanced Research and holds the Canada Research Chair in Mathematical Genomics.
Information
- Type
- Research Article
- Information
- Copyright
- © 2004 Cambridge University Press
INTRODUCTION
Attempts to undo the effects of 40 years (since 1939) of linguistic suppression under Francisco Franco, in those parts of Spain where languages other than Castilian are traditional, have had mixed results. The case of Valencia – one of the six out of seventeen “autonomous communities” constituting the Spanish state1
Below the state (Spain) and the community (Valencia), levels of political and administrative organization include the province (three in the Autonomous Community of Valencia), the comarca ‘county’ (34 in the Community), and the municipality (541 in the Community, of which the city of Valencia is the largest).
Policies meant to halt or even reverse the process of shift to Castilian have resulted in increased competence in Valencian, most dramatically among the school-age population. However, though Valencian is now used in domains from which it was previously excluded, such as government and the educational system, its overall rate of use does not seem to have kept pace with gains in competence. The main goal of this study is to document and explain this divergence, drawing on diverse historical and current data on competence, usage, and language attitudes. Because of the complexity of the political and social context, we will tailor a number of quantitative analyses and displays to these data in order to tease out particular relations, groupings, and connections, rather than risk losing such details via a standard global multivariate analysis.
Language planning in Valencia is highly controversial and has been complicated by differing attitudes toward the future of Valencian at the levels of municipal and Community (i.e., the autonomous community) governments. The Community where Valencian is widely used implemented a number of measures favoring increased usage of Valencian instead of Castilian during the incumbency of a progressive government until 1995, whereas the municipality, where Valencian is much less frequently used, has consistently reinforced the hegemony of Castilian as the majority language of Spain and restricts its promotion of Valencian to its defense against perceived influences from Catalan (the “secessionist” position). As a result, the two levels have adopted contradictory measures. We will not explore these policies in any detail here, but will focus on the effects of this political struggle on the attitudes and behavior of the youth of Valencia.
OUTLINE
The clearest indicators of the current state of a process of language shift include data on language use by different segments of society in a full range of contexts or domains. To understand the forces that have produced this result, however, and to attempt to predict future outcomes, we require some idea of how these forces interact in motivating speakers to use one language rather than another, and how the social context is evolving. In this article, we report on the post-Franco process of linguistic “normalization”2
Aracil 1965 introduced the concept of “linguistic normalization” into Catalan sociolinguistics. It is essentially equivalent to “language planning,” but it pertains to the specific context of a society-wide project (i.e., both motivating and transcending governmental initiatives) to undo the injustice of forced linguistic shift inflicted during a preceding era. Note that this term was introduced during the struggle against Franco for political, cultural, and linguistic freedoms.
We will first sketch the historical background of the current linguistic context, stressing the particular situation of Valencia among the Catalan-speaking areas with respect to the political and economic influences of the center (Madrid and the Castilian-speaking regions). We will describe the changes during the dictatorship and the attempts over 25 years to redress them, as well as the emergence of a movement for the linguistic “secession” of Valencia in reaction to Catalan political and cultural nationalism.
Our attitude study is based on reactions by subjects to recordings of a number of individuals, each speaking a specific variety of Castilian, Valencian, or Catalan. To control for the effects of different speakers, we borrowed from the matched guise technique by having some of the speakers perform in two varieties. This showed that subjects respond to the linguistic variety and not to personal factors (voice quality, timbre, personality, etc.).
The sample of high school students from the city of Valencia and the nearby town of Xàtiva was thoroughly characterized, both with regard to socioeconomic, demographic, cultural and political factors and in terms of language usage. This allows us first to assess the pertinence of this sample against census and other comprehensive data available from the city of Valencia and the larger community. After validation for consistency and coherence, informants' suggestions about utterances appropriate to diverse interactions help us pinpoint the interactional contexts that are the locus of socially determined language choice. This involves a new approach to the methodology of implicational scaling.
The literature on linguistic attitudes mediating language choice has focused on the relative status of varieties and on their integrative function, and this is particularly true in the Valencian context. We will use our comprehensive data on each student to evaluate the roles of many demographic, political, economic, cultural, and educational factors in determining these attitudes. This type of analysis, however, does not reveal whether the factors favoring one variety or another combine independently, or co-occur in a sizable proportion of the sample, resulting in emergent subgroups with their own coherent and distinctive attitudinal patterns. To investigate the latter possibility, we undertook an experiment in the classification of the speakers according to their judgments of status and integrative value of Valencian, Catalan, and Castilian, and we show that a small number of such patterns suffice to account for a large majority of the subjects.
The results of these analyses allow us to attribute the current status of the normalization process in Valencia to specific crosscutting demographic, socioeconomic, political, and educational forces acting in the educational system and the wider society. They also point to longer-term outcomes as a function of political and educational choices to be made in the near future.
BACKGROUND
The 1978 constitution divides Spain, formerly centralized both politically and linguistically, into seventeen autonomous communities, six of which (the Basque Country, Navarre, Galicia, Catalonia, the Balearic Islands, and the Country of Valencia) have their own official languages alongside Castilian, the official language of the Spanish state. Historically, Valencian (a variety of Catalan) was the language spoken in Valencia, though Castilian had become increasingly prevalent in some sectors and regions even before the dictatorship. Catalan also has official status in Catalonia, the Balearic Islands, and the Principality of Andorra, and it is spoken as well in the eastern part of Aragon, in parts of the French Pyrenees, and in the city of L'Alguer in Sardinia (cf. Sabater 1984 and Vallverdú 1984).
Valencia is the locus of two different conflicts whose points of reference are external to the community itself. On one hand, there is the conflict that pits Valencian against Castilian – where two genuinely different, mutually unintelligible languages are involved, with centuries-old political, cultural, linguistic, and economic roots. The Spanish state, or at least its political and economic elite, has been a party to this conflict, as have the Castilian-speaking and Valencian-speaking populations of Valencia. On the other hand, there is the confrontation between Valencian and Catalan, two very similar varieties. This conflict is scarcely 30 years old and has few substantive historical correlates. The parties to the latter conflict are essentially all within Valencia, although they refer to ongoing social and political processes in Catalonia.
Ninyoles (1972, 1995) distinguishes three stages in the “minorization”3
“Minorization” is a process whereby the vitality of a language is reduced, often quantitatively through language shift and demographic processes, but essentially qualitatively through the narrowing of its domains of usage and through its social and political subordination to another language. A minority language is thus not necessarily “minorized,” and vice versa.
The factors that today favor further replacement of Valencian by Castilian mostly originate in this long period of Francoism. The interruption of intergenerational transmission of Valencian is a crucial fact in the major cities, such as Alicante and Valencia: irreversible in the case of Alicante (Montoya 1996), but perhaps reversible in Valencia. This period also saw an increased association of Valencian with rural and familial contexts, as demonstrated by Ros 1982 in her study of linguistic attitudes. To use Valencian was socially stigmatized, and its prohibition in formal contexts left Castilian the only language of prestige, formality, and wide utility. The disappearance of monolingual speakers of Valencian, a consequence of obligatory education in Castilian and exclusive use of Castilian in the audio-visual mass media, gave rise to asymmetric bilingualism and to illiteracy of Valencian speakers in their own language. The official language of the Spanish state even infiltrated private communications, and slogans such as “Let's speak Christian” – i.e., Castilian – reinforced existing tendencies of assimilation to Castilian.
It was in the immediate post-Franco era, when the future political and linguistic organization of Spain was being decided, that the notion of a conflict between the Valencian and Catalan “languages” became a serious political issue. Largely as a result of geographically based differences in terminology (Catalan, Valencian, Majorcan, etc.) for denoting a single, fairly homogeneous linguistic entity, as well as of a very small number of bona-fide phonological, morphological, and lexical distinctions, there had for centuries been calls for vigilance against undue influence from Catalan, occasional grammar-writing projects, and worries about territorial annexation by Catalonia. But in the 1960s, this was made into a major political issue. The Valencian dominant class, thoroughly Castilianized and with strong ties to rightist, centrist, and even Francoist political elements, was confronted by the model of a Catalonia dominated by progressive social forces and the full restoration of the Catalan language, and by a Valencian nationalism celebrating the common interests of the Catalan-speaking peoples. Seizing upon the linguistic issue provided a way of attacking the ascendancy of the Valencian left. This gave rise to a right-wing “secessionist,” anti-Catalanist movement whose discourse included the dangers of political dependency or even annexation of Valencia to Catalonia, as well as the threat to the Valencian language from the hegemony of Catalan. The effect of this movement was to divert attention from the question of linguistic normalization: the process of remedying the social and linguistic damage caused by the forcible imposition of Castilian on the Valencian population.
These developments set the stage for the “Battle of Valencia” (Mollà & Mira 1986) in October 1979 in the city of Valencia, during its first Social Democrat mayoralty. During the time in which the Statute of Autonomy of Valencia, including key linguistic provisions, was scheduled to be drafted, rightist politicians, anti-Catalan action groups, and elements of the media mounted a concerted campaign making effective use of the symbolic triple: the flag with a daub of blue harking back to a traditional flag of the city of Valencia, the original beachhead of Castilian; national status (regne ‘kingdom’ rather than país ‘country’); and language free of “Catalanisms”. The net effects of this campaign were to weaken the Statute of Autonomy, particularly by leaving its linguistic provisions vague, to crystallize the anti-Catalan movement in a right-wing political party and in a “Royal Society for Valencian Culture,” and to set up a competing set of norms4
The secessionist norms are based largely on the apitxat, the variety spoken in the city of Valencia and surrounding counties (Horta, Camp de Morvedre, and Ribera Alta). One of the most noticeable phonetic characteristics is the devoicing of alveo-palatal consonants (sibilants): voiced palatal affricate

; voiced alveolar affricate /dz/ > /ts/ and voiced alveolar fricative /z/ > /s/. These norms thus stipulate writing albarchina for albargina, formache for formatge, etc., adapting the Castilian orthography. Other characteristics include the complete absence of written diacritics and the introduction of numerous Castilianisms.
This division originated in the conquest by the Catalan-Aragon confederation in the 13th century (the Catalans settling on the coast, the Aragonese in the interior). In the 14th century, two additional Castilian-speaking counties were transferred from Castile: Plana d'Utiel and Alt Vinalopo.
The policies meant to normalize the status of the language have been monitored in both government and independent studies. As we shall see, comparison of the linguistic censuses of 1986 and 1991 reveals gains in all measures of competence in Valencian, particularly among the school-age population. As for actual usage, surveys made in Valencian-speaking regions by the Council for Culture and Education of the Valencian Generalitat in 1989, 1992, and 1995 show a slight increase in the use of Valencian. There also has been a series of scholarly studies attempting to tap the relevant attitudinal variables in order to explain ongoing changes and predict future tendencies. These, as well as the government studies, suggest an increase in favorable opinions of Valencian and of extensions of the domains of its use.
COMPETENCE AND USAGE
Evolution of competence
The data for studying the evolution of written and oral competence come from the linguistic censuses of the city of Valencia in 1986, 1991, and 1996 (CCE 1989, IVE 1994, Ajuntament de València 1998). Data for the entire autonomous community are available for 1986 and 1991 only. Though some regions show distinctly higher rates of competence than the city, the overall trends are consistent.
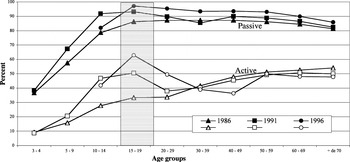
From Figure 1, we see that the proportion of the population who understand Valencian is roughly double the proportion who can speak it. The rate of passive competence has increased somewhat over the ten years in all age groups, so that the vast majority of adults and secondary students claim to understand the language. On the other hand, the degree of active competence has increased dramatically only in the younger age groups. This can be explained by the introduction of Valencian into the educational system. From Figure 1, we can infer that the first language of about 90% of the speakers is Castilian; these speakers may acquire some understanding of Valencian in the home context, but the main increase occurs in their school years.

Evolution of the degree of passive and active oral competence in the city of Valencia. Group aged 15–19 highlighted.
Evolution of usage
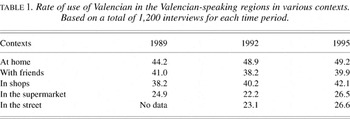
Usage surveys were carried out in 1989, 1992, and 1995 by the Cultural Council of the Generalitat of Valencia, which sampled residents of Valencian-speaking regions over 15 years old (CCE 1992, 1995). Table 1 shows self-reports of the use of Valencian (always or usually) rather than Castilian in various contexts. The proportional increase in the number of people using Valencian ranges from 6% to 15%, with the exception of “with friends,” where it has fluctuated only slightly over the period. The use of Valencian in public places, however – including “in the street” and “in the supermarket” – remains about half of what it is in more individualized contexts such as “at home,” “with friends,” and in small, owner-operated shops.
Rate of use of Valencian in the Valencian-speaking regions in various contexts. Based on a total of 1,200 interviews for each time period.

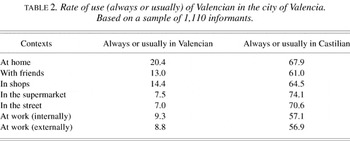
These results are the aggregate of all Valencian-speaking regions. The trend in the city of Valencia by itself cannot be directly estimated because we have data only from 1993 (CCE 1993), but two facts are clear (see Table 2). First, rates of Valencian use in the city are one-third to one-half the rates in the Community as a whole. Second, the distinction between public and individualized contexts in Table 1 is paralleled exactly in the city, as shown in Table 2.
Rate of use (always or usually) of Valencian in the city of Valencia. Based on a sample of 1,110 informants.

Finally, we contrast the degree of active competence in oral Valencian shown in Figure 1, ranging from 40% to 50% of the population of the city, with the much lower rates of usage shown in Table 2, 7–20% depending on the context. To understand this shortfall in usage, we collected and analyzed the data described in the following subsection and below.
Domains of usage
To obtain data on language choice, we focused on 16 different situations and contexts: institutions including the hospital, the secretariat of the high school, the Tourism Office, the Registry of Associations, and the Valencian Institute of Youth; other public places such as a pub, a supermarket, a bank, and interactions with passersby on the street in Barcelona and Valencia; and more individualized and familiar contexts with parents, siblings, neighbors, and friends, individually or in groups. Direct self-reports of which language is spoken in which context can be of dubious validity, especially in politically self-conscious contexts. We took a number of measures to mitigate this problem. First, instead of asking outright which language they would use in each context, we elicited the choice data indirectly by having the students write, for each of the 16 contexts described in both Valencian and Castilian, the expression that they would normally say for a specified purpose – for example, asking for seconds at a family meal, asking the time of a stranger on the street, or explaining a payment at the bank. We then noted the language in which the response was formulated. Second, as will be seen below, we confirmed the differential language preferences for various groups of contexts according to informal ethnographic observation. Third, we tested the differential language preferences of the students through their responses on a separate questionnaire item asking whether they generally used Valencian or Castilian. Finally, we assessed the entire array of responses for self-consistency, using an implicational scale analysis.
The statistical analysis we applied was developed by Sankoff & Rousseau 1980, 1981 for finding the underlying structure of noisy scales, based on mathematical results of Rousseau & Sankoff 1978, which integrate logistic regression with implicational scaling. The regression analysis is first applied to the choice data, with informant and context as independent variables. The coefficients of the informants and the contexts provide the vertical and horizontal orders of a rectangular array of choices, as in Figure 2a. Characteristically, at one corner of the array is a relatively homogeneous region where all choices are of the same language, while at the opposing corner is a homogeneous region where the other language is chosen. The remaining area of the array is a wide diagonal where language choice alternates from informant to informant and from context to context.

Rectangular array with informants ordered from top to bottom on vertical axis, from greatest to least tendency to choose language V over C, and contexts ordered from left to right on horizontal axis, from greatest to least tendency to have language V chosen. (a) Orders determined by original regression. Clear areas represent homogeneous choice of V or C, while in shaded area choice is not implied by that in neighboring contexts or by neighboring informants. (b) After rejecting a large proportion of the data (black dots), no underlying scale is clear. (c) After rejecting a small proportion of data, variable region collapses, revealing underlying scale.
In further steps of the analysis, outliers (“scaling errors”) are sequentially rejected from the data set on the basis of likelihoods provided by the previous regression. A new regression is carried out on the remaining data, and the procedure is repeated until either an unacceptably large proportion of the data has been rejected (e.g., a third or a quarter of the data), representing a failure of the method, as in Figure 2(b); or the variable region collapses into a series of small variable blocks along the diagonal, revealing a strongly scaled underlying structure, as in Figure 2(c).
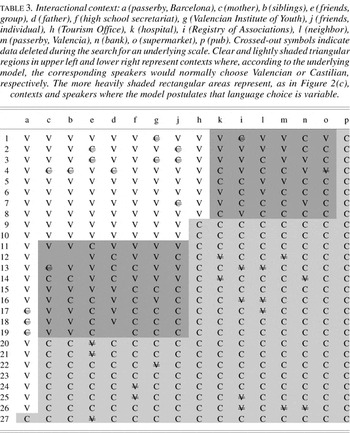
Before undertaking the analysis, we removed data representing seven students who obviously misunderstood this portion of the questionnaire as a test of Valencian skills (responding in Valencian to all items, though from previous parts of the questionnaire, it was clear that all their daily interactions were exclusively in Castilian), and seven others with significant numbers of missing responses. Among the 166 students with validated usage data, 94, or 56.6%, responded in Castilian for all contexts, and 24, or 14.5%, answered in Valencian for all contexts. For the remaining 48 (28.9%) who acknowledged some context-based variability in usage, our method resulted in the array shown in Table 3. There are only 27 rows because row 23 represents 22 individuals with identical responses.
Interactional context: a (passerby, Barcelona), c (mother), b (siblings), e (friends, group), d (father), f (high school secretariat), g (Valencian Institute of Youth), j (friends, individual), h (Tourism Office), k (hospital), i (Registry of Associations), l (neighbor), m (passerby, Valencia), n (bank), o (supermarket), p (pub). Crossed-out symbols indicate data deleted during the search for an underlying scale. Clear and lightly shaded triangular regions in upper left and lower right represent contexts where, according to the underlying model, the corresponding speakers would normally choose Valencian or Castilian, respectively. The more heavily shaded rectangular areas represent, as in Figure 2(c), contexts and speakers where the model postulates that language choice is variable.

We arrived at this scale after successively rejecting 35 responses out of a total of 768 for the 48 students, or only 4.6%. This was a meaningful point at which to terminate the procedure, because rejecting any fewer responses left us with a relatively unstructured scheme like Figure 2(b), and rejecting a few more reduced the size of the two variable blocks only slightly. This result is not the same as a “scalability” index of 95.4%, since we do not consider any of the responses in the variable block to be “errors” in any sense; rather, they represent potential contexts of genuinely variable use by the corresponding subset of students. Of course, the responses rejected in the preliminary steps are not necessarily erroneous either, but rather represent particular behaviors of specific individuals that obscure the underlying pattern in the bulk of the data.
Table 3 shows that the global sociolinguistic environment is of primordial importance to the bilinguals; it is in Barcelona, where Catalan is the preferred and prestige language choice, where almost all these students will speak Valencian instead of Castilian. This reflects the somewhat exaggerated perception that Castilian is little heard on the streets of Barcelona.
Second, there is a block of contexts, not only private (family and friends) but also public (the high school and the Valencian Institute of Youth), where Valencian predominates, and within which a subset of students manifests variable behavior. The two public contexts are of particular interest because they represent sectors under the authority of the Valencian Generalitat, the government of the entire autonomous community, which is the level of government responsible for linguistic normalization.
Third, another block of contexts, where a second subset of students exhibits variable behavior, is made up of both individual interactions (with passers-by on the street in Valencia, with neighbors, with a bank teller) and institutionalized interactions (the Registry of Associations, the Tourist Information Office, and the hospital) where Castilian predominates. The clear boundary between the institutional sectors in the previous block and in this one can be explained by their connection with the Community-wide Generalitat in the first case and the local municipal council in the second.
Valencian is chosen least often in “nonofficial” public places such as the supermarket or the pub. Ninyoles 1996 has previously suggested that the impersonal character and the policy of large commercial establishments such as supermarkets favor the use of Castilian. The pub is a gathering place for the younger generation, which has the least inclination to use Valencian despite their increased competence (Ninyoles 1992).
It is of interest that in official public contexts, although there is great variability, the tendency is more toward Valencian than in the nonofficial public contexts. Thus, the sociolinguistic generalization that the prestige variety, here Castilian, is preferred in more formal settings does not hold true, demonstrating the effects of normalization as propagated during the 1980s and early 1990s by official and semi-official institutions.
ATTITUDES
In a bilingual community, although the choice of which language to use in a given situation may be a simple binary decision, the factors influencing this choice are normally numerous and diverse. In particular, the immediate purposes, beliefs, and attitudes that impinge directly on this choice may be complex and multidimensional. This is why an understanding of linguistic attitudes has been a favored way explaining bilingual language choice and has been considered a prerequisite for successful language planning.
Previous studies in Valencia
Similar adaptations of the matched guise technique, as originally elaborated by Lambert and colleagues (Anisfeld & Lambert 1964, Lambert, Frankel & Tucker 1966) were previously applied by Ros 1982, Blas Arroyo 1995, and Gómez Molina 1998 in the city of Valencia. All of these sampled secondary students, though Gómez Molina also included evaluators from other age groups. Only the two more recent studies analyzed the results in terms of evaluator characteristics, categorizing them by sex, origin, maternal language, and bilingual ability. In addition, Gómez Molina considered residential area, sociocultural level, and age group. All three studies compared standard Valencian, standard Castilian, and nonstandard Castilian guises, though the nonstandard variety differed; Ros used a Valencian-accented Castilian, Blas Arroyo a southern variety (the Castilian of the Canary Islands), and Gómez Molina a variety of Castilian spoken by primarily Valencian speakers in the region of the city of Valencia. Ros and Gómez Molina also included nonstandard urban varieties of Valencian, while Ros and Blas Arroyo included standard Catalan.
These studies all show that the evaluators differentiate between standard and nonstandard varieties, as would be expected in a situation of diglossia, both within Castilian and within Valencian. In addition, there is a suggestion of a progressive increase in the status of Valencian at the expense of Castilian. In the 1980s, Ros could conclude that to speak standard Castilian in Valencia conveyed an image of higher social standing, intelligence, wealthy ancestry, city residence, high professional status, and so on, while to speak standard Valencian evoked interpersonal attraction, regional identity, and familiar contexts (Ros 1982:695); by the mid-1990s, however, Valencian was equaling or surpassing Castilian with respect to certain aspects of social and personal status, although it was still lagging in the aggregate measure (Blas Arroyo); and by the end of the 1990s, Gómez Molina could, with some qualifications, attribute greater prestige to Valencian than Castilian. It would seem that the new legal status of Valencian has been to its benefit, since in less than 20 years the statuses appear to have been reversed.
Attitudes were shown to vary according to evaluators' socio-demographic and linguistic characteristics. Thus, women and evaluators of average sociocultural level are more likely to favor speakers in Castilian guise, while middle-aged evaluators of higher sociocultural level are more likely to favor Valencian speakers (Blas Arroyo, Gómez Molina). In addition, Gómez Molina points out a marked heterogeneity in the linguistic attitudes of younger speakers.
These results leave many questions unanswered, however. In the first place, given the limited institutional support for the diffusion of Valencian or its establishment in formal domains, as well as the minimal expansion in usage as analyzed above, what is the significance of the apparent radical increase reported in the evaluation of standard Valencian? Second, what is the role of Catalan, aside from the evaluations generally parallel with those of standard Valencian, as noted by Blas Arroyo; in particular, what is its status in the three-way interrelation between the three standard varieties which underlies the current sociolinguistic situation in Valencia? Finally, although heterogeneous attitudes of younger speakers have been documented, it seems crucial to study the socio-demographic and ideological structure of this diversity statistically. This is fundamental if we are to predict or to plan for future sociolinguistic developments.
The recordings
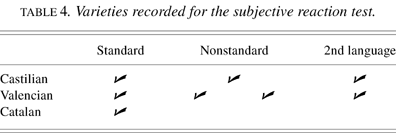
The matched guise technique originally involved one or more individuals, each speaking the same set of language varieties. This is not practicable when there are eight varieties to be compared, as listed in Table 4. We therefore had to use different speakers for many of the varieties, though two of our speakers were each recorded in two different guises, their maternal language (Valencian or Castilian) and an accented version of the other language. Since the two guises of these speakers were evaluated very differently (Casesnoves Ferrer 2001), this serves as a control to show that judgments were influenced by attitudes toward language varieties and not toward speakers' voice quality, timbre, or personality. In addition, we controlled for other influences on evaluations by restricting ourselves to male speakers aged 20–30 whose voice qualities were all somewhat similar. All spoke on the same topic, home cooking.
Varieties recorded for the subjective reaction test.

The eight linguistic varieties listed in Table 4 represent different “accents” that can be readily heard in Valencia (with the exception of the standard Catalan of Barcelona). These varieties represent two oppositions: an intralinguistic opposition (varieties differing according to the degree of standardization), and an interlinguistic opposition (contrasting the varieties of Castilian to those of Catalan). The two nonstandard varieties of Valencian are the apitxat variety of the city and surroundings, and meridional Valencian. The remainder of the present article focuses exclusively on the results obtained for the standard varieties.6
We have introduced the nonstandard varieties and second-language guises here not only to show that we have controlled to a certain extent for the use of different voices, but also to situate our analysis in the context of the larger study and to help explain why we had to modify the traditional matched guise technique by using multiple speakers. First, to find somebody in Valencia with native competence in all varieties is not feasible, in contrast to many other bilingual situations. More important, in this context the evaluation of status in particular is extremely sensitive to nonstandard and second-language features. Trying to use the same speaker for several varieties would have risked detection, conscious or unconscious, by some of the students, and it would have resulted in a downgrading of the status evaluations.
The sample
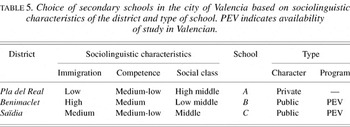
Our sample was made up of 180 students from three schools in the city of Valencia (92.8%), and one school in the city of Xàtiva (located 54 kilometers southwest of the capital) (7.2%), where Valencian speakers form a majority. We focused on high schools for a number of reasons. In the entire group of Catalan-speaking territories of Spain, it is the age cohort between 10 and 25 that shows the greatest competence in Catalan (cf. Figure 1), owing to its introduction into the educational system (Reixach 1998:17). However, this increased linguistic competence, particularly in the written language, does not correspond to a parallel increase in usage (Ninyoles 1992:492), as we have confirmed. The behavior of young people is diagnostic of the success of linguistic planning because they presage the direction of future linguistic change. Moreover, the classroom is an ideal research site because it provides a large, “captive” group happy to forgo schoolwork, first in order to be tested and second, on a subsequent day, to continue filling out lengthy questionnaires gathering social and linguistic data. The selection of schools in the city of Valencia was based on five criteria. First, the districts were categorized by social class (Ninyoles 1996), percentage of immigrant population, and an index of competence in Valencian (Municipal Register of Inhabitants of 1996). Second, schools were classified according to their public or private character and the availability of a full program of studies in Valencian. During the 1997–98 school year, there were 63 private and 39 public secondary schools in the city of Valencia, of which 12 offered the possibility of studying in Valencian (only 2.3% of the total of secondary students availed themselves of this opportunity). Table 5 summarizes the choice of schools according to these criteria. Note that the sociolinguistic aspects listed in the table refer to the overall characteristics of the districts, and do not preclude that the schools themselves all receive students of all social classes, origins, and competence levels (cf. Table 6).
Choice of secondary schools in the city of Valencia based on sociolinguistic characteristics of the district and type of school. PEV indicates availability of study in Valencian.

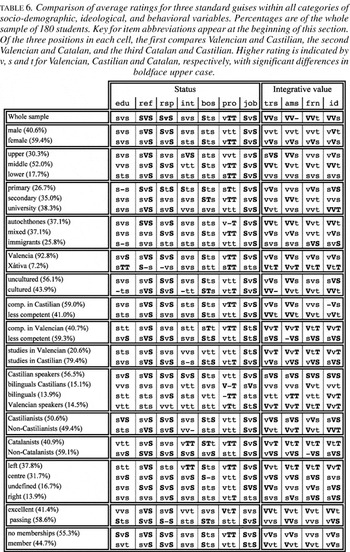
Comparison of average ratings for three standard guises within all categories of socio-demographic, ideological, and behavioral variables. Percentages are of the whole sample of 180 students. Key for item abbreviations appear at the beginning of this section. Of the three positions in each cell, the first compares Valencian and Castilian, the second Valencian and Catalan, and the third Catalan and Castilian. Higher rating is indicated by v, s and t for Valencian, Castilian and Catalan, respectively, with significant differences in boldface upper case.

Responses to the subjective reaction test
After listening to each of the speech samples, the student evaluators rated the speaker on a number of 5-, 7-, or 11-point ordinal scales, attributing psycho-sociological characteristics to the speakers, measuring their own identification with the speaker, guessing the type of employment the speaker is likely to have, and so on. Several of the scales were grouped into a number of subsets, based largely on the matched guise literature pertaining both to Valencia and to other contexts worldwide. Subset (a), status, rated intelligent-stupid (int), educated-uncultivated (edu), responsible-irresponsible (rsp), refined-crude (ref), credibility as a university professor (pro), credibility as a boss (bos), and ability to find a job in the European Union (job). Subset (b), integrative value, rated trustworthy-untrustworthy (trs), amusing-boring (ams), likely to be a friend (frn), and evaluator's identification with speaker (id). Subset (c), instrumental value, rated ability to find a job in Valencia. In the analysis we focused on the first two of these subsets, status and integrative value.
The evaluators: Sociodemographic, behavioral, and ideological characteristics
To enable an assessment of how linguistic attitudes vary according to evaluator characteristics, we administered a sociolinguistic questionnaire as well as a questionnaire about behavior in various contexts. The sociolinguistic questionnaire contained two types of question: those pertaining to socio-demographic characteristics known from previous studies to be associated with attitudinal differences, and questions about cultural activities, ideology, and linguistic competence that have not previously been explored in this kind of study. The need to operationalize the data led us to construct a series of compound variables, or indices, that represent the synthesis of several questions.
(a) Linguistic competence: We constructed two ordinal scales to measure overall competence (combining scales for understanding, speaking, reading, and writing) in Valencian and in Castilian. Using the mean value of each scale as a cutoff point, we divided the sample into two groups or categories, “more competent” versus “less competent,” both for Valencian and for Castilian.
(b) Culture: This variable combines several questions related to cultural activities (theater attendance, public conferences, and musical concerts), the amount of extracurricular lessons, the number of books read annually in Catalan, Castilian, and foreign languages, and the amount of music listened to in Catalan, Castilian, and English. (Note: For us, and for the evaluators, the term Catalan includes Valencian when it refers to print media or music.) Again, the average on this scale was used to separate the “cultured” from the “uncultured” evaluators.
(c) Catalan orientation: This scale was constructed from questions about identity (by taking the difference between the degree of identification with Catalans and with Valencians7
In another study (Casesnoves Ferrer & Sankoff 2003), this “subtractive” index of Catalan identity proved to be a strong predictor of the use of Valencian, while the analogous index of Castilian identity operated in the opposite direction.
(d) Castilian orientation: This scale was constructed from questions about identity (by taking the difference between the degree of identification with Castilians and with Valencians), from questions about preferences in mass media (the difference in frequency with which they tune in to Spanish national public or private television channels versus Valencian ones), and from the difference in the number of books they read and amount of music they listen to in Castilian versus Valencian. Note that this scale has more components than the Catalanist one because of the clear distinction between Castilian and Valencian cultural genres, whereas in these contexts Valencian and Catalan essentially coincide. The above-average group was labeled the “Castilianists” and the below-average one the “non-Castilianists.”
(e) Use: The questionnaire on behavior in context estimates use of Valencian and Castilian in various domains by indirect means. As discussed above, instead of asking directly what language they would use in a concrete situation, it requested the students to write what they might say in this context. The answers enabled the construction of a scale that measured the overall use of Valencian versus Castilian. The ends of this scale correspond to the exclusive use of Castilian (the “Castilian speakers”) and to the exclusive use of Valencian (the “Valencian speakers,” keeping in mind that the truly exclusive use of the Valencian is practically impossible, especially for students in the city, who can all speak Castilian also). The intermediate groups include those students who use Valencian in one context only (whom we call “bilingual Castilian speakers”) and those who would use it in diverse situations (the “bilingual” speakers).
The first column of Table 6 (below) shows the distribution of our sample of 180 students among these categories and other categories constructed directly from questionnaire responses: gender, social class (according to father's occupation), parents' educational level, origin (birthplace of parents in the Community or outside), residence, studies entirely in Valencian or not, political orientation, marks in Valencian language courses, and membership in organizations outside of school.
DIFFERENCES BETWEEN GROUPINGS OF EVALUATORS
To avoid prejudging the kinds of attitude patterns prevalent among the students, and what socio-demographic, ideological, and behavioral variables characterize the group of students manifesting each pattern, we undertook a heuristic investigation of the attitude results, simultaneously taking into account as many dimensions of the data as possible, and retaining as many of the distinctions within each variable as could be justified by the amount of data available. Three considerations guided this design
- Because both Castilian and Catalan are key references for these students, to investigate the structure of the attitudinal diversity among them we must make a three-way comparison among the responses to three language varieties in the subjective reaction test. A three-way comparison is harder to display than a standard two-way comparison, where a single linear scale suffices.
- To characterize each attitudinal group as fully as possible, and to avoid the pitfalls of assuming universally linear responses, we must treat all 37 socio-demographic, behavioral, and ideological categories on the same initial footing, without any prior linear dimension-reduction procedure such as principle components or factor analysis.
- Because each of the questionnaire items on the subjective reaction test represents a different expression of perceived prestige or integrative value, each of these 11 components must be examined separately to obtain a clear idea of what “status” and “solidarity” really mean in this context.
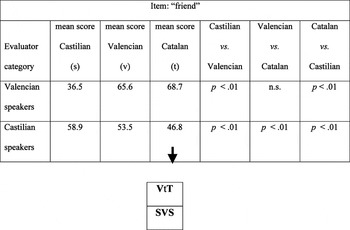
These considerations leave us with a 3 × 37 × 11 array of average responses to the three linguistic varieties, according to 11 criteria in the 37 crosscutting socio-demographic, behavioral, and ideological categories, with three tests of significance within each cell of the array. This amount of material is not easily visualized, mostly because of its size and dimensionality, and partly because the 11 criteria do not elicit comparable ranges of response; thus, the total array is not conducive to a heuristic search for patterns. To reduce the material somewhat, without losing the essential contrasts, for each pair of languages within each cell we extract only which one scored higher, and whether the difference was statistically significant according to a two-tailed t-test. This is illustrated in Figure 3 for the behavioral categories of “Valencian-speakers” and “Castilian-speakers” and the test item measuring how likely it is that the speaker could be a friend of the evaluator.

Reduction of quantitative results within cells to summary scheme. s = Castilian, v = Valencian, t = Catalan. Bold upper case indicates significant difference.
The arrow in Figure 3 leads from the full display of the results to a summary scheme. In the scheme, in the Valencian-speakers' cell, the boldface, upper case V in the first position indicates that the score for Valencian is significantly higher than the score for Castilian; the lower-case t in the second position indicates that the score for Catalan is higher than the score for Valencian, but not significantly so; and the T in the third position indicates that Catalan is also significantly higher than Castilian. In the Castilian-speakers' cell, the two S indicators in the first and third positions show that the score for Castilian is significantly higher than those for Valencian and Catalan, and the V that Valencian is significantly higher than Catalan. A – at a position would mean there are equal ratings for the two varieties being compared. (The inclusion of both significant and nonsignificant differences in Table 6 is justified in the discussion of Table 7 below.) Table 6 contains the summary cells for all seven “status” items, all four “integrative value” items, and all 37 categories of speakers. The first row of data summarizes the aggregate judgments of the whole sample.
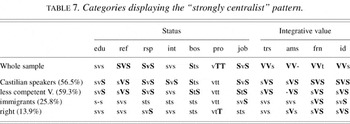
Categories displaying the “strongly centralist” pattern.

In these data, two status items are relatively invariant no matter how the sample is subdivided. The item “professor” clearly evokes an association with Catalan for all categories of evaluators, while “ability to find work in the EU” is equally clearly associated with Castilian. The other items show considerably more variability, allowing us to compare and contrast the various categories.
The first row shows that, for the sample as a whole, Castilian is rated better than the other two for all status items except “professor,” significantly better than the other two for the status items “responsible,” “refined,” and “ability to find work in the EU,” and significantly better than Valencian for “boss.” Catalan is rated higher than the other two for “professor.” With respect to integrative value, however, Valencian is rated significantly better than the other two varieties for all four items, with little to choose between Catalan and Castilian.
In examining the other rows (categories), we searched for clear patterns of differences that departed from the overall tendency. One such pattern is exemplified by the Castilian-speakers, who rated the Castilian guise significantly higher than Catalan on two additional status items, “educated” and “intelligent,” and also rated Castilian higher, Valencian lower, and Catalan much lower for integrative value items. Essentially the same pattern is manifested by the evaluators “less competent in Valencian,” which is not surprising since this group overlaps substantially with the “Castilian-speakers.” Focusing on the integrative value items, this pattern also occurs, although with less statistical significance, for the “immigrants” (who are almost exclusively from Castilian-speaking regions) and the politically “right” categories, as summarized in Table 7. We will call this pattern “strongly centralist.”
Note that lack of statistical significance in these cases is a consequence more of subsample size than of the size of the difference between two scores. Indeed, for both the “immigrants” and the political “right,” the fact that Castilian scores higher than Valencian on all four integrative value items is significant at the p < (0.5)4 < 0.07 level, even if none of the differences for the individual items is significant. The possibility of detecting such consistent patterning across a range of items is a justification for including both significant and nonsignificant differences in displays like Tables 6 and 7.
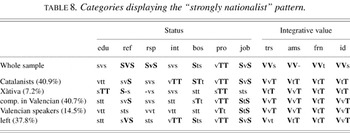
A quite different pattern is found for the “Catalanists” (see Table 8). For these speakers, Castilian is no longer the unequivocal language of prestige. For three of the six items where it is rated highest for the whole sample, it is surpassed by either or both Catalan and Valencian; and for two other items, Castilian still leads but the difference has lost statistical significance. At the same time, Catalan has replaced Valencian with the highest ratings for most integrative value items, while Castilian is rated significantly lower. We will call this pattern “strongly nationalist,” and we also detect it, with some variations, among residents of Xàtiva, evaluators “competent in Valencian,” those who actually speak it, and evaluators on the political left.
Categories displaying the “strongly nationalist” pattern.

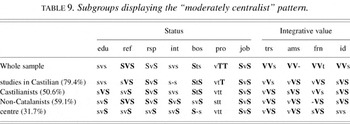
Along with the strong centralists in Table 7, we find a number of categories in Table 9 that we can characterize as “moderately centralist.” These categories downrate Catalan as much as the strong centralists do with respect to both status and integrative value items, but they contrast with the strong centralists in not having a strong preference for either Castilian or Valencian on the integrative value items. These categories include “studies in Castilian,” “Castilianists,” “non-Catalanists,” and the political center.
Subgroups displaying the “moderately centralist” pattern.

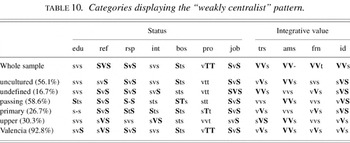
Still another centralist pattern, the “weakly centralist” pattern shown in Table 10, differs from the “moderately centralist” pattern in that Castilian, though still rated higher than Catalan for all integrative value items, is not statistically higher for most of them, and indeed tends to be rated somewhat lower than Valencian in this area (though not with the statistical significance found in the whole sample). In addition, these categories do not downrate Catalan with respect to status items any more than does the whole sample of evaluators. This pattern pertains to residents of the city of Valencia (the bulk of the sample), and more specifically to the “uncultured” evaluators, the politically “undefined,” “passing” students, and those whose parents had primary education, but also to the “upper” class.
Categories displaying the “weakly centralist” pattern.

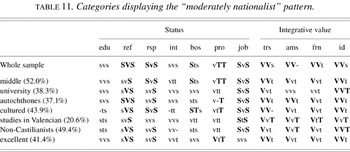
Finally, we can identify a second nationalist pattern, which we characterize as “moderately nationalist.” Students in these categories (Table 11) still rate Catalan higher than Castilian for the integrative value items, but the difference is generally not significant. Indeed, it is Valencian that unequivocally rates highest on these items. In addition, students in these categories tend to rate either Valencian or Catalan, or both, higher than Castilian on one of the status items, “intelligent,” in contrast to the whole sample. Recall, however, that the strong nationalists downrated Castilian with respect to almost all of the status items.
Categories displaying the “moderately nationalist” pattern.

What of the remaining categories in Table 6? The male and female students have higher ratings of Catalan and Castilian, respectively, for the integrative value items, but none of these differences are significant. Moreover, the male evaluators do not manifest other aspects of the “moderately nationalist” pattern, such as the downrating of Castilian on the “intelligent” item, or its significant downrating on the integrative value items. Similarly, the female group shows a downrating of Castilian compared to Valencian for the integrative value items that is too consistent to warrant inclusion in the “weakly centralist” pattern.
Similar observations preclude us from including “memberships” and “no memberships” in the “moderately nationalist” and “weakly centralist” patterns, or for assigning “less competent in Castilian” and “competent in Castilian” to these same patterns. The “lower” class also shows no significant differences permitting us to assign it to the “weakly centralist” pattern.
Parents' secondary education and “mixed” origin both manifested patterns closer to the full sample than to any centralist or nationalist pattern.
VALIDATION OF THE PATTERNS
In Table 6, we presented a profile for each category of each independent variable, consisting of summary cells for seven indices of status and four indices of integrative value across all the students in this category. There are 37 such profiles in all. We then noted that most (26 out of 37) of these profiles can be grouped into five general attitudinal patterns. For example, the category of “Castilian speakers” has much higher (>>) average values for several indicators of status of Castilian compared to Catalan, and higher or equal values (≥) for Castilian compared to Valencian. Students in this category also assign far higher values (>>) to indicators of the integrative value of Castilian than to those for Valencian, and higher (>) for Valencian than for Catalan. This “strongly centralist” pattern is found to a lesser degree for “immigrants” and for some other categories identified on the basis on socio-demographic, ideological, and behavioral variables.
Before interpreting this set of patterns, we should establish that they summarize or reflect attitudes of individual students. The fact that the patterns were detected on the basis of averages within the categories is no guarantee that individuals manifest them; a pattern might merely reflect a compromise among the very heterogeneous attitudes in a category.
To validate the patterns then, we should see to what extent the individuals in each socio-demographic, ideological, and behavioral category manifest attitudes in accord with the pattern associated with that category in Tables 7, 8, 9, 10, and 11. The procedure for doing this is as follows:
- Formalize the definition of the five patterns.
- Verify whether each student's responses satisfy the definition of one or more of the patterns.
- See what proportion of the students in each category fits the pattern associated with that category in Tables 7, 8, 9, 10, and 11.
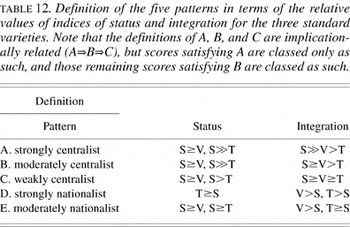
The original identification of the patterns relied less on particular items in the subjective reactions than on overall comparisons between languages on the ensemble of status items and the ensemble of integrative value items. Thus, in the first step of our procedure, the formalizing of the pattern definitions, we used a single index of status, calculated as the average of the seven status scores, and a single index of integrative value, the average of the four integration scores, all measured on a scale of zero to 100. The conversion to a common scale was necessitated by the fact that the responses to the items were originally scored variously on 5-, 7-, or 11-point scales. In terms of these indices, the above description of the five patterns is summarized in formal notation in Table 12.
Definition of the five patterns in terms of the relative values of indices of status and integration for the three standard varieties. Note that the definitions of A, B, and C are implicationally related (A⇒B⇒C), but scores satisfying A are classed only as such, and those remaining scores satisfying B are classed as such.

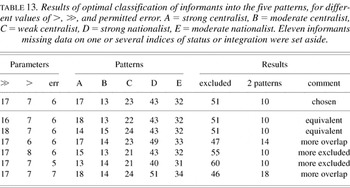
Before we can carry out the second step, associating individuals with patterns, we must specify what is meant by the symbols, ≥, >, and >>, namely numerical values chosen to balance two criteria: (i) to maximize the number of informants allocated to one or another pattern; and (ii) to allocate roughly comparable proportions to the different patterns. In addition, to take into account methodological and statistical fluctuations in informant scores, we should allow a certain deviation, or “error,” from the fixed threshold for each criterion before excluding an informant from a pattern. While this helps satisfy both criteria above, the value chosen should be low enough (iii) to minimize overlapping membership (informants in two or several patterns).
To look for optimal values for the contrasts symbolized by ≥, >, and >>, as well as the error parameter, we heuristically searched the space of possible values, changing one or other of the values by 1 wherever this improved the allocation of students according to the three criteria. The final stages in the search, partly summarized in Table 13, settled on values of 0, 7, and 17 for ≥, >, and >>, respectively. For example, to strictly satisfy S>>T, an informant must have a score for Castilian that exceeds his score for Catalan by 17 or more.
Results of optimal classification of informants into the five patterns, for different values of >, >>, and permitted error. A = strong centralist, B = moderate centralist, C = weak centralist, D = strong nationalist, E = moderate nationalist. Eleven informants missing data on one or several indices of status or integration were set aside.

The value of the error parameter is 6. (For example, to satisfy S>> T, it is only necessary that an informant have a score of 17 − 6 = 11 more for S than for T.) Allowing greater error values has the advantage of classifying more of the informants into patterns, but the disadvantage of including a larger number of informants in two patterns simultaneously. On the other hand, a smaller error value will exclude more individuals from all patterns, but it will also result in less overlap.
The choice of values for >, >>, and the error is validated in Table 13, where it can be seen that a small decrease in > or a small increase in permitted error allocates more informants into two patterns. An increase in > or decrease in permitted error excludes more informants from all five patterns. Changes of >> affect only the distribution of informants among the three centralist patterns.
Note that the five patterns formalized in Table 13 represent but a small fraction of the hundreds of possible patterns using various comparisons of S, V, and T based on the three relations ≥, >, and >>. The fact that 118 out of the 169 informants (70%) fall in the five categories, even taking into account that we allowed a margin of error, testifies to the pertinence of these patterns for individual informants.
More important, however, is the relationship between the pattern membership of the individuals and that of the socio-demographic, ideological, and behavioral categories they belong to, and evaluating this is the final step in the validation of the patterns. It would not be astonishing to find a close correspondence, since the patterns are based, albeit very indirectly, on averages of the individual scores within the categories, but neither would it be surprising if such a correspondence was very weak or undetectable, given three factors:
- the great heterogeneity within the categories;
- the reduction of the 11 item scores to summary status and integrative value indices; and
- the 30% of unclassified informants.
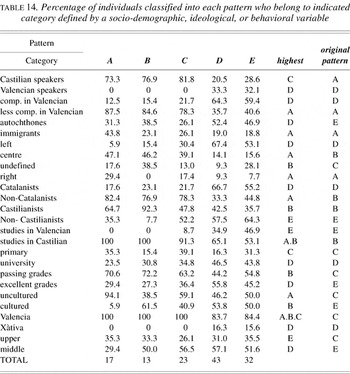
Table 14 shows the correspondence between the patterns and the socio-demographic, ideological, and behavioral variables. Excluded are variables that provoked no clear-cut differentiations in attitude: sex, the degree of competence in Castilian, and membership in associations. In Table 14, percentages are calculated from the number of category members classified in each pattern, out of the total number of informants classified in that pattern. Informants classified in two patterns simultaneously have been counted twice during the calculation of percentages, once in each of the two patterns. The column entitled “highest” indicates the pattern for which the highest percentage of its informants is in the category in question. The essential comparison for the validation procedure is between this and the last column (“original pattern”), which indicates the pattern found for the category in the preceding section, based on the summary cell comparisons of averages for individual indices of status and integration.
Percentage of individuals classified into each pattern who belong to indicated category defined by a socio-demographic, ideological, or behavioral variable

Note first that for 15 of the 26 categories defined by these variables, the pattern associated with the category, previously identified through the averages for the seven status variables and the four variables of integration, is identical to the pattern to which the largest proportion of informants belongs, according to criteria displayed in Table 13 (first row). In a further seven of the eleven remaining categories, the difference is small between the highest membership percentage and that of the pattern which the category was identified as displaying in Tables 7, 8, 9, 10, and 11, and the two patterns are on the same side of the centralist/nationalist divide. In only two cases – the “uncultured” and the “undefined” – are the differences large, and in two other cases, the “cultured” and the “upper” class, the difference is between a moderate or weak centralist assignment and a moderate nationalist one.
Given the rather intricate and heuristic way patterns A, B, C, D, and E were proposed on the basis of three-way comparisons of the language varieties on all eleven indices, followed by the recognition of common trends in various categories, it is gratifying that a simplified definition of these patterns based on individuals' average scores succeeds in classifying a substantial majority of the speakers in one or another of the patterns. Moreover, in most cases, if a category comprises a larger proportion of the speakers in one pattern than in any other pattern, then that category was one of those that motivated the characterization of the pattern in the first place. Where this does not hold, at least the category is generally associated with closely related patterns in the two analyses. These results are not intuitively surprising, but from a methodological viewpoint, it was not logically necessary that such a large proportion of speakers should fall into one and only one of the patterns; more of them could well have fallen outside all of the patterns. Nor was it mathematically necessary that so many of the categories be identified with the same pattern in both analyses; it could well have been the case that most of the categories originally identified as centralist would turn out to be most closely associated with one of the nationalist patterns, and vice versa. That these contrary possibilities were not realized attests to the consistency and coherence of our definitions and procedures, and to the “reality” of the patterns we identified.
INTERPRETATIONS AND CONCLUSIONS
What have been the effects of linguistic normalization in Valencia? It is clear that the introduction of Valencian into the educational system has arrested the decline of competence in this language, and it has actually reversed it substantially in the younger generation.8
We must remember, however, that this takes place against a background of universal competence in Castilian. The increased competence in Valencian is an increase in bilingualism; there is no increasing population of Valencian monolinguals.
Our more detailed examination of context-specific tendencies does reveal another dimension of revitalization. The implicational scale analysis suggests that normalization policies have had a distinct effect in expanding the domains of usage of Valencian. This scale can be seen as dividing the students into three groups: those who report never using Valencian (about half), those reporting the use of Valencian in all contexts (about an eighth), and a transitional group. Within the transitional group, there is increased use of Valencian as the contexts become more familiar, with two exceptions. The most favorable context for Valencian is in Barcelona, where many students who do not otherwise use Valencian respond positively to communicational needs and local norms by communicating in their own variety of Catalan. This indicates the potential, under the right conditions, for translating increased competence in Valencian into increased usage. The second exception, and the more important one, is that in certain public contexts (those with some connection with some direct or indirect government connection) use of Valencian increases, compared even with communications among friends and neighbors. Examples of such contexts are the secretariats of the high schools and the Valencian Institute of Youth. Were normalization to advance, this would require not only that more students learn Valencian, as is presently the case, but also that some individuals competent in Valencian begin to favor it outside the family context, and not only on trips to Catalonia. The official contexts mentioned here appear to facilitate this process.
The question remains: What are the prospects for expanding the transitional group of speakers by inducing competent speakers to use Valencian, especially in the city of Valencia, where Castilian predominates heavily? Our attitudinal study reveals details about the crosscutting forces at play in language choice. We showed that there is a substantial segment of our sample, almost half, who can be classified as “nationalist.” The strong nationalists tend to be more competent in Valencian, politically progressive, and positively oriented toward Catalan. They evaluate Castilian negatively on the measures of integration and evaluate Catalan relatively highly, even on measures of status. Many of these will already be among the most consistent users of Valencian. The moderate nationalists, on the other hand, retain much of the traditional image of Castilian as having the highest status, though solidarity is expressed more with Valencian and Catalan. It is these middle-class, cultured children of university-educated Valencians, achieving excellent grades in Valencian and often electing to study in Valencian, who represent the greatest potential for the expanded use of this variety in the city of Valencia.
In contrast, those students whom we classified in the centralist patterns – even those who are weakly centralist – show little prospect for entering the “transitional” group of speakers. The large majority of them do not come from Valencian-speaking families and thus will not even use Valencian in this context. And though the weak and moderate centralists show solidarity with Valencian, the status scores indicate that it remains stigmatized compared to Castilian and thus has little prospect of being used in public situations, except perhaps in contexts with a majority of Valencian speakers, such as in Xàtiva.
Thus, the attitude study demonstrates that conditions are favorable for further advancement of Valencian, especially among informants exhibiting the nationalist attitude patterns. It seems clear, however, that Valencian will make few inroads as far as the centralist students are concerned.
Our analysis assumes the continuation of the current socio-demographic situation. A strengthening of recent immigration trends from Castilian-speaking regions will disfavor linguistic normalization in the city of Valencia, but any increase in migration from towns and villages like Xàtiva will work in the opposite direction and could have a decisive effect on expanding contexts of usage of Valencian.
References
REFERENCES
Ajuntament de València
(1998).
Padró municipal d'habitants 1996.
València:
Ajuntament de València.
Anisfeld, Elizabeth, &
Lambert, Wallace
(1964).
Evaluation reactions of bilingual and monolingual children to
spoken languages.
Journal of Abnormal and Social Psychology
69:89–97.Google Scholar
Aracil, Lluis Vicent
(1965).
Conflit linguistique et normalisation linguistique dans
l'Europe nouvelle.
Nancy: Centre Universitaire Européen.
Reprinted in Aracil, Lluis Vicent (1982).
Papers de sociolinguística.
Barcelona:
La Magrana.
Blas Arroyo, José Luís
(1995).
De nuevo el español y el catalán, juntos y en
contraste: Estudio de actitudes lingüísticas.
Sintagma
7:29–41.Google Scholar
Casesnoves Ferrer, Raquel
(2001).
Les évaluations effectuées par des filles et des
garçons dans un contexte de langues en conflit. In
Papers from the Annual Meeting of the Atlantic Provinces
Linguistics Association
25: 78.
Casesnoves Ferrer, Raquel, &
Sankoff, David
(2003).
Identity as the primary determinant of language choice.
Journal of Sociolinguistics
7:50–64.Google Scholar
CCE (Conselleria de Cultura y Educación de la
Generalitat Valenciana)
(1989).
Coneixement del valencià: Anàlisi dels resultats del
Padró municipal d'habitants de 1986.
València:
CCE, Generalitat Valenciana.
CCE (Conselleria de Cultura y Educación de la
Generalitat Valenciana)
(1992).
Enquesta sobre l'ús del valencià 1992.
Unpublished document,
València:
CCE, Generalitat Valenciana.
CCE (Conselleria de Cultura y Educación de la
Generalitat Valenciana)
(1993).
Enquesta sociològica a la ciutat de València.
Unpublished document,
València:
CCE, Generalitat Valenciana.
CCE (Conselleria de Cultura y Educación de la
Generalitat Valenciana)
(1995).
Enquesta sobre l'ús del valencià Maig 1995:
Comparació amb 1989 i 1992.
Unpublished document,
València:
CCE, Generalitat Valenciana.
Gómez Molina, José Ramón
(1998).
Actitudes lingüísticas en una comunidad bilingüe y
multilectal: Área metropolitana de Valencia.
Anejo XXVIII Cuadernos de Filología. Facultad de
Filología.
Valencia:
Universitat de València.
IVE (Institut Valencià d'Estadística)
(1994).
Cens de població de la Comunitat Valenciana 1991.
València:
Institut Valencià d'Estadística.
Lambert, Wallace;
Frankel, H.; &
Tucker, G. R.
(1966).
Judging personality through speech: A French-Canadian example.
Journal of Communication
16:305–21.Google Scholar
Mollà, Damià, &
Mira, Eduard
(1986).
De impura natione.
València:
Tres i Quatre.
Montoya Abat, Brauli
(1996).
Alacant: La llengua interrompuda.
València:
Denes.
Ninyoles, Rafael Lluís
(1972).
Idioma y poder social.
Madrid:
Tecnos.
Ninyoles, Rafael Lluís
(1992).
Sociología de la lengua. In
Manuel García Ferrando (ed.),
La Sociedad Valenciana de los 90,
421–38.
València:
Alfons el Magnànim, Generalitat Valenciana.
Ninyoles, Rafael Lluís
(1995).
Conflicte lingüístic valencià.
[1st ed., 1968.]
València:
Tres i Quatre.
Ninyoles, Rafael Lluís
(1996).
Sociologia de la ciutat de València.
Alzira:
Germania.
Reixach, Modest
(1998).
El coneixement del català: Anàlisi de les dades del
Cens lingüístic de 1991 de Catalunya, les Illes Balears i
el País Valencià.
Barcelona:
Institut de Sociolingüística Catalana, Generalitat de
Catalunya.
Ros, María
(1982).
Percepción y evaluación social de hablantes de cinco
variedades lingüísticas. In
Rafael Lluís Ninyoles (ed.),
Estructura social al País Valencià,
665–97.
València:
Diputació de València.
Rousseau, Pascale, &
Sankoff, David
(1978).
Singularities in the analysis of binomial data.
Biometrika
65:603–9.Google Scholar
Sabater, Ernest
(1984).
An approach to the situation of the Catalan language: Social and
educational use.
International Journal of Sociology of Language
47:29–41.Google Scholar
Sankoff, David, &
Rousseau, Pascale
(1980).
Categorical contexts and variable rules. In
Sven Jacobson (ed.),
Papers from the Scandinavian Symposium on Syntactic Variation,
7–22.
Stockholm:
Almqvist & Wiksell.
Sankoff, David, &
Rousseau, Pascale
(1981).
Échelles et règles. In
David Sankoff &
Henrietta J. Cedergren (eds.),
Variation omnibus,
257–69.
Edmonton:
Linguistic Research Incorporated.
Vallverdú, Francesc
(1984).
A sociolinguistic history of Catalan.
International Journal of Sociology of Language
47:13–28.Google Scholar
Evolution of the degree of passive and active oral competence in the city of Valencia. Group aged 15–19 highlighted.
Rate of use of Valencian in the Valencian-speaking regions in various contexts. Based on a total of 1,200 interviews for each time period.
Rate of use (always or usually) of Valencian in the city of Valencia. Based on a sample of 1,110 informants.

Rectangular array with informants ordered from top to bottom on vertical axis, from greatest to least tendency to choose language V over C, and contexts ordered from left to right on horizontal axis, from greatest to least tendency to have language V chosen. (a) Orders determined by original regression. Clear areas represent homogeneous choice of V or C, while in shaded area choice is not implied by that in neighboring contexts or by neighboring informants. (b) After rejecting a large proportion of the data (black dots), no underlying scale is clear. (c) After rejecting a small proportion of data, variable region collapses, revealing underlying scale.
Interactional context: a (passerby, Barcelona), c (mother), b (siblings), e (friends, group), d (father), f (high school secretariat), g (Valencian Institute of Youth), j (friends, individual), h (Tourism Office), k (hospital), i (Registry of Associations), l (neighbor), m (passerby, Valencia), n (bank), o (supermarket), p (pub). Crossed-out symbols indicate data deleted during the search for an underlying scale. Clear and lightly shaded triangular regions in upper left and lower right represent contexts where, according to the underlying model, the corresponding speakers would normally choose Valencian or Castilian, respectively. The more heavily shaded rectangular areas represent, as in Figure 2(c), contexts and speakers where the model postulates that language choice is variable.
Varieties recorded for the subjective reaction test.
Choice of secondary schools in the city of Valencia based on sociolinguistic characteristics of the district and type of school. PEV indicates availability of study in Valencian.
Comparison of average ratings for three standard guises within all categories of socio-demographic, ideological, and behavioral variables. Percentages are of the whole sample of 180 students. Key for item abbreviations appear at the beginning of this section. Of the three positions in each cell, the first compares Valencian and Castilian, the second Valencian and Catalan, and the third Catalan and Castilian. Higher rating is indicated by v, s and t for Valencian, Castilian and Catalan, respectively, with significant differences in boldface upper case.
Reduction of quantitative results within cells to summary scheme. s = Castilian, v = Valencian, t = Catalan. Bold upper case indicates significant difference.
Categories displaying the “strongly centralist” pattern.
Categories displaying the “strongly nationalist” pattern.
Subgroups displaying the “moderately centralist” pattern.
Categories displaying the “weakly centralist” pattern.
Categories displaying the “moderately nationalist” pattern.
Definition of the five patterns in terms of the relative values of indices of status and integration for the three standard varieties. Note that the definitions of A, B, and C are implicationally related (A⇒B⇒C), but scores satisfying A are classed only as such, and those remaining scores satisfying B are classed as such.
Results of optimal classification of informants into the five patterns, for different values of >, >>, and permitted error. A = strong centralist, B = moderate centralist, C = weak centralist, D = strong nationalist, E = moderate nationalist. Eleven informants missing data on one or several indices of status or integration were set aside.
Percentage of individuals classified into each pattern who belong to indicated category defined by a socio-demographic, ideological, or behavioral variable
 You have
Access
- 11
- Cited by