When people vote in an election they do so under a given voting system. One obvious question that political scientists struggle with is whether people would make different choices if the voting systems were different. Most of the time, this question has been addressed indirectly. Researchers compare voting patterns under different rules, and they infer that observed differences in the votes result from differences in the rules (Blais and Carty Reference Blais and Carty1991; Clark and Golder Reference Clark and Golder2006). It is difficult to tell whether the correlation is spurious or not; causal inferences are always tricky in observational studies.
We propose a different approach: inviting people to vote under different systems and comparing their vote choice under these various systems. This quasi-experiment occurred during the first round of the French 2012 presidential elections. As done in a previous study conducted during the 2011 election in Ontario, Canada (Blais et al. Reference Blais, Héroux-Legault, Stephenson, Cross and Gidengilforthcoming), we created a website with sections providing information about four voting systems (one round, two rounds, alternative, and approval) and another section where people were invited to vote according to each of the four rules and to complete a short questionnaire (see www.voteaupluriel.org).
Three weeks before the election the website was open to the public. The website was advertised through many different routes: after a first phase of direct mailing to the academic world, the general media got involved and the website was widely advertised in the main French newspapers, on the Internet, and on the radio. More than 20,000 people visited the website. A total of 11,000 did cast their vote under each of the four rules and answered the short questionnaire at the end.Footnote 1 Among those participants, 8,044 had the right to vote in the election. Our analysis deals with these 8,044 voters.
The participants are not a representative sample of French voters. Those participants who are interested in politics, elections, and voting rules are probably overrepresented. Besides, we observed a strong Left bias. We correct this bias by weighting the participants so that the reported votes in the first round of the two-rounds election corresponds to the actual votes.
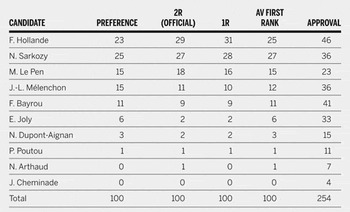
Our goal is to determine how many people vote differently from one system to the other, how many come to support a candidate who is not their preferred one, and who are these voters. “Sincere preference” is tapped in the short questionnaire through a simple and direct question: “Which presidential candidate do you prefer?” (See table 1, column 1.)
Preferences and Votes under the Four Voting Rules (%)

Note: The approval scores are the percentages of voters who approve the candidates, therefore they do not sum to 100. 1R = first round, 2R =second round; AV = alternative vote.
In 2012, 10 candidates were running for the presidency. The official results are presented in table 1, column 2. The top two candidates in the first round were François Hollande, with 29% of the vote, and Nicolas Sarkozy, with 27%. Hollande was elected in the second round, with 52% of the vote. A short description of the candidates follows.
• Nicolas Sarkozy (UMP, Union pour la Majorité Présidentielle), moderate conservative, was the incumbent. According to the preelection polls Sarkozy was very likely to go to the runoff.
• François Hollande (Parti Socialiste) was the main challenger and likely winner (after a runoff) according to the polls.
• Marine Le Pen (FN, Front National), extreme Right, was ranked third, according to the polls, and it would have been a big surprise if she had made it to the second round. UMP and FN had proscribed any kind of alliance.
• Jean-Luc Mélenchon (Front de Gauche) led a coalition of extreme Left parties. According to the polls it was nearly impossible for Mélenchon to go to the second round. As expected, Mélenchon invited his supporters to vote for Hollande at the second round although he maintained that he would not accept a position in a Hollande government.
• François Bayrou (Mouvement pour la Démocratie), a centrist candidate, tried to maintain an independent position between the Left and the Right. According to the polls he had no serious chance of being one of the top two candidates.
• Eva Joly (Europe Ecologie Les Verts), the Green candidate, was allied with the socialist party and had signed an agreement for the coming legislative elections. She had very little support in the polls.
• Nicolas Dupont-Aignan, a dissident from the UMP, had no chance to go to the second round.
• Philippe Poutou and Nathalie Arthaud were two Trotskyist candidates.
• Jacques Cheminade was an autonomous candidate.
Poutou, Arthaud, and Cheminade obtained very few votes.
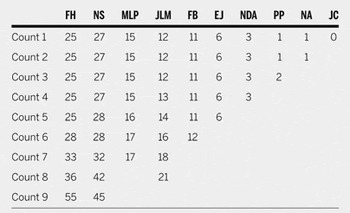
In table 1, columns 3 and 5 give the candidates' scores under the first round (1R) and approval voting respectively.Footnote 2 As explained previously, the participants have been weighted so that the votes in the first round of the two-rounds election correspond to the actual outcome. Column 4 gives the percentage of first rank obtained by the various candidates under the Alternative Vote (AV) (again weighted). Table 2 provides the complete AV counting.
Vote Count under the Alternative Vote (%)

Note: FN = François Hollande; NS = Nicolas Sarkozy; MLP = Marine Le Pen; JLM = Jean-Luc Mélenchon; FB = François Bayrou; EV = Eva Joly; NDA = Nicolas Dupont-Aignan; PP = Philippe Poutou; NA = Nathalie Arthaud; JC = Jacques Cheminade
PREFERENCES AND VOTE CHOICE
First, we look at the relationship between preferences and vote choice. This review allows us to estimate how many people vote sincerely for their preferred candidate. In this section we leave aside approval voting because the concept of “sincere voting” with this rule is unclear and, for AV, we consider only the first-ranked candidate.
Column 2 of table 1 shows, for each candidate, the (weighted) percentage of respondents who report this candidate as their preferred candidate. In terms of first preferences, Sarkozy comes first, with 25%, followed by Hollande with 23%, then Le Pen and Mélenchon with 15%, and Bayrou with 11%.
For each voting rule, we compute how many people voted for the person who they indicated in the questionnaire as their preferred candidate.Footnote 3 A vote is deemed to be sincere when it is cast for the preferred candidate. The proportion of sincere votes is 83% for one round (1R), 87% for two rounds (2R), and 88% for the alternative vote (AV). These results make sense. Studies of presidential elections in the United States and Mexico and direct prime ministerial elections in Israel suggest that about 10% of voters do not vote for their preferred candidate (see Abramson et al. Reference Abramson, Aldrich, Blais, Diamond, Diskin, Indridason, Lee and Levine2010). More desertion from sincere voting is indicated here which is not surprising given the large number of candidates, many of whom are not viable (Cox Reference Cox1997). In the questionnaire, we also asked the question: “Do you always vote for the candidate you prefer?” The answer was “No” for 30% of the respondents.
Note that the amount of insincere votes is 13% for the first round in the 2R system. This may be surprising because it is often thought that the first round of a two-rounds election allows people to vote sincerely according to their heart, with the understanding that they will have the opportunity to choose among the top two candidates in the second round. These results align with recent research that suggests that strategic voting exists in both two-rounds elections and in one-round elections (see Blais Reference Blais and Lewis-Beck2003).
As expected, the proportion of sincere votes is also high under AV (88%). In principle, AV allows people to express their first preference for an unviable candidate because their second or third preferences will be considered if necessary (see Tideman Reference Tideman2006). Still, the proportion of insincere first votes is far from being negligible, which suggests that strategic considerations come into play in alternative vote as well (see Laslier Reference Laslier2012).
The proportion of deserters is the highest among those who prefer Joly, the Green candidate: almost two-thirds (65%) under 1R and 2R, and 39% under AV. Desertion may occur toward nonviable candidates: 11.5% of Joly supporters voted for Mélenchon under 2R and, conversely, Joly received votes from voters who declared to prefer other candidates. Desertion is substantial among Mélenchon supporters (37% under 1R, 31% under 2R, and 24% under AV) and Bayrou supporters (28% under 1R and 2R and 16% with AV). Desertion is less than 5% for each of the top three candidates under 2R and for the top two candidates under 1R (6% of Le Pen supporters desert her under 1R). Some desertion of Sarkozy (4%) and Le Pen (8%) is seen under AV.
Hence, the phenomenon of insincere voting (as defined earlier: not voting for the preferred candidate) does not reduce to desertion of nonviable candidates. Nevertheless, as we would expect, the top three candidates get more votes under 1R, 2R, and AV than first preferences, especially with the first two voting rules, and all the other candidates obtain fewer votes than first preferences. This effect is stronger on the Left because there are several nonviable left candidates. Indeed, the main beneficiary is the socialist Hollande, who has 23% of first preferences and 31% of the vote under 1R, and the main losers are Mélenchon (from 15% of first preferences to 10% of 1R votes) and Joly (from 6% to 2%).
COMPARING THE VOTES
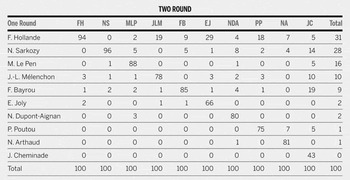
Let us look at the relationship between the three votes. As the reference, we use the two-rounds system, which is actually used in the election. Globally, 89% of the voters vote for the same candidate under 1R and 2R. We see in table 3 that among Hollande and Sarkozy voters (under 2R), only about 5% would vote differently under 1R. The percentage of switchers increases to 12% among Le Pen voters (most go to Sarkozy) and to 15%, 22%, and 34% respectively among Bayrou, Mélenchon, and Joly voters (most go to Hollande). The overall outcome is that the top two candidates get more votes with 1R (Hollande goes from 29% with 2R to 31% with 1R and Sarkozy from 27% to 28%) and that the third and fourth candidates lose (from 18% to 16% in the case of Le Pen and from 11% to 10% for Mélenchon).
Votes in the One Round Election (%) by Vote in the First Round of the Two-Rounds Election

Note: FN = François Hollande; NS = Nicolas Sarkozy; MLP = Marine Le Pen; JLM = Jean-Luc Mélenchon; FB = François Bayrou; EV = Eva Joly; NDA = Nicolas Dupont-Aignan; PP = Philippe Poutou; NA = Nathalie Arthaud; JC = Jacques Cheminade
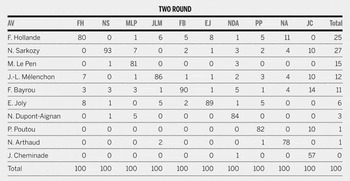
Table 4 indicates the link between vote choice in the AV and 2R elections. Globally, 86% vote for the same candidate in the two elections and 14% switch. Hollande voters in the 2R election are the most likely (20%) to switch in the AV election, mostly for Mélenchon and Joly. Interestingly, Le Pen also loses 19% of those who vote for her under 2R, mostly to the benefit of Sarkozy.Footnote 4 Sarkozy is the candidate who keeps the greatest proportion (93%) of his voters. All in all, Hollande's share of first votes under AV is four points lower than under 2R (25% versus 29%); Le Pen also loses three points (15% versus 18%) and the minor candidates do better, most especially Joly. Sarkozy remains with the same score (27%), which allows him to have more first choices than Hollande.
First Votes in the Alternative Vote Election (%) by Vote in the First Round of the Two-Rounds Election

Note: FN = François Hollande; NS = Nicolas Sarkozy; MLP = Marine Le Pen; JLM = Jean-Luc Mélenchon; FB = François Bayrou; EV = Eva Joly; NDA = Nicolas Dupont-Aignan; PP = Philippe Poutou; NA = Nathalie Arthaud; JC = Jacques Cheminade
THE STRUCTURE OF INDIVIDUAL AV BALLOTS
Under AV, voters can rank order all the candidates from first to last. The participants were asked to indicate at least their top three choices. Table 2 shows the vote count under AV, leading to, just like 2R, the election of Francois Hollande against Nicolas Sarkozy.
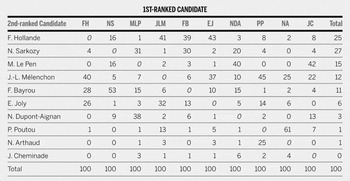
We first consider the relationship between the first and the second rank. Table 5 shows the relationship. We can see that 40% of second choices among those whose first choice is Hollande go to Mélenchon, 28% to Bayrou and 26% to Joly. In the case of Sarkozy, 53% of second choices are for Bayrou and 16% for Le Pen and Hollande. Note that many more Sarkozy supporters are willing to cast their second vote for Hollande than the reverse. The most popular second choice among Le Pen's supporters is, tellingly, not Sarkozy (who gets only 31%) but rather Dupont-Aignan (38%), who gets only 3% of first votes. Mélenchon supporters, as expected, give their second vote to either Hollande (41%) or Joly (32%). Those whose first choice is Bayrou give their second vote to the top two candidates, 39% to Hollande and 30% to Sarkozy. And finally Joly's supporters split their second votes between Hollande and Mélenchon.
Second-ranked Candidates (%) by First-ranked Candidate in the Alternative Vote Election

Note: FN = François Hollande; NS = Nicolas Sarkozy; MLP = Marine Le Pen; JLM = Jean-Luc Mélenchon; FB = François Bayrou; EV = Eva Joly; NDA = Nicolas Dupont-Aignan; PP = Philippe Poutou; NA = Nathalie Arthaud; JC = Jacques Cheminade
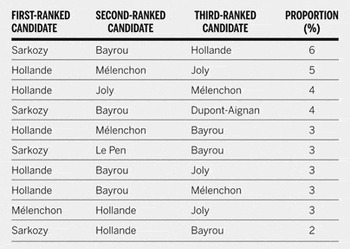
We determine which combinations of first, second, and third choices are the most frequent. Table 6 lists the 10 most frequent combinations. These 10 most frequent combinations together account for only 35% of all cases, a testimony to the great variety of preference orders among the participants.
The Ten Most Popular Combinations under AV

The most popular combination (6%) is Sarkozy-Bayrou-Hollande, indicating support for the status quo first, for the center second, and the moderate Left third. The second most frequent is Hollande-Mélenchon-Joly, representing the moderate Left, followed by the extreme Left and the Greens.
What is perhaps more striking in this list is that Sarkozy is either first or nonpresent, an indication that he was a polarizing candidate. The same is true for Le Pen who, despite being third on the first ballot, appears only in one of the combinations. At the opposite end, we find the centrist candidate Bayrou, who receives only 9% of the votes under 2R but is present in seven of the 10 most popular combinations.
Although Bayrou is often ranked quite high in the participants' AV ballots, when we look at the details of the vote transfers along the alternative-vote elimination path we observe that Bayrou is quickly eliminated (5th elimination) because, even if he is highly ranked, he is often behind one of the top two candidates. This pattern is the phenomenon of “squeezing of the center” often described for two-round voting and that works in a similar way under AV.
COULD THE RESULTS HAVE BEEN DIFFERENT?
From what we have seen so far, it seems that, for this election, voters' behavior under the three rules (1R, 2R, AV) is not so different. Moreover, the outcome is always the same, that is, Hollande is elected. Thus this question: would the result of the election have been the same under any voting rule?
In the vote section of the survey, we asked voters how they would vote at the second round of the election in the 10 hypothetical cases where the five main candidates (Hollande, Sarkozy, Le Pen, Mélenchon, and Bayrou) are present in the runoff.Footnote 5 It turns out that Bayrou wins against any opponent (with 53% of the votes against Hollande, 66% against Sarkozy, 65% against Mélenchon, and 79% against Le Pen).
If we trust this observation we might conclude that Bayrou would be elected under voting rules that elect the Condorcet candidate when there is one.Footnote 6 We did not propose such voting rules, but we invited people to vote according to approval voting. Under this rule people can vote for as many candidates as they want. The approval scores are as follows: Hollande 46% and Bayrou 41%, ahead of Sarkozy 36% (see the last column of table 1). Compared with the previous rules, these results strengthen the centrist candidate (Bayrou).
CONCLUSION
We offered French voters the opportunity to vote under different voting rules. Most people vote for the same candidate that they support under the first vote of a two-rounds election, under a one-round system, or under alternative voting (first choice). But a substantial minority (respectively 11% and 14%) vote differently. The top two candidates get slightly more votes in a one-round election while the less-popular candidates obtain slightly more first choices under AV, compared to the two rounds election. We also find that, respectively, 12%, 13%, and 17% of the voters do not vote for their preferred candidate under AV, at the first round of the two-round election, and under one-round voting. All these results are consistent with what the literature suggests about the impact of these voting systems on voters' choice.
Finally, an inherent limit of this kind of quasi-experiment is that the political offer (the set of candidates) might be different under different voting rules. This study only deals with the voters' behavior, which is only one aspect of the impact of voting systems.
ACKNOWLEDGMENTS
We thank Sri Srikandan for his handling of the website and a referee for his or her useful comments.