




No CrossRef data available.
Article contents
Mapping the neural systems that mediate the Paced Auditory Serial Addition Task (PASAT)
Published online by Cambridge University Press: 06 February 2004
Abstract
The paced auditory serial addition task (PASAT), in which subjects hear a number-string and add the two most-recently heard numbers, is a neuropsychological test sensitive to cerebral dysfunction. We mapped the brain regions activated by the PASAT using positron emission tomography (PET) and 15O-water to measure cerebral blood flow. We parsed the PASAT by mapping sites activated by immediate repetition of numbers and by repetition of the prior number after the presentation of the next number in the series. The PASAT activated dispersed non-contiguous foci in the superior temporal gyri, bifrontal and biparietal sites, the anterior cingulate and bilateral cerebellar sites. These sites are consistent with the elements of the task that include auditory perception and processing, speech production, working memory, and attention. Sites mediating addition were not identified. The extent of the sites activated during the performance of the PASAT accounts for the sensitivity of this test and justifies its use in a variety of seemingly disparate conditions. (JINS, 2004, 10, 26–34.)
Information
- Type
- Research Article
- Information
- Journal of the International Neuropsychological Society , Volume 10 , Issue 1 , January 2004 , pp. 26 - 34
- Copyright
- © 2004 The International Neuropsychological Society
INTRODUCTION
The Paced Auditory Serial Additions Task (PASAT) was introduced in 1974 by Gronwall as a tool to evaluate patients with traumatic brain injury (Gronwall & Wrightson, 1974). In this test, the subject hears a series of one digit numbers and is asked to add the two most recently presented numbers. Thus, the subject might hear, 1, (no response) 3, (speak 4), 7, (speak 10), etc. To vary the difficulty of the task, the interstimulus interval can be altered. It is usually set between 2.4 and 1.2 s. By decreasing the interstimulus interval it is possible to lower the ceiling for this test to a point where normal subjects begin to make errors and fail. This contributes to making this test highly sensitive but non-specific. Since its introduction, normative values by age, educational level and ethnicity have been published (Diehr et al., 1998). Because of its sensitivity, the PASAT has been used under a variety of circumstances to evaluate diverse conditions including the effects of nocturnal airway obstruction (Weersink et al., 1997), sleep fragmentation (Martin et al., 1996), hypoglycemia (Gold et al., 1995), in industrial medicine to detect the effects of solvents (Rasmussen et al., 1993) and mercury exposure (Uzzell & Oler, 1986), and the adaptation to altitude (White, 1984). Recently, the PASAT has been used widely in patients with multiple sclerosis and chronic fatigue syndrome (Bever, Jr., et al., 1995; Cohen et al., 2000, 2001; DeLuca et al., 1993; Diamond et al., 1997; Fischer et al., 2000; Fisk & Archibald, 2001; Fulton et al., 1999; Johnson et al., 1996).
Typically, the test is thought to evaluate the cognitive domains of attention and executive control, working memory, and speed of information processing (Diehr et al., 1998). However, this is a simplification of the processing demands of the test, since performance also depend on additional modalities including auditory perception, speech comprehension, speech production and arithmetic computation. We hypothesized that positron emission tomographic (PET) imaging, using 15O water to measure cerebral blood flow, an index of neural activity (Posner et al., 1988) would identify sites associated with the performance of the PASAT. These sites would, at a minimum, include primary and auditory association cortex (Lockwood et al., 1999), motor speech areas including those associated with the face area on the Rolandic fissure (Petersen & Fiez, 1993), working memory, particularly the articulatory loop (Fletcher et al., 1995a) and the anterior attention system, particularly the anterior cingulate gyrus (Benedict et al., 1998; 2001). We parsed the complete PASAT by creating additional separate tasks. Therefore, we also scanned subjects as they repeated a number they had just heard (repeat immediate) and as they repeated a number retained in working memory until after the next number was presented (repeat prior).
METHODS
Research Participants
At the time of enrollment, all subjects gave written informed consent to participate in protocols that had been approved by the Human Subjects, Research and Development, Radiation Safety and Radioactive Drug Research Committees in accord with the Declaration of Helsinki. Subjects were screened using a structured interview and check-list to exclude those with a history of head injury, substance abuse, neurological, or psychiatric diseases or concurrent use of medications affecting the central nervous system. A neuropsychological test battery was administered as an additional measure designed to assure the normality of our population. We studied 7 men and 4 women aged 27.0 ± 11 years.
Scans and Neuropsychological Tests
On the day of the investigation subjects underwent PET scans in the morning followed by a series of neuropsychological tests and evaluations in the afternoon. Tests included the PASAT with interstimulus intervals of 2.0 and 2.4 s (Gronwall & Wrightson, 1974), the Trailmaking A and B tests (Lezak, 1983), the auditory reaction time (Lezak, 1983), the California Verbal Learning Test (Delis et al., 1987), the Wisconsin Card Sorting test (Heaton, 1981), the Stroop task (Stroop, 1935) and the Vocabulary subtest of the Wechsler Adult Intelligence Scale–Revised (Wechsler, 1981). Additional evaluations were made with the Fatigue Assessment Scale (Krupp et al., 1989), the Beck Depression Inventory (Beck & Steer, 1987), the Beck Anxiety Inventory (Beck & Steer, 1993).
Scans of PASAT and elements
Numbers, spoken by RL, were recorded using a Neuroscan Stim system (El Paso, TX) and stored in sound files, one file corresponding to each digit. During the tasks, spoken numbers were delivered binaurally via Etymotic insert earphones using the Stim system programmed to deliver spoken numbers at two second intervals at the 90 dB sound pressure level setting (this corresponds to hearing levels of about 80 dB, typical of conversational speech). Before each scan, instructions for each condition were displayed on a monitor and the subjects were asked to read them aloud. To familiarize subjects with the task, a 10 number PASAT sequence was administered during the transmission scan.
Subjects were scanned a total of seven times using four conditions: Condition 1: rest, eyes open, ears plugged, no auditory stimuli; Condition 2: repeat number, subjects were told that they would hear a series of numbers, the task was to repeat each number as soon as it was presented; Condition 3: repeat prior number, subjects were told that they would hear a series of numbers, and the task was to repeat the number that was heard just prior to the most recently presented number; Condition 4: PASAT, subjects were told that they would hear a series of numbers, and the task was to speak the sum of the two most recently presented numbers. Active conditions (i.e., 2, 3, and 4) were repeated. Different number sequences were used for each task and its repetition (i.e., six different sequences were employed). To maintain uniformity across subjects, and to assure completion of all four conditions in the shortest possible time and with a maximal temporal separation of discrete tasks, the following order was used throughout: 1, 4, 2, 3, 4, 2, 3. Thus, Tasks 2, 3, and 4 were always separated by two other tasks.
CBF imaging
Subjects were placed in a comfortable supine position in a Siemens ECAT 951/31R tomograph operated in the 2-D mode. After insertion of the earphones, the head was immobilized with a thermoplastic mask and the subject was positioned so that the inferior image plane coincided with the cantho-meatal line. A 20-min transmission scan was obtained. Scans for each condition were preceded by a brief instruction-training session, as described above. This also allowed for a verification that all systems were functioning properly. At the beginning of each scanning condition, the task was started, the camera was activated, and an intravenous bolus injection of 70 mCi or less of 15O-water was given. The camera was programmed to record a total of 17 frames of images of increasing duration. At the conclusion of the scanning session, the time of arrival of the bolus of 15O-water in the brain was determined and a 60 second image was derived from the appropriate image frames. The summed image files were reconstructed using a 128 × 128 matrix, a Hann filter with a cut-off filter set at 0.4 cycles per pixel, a zoom factor of 2.5 and the measured attenuation.
Data analysis
The summed images were converted to the Analyze format and edited on a slice-by-slice basis to remove extra-cerebral activity and analyzed using the 1995 and 1996 versions of statistical parametric mapping (SPM; Friston, 1994, Friston et al., 1995, for additional documentation see http://www.fil.ion.ucl.ac.uk/spm/dox.html). SPM includes the following steps: (1) realignment of all images for each subject to eliminate the effects of small inter-scan movements, (2) normalization into Talairach space, and (3) smoothing with a 15 mm kernel. Statistical analyses were performed after accounting for differences in cerebral blood flow and the injected dose of the tracer by an analysis of covariance. The results of the analyses are displayed in the “glass brain” format in which the most significant voxel is projected onto coronal, sagittal, and transaxial planes. In addition, the Talairach coordinates of sites of maximum effects and their size were listed along with Z scores and p values (Talairach & Tournoux, 1988). The coordinate convention is x (right positive, left negative), y (anterior positive, posterior negative) and z (superior positive, inferior negative). It should be noted that the extent of clusters reaches beyond the site of the voxel with the maximum Z score and that several maxima may be found in any given cluster. The analytical threshold for displaying the Z score images was set at Z = 3.09 (p = .001, uncorrected for multiple comparisons). All p values in the tables, derived from the SPM analyses, were corrected for multiple comparisons and pertain to differences between conditions at the specified voxel.1
This correction takes into account the fact that Z images contain multiple pixels with values that are not completely independent due to smoothing and the resolution of the PET camera. SPM introduces the term “resel” to describe the number of independent sites in a Z image (always a number smaller than the number of pixels). The number of resels may vary substantially among the comparisons to be considered, thereby affecting the uncorrected p threshold required to attain significance at the typical p = .05 level. To simplify tabulation of the results, SPM makes the multiple comparison adjustment internally and tabulates a corrected p value, i.e., the probability that the reported difference is due to chance, after accounting for the fact that multiple comparisons were made.
In preliminary contrasts we subtracted resting state scans from each of the active tasks. To avoid ambiguities concerning the nature of the neural activity present in the resting state, particularly activity associated with covert speech (Gusnard et al., 2001) and to parse the PASAT, the following additional contrasts were also evaluated: PASAT–(repeat immediate), PASAT–(repeat prior) and (repeat prior–repeat immediate).
RESULTS
The study participants all performed within the age-corrected normal range for each of the neuropsychological tests in the battery.
PASAT Imaging
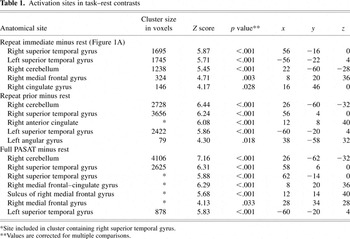
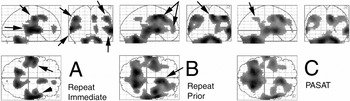
SPM Z images comparing the PASAT and its parsed elements to rest are shown in Figure 1. Tabulations of the data are presented in Table 1. In this, and other tabulations of the data, we included only those specific sites that met the p = .05 criterion after correction for multiple comparisons. Some clusters evident on the glass brain images do not contain maxima that meet this criterion and are therefore not tabulated. The contrast (repeat immediate)–rest was the simplest of the three conditions and produced the least extensive activation, as shown in Figure 1A. Clusters containing voxels activated at the p = .05 threshold (corrected) were present (in order of descending Z scores) in auditory cortical regions of both superior temporal gyri, the cerebellum (dentate nuclear area), the right anterior cingulate and a more anteriorly located midline site.
Activation sites in task–rest contrasts


Active conditions compared to rest. The SPM Z images show the results of comparing the PASAT and its elements to the resting state. In each panel, z scores are projected on to sagittal, coronal and transaxial planes. Arrows in part A indicate superior temporal gyrus or auditory cortical sites and motor strip activation sites. Arrows in part B depict cingulate gyrus activation sites. The arrow in part C indicates a parietal site, possibly associated with addition, that fails to reach the voxel level of significance. The right hemisphere is shown on the right side of the coronal plane images and the bottom half of the transaxial plane images. The threshold was p(uncorrected) = .001 which corresponds to Z = 3.09.
The (repeat prior)–rest contrast activated four clusters in which there were voxels that reached a corrected p value that was ≤ .05, as shown in Figure 1B. The highest Z score was in the right cerebellum in a cluster that extended to include the left cerebellum. Both right and left superior temporal gyri were activated (higher Z scores were found on the right). The right superior temporal gyrus cluster extended medially to include a maximum in the right anterior cingulate gyrus. A fourth cluster was centered in the left angular gyrus.
The PASAT–rest contrast activated three clusters in which voxels reached a corrected p value that was ≤ .05, as shown in Figure 1C. The largest cluster, and the one that contained the voxel with the highest Z score was found in the cerebellum. Specific sites included both dentate nuclei. The other two clusters included sites in auditory cortical areas in the right and left superior temporal gyri. There were also two maxima in an activation site spanning the anterior cingulate and the medial aspect of the frontal lobe. Additional sites of significant activation were present in the right dorsal-lateral prefrontal cortex.
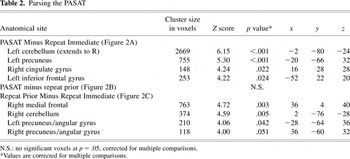
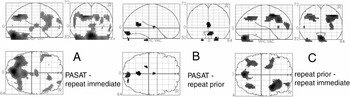
We parsed the PASAT by exploring additional contrasts, shown in Figures 2A–C and tabulated in Table 2. In the PASAT–(repeat immediate) contrast (Figure 2A), activation sites containing voxels with corrected p values < .05 were present in the midline cerebellum and both cerebellar hemispheres, the left parital-occipital region, the right anterior cingulate and the left inferior frontal gyrus. For both of these parietal and frontal sites, there was a similarly positioned cluster of voxels in the opposite hemisphere that appeared at the default threshold, but failed to reach significance at the voxel level. None of the voxels in the PASAT–(repeat prior) contrast, shown in Figure 2B, were significant at the voxel level. The contrast (repeat prior)–(repeat immediate) yielded the results shown in Figure 2C. Clusters with activated sites significant at a corrected p < .05 level were found, in descending Z-score order, in the right dorsal–lateral frontal area, midline cerebellum and a site spanning the left Rolandic fissure. Voxels in the parietal sites appeared at the default threshold, but failed to reach significance at the voxel level.
Parsing the PASAT


Parsing the PASAT. Each panel shows the contrast indicated. Panels A and B show the result of subtraction repeat tasks from the PASAT. The absence of cingulate activation in each of these contrasts suggests similar levels of attention were required in all tasks. We conclude, on the basis of the data in B, that the repeat prior and PASAT tasks make similar demands on brain function. Note the disappearance of activated sites in the superior temporal gyrus and motor strip, demonstrating the validity of the subtraction technique. The (repeat prior)–(repeat immediate) contrast activates brain regions associated with working memory. Image orientation and display thresholds are as in Figure 1.
Order Effect
To determine whether the fixed order of task presentation affected the results of our study, we conducted additional tests. We failed to find any sites significant at the corrected p ≤ .05 level in these six contrasts. We also performed an analysis of covariance, assigning the value of 1 to the first scan, 2 to the second, etc., and searching the image set for voxels with significant positive or negative correlations with the scan order. We failed to find any voxels with a significant positive correlation. That is, there were no sites where blood flow increased significantly as a function of increasing scan number. In the search for sites where blood flow decreased as a function of increasing scan number we identified a 225 voxel cluster in the posterior cingulate (p = .03 at x = 6, y = −16, z = 38). It does not overlap any of the sites we tabulated. Similar sites have been associated with auditory tasks in our studies and those of others who have used PET and functional magnetic resonance imaging techniques (Dittmann-Balcar et al., 2001; Kiehl et al., 2001; Lockwood et al., 1999). This decrease may be due to a habituation to auditory stimuli.
DISCUSSION
We have used PET to map the brain regions that mediate the performance of the PASAT and some of its elements. Neuropsychologists use the PASAT as a sensitive, but non-specific instrument to evaluate the cognitive domains of attention and executive function, working memory, and speed of information processing (Diehr et al., 1998). However, this test also requires additional neural resources devoted to auditory perception, speech comprehension, speech production, and arithmetic computation. Our data show that the performance of the PASAT depends on neural systems involving the anterior cingulate, frontal, superior temporal, and parietal cortices and the cerebellum. The extent of these systems, including the white matter tracts that connect them, may explain why this test is both sensitive and non-specific.
Each of the three active-state tasks had similarities in that they all involved auditory perception, speech comprehension and speech. Thus, it was expected that there would be similarities among the activated sites, compared to the resting state, as shown in Figure 1. These images are shown at the customary threshold of p = .001 without a correction for multiple comparisons. A contention that there is a significant difference in activity at a specific site depends on making a multiple comparison correction. All the p values in the tables have been subjected to this correction. Activation of the superior temporal gyrus and Rolandic regions are seen in Figures 1A–C and summarized in Table 1. These sites are identified with arrows in Figure 1A. A large number of studies have shown that bilateral superior temporal gyrus activations occur in response to auditory stimuli. Simple stimuli, delivered to just one ear, activate a small region of the superior temporal gyrus centered in primary auditory cortex (Lockwood et al., 1999). More complex stimuli activate more extensive portions of primary and associative auditory cortex (Petersen et al., 1988; Salvi et al., 2002) particularly when presented binaurally (O'Leary et al., 1996). Activation of the sensory–motor face and mouth areas, associated with spoken responses, is also to be expected.
We did not find activation of Broca's area in the active task versus rest contrasts. There are several possible explanations. First, it is likely that covert or internal speech involving Broca's area is present in the so-called resting state (Gusnard et al., 2001). Thus, when “rest” is subtracted from a condition involving active speech, there would be no significant result. The activity increases over the Rolandic fissure are consistent with this explanation. In addition, the relatively long interstimulus interval may contribute to minimal activation. The addition of more subjects would be expected to increase the probability of finding Broca-associated activation.
Right anterior cingulate gyrus activations are also seen in each of these contrasts and are illustrated by the arrows in Figure 1B. This brain region has been the subject of intense investigation and several roles have been assigned to it. In an earlier study, we found activation of the cingulate during the performance of an auditory continuous performance task (Benedict et al., 1998). This task required subjects to monitor a stream of syllables and press a button in response to the target. Activation of the supplementary motor area and a more anterior portion of the cingulate were found. To separate the attentional from the motor elements, the task was modified so that the subjects made covert rather than overt responses. This resulted in clear separation of the supplementary motor area from more anteriorly and inferiorly placed sites in the anterior cingulate associated with attention (Benedict et al., 2001). In the present study, each of our tasks involved a preparation to act and a motoric response that undoubtedly activated supplementary motor area, as shown in the figures. In addition, each of the tasks has an attentional element that is likely to activate more anterior portions of the anterior cingulate (Benedict et al., 2001; Posner, 1995). More recent studies have examined the specific nature of the evaluative functions of the anterior cingulate (Botvinick et al., 1999; Carter et al., 2000). Our study was not designed to clarify the role of this brain region. Instead, we sought to identify sites that were activated during the performance of this commonly used test, to better understand its clinical relevance. Cingulate sites identified are likely to mediate the attentional and executive functions that the PASAT is used to probe.
If the right anterior cingulate is a critical element in the mediation of attention, one might expect cingulate activity to increase steadily in the following task order: rest, repeat immediate, repeat prior and PASAT. Figure 3 shows the relative response at the site of maximal anterior cingulate activation during the performance of the PASAT for each of these four conditions. There was a significant increase at this site for each of the active tasks compared to rest, as shown in Figure 1. However, as shown in Figure 3, there was a substantial overlap of the relative blood flow values for each scan for each of the three active tasks we employed. The absence of any significant difference in cingulate activity among the three active tasks is shown by the absence of a cingulate site in Figures 2A–C in which we show the results of parsing the PASAT into its components. Several explanations are possible. It is possible that this intuitive presumption is incorrect, and each of the experimental conditions requires an equivalent amount of attention and hence, cingulate resources. Thus, the seemingly simple task of repeating the number just heard may result in maximal cingulate activity in a PET environment. A more likely explanation is that the system is non-linear and that there is an asymptotic increase in cingulate activity with increasing attentional demands and that all three active tasks were close to the asymptotic plateau. This would be similar to the results we found when we monitored neural activity in response to increases in the intensity of tonal auditory stimuli. In that study, we found an asymptotic rise to a plateau level of activation at multiple sites in the central auditory system (Lockwood et al., 1999). Similar considerations may apply to the PASAT paradigm.

Mean and individual task-specific relative CBF values for each condition are shown for the cingulate gyrus voxel at which the PASAT–rest difference was maximal. Each point represents a value from one scan. Note, each subject was scanned once at rest and twice during each active condition.
Both the PASAT and the repeat prior tasks require brief storage of a token in working memory. This is the primary difference between the (repeat immediate) and (repeat prior) conditions and is probably responsible for the result of the (repeat prior)–(repeat immediate) contrast shown in Figure 2C. Activation of the dorsal-lateral prefrontal cortex and parietal cortices, seen in Figure 2C and other contrasts, have been observed in other tasks involving working memory (Fletcher et al., 1995b; Ghaem et al., 1997; Grasby et al., 1994; Smith et al., 1998).
Cerebellar activation was prominent in each of the three active tasks compared to rest, as shown in Figures 1A–C, and in the comparison of the two most complex tasks (PASAT and repeat prior) to the repeat immediate task, as shown in Figure 2A and 2C. This finding is consistent with the emerging concept that the role of the cerebellum extends far beyond the task of coordinating motor actions. A substantial number of both PET and MRI studies have demonstrated activation of the cerebellum in a variety of attentional or cognitively demanding tasks or both (Allen et al., 1997; Fiez, 1996).
The repeat prior and PASAT tasks appear to make very similar demands on neural systems. This is shown most clearly by the absence of any activations that are significant at the voxel level in the PASAT–(repeat prior) contrast shown in Figure 2B and by the similarities in the patterns of activation when each of these tasks was compared to rest, as shown in Figure 1A and 1B. The addition of two numbers forms the essential difference between these two tasks. There are several possible explanations for our failure to identify an “addition system.” The most likely explanation may be attributable to the fact that the addition of two one-digit numbers is a relatively simple task. Simple tasks that require minimal effort are likely to require minimal neural activity. More complex mathematical tasks, studied by others, have revealed specific math-related neural sites (Dehaene et al., 1999). It is reasonable to assume that simple addition is a highly practiced task for our subjects. Other functional imaging studies have shown that practice has substantial effects on site activation (Raichle et al., 1994). It is also possible that, in spite of the instructions, subjects covertly added numbers during the non-PASAT tasks. Finally, the addition of more subjects to the study may have permitted us to identify significant sites related to the computational element of the PASAT. This is suggested by the presence of local maxima in parietal sites that failed to reach significance at the voxel level as shown by the arrow in Figure 1C.
Several other groups have used functional imaging techniques to evaluate the PASAT. Schweitzer et al. compared the PASAT to the task of randomly speaking numbers in six subjects (Schweitzer et al., 2000). Maximal changes in activity were present in the left superior temporal gyrus and the right inferior frontal gyrus. Other sites were present in the left superior temporal gyrus, the occipital lobe, premotor cortex, thalamus and others. These sites appeared at an p threshold of .005, uncorrected for multiple comparisons (we used more stringent threshold of p = .001). The results from correcting these p values for multiple comparisons were not reported. Differences in the baseline condition and their use of a longer interstimulus interval (2.4 vs. 2.0 s) make it difficult to make direct comparisons of their data with ours. Christodoulou et al. used a modified PASAT in which subjects made no spoken response and lifted a finger if the digit sum equaled 10 (Christodoulou et al., 2001). In a comparison of this modified PASAT to combined baseline and control states in seven subjects, they found sites with z scores in excess 4.0 in the left medial frontal gyrus, bilateral superior temporal gyri and the left middle temporal gyrus. Activation of the anterior cingulate was not evident. The activated sites were consistent with the working memory and auditory receptive elements of the modified PASAT. In a final study of 20 insulin-treated diabetics, a decrease in activity in the right anterior and left posterior cingulate were reported in the activated state compared to rest (Deary et al., 1994). We find it difficult to relate their findings to ours.
In our study, the neural sites activated during the performance of the PASAT conform well to the expectations based on a diverse group of functional imaging studies. The performance of the PASAT is associated with activation of temporal lobe sites associated with auditory perception; anterior cingulate sites associated with attention; bifrontal and biparietal sites associated with working memory; and the cerebellum, increasingly associated with a variety of cognitive tasks. The sensitivity and lack of specificity are consistent with this multiplicity of sites. Based on our data, neuropsychologists are well justified in the continued use of the PASAT as a clinical tool to evaluate diverse populations where there is an expectation or possibility of subtle cerebral dysfunction.
ACKNOWLEDGMENTS
We appreciate the efforts of the many members of the Center for PET for their contributions to this study. This work was supported, in part, by grants from the National Institute on Disability and Rehabilitation Research (NIDRR) of U.S. Department of Education (Field Initiated Research Grant CFDA 133G) to Richard T. Linn, and the James H. Cummings Foundation, Buffalo, NY to Alan H. Lockwood.
References
REFERENCES
Allen, G.,
Buxton, R.B.,
Wong, E.C., &
Courchesne, E.
(1997).
Attentional activation of the cerebellum independent of motor
involvement.
Science,
275,
1940–1943.Google Scholar
Beck, A.T. &
Steer, R.A.
(1987).
Beck Depression Inventory: Manual.
San Antonio, TX:
The Psychological Corporation.
Beck, A.T. &
Steer, R.A.
(1993).
Manual for the Beck Anxiety Inventory.
San Antonio, TX:
The Psychological Corporation.
Benedict, R.H.B.,
Lockwood, A.H.,
Shucard, J.L.,
Shucard, D.W.,
Wack, D., &
Murphy, B.
(1998).
Functional neuroimaging of attention in the auditory modality.
Neuroreport,
9,
121–126.Google Scholar
Benedict, R.H.B.,
Shucard, D.W.,
Santa Maria, M.P.,
Shucard , J.L.,
Abara, J.P,
Coad, M.L.,
Wack, D.,
Sawusch, J., &
Lockwood, A.H.
(2001).
Covert auditory attention generates activation in
rostral/dorsal anterior cingulate cortex.
Journal of Cognitive Neuroscience,
14,
637–645.Google Scholar
Bever, C.T., Jr.,
Grattan, L.,
Panitch, H.S., &
Johnson, K.P.
(1995).
The Brief Repeatable Battery of Neuropsychological Tests for
Multiple Sclerosis: A preliminary serial study.
Multiple Sclerosis,
1,
165–169.Google Scholar
Botvinick, M.,
Nystrom, L.E.,
Fissell, K.,
Carter, C.S., &
Cohen, J.D.
(1999).
Conflict monitoring versus selection-for-action in anterior
cingulate cortex.
Nature,
402,
179–181.Google Scholar
Carter, C.S.,
Macdonald, A.M.,
Botvinick, M.,
Ross, L.L.,
Stenger, V.A.,
Noll, D., &
Cohen, J.D.
(2000).
Parsing executive processes: Strategic vs. evaluative functions of
the anterior cingulate cortex.
Proceedings of the National Academy of Sciences USA,
97,
1944–1948.Google Scholar
Christodoulou, C.,
DeLuca, J.,
Ricker, J.H.,
Madigan, N.K.,
Bly, B.M.,
Lange, G.,
Kalnin, A.J.,
Liu, W.C.,
Steffener, J.,
Diamond, B.J., &
Ni, A.C.
(2001).
Functional magnetic resonance imaging of working memory impairment
after traumatic brain injury.
Journal of Neurology, Neurosurgery and Psychiatry,
71,
161–168.Google Scholar
Cohen, J.A.,
Cutter, G.R.,
Fischer, J.S.,
Goodman, A.D.,
Heidenreich, F.R.,
Jak, A.J.,
Kniker, J.E.,
Kooijmans, M.F.,
Lull, J.M.,
Sandrock, A.W.,
Simon, J.H.,
Simonian, N.A., &
Whitaker, J.N.
(2001).
Use of the multiple sclerosis functional composite as an outcome
measure in a phase 3 clinical trial.
Archives of Neurology,
58,
961–967.Google Scholar
Cohen, J.A.,
Fischer, J.S.,
Bolibrush, D.M.,
Jak, A.J.,
Kniker, J.E.,
Mertz, L.A.,
Skaramagas, T.T., &
Cutter, G.R.
(2000).
Intrarater and interrater reliability of the MS functional
composite outcome measure.
Neurology,
54,
802–806.Google Scholar
Deary, I.J.,
Ebmeier, K.P.,
MacLeod, K.M.,
Dougall, N.,
Hepburn, D.A.,
Frier, B.M., &
Goodwin, G.M.
(1994).
PASAT performance and the pattern of uptake of 99mTc-exametazime in
brain estimated with single photon emission tomography.
Biological Psychology,
38,
1–18.Google Scholar
Dehaene, S.,
Spelke, E.,
Pinel, P.,
Stanescu, R., &
Tsivkin, S.
(1999).
Sources of mathematical thinking: Behavioral and brain-imaging
evidence.
Science,
284,
970–974.Google Scholar
Delis, D.C.,
Kramer, J.H.,
Kaplan, E., &
Ober, B.A.
(1987).
California Verbal Learning Test: Adult version.
San Antonio, TX:
The Psychological Corporation.
DeLuca, J.,
Johnson, S.K., &
Natelson, B.H.
(1993).
Information processing efficiency in chronic fatigue syndrome and
multiple sclerosis.
Archives of Neurology,
50,
301–304.Google Scholar
Diamond, B.J.,
DeLuca, J.,
Kim, H., &
Kelley, S.M.
(1997).
The question of disproportionate impairments in visual and auditory
information processing in multiple sclerosis.
Journal of Clinical and Experimental Neuropsychology,
19, 34–42.Google Scholar
Diehr, M.C.,
Heaton, R.K.,
Miller, W., &
Grant, I.
(1998).
The Paced Auditory Serial Addition Task (PASAT): Norms for age,
education, and ethnicity.
Assessment,
5,
375–387.Google Scholar
Dittmann-Balcar, A.,
Juptner, M.,
Jentzen, W., &
Schall, U.
(2001).
Dorsolateral prefrontal cortex activation during automatic auditory
duration-mismatch processing in humans: A positron emission tomography
study.
Neuroscience Letters,
308,
119–122.Google Scholar
Fischer, J.S.,
Priore, R.L.,
Jacobs, L.D.,
Cookfair, D.L.,
Rudick, R.A.,
Herndon, R.M.,
Richert, J.R.,
Salazar, A.M.,
Goodkin, D.E.,
Granger, C.V.,
Simon, J.H.,
Grafman, J.H.,
Lezak, M.D.,
O'Reilly Hovey, K.M.,
Perkins, K.K.,
Barilla-Clark, D.,
Schacter, M.,
Shucard, D.W.,
Davidson, A.L.,
Wende, K.E.,
Bourdette, D.N., &
Kooijmans-Coutinho, M.F.
(2000).
Neuropsychological effects of interferon beta-1a in relapsing
multiple sclerosis. Multiple Sclerosis Collaborative Research
Group.
Annals of Neurology,
48,
885–892.Google Scholar
Fisk, J.D. &
Archibald, C.J.
(2001).
Limitations of the Paced Auditory Serial Addition Test as a measure
of working memory in patients with multiple sclerosis.
Journal of the International Neuropsychological Society,
7,
363–372.CrossRefGoogle Scholar
Fletcher, P.C.,
Dolan, R.J., &
Frith, C.D.
(1995a).
The functional anatomy of memory.
Experientia,
51,
1197–1207.Google Scholar
Fletcher, P.C.,
Frith, C.D.,
Grasby, P.M.,
Shallice, T.,
Frackowiak, R.S., &
Dolan, R.J.
(1995b).
Brain systems for encoding and retrieval of auditory-verbal memory.
An in vivo study in humans.
Brain,
118,
401–416.Google Scholar
Friston, K.J.
(1994).
Statistical Parametric Mapping. In
R.W. Thatcher,
M. Hallett,
T.A. Zeffiro,
E.R. John, &
M. Huerta (Eds.),
Functional neuroimaging: Technical foundations
(Vol. 8, pp.
79–93).
New York:
Academic Press.
Friston, K.J.,
Holmes, A.P.,
Worsley, K.J.,
Poline, J.P,
Frith, C.D., &
Frackowiak, R.S.J.
(1995).
Statistical parametric maps in functional imaging: A general linear
approach.
Human Brain Mapping,
2,
189–210.Google Scholar
Fulton, J.C.,
Grossman, R.I.,
Udupa, J.,
Mannon, L.J.,
Grossman, M.,
Wei, L.,
Polansky, M., &
Kolson, D.L.
(1999).
MR lesion load and cognitive function in patients with
relapsing-remitting multiple sclerosis.
American Journal of Neuroradiology,
20,
1951–1955.Google Scholar
Ghaem, O.,
Mellet, E.,
Crivello, F.,
Tzourio, N.,
Mazoyer, B.,
Berthoz, A., &
Denis, M.
(1997).
Mental navigation along memorized routes activates the hippocampus,
precuneus, and insula.
Neuroreport,
8,
739–744.Google Scholar
Gold, A.E.,
Deary, I.J.,
MacLeod, K.M.,
Thomson, K.J., &
Frier, B.M.
(1995).
Cognitive function during insulin-induced hypoglycemia in humans:
Short-term cerebral adaptation does not occur.
Psychopharmacology,
119,
325–333.Google Scholar
Grasby, P.M.,
Frith, C.D.,
Friston, K.J.,
Simpson, J.,
Fletcher, P.C.,
Frackowiak, R.S., &
Dolan, R.J.
(1994).
A graded task approach to the functional mapping of brain areas
implicated in auditory-verbal memory.
Brain,
117,
1271–1282.Google Scholar
Gronwall, D. &
Wrightson, P.
(1974).
Delayed recovery of intellectual function after head injury.
Lancet
2,
605–609.Google Scholar
Gusnard, D.A. &
Raichle, M.E.
(2001).
Searching for a baseline: Functional imaging and the resting human
brain.
Nature Reviews Neuroscience,
2,
685–694.Google Scholar
Heaton, R.K.
(1981).
Wisconsin Card Sorting Test manual.
Odessa, FL:
Psychological Assessment Resources.
Johnson, S.K.,
DeLuca, J.,
Diamond, B.J., &
Natelson, B.H.
(1996).
Selective impairment of auditory processing in chronic fatigue
syndrome: A comparison with multiple sclerosis and healthy
controls.
Perceptual and Motor Skills,
83,
51–62.Google Scholar
Kiehl, K.A.,
Laurens, K.R.,
Duty, T.L.,
Forster, B.B., &
Liddle, P.F.
(2001).
Neural sources involved in auditory target detection and novelty
processing: An event-related fMRI study.
Psychophysiology,
38,
133–142.Google Scholar
Krupp, L.B.,
LaRocca, N.G.,
Muir-Nash, J., &
Steinberg, A.D.
(1989).
The fatigue severity scale.
Archives of Neurology,
48,
1121–1130.Google Scholar
Lezak, M.D.
(1983).
Neuropsychological assessment.
New York:
Oxford University Press.
Lockwood, A.H.,
Salvi, R.J.,
Coad, M.L.,
Arnold, S.A.,
Wack, D.S.,
Murphy, B.W., &
Burkard, R.F.
(1999).
The functional anatomy of the normal human auditory system:
Responses to 0.5 and 4.0 kilohertz tones at varied intensities.
Cerebral Cortex,
9,
65–76.Google Scholar
Martin, S.E.,
Engleman, H.M.,
Deary, I.J., &
Douglas, N.J.
(1996).
The effect of sleep fragmentation on daytime function.
American Journal of Respiratory and Critical Care Medicine,
153,
1328–1332.Google Scholar
O'Leary, D.S.,
Andreason, N.C.,
Hurtig, R.R.,
Hichwa, R.D.,
Watkins, G.L.,
Ponto, L.L.,
Rogers, M., &
Kirchner, P.T.
(1996).
A positron emission tomography study of binaurally and dichotically
presented stimuli: Effects of level of language and directed
attention.
Brain and Language,
53,
20–39.Google Scholar
Petersen, S.E. &
Fiez, J.A.
(1993).
The processing of single words studied with positron emission
tomography.
Annual Review of Neuroscience,
16,
509–530.Google Scholar
Petersen, S.E.,
Fox, P.T.,
Posner, M.I.,
Mintun, M., &
Raichle, M.E.
(1988).
Positron emission tomographic studies of the cortical anatomy of
single word processing.
Nature,
331,
585–589.Google Scholar
Posner, M.I..
(1995).
Attention in cognitive neuroscience: An overview. In
M.S. Gazzaniga (Ed.),
The cognitive neurosciences
(Vol. 39, pp.
615–624).
Cambridge MA:
MIT Press.
Posner, M.I.,
Petersen, S.E.,
Fox, P.I., &
Raichle, M.E.
(1988).
Localization of cognitive operation in the human brain.
Science,
240,
1627–1631.Google Scholar
Raichle, M.E.,
Fiez, J.A.,
Videen, T.O.,
MacLeod, A.M.,
Pardo, J.V.,
Fox, P.T., &
Petersen, S.E.
(1994).
Practice-related changes in human brain functional anatomy during
nonmotor learning.
Cerebral Cortex,
4,
8–26.Google Scholar
Rasmussen, K.,
Jeppesen, H.J., &
Sabroe, S.
(1993).
Psychometric tests for assessment of brain function after solvent
exposure.
American Journal of Industrial Medicine,
24,
553–565.Google Scholar
Salvi, R.J.,
Lockwood, A.H.,
Frisina, R.D.,
Coad, M.L.,
Wack, D.S., &
Frisina, D.R.
(2002).
PET imaging of the normal human auditory system: Responses to
speech in quiet and in background noise.
Hearing Research,
170,
96–106.Google Scholar
Schweitzer, J.B.,
Faber, T.L.,
Grafton, S.T.,
Tune, L.E.,
Hoffman, J.M., &
Kilts, C.D.
(2000).
Alterations in the functional anatomy of working memory in adult
attention deficit hyperactivity disorder.
American Journal of Psychiatry,
157,
278–280.Google Scholar
Smith, E.E.,
Jonides, J.,
Marshuetz, C., &
Koeppe, R.A.
(1998).
Components of verbal working memory: Evidence from neuroimaging.
Proceedings of the National Academy of Sciences USA,
95,
876–882.Google Scholar
Stroop, J.R.
(1935).
Studies of interference in serial verbal reactions.
Journal of Experimental Psychology,
18,
643–662.CrossRefGoogle Scholar
Talairach, J. &
Tournoux, P.
(1988).
Co-planar stereotaxic atlas of the human brain.
New York:
Georg Thieme Verlag.
Uzzell, B.P. &
Oler, J.
(1986).
Chronic low-level mercury exposure and neuropsychological
functioning.
Journal of Clinical and Experimental Neuropsychology,
8,
581–593.Google Scholar
Wechsler, D.
(1981).
Wechsler Adult Intelligence Scale–Revised.
New York:
The Psychological Corporation.
Weersink, E.J.,
van Zomeren, E.H.,
Koeter, G.H., &
Postma, D.S.
(1997).
Treatment of nocturnal airway obstruction improves daytime
cognitive performance in asthmatics.
American Journal of Respiratory and Critical Care Medicine,
156,
1144–1150.Google Scholar
White, A.J.
(1984).
Cognitive impairment of acute mountain sickness and acetazolamide.
Aviation Space and Environmental Medicine,
55,
598–603.Google Scholar
Activation sites in task–rest contrasts
Active conditions compared to rest. The SPM Z images show the results of comparing the PASAT and its elements to the resting state. In each panel, z scores are projected on to sagittal, coronal and transaxial planes. Arrows in part A indicate superior temporal gyrus or auditory cortical sites and motor strip activation sites. Arrows in part B depict cingulate gyrus activation sites. The arrow in part C indicates a parietal site, possibly associated with addition, that fails to reach the voxel level of significance. The right hemisphere is shown on the right side of the coronal plane images and the bottom half of the transaxial plane images. The threshold was p(uncorrected) = .001 which corresponds to Z = 3.09.
Parsing the PASAT
Parsing the PASAT. Each panel shows the contrast indicated. Panels A and B show the result of subtraction repeat tasks from the PASAT. The absence of cingulate activation in each of these contrasts suggests similar levels of attention were required in all tasks. We conclude, on the basis of the data in B, that the repeat prior and PASAT tasks make similar demands on brain function. Note the disappearance of activated sites in the superior temporal gyrus and motor strip, demonstrating the validity of the subtraction technique. The (repeat prior)–(repeat immediate) contrast activates brain regions associated with working memory. Image orientation and display thresholds are as in Figure 1.
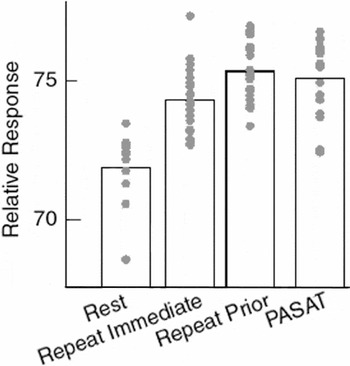
Mean and individual task-specific relative CBF values for each condition are shown for the cingulate gyrus voxel at which the PASAT–rest difference was maximal. Each point represents a value from one scan. Note, each subject was scanned once at rest and twice during each active condition.
 You have
Access
- 47
- Cited by