1 Introduction
1.1 Outline
Two well-separated time scales are involved when sound waves propagate in a fluid: the frequency of the sound and the characteristic time of the flow evolution. This distinction defines the boundary between acoustics and hydrodynamics. It happens in practice that some physical phenomena overlap this frontier and challenge researchers from both fields, like shock waves and supersonic hydrodynamics, but also noisy powerful hydrodynamic turbulence and steady flows induced by intense sound beams: namely the acoustic streaming.
Since acoustic streaming is generated by sound waves, it is clear that the hydrodynamic flow pattern depends on a variety of factors influencing the sound field such as the boundary conditions and the acoustic attenuation coefficient. Both of these aspects have often been overlooked in recent studies on the acoustic streaming induced by surface acoustic waves in sessile droplets. On the one hand, the boundary conditions are commonly reduced to an unbounded liquid medium which fails to account for the multiple reflections of the wave in the droplet. On the other hand, the attenuation of the surface wave radiating in the fluid is regularly mistaken as the streaming source term instead of the acoustic viscous damping. In order to clarify the physical process that gives rise to acoustic streaming, it is thus essential to build a model that captures both the acoustic and the hydrodynamic features of the actual experiment. In this paper, we observe and simulate the acoustic streaming generated by surface acoustic waves radiating in droplets much larger than the acoustic wavelength. The numerical model reproduces faithfully the experimental flow patterns, and unveils the acoustic field in the droplet.
Acoustic streaming induced by surface acoustic waves involves researchers from a variety of fields ranging from acoustics to hydrodynamics and microelectronics. In order to keep the paper accessible to the broadest audience, we provide some elementary background that might seem obvious to the experts of the field. The following introduction is divided into four sections to allow the reader to skip whichever field they are already familiar with. The sections deal with nonlinear acoustics, the applications of micro-acoustofluidics, the hydrodynamics viewpoint on the streaming in sessile droplets and finally the acoustics viewpoint.
1.2 Foundations of acoustic streaming
Thanks to the pioneering works of Rayleigh (Reference Rayleigh1884) and Eckart (Reference Eckart1948), it is now well established that acoustic streaming reveals the momentum transfer from the wave to the fluid by sound attenuation. Most authors (Nyborg Reference Nyborg1953; Westervelt Reference Westervelt1953; Lighthill Reference Lighthill1978; Mitome Reference Mitome1998; Riley Reference Riley1998, Reference Riley2001; Wiklund Reference Wiklund2012) distinguish two types of streaming depending on whether the damping arises from shear stress on the walls (boundary layer-driven streaming) or from viscous dissipation in the bulk (Eckart streaming). Rayleigh (Reference Rayleigh1915) has proven that the former acts as an effective slip velocity outside a thin Stokes boundary layer (see Rednikov & Sadhal (Reference Rednikov and Sadhal2011) for a generalization to arbitrary surfaces and acoustic fields), while Lighthill (Reference Lighthill1978) has provided a convenient body force expression to account for the bulk streaming. In what follows, we will treat exclusively the case of Eckart (bulk) streaming, which is relevant for geometries much larger than the acoustic wavelength (Vanneste & Bühler Reference Vanneste and Bühler2011). Quickly following Eckart’s theoretical work (Eckart Reference Eckart1948), Liebermann (Reference Liebermann1949) experimentally evidenced that the attenuation of freely propagating sound waves was mostly due to the bulk viscosity, a physical quantity accounting for both hard sphere collision and chemical relaxation. As emphasized by Eckart (Reference Eckart1948), the hydrodynamic forcing term is proportional to the sound attenuation, which itself varies linearly with the viscosity.
Here appears the great paradox of acoustic streaming: although the momentum source for the fluid is proportional to the viscosity, it mostly dissipates this momentum through shear stress, such that the streaming velocity is expected to be independent of viscosity. Experimentally, it has been confirmed that acoustic streaming occurs for a wide range of fluids from superfluid Helium (Rooney, Smith & Carey Reference Rooney, Smith and Carey1982) to very viscous polymers (Mitome Reference Mitome1998). This assertion must nevertheless be tempered since acoustic streaming is generated by the acoustic field, which itself depends on the attenuation coefficient in the medium and thus on the viscosity.
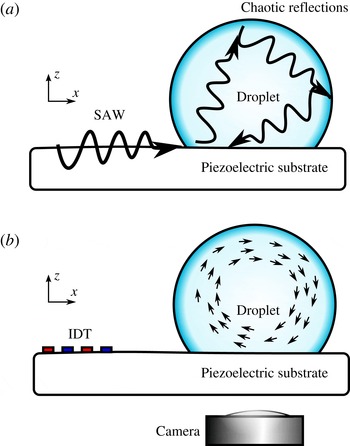
A sessile droplet rests on a piezoelectric substrate. (a) Acoustics. A SAW propagating at the surface of the solid radiates in the liquid. It is reflected a great number of times at the liquid–solid and liquid–air interfaces, resulting in a complex standing wave pattern. (b) Hydrodynamics. As the wave propagates in the liquid, it dissipates some momentum which generates a steady flow with large-scale eddies.

1.3 Applications of nonlinear acoustics to microfluidics
High frequency sound waves and high-viscosity liquids are routinely used in microfluidics (see e.g. Friend & Yeo Reference Friend and Yeo2011; Wiklund Reference Wiklund2012). Indeed, contactless robust fluid actuation for a wide range of liquids is a primary requirement for this rising field, and miniaturized acoustical sources such as interdigitated transducers are readily available. Therefore, a problem of considerable interest is the acoustic streaming induced by surface acoustic waves (SAW) in sessile droplets, as illustrated in figure 1. An oscillating voltage applied to an interdigitated transducer (IDT) generates a SAW at the surface of a piezoelectric medium. This wave propagates almost unattenuated until it meets a liquid droplet. As it moves below the liquid, the surface oscillations are damped by the inertial stress of the fluid and the surface wave gradually leaks in the liquid, generating bulk acoustic waves.
For increasing SAW power, one can achieve droplet mixing (Sritharan et al. Reference Sritharan, Strobl, Schneider and Wixforth2006; Frommelt et al. Reference Frommelt, Kostur, Wenzel-Schäfer, Talkner, Hänggi and Wixforth2008) or centrifugation (Bourquin et al. Reference Bourquin, Reboud, Wilson and Cooper2010), displacement (Wixforth et al. Reference Wixforth, Strobl, Gauer, Toegl, Scriba and Guttenberg2004; Alzuaga, Manceau & Bastien Reference Alzuaga, Manceau and Bastien2005; Renaudin et al. Reference Renaudin, Tabourier, Zang, Camart and Druon2006; Brunet et al. Reference Brunet, Baudoin, Bou Matar and Zoueshtiagh2010; Baudoin et al. Reference Baudoin, Brunet, Bou Matar and Herth2012; Fukaya & Kondoh Reference Fukaya and Kondoh2015), division (Zhang, Zha & Fu Reference Zhang, Zha and Fu2013; Collignon, Friend & Yeo Reference Collignon, Friend and Yeo2015; Riaud et al. Reference Riaud, Baudoin, Thomas and Bou Matar2016), heating (Kondoh et al. Reference Kondoh, Shimizu, Matsui, Sugimoto and Shiokawa2005; Beyssen et al. Reference Beyssen, Le Brizoual, Elmazria, Alnot, Perry and Maillet2006; Ito et al. Reference Ito, Sugimoto, Matsui and Kondoh2007; Kondoh et al. Reference Kondoh, Shimizu, Matsui, Sugimoto and Shiokawa2009; Reboud et al. Reference Reboud, Bourquin, Wilson, Pall, Jiwaji, Pitt, Graham, Waters and Cooper2012; Roux-Marchand et al. Reference Roux-Marchand, Beyssen, Sarry, Grandemange and Elmazria2012, Reference Roux-Marchand, Beyssen, Sarry and Elmazria2015; Shilton et al. Reference Shilton, Mattoli, Travagliati, Agostini, Desii, Beltram and Cecchini2015) and finally jetting (Shiokawa, Matsui & Ueda Reference Shiokawa, Matsui and Ueda1990; Tan, Friend & Yeo Reference Tan, Friend and Yeo2009) or atomization (Qi, Yeo & Friend Reference Qi, Yeo and Friend2008, Blamey, Yeo & Friend Reference Blamey, Yeo and Friend2013) depending on the droplet size (Tan et al. Reference Tan, Friend and Yeo2009). These phenomena are still only partially understood and the underlying physics is sometimes subject to some controversy. For instance, most authors agree that the wave momentum is transferred to the fluid, but some argue that the momentum transfer happens in the bulk by acoustic streaming (Schindler, Talkner & Hänggi Reference Schindler, Talkner and Hänggi2006; Tan et al. Reference Tan, Friend and Yeo2009; Alghane et al. Reference Alghane, Chen, Fu, Li, Desmulliez, Mohammed and Walton2012), while others point out that sound reflections on a fluid interface also generates a measurable surface stress (Hertz & Mende Reference Hertz and Mende1939) called acoustic radiation pressure (Mitome Reference Mitome1998; Masanori & Toshitaka Reference Masanori and Toshitaka2001; Stanzial, Bonsi & Schiffrer Reference Stanzial, Bonsi and Schiffrer2003) which could contribute to the aforementioned effects (Alzuaga et al. Reference Alzuaga, Manceau and Bastien2005; Brunet et al. Reference Brunet, Baudoin, Bou Matar and Zoueshtiagh2010). However, there is a general consensus on the droplet mixing which can happen without significant free-surface deformation and is therefore widely attributed to acoustic streaming.
1.4 Studies of the hydrodynamic flow in droplets exposed to surface acoustic waves
In the hydrodynamic viewpoint, acoustic streaming is of considerable interest since it allows contactless generation of vorticity and fluid mixing, especially in microfluidics (Friend & Yeo Reference Friend and Yeo2011; Wiklund Reference Wiklund2012). It was also proposed by Blamey et al. (Reference Blamey, Yeo and Friend2013) that the transition of acoustic streaming from laminar to turbulent flow (Stuart streaming) could be responsible for the atomization of droplets exposed to high power surface acoustic waves. Conversely, the acoustic community dedicated little work to this specific phenomenon. Consequently, although the propagation of surface acoustic waves is extremely well understood (see e.g. Royer & Dieulesaint Reference Royer and Dieulesaint1996, Reference Royer and Dieulesaint1999), the intermediate step between the leaky SAW radiation and the hydrodynamic flow remains unclear, and the droplet appears essentially as an acoustical black box where the actual acoustic field is unknown.
Hydrodynamic studies on droplet acoustic streaming at megahertz frequencies started in 1988 with the Shiokawa, Matsui & Toyosaka (Reference Shiokawa, Matsui and Toyosaka1988), Shiokawa et al. (Reference Shiokawa, Matsui and Ueda1990) seminal papers. They performed several experiments of droplet displacement, jetting and atomization using surface acoustic waves at 50 MHz. In these papers, Shiokawa and coworkers lay down a simplified model that will serve as a theoretical foundation for several subsequent studies. First, Shiokawa et al. assumed that the acoustic field in water droplets could be reduced to the incident field and proposed to neglect the internal reflections of the wave. This framework allowed them to use Nyborg’s expression of the acoustic streaming force in order to compute the order of magnitude of the acoustic streaming in sessile droplets. Finally, Shiokawa and her coauthors emphasized that the gigantic attenuation of the leaky SAW beneath the droplet exceeds by far the viscous attenuation of the same sound wave in the droplet bulk, see also Cheeke (Reference Cheeke2002). Thus, their calculations were performed in the inviscid approximation for sound waves. Several works were performed in the direct continuity of Shiokawa’s model (Schindler et al. Reference Schindler, Talkner and Hänggi2006; Du et al. Reference Du, Swanwick, Fu, Luo, Flewitt, Lee, Maeng and Milne2009; Alghane et al. Reference Alghane, Chen, Fu, Li, Luo and Walton2011, Reference Alghane, Chen, Fu, Li, Desmulliez, Mohammed and Walton2012) until Vanneste & Bühler (Reference Vanneste and Bühler2011) pointed out that most numerical studies based on Shiokawa’s work relied on inviscid formulations of the sound wave equation, which could not generate vorticity. In other words, Vanneste and Bühler proved that earlier studies mistakenly relied on the SAW attenuation instead of the viscous damping to force the acoustic streaming. In order to remedy to the situation, they developed a rigorous analytical computation of the streaming generated by surface acoustic waves in a square cavity based on vorticity conservation. In their analysis, the box was transparent to acoustic waves, which is similar to Shiokawa et al.’s analysis of neglecting internal reflections. Another important contribution of Vanneste and Bühler was to prove that the bulk streaming (Eckart streaming) dominates over the boundary layer streaming and the Stokes drift in the case of cavities much larger than the wavelength, which is the case for millimetric droplets irradiated by SAW of frequency larger than 10 MHz.
Thanks to the advance of numerical methods, several models explicitly accounted for the propagation of the acoustic wave in the droplet, including the viscous damping. Köster (Reference Köster2007) proposed an algorithm to compute the flow and the surface deformation of a two-dimensional (2-D) sessile droplet exposed to a surface acoustic wave. Despite the outstanding nature of the study, Köster’s investigation does not provide any clear comparison to experimental results and the numerical study is limited to one special size of droplet excited at one specific frequency. Raghavan, Friend & Yeo (Reference Raghavan, Friend and Yeo2010) developed a 2-D model of droplet streaming without fitting parameters. Although he recovered the correct flow pattern, Raghavan reported fluid velocities an order of magnitude below what was measured experimentally.
1.5 Studies of the acoustic field in sessile droplets
The acoustic foundations of Shiokawa’s framework were also challenged by Brunet et al. (Reference Brunet, Baudoin, Bou Matar and Zoueshtiagh2010) and Tan et al. (Reference Tan, Friend, Matar and Yeo2010) who tested the validity of the reflection-free droplet assumption. In these works, the authors simulated the acoustic field in a two-dimensional droplet both in the frequency domain with a rigid interface (Brunet et al.) and in the time domain to account for surface deformations (Tan et al.). Both studies showed that the acoustic field in water droplets exposed to 20 MHz SAW had a complex spatial structure and showed little coherent pattern. Nevertheless, for attenuation rates approximately 100 times larger than that of water, the incident wave accounted for most of the acoustic field (Brunet et al. Reference Brunet, Baudoin, Bou Matar and Zoueshtiagh2010). Another investigation performed by Quintero & Simonetti (Reference Quintero and Simonetti2013) at 3.5 MHz revealed the acoustic field in three dimensions in the low frequency range where the wavelength is comparable to the droplet size. Again, no clear structure was present. In these three studies, the knowledge of the acoustic field was not used to proceed to the next step and compute the streaming forcing term. Recently, Rezk, Yeo & Friend (Reference Rezk, Yeo and Friend2014) simulated the acoustic field and the resulting steady poloidal flow in sessile droplets exposed to focused SAW with a circular symmetry at frequencies up to 250 MHz. The simulations gave an excellent agreement with experimental observations of the hydrodynamic flow. Nevertheless, this model was only applied to axisymmetric SAW excitation, whereas most of the acoustic streaming experiments are conducted with plane waves and therefore require a fully three-dimensional method which has not been implemented so far.
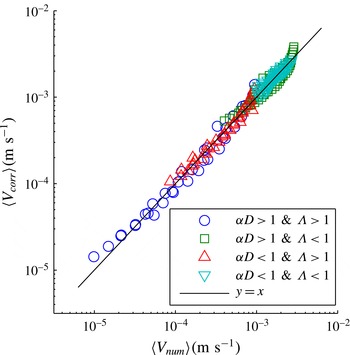
At present, our understanding of the acoustic streaming in sessile droplets faces the three following issues. What is the acoustic field in the droplet? Since we infer the field to exhibit spatio-temporal complexity, how does it generates some coherent flow pattern? How do we compute this flow while ensuring vorticity conservation? In the continuity of Brunet et al. (Reference Brunet, Baudoin, Bou Matar and Zoueshtiagh2010), we investigate the influence of the liquid viscosity to understand the discrepancy between Shiokawa et al.’s hypothesis of a non-reflective free surface and the aforementioned experimental results. In § 2, we present an experimental study of acoustic streaming in droplets of different viscosities, and show a transition of flow pattern from four to two eddies for increasing viscosity. This contradiction with the inviscid droplet hypothesis of Shiokawa appeals for an in-depth review of the acoustic streaming theoretical foundations, exposed in § 3. We single out the dominant inviscid term that does not contribute to vorticity creation and extract Lighthill’s acoustic streaming driving force (Lighthill Reference Lighthill1978). We use this expression in § 4, where we detail a numerical algorithm to compute the acoustic field in the droplet, deduce the streaming forcing term and then reproduce the 3-D flow pattern observed experimentally by spatial filtering of the streaming source term (SSSF). Section 5 opens a discussion on the flow topology by comparing numerical and experimental results. We show that simple arguments of geometrical acoustics and sound attenuation can provide a qualitative prediction of the flow topology. Finally, in § 6, we recast the droplet acoustic streaming as a problem involving only two dimensionless parameters. Using the similitude principle, we establish an empirical correlation between these parameters and the average velocity of the flow in the droplet. These dimensionless numbers allow us to extrapolate our results to many fluids and actuation frequencies. Provided the wavelength is much shorter than the droplet size, our approach (not restricted to plane waves) allows simulating droplet streaming at low SAW actuation frequency and then extrapolation of the results to higher frequencies. This considerably alleviates memory requirements to simulate acoustic streaming in complex geometries.
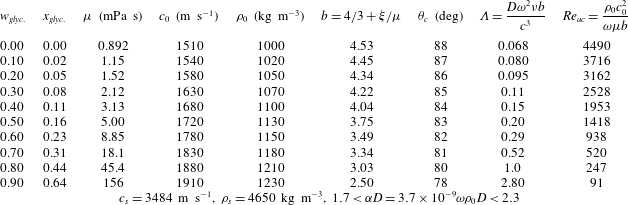
Physical properties of lithium niobate and water–glycerol mixtures at
 $25\,^{\circ }\text{C}$
for different mass fraction
 $w_{glyc.}$
and thus volume fraction
 $x_{glyc.}$
of glycerol. Data for the viscosity
 $\unicode[STIX]{x1D707}$
of the water–glycerol mixture are extracted from Cheng (Reference Cheng2008), while the sound speed
 $c_{0}$
, the density
 $\unicode[STIX]{x1D70C}_{0}$
, the bulk viscosity
 $\unicode[STIX]{x1D709}$
(and thus the coefficient
 $b$
) are extracted from Slie, Donfor & Litovitz (Reference Slie, Donfor and Litovitz1966). The sound speed
 $c_{s}$
of Rayleigh waves in
 $X$
-cut niobate lithium in the
 $Z$
-direction is extracted from Campbell & Jones (Reference Campbell and Jones1970) and the density
 $\unicode[STIX]{x1D70C}_{s}$
is available in handbooks. Finally
 $\unicode[STIX]{x1D6EC}$
is a dimensionless parameter characterizing the transmission efficiency of the Rayleigh wave to the liquid. Droplet base diameter can be computed as follows:
 $D_{base}=2\sin (\unicode[STIX]{x1D703}_{c})[3V/(\unicode[STIX]{x03C0}(2-3\cos (\unicode[STIX]{x1D703}_{c})+\cos ^{3}(\unicode[STIX]{x1D703}_{c})))]^{1/3}$
. Accordingly, all droplet diameters in our experiments range between 3.7 and 4.0 mm.

2 Experiments
2.1 Experimental set-up
Surface acoustic waves were generated at the surface of an
 $X$
-cut lithium niobate piezoelectric substrate in the crystallographic
 $Z$
-direction by interdigitated electrodes, with a spatial period of 175
 $\unicode[STIX]{x03BC}$
m corresponding to a resonant frequency of 19.9 MHz (the sound speed in this direction is
 $3484~\text{m}~\text{s}^{-1}$
, see Campbell & Jones (Reference Campbell and Jones1970)). In practice, the best actuation efficiency was obtained at 20.37 MHz which was used as the driving frequency for all experiments. A water–glycerol droplet of 12.5
 $\unicode[STIX]{x03BC}$
l was placed on the substrate initially treated with OTS (octadecyltrichlorosilane) self-assembled monolayer (SAM) to obtain hydrophobic wetting properties (see figure 1). The fraction of glycerol in the mixture modifies the shear and bulk viscosities with relatively weak variations of the other relevant parameters such as surface tension and contact angle (physical data are shown in table 1). Spherical latex beads of 10
 $\unicode[STIX]{x03BC}$
m diameter coated with fluorescent dyes (ThermoScientific) were dispersed in the droplet prior to experiments to visualize its inner flow. We minimized the droplet evaporation by deporting the light source with an optical fibre, using the cold part of the optical spectrum and restraining the experiment duration below 2 min. The images were acquired via an Hamamatsu camera (4 megapixels) and quantitative velocity magnitude was measured using the particle image velocimetry (PIV) module of ImageJ (https://sites.google.com/site/qingzongtseng/piv). Additional details on the PIV experiment are provided in the supplemental material available at https://doi.org/10.1017/jfm.2017.178. We restricted the power of the SAW to a few tens of picometres to minimize the droplet deformation, which are observed at much higher amplitude (Schindler et al.
Reference Schindler, Talkner and Hänggi2006; Brunet et al.
Reference Brunet, Baudoin, Bou Matar and Zoueshtiagh2010; Alghane et al.
Reference Alghane, Chen, Fu, Li, Desmulliez, Mohammed and Walton2012; Baudoin et al.
Reference Baudoin, Brunet, Bou Matar and Herth2012). The substrate vertical amplitude of vibration on the central finger of the IDT was calibrated for the range of actuation power used in the present experiments with a laser Doppler vibrometer (SH130, B.M. Industries).
Finally, the droplets inner flow was visualized from below (to avoid optical aberrations by the drop surface) with a Hamamatsu high resolution camera mounted on an inverted microscope (Olympus IX71). The depth of field is estimated to be 16
 $\unicode[STIX]{x03BC}$
m for objects of the size of a pixel when using the
 $4\times$
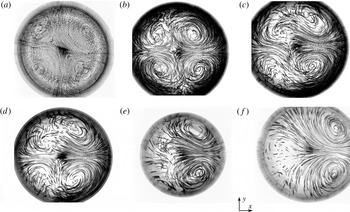
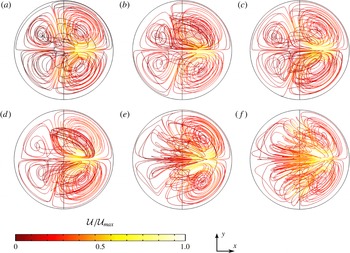
magnification objective with this inverted microscope, allowing the visualization of a droplet cross-section. The vertical position of focus plane was adjusted by eye as close as possible to half of the drop height, although this condition is achieved within a few per cent accuracy. After turning on the SAW generator, we waited for the droplet flow pattern to reach a steady state. This duration varied widely with viscosity, from seconds for water droplets up to minute for the most viscous mixtures (as expected from theoretical analysis). Figure 2 reproduces a few examples of such particles trajectories viewed from below, obtained at increasing viscosities from (a) to (f). The streamlines are obtained by a simple superposition of successive images.
Flow visualization of a 12.5
 $\unicode[STIX]{x03BC}$
l droplet from below, at various glycerol concentration. The SAW propagates from left to right with an amplitude
 $u_{0}=62\pm 1$
pm. As the viscosity increases, one remarks the progressive transition from a four-vortex to a two-vortex flow structure. (a) Pure water; (b) 30 wt.% glycerol; (c) 40 wt.% glycerol; (d) 60 wt.% glycerol; (e) 80 wt.% glycerol; (f) 90 wt.% glycerol.

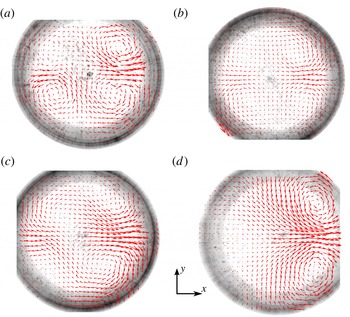
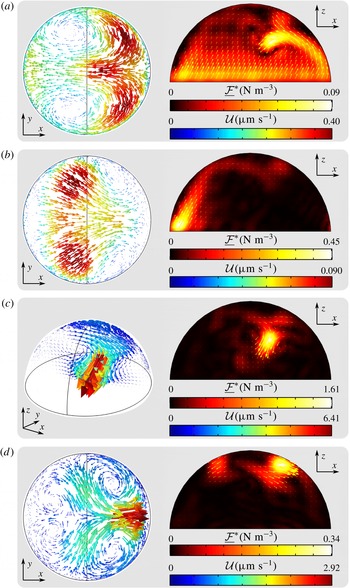
Experimental velocity field from below, at various viscosities. The SAWs propagate from left to right with an amplitude
 $u_{0}\simeq 62$
pm.
 $V_{droplet}=12.5~\unicode[STIX]{x03BC}\text{l}$
. As the viscosity increases, one remarks the progressive transition from a four-vortex to a two-vortex flow structure. (a) 10 wt.% glycerol (
 ${\mathcal{U}}_{max}\simeq 180~\unicode[STIX]{x03BC}\text{m}~\text{s}^{-1}$
); (b) 30 wt.% glycerol (
 ${\mathcal{U}}_{max}\simeq 100~\unicode[STIX]{x03BC}\text{m}~\text{s}^{-1}$
); (c) 40 wt.% glycerol (
 ${\mathcal{U}}_{max}\simeq 70~\unicode[STIX]{x03BC}\text{m}~\text{s}^{-1}$
); (d) 90 wt.% glycerol (
 ${\mathcal{U}}_{max}\simeq 10~\unicode[STIX]{x03BC}\text{m}~\text{s}^{-1}$
). The arrow length is indicative of the velocity magnitude for each experiment.

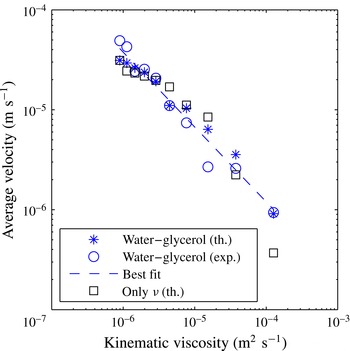
The velocity field in the representative cut was extracted from the pictures of the flow streams presented above by using the PIV ImageJ plugin (see figure 3). The analysis was further refined by discarding the 5 % least reliable velocity vectors. (The reliability criteria was the magnitude of the Laplacian of the velocity field.) We made sure that the system had reached steady state by waiting until the space-averaged magnitude of the velocity field did not vary by more than 10 % between two different time intervals. Each couple of images provides a flow map, and each plot in figure 3 is the average of three different flow maps obtained with the same droplet at steady state. Then the average velocity was determined by averaging spatially the flow field in the drop. The streaming pattern being inhomogeneous in space, this space-averaged flow velocity over one cross-section only gives an order of magnitude of the volume-averaged velocity. The resulting trend is presented in the discussion section together with numerical results (see figure 13).
2.2 Results
These experimental results (see figure 2) show unambiguously that the streaming flow pattern in a droplet excited by SAWs depends on the fluid viscosity. Fluids of increasing viscosity lead to progressive loss of front/back symmetry (the front being the side to which the SAW is incident, and the back the opposite side). The situation at low viscosity (up to 30 wt.% glycerol – figure 2 a,b) shows two pairs of vortices, both at the rear and the front of the drop (with respect to the direction of wave propagation). As the viscosity increases beyond a few times that of water (figure 2 c,d) the front vortices start shrinking, while at even higher viscosity (above 80 wt.% glycerol, figure 2 e,f) the front vortices have completely disappeared. Counterintuitively, complex eddies are observed at the opposite side of the excitation at the highest viscosity (corresponding to very low Reynolds numbers) (figure 2 e,f).
The PIV measurements (figure 3, magnitudes are indicated in the caption) show that larger viscosities (from 1.15 mPa s to 156 mPa s) are associated with a decreasing velocity magnitude (from
 $180~\unicode[STIX]{x03BC}\text{m}~\text{s}^{-1}$
to
 $10~\unicode[STIX]{x03BC}\text{m}~\text{s}^{-1}$
).
In order to unveil the underlying physics, we performed a systematic comparison between models, simulations and experiments of the flow pattern and average velocity in the drop for different viscosities. In the next sections, we therefore describe an adequate theory, introduce a numerical method allowing the computation of the 3-D streaming flow in the drop with dramatically reduced numerical cost and perform a comparison with experiments to achieve a comprehensive understanding of the whole process behind the acoustic streaming in sessile droplets.
3 Theory
In this section, we re-establish acoustic streaming governing equations. At first we introduce a relevant field decomposition into periodic fluctuations (corresponding to the acoustic wave) and time-averaged terms (corresponding to the acoustic streaming). Then, from the compressible Navier–Stokes equations, we derive a governing nonlinear equation for each of these contributions. In the latter a force appears in the form of a nonlinear combination of acoustic terms, which drives the acoustic streaming and the acoustic radiation pressure (Gusev & Rudenko Reference Gusev and Rudenko1979; Mitome Reference Mitome1998). This driving force is recast in the last section as a convenient expression based on the sum of a conservative force plus a quantity proportional to the Poynting vector.
3.1 Field decomposition
As stated in the introduction, we can resolve each physical quantity
 $f$
into three contributions: hydrostatic
 $f_{0}$
, acoustic
 $\tilde{f_{1}}$
and hydrodynamic
 $\bar{f_{2}}$
. They represent respectively the system at rest (without acoustic field), the oscillating part of the perturbation induced by sound waves and the time-averaged part of the perturbation over an acoustic period. In our experiments, acoustic and hydrodynamic Mach numbers are small. Moreover, solid displacements hardly exceed 0.5 nm, which restricts acoustic perturbation velocity magnitude to below
 $10~\text{mm}~\text{s}^{-1}$
and consequently streaming velocities below
 $1~\text{mm}~\text{s}^{-1}$
. According to this slow streaming approximation (Lighthill Reference Lighthill1978), the fluid density
 $\unicode[STIX]{x1D70C}$
the pressure
 $p$
and the Eulerian velocity
 $v$
, can be expressed as follows:
 $$\begin{eqnarray}\displaystyle & \displaystyle \unicode[STIX]{x1D70C}=\unicode[STIX]{x1D70C}_{0}+\tilde{\unicode[STIX]{x1D70C}}_{1}+\bar{\unicode[STIX]{x1D70C}}_{2}, & \displaystyle\end{eqnarray}$$
 $$\begin{eqnarray}\displaystyle & \displaystyle p=p_{0}+\tilde{p}_{1}+\bar{p}_{2}, & \displaystyle\end{eqnarray}$$
 $$\begin{eqnarray}\displaystyle & \displaystyle v_{i}=\tilde{v}_{1,i}+\bar{v}_{2,i}, & \displaystyle\end{eqnarray}$$
 $$\begin{eqnarray}\displaystyle & \displaystyle v_{0,i}=0, & \displaystyle\end{eqnarray}$$
with
 $i\in \{x,y,z\}$
,
 $\bar{f_{2}}=\langle f-f_{0}\rangle$
,
 $\langle \rangle$
the time average,
 $\tilde{f_{1}}=f-f_{0}-\bar{f_{2}}$
,
 $\langle \tilde{f_{1}}\rangle =0$
, and
 $\bar{f_{2}}\ll \tilde{f_{1}}\ll f_{0}$
. The low Mach numbers assumption gives
 $\tilde{v}_{1},\bar{v}_{2}\ll c_{0}$
, with
 $c_{0}$
the sound speed in the fluid at hand. To simplify the notations, the indices
 $1$
and
 $2$
will be omitted in the following.
3.2 Fundamental equations
The starting point of the derivation is the compressible isentropic Navier–Stokes equations. These equations are relevant to compute acoustic streaming in liquids since, in this case, thermal effects (wave thermal damping, fluid heating) can be neglected compared to their viscous counterparts (viscous damping, acoustic streaming). Indeed, thermal effects are proportional to
 $(\unicode[STIX]{x1D6FE}-1)$
, with
 $\unicode[STIX]{x1D6FE}$
the adiabatic index and thus are very weak in liquids (see e.g. Coulouvrat Reference Coulouvrat1992).
In this case, the mass conservation equation for a fluid reads:
 $$\begin{eqnarray}\unicode[STIX]{x2202}_{t}\unicode[STIX]{x1D70C}+\unicode[STIX]{x2202}_{i}\unicode[STIX]{x1D70C}v_{i}=0,\end{eqnarray}$$
and the momentum conservation equation:
 $$\begin{eqnarray}\unicode[STIX]{x2202}_{t}\unicode[STIX]{x1D70C}v_{i}+\unicode[STIX]{x2202}_{j}(\unicode[STIX]{x1D70C}v_{i}v_{j})=-\unicode[STIX]{x2202}_{i}p+\unicode[STIX]{x1D707}\unicode[STIX]{x2202}_{jj}^{2}v_{i}+\left(\frac{\unicode[STIX]{x1D707}}{3}+\unicode[STIX]{x1D709}\right)\unicode[STIX]{x2202}_{ij}^{2}v_{j}.\end{eqnarray}$$
In these equations,
 $\unicode[STIX]{x1D707}$
stands for the dynamic viscosity,
 $\unicode[STIX]{x1D709}$
for the bulk viscosity,
 $t$
for the time and the indices
 $i$
and
 $j$
follow the Einstein summation convention. The second-order isotropic Taylor expansion of the equation of state reads:
 $$\begin{eqnarray}\text{d}p=c_{0}^{2}\,\text{d}\unicode[STIX]{x1D70C}+\frac{1}{2}\unicode[STIX]{x1D6E4}\,\text{d}\unicode[STIX]{x1D70C}^{2},\end{eqnarray}$$
with
 $\unicode[STIX]{x1D6E4}=\unicode[STIX]{x2202}^{2}p/\unicode[STIX]{x2202}\unicode[STIX]{x1D70C}^{2}|_{s}=Bc_{0}^{2}/A\unicode[STIX]{x1D70C}_{0}$
.
 $A$
and
 $B$
are the first- and second-order coefficients of the Taylor expansion relating the material pressure to its density. These nonlinearity coefficients are classically introduced in nonlinear acoustics.
3.3 Time-averaged equations at second order: acoustic steady streaming
If we take the time average of the mass and momentum conservation equations (3.5) and (3.6) up to second order, and introduce the Poynting vector (also called intensity vector in the field of acoustics)
 $\unicode[STIX]{x1D6F1}_{i}=\tilde{p}\tilde{v}_{i}$
, we obtain:
 $$\begin{eqnarray}\unicode[STIX]{x2202}_{t}\bar{\unicode[STIX]{x1D70C}}+\unicode[STIX]{x1D70C}_{0}\unicode[STIX]{x2202}_{i}\bar{v}_{i}+\frac{1}{c_{0}^{2}}\unicode[STIX]{x2202}_{i}\langle \unicode[STIX]{x1D6F1}_{i}\rangle =0,\end{eqnarray}$$
and:
 $$\begin{eqnarray}\unicode[STIX]{x2202}_{t}(\unicode[STIX]{x1D70C}_{0}\bar{v_{i}}+1/c_{0}^{2}\langle \unicode[STIX]{x1D6F1}_{i}\rangle )+\unicode[STIX]{x1D70C}_{0}\unicode[STIX]{x2202}_{j}\langle \tilde{v}_{i}\tilde{v}_{j}\rangle =-\unicode[STIX]{x2202}_{i}\bar{p}+\unicode[STIX]{x1D707}\unicode[STIX]{x2202}_{jj}^{2}\bar{v}_{i}+\left(\frac{\unicode[STIX]{x1D707}}{3}+\unicode[STIX]{x1D709}\right)\unicode[STIX]{x2202}_{ij}^{2}\bar{v}_{j},\end{eqnarray}$$
since
 $\unicode[STIX]{x1D6F1}_{i}=c_{0}^{2}\tilde{\unicode[STIX]{x1D70C}}\tilde{v}_{i}$
at leading order.
These two equations can be simplified for a large span of fluids and systems using the following assumptions. First, if we consider the acoustic streaming produced by bulk acoustic wave (away from boundaries), the third term of the mass conservation equation (3.8) is proportional at leading order to the bulk viscous dissipation of the wave energy, which remains weak in most media. This is quantified by the acoustical Reynolds number
 $Re_{ac}$
which compares the viscous dissipation to inertia or equivalently the wave attenuation length
 $L_{a}=\unicode[STIX]{x1D70C}c_{0}^{3}/\unicode[STIX]{x1D714}^{2}\unicode[STIX]{x1D707}(4/3+\unicode[STIX]{x1D709}/\unicode[STIX]{x1D707})$
to the wavelength
 $\unicode[STIX]{x1D706}$
:
 $$\begin{eqnarray}Re_{ac}=\frac{L_{a}}{\unicode[STIX]{x1D706}}=\frac{\unicode[STIX]{x1D70C}_{0}c_{0}^{2}}{\unicode[STIX]{x1D714}\unicode[STIX]{x1D707}\left(4/3+\displaystyle \frac{\unicode[STIX]{x1D709}}{\unicode[STIX]{x1D707}}\right)}.\end{eqnarray}$$
Except at very high frequency (
 ${>}1$
GHz) or for extremely viscous fluids and high driving frequencies, the acoustical Reynolds number is generally high (
 $Re_{ac}\gg 1$
). It is worth to mention that a quite different Reynolds number could be defined for the solenoidal part of the velocity field that results from the high shear rate in the Stokes boundary layer (Rayleigh Reference Rayleigh1915; Vanneste & Bühler Reference Vanneste and Bühler2011). In this case, the attenuation length should be the boundary layer thickness. Although this region represents a tiny fraction of the droplet size at the acoustical frequencies considered here (thickness
 $\unicode[STIX]{x1D6FF}_{S}=\sqrt{2\unicode[STIX]{x1D708}/\unicode[STIX]{x1D714}}\simeq 0.12~\unicode[STIX]{x03BC}\text{m}$
for water at 20 MHz up to 1.8
 $\unicode[STIX]{x03BC}$
m for 90 wt.% glycerol mixture), it may be argued that the boundary layer streaming extends much further than the Stokes boundary layer itself. However, according to Vanneste & Bühler (Reference Vanneste and Bühler2011) comprehensive calculations in a simplified 2-D geometry, the boundary layer streaming is negligible compared to the bulk streaming as long as the fluid vessel size and the SAW attenuation length both greatly exceed the SAW wavelength, which is the case here. We will therefore only consider the bulk waves which yields a high acoustical Reynolds number as estimated for the frequency and liquids used in the present experiments and simulations in table 1. Finally, since the boundary layer streaming is unimportant here, we also neglect the tangential displacement associated with the surface acoustic wave (see Vanneste & Bühler (Reference Vanneste and Bühler2011) for a comprehensive analysis).
Moreover, if we consider only steady streaming (stationary flow produced by acoustic waves), the time derivatives in (3.8) and (3.9) can be cancelled out. We obtain in this case:
 $$\begin{eqnarray}\unicode[STIX]{x2202}_{i}\bar{v}_{i}=0,\end{eqnarray}$$
which amounts to saying that the steady streaming flow is incompressible. Then the time-averaged momentum conservation equation becomes:
 $$\begin{eqnarray}-\!\unicode[STIX]{x2202}_{i}\bar{p}+\unicode[STIX]{x1D707}\unicode[STIX]{x2202}_{jj}^{2}\bar{v}_{i}+{\mathcal{F}}_{i}=0,\end{eqnarray}$$
with
 ${\mathcal{F}}_{i}$
the Reynolds stress imbalance of the sound wave:
 $$\begin{eqnarray}{\mathcal{F}}_{i}=-\langle \unicode[STIX]{x1D70C}_{0}\unicode[STIX]{x2202}_{j}(\tilde{v}_{i}\tilde{v}_{j})\rangle =-\unicode[STIX]{x1D70C}_{0}\langle \tilde{v}_{j}\unicode[STIX]{x2202}_{j}\tilde{v}_{i}+\tilde{v}_{i}\unicode[STIX]{x2202}_{j}\tilde{v}_{j}\rangle .\end{eqnarray}$$
This equation is simply the steady-state Stokes equation driven by a forcing term
 ${\mathcal{F}}_{i}$
resulting from average nonlinear interactions of the acoustic field.
It is worth noting that the derivation of acoustic streaming constitutive equations follows a similar procedure as the one used for the derivation of the Reynolds-averaged Navier–Stokes equation in the field of turbulence. It describes how some strong fluctuating nonlinear terms influence the steady flow (Bühler Reference Bühler2009; Vanneste & Bühler Reference Vanneste and Bühler2011). Nevertheless, the fundamental differences between the derivation of the constitutive equations of acoustic streaming and turbulence are (i) that owing to the weak amplitude of the acoustic field, a perturbation analysis is possible and (ii) that the source term in the average equations emanates in the former case from the first-order compressible field, namely the acoustic wave.
3.4 Periodic fluctuations up to second order: nonlinear acoustics
The mass and momentum equations for the periodic fluctuations
 $\tilde{f}$
up to second order can be obtained by subtracting the time-averaged equations (3.8) and (3.9) from the initial Navier–Stokes isentropic equations (3.5) and (3.6):
 $$\begin{eqnarray}\unicode[STIX]{x2202}_{t}\tilde{\unicode[STIX]{x1D70C}}+\unicode[STIX]{x1D70C}_{0}\unicode[STIX]{x2202}_{i}\tilde{v}_{i}=-\unicode[STIX]{x2202}_{i}\langle \!\langle \tilde{\unicode[STIX]{x1D70C}}\tilde{v_{i}}\rangle \!\rangle ,\end{eqnarray}$$
and:
 $$\begin{eqnarray}\unicode[STIX]{x1D70C}_{0}\unicode[STIX]{x2202}_{t}\tilde{v}_{i}+\unicode[STIX]{x2202}_{i}\tilde{p}-\unicode[STIX]{x1D707}\unicode[STIX]{x2202}_{jj}^{2}\tilde{v}_{i}-\left(\frac{\unicode[STIX]{x1D707}}{3}+\unicode[STIX]{x1D709}\right)\unicode[STIX]{x2202}_{ij}^{2}\tilde{v}_{j}=-\unicode[STIX]{x2202}_{t}\langle \!\langle \tilde{\unicode[STIX]{x1D70C}}\tilde{v_{i}}\rangle \!\rangle -\unicode[STIX]{x1D70C}_{0}\unicode[STIX]{x2202}_{j}\langle \!\langle \,\tilde{v_{i}}\tilde{v_{j}}\rangle \!\rangle ,\end{eqnarray}$$
with
 $\langle \!\langle \tilde{f}\tilde{g}\rangle \!\rangle =\tilde{f}\tilde{g}-\langle \,\tilde{f}\tilde{g}\rangle$
.
The left-hand sides of (3.13) and (3.14), along with the equation of state (3.7) at first order, constitute the linear equations of damped acoustic waves. The right-hand sides of these equations correspond to nonlinear terms, which modify the propagation of acoustic waves through energy transfers to harmonic frequencies (
 $2\unicode[STIX]{x1D714},3\unicode[STIX]{x1D714},\ldots$
).
If we assume (see previous section) that the acoustical Reynolds number is high and the acoustical Mach number is small, these equations become at leading order:
 $$\begin{eqnarray}\displaystyle & \displaystyle \unicode[STIX]{x2202}_{t}\tilde{\unicode[STIX]{x1D70C}}+\unicode[STIX]{x1D70C}_{0}\unicode[STIX]{x2202}_{i}\tilde{v}_{i}=0, & \displaystyle\end{eqnarray}$$
 $$\begin{eqnarray}\displaystyle & \displaystyle \unicode[STIX]{x1D70C}_{0}\unicode[STIX]{x2202}_{t}\tilde{v}_{i}+\unicode[STIX]{x2202}_{i}\tilde{p}=0, & \displaystyle\end{eqnarray}$$
 $$\begin{eqnarray}\displaystyle & \displaystyle \text{with }\tilde{p}=c_{0}^{2}\tilde{\unicode[STIX]{x1D70C}}, & \displaystyle\end{eqnarray}$$
which amounts to discarding all nonlinear and dissipative effects. From (3.16), we can infer that the oscillating flow is potential at leading order (
 $\tilde{v}_{i}=-\unicode[STIX]{x2202}_{i}(\tilde{\unicode[STIX]{x1D719}})$
, with
 $\tilde{\unicode[STIX]{x1D719}}$
the velocity potential). A simple combination of (3.15) and (3.17):
 $[\!c_{0}^{2}\;\unicode[STIX]{x2202}_{i}$
(3.15)
 $-\,\unicode[STIX]{x2202}_{t}$
(3.16)] with (3.17) yields the celebrated d’Alembert equation:
 $$\begin{eqnarray}\unicode[STIX]{x2202}_{tt}^{2}\tilde{\unicode[STIX]{x1D719}}-c_{0}^{2}\unicode[STIX]{x2202}_{ii}^{2}\tilde{\unicode[STIX]{x1D719}}=0,\end{eqnarray}$$
with
 $\tilde{p}=\unicode[STIX]{x1D70C}_{0}\unicode[STIX]{x2202}_{t}\tilde{\unicode[STIX]{x1D719}}$
and
 $\tilde{\unicode[STIX]{x1D70C}}=\unicode[STIX]{x1D70C}_{0}/c_{0}^{2}\unicode[STIX]{x2202}_{t}\tilde{\unicode[STIX]{x1D719}}$
.
Now, if we do the same combination of equations (3.13), (3.14) and (3.7) but up to next order in
 $M$
and
 $1/Re_{ac}$
, we obtain the Kuznetsov equation (Kuznetsov Reference Kuznetsov1970) (see e.g. Coulouvrat (Reference Coulouvrat1992) for a detailed demonstration with asymptotic analysis):
 $$\begin{eqnarray}\unicode[STIX]{x2202}_{tt}^{2}\tilde{\unicode[STIX]{x1D719}}-c_{0}^{2}\unicode[STIX]{x2202}_{ii}^{2}\tilde{\unicode[STIX]{x1D719}}-\frac{\unicode[STIX]{x1D707}b}{\unicode[STIX]{x1D70C}_{0}}\unicode[STIX]{x2202}_{t}\unicode[STIX]{x2202}_{jj}^{2}\tilde{\unicode[STIX]{x1D719}}=\unicode[STIX]{x2202}_{t}\left(\frac{B}{2Ac_{0}^{2}}\langle \!\langle (\unicode[STIX]{x2202}_{t}\tilde{\unicode[STIX]{x1D719}})^{2}\rangle \!\rangle +\langle \!\langle (\unicode[STIX]{x2202}_{i}\tilde{\unicode[STIX]{x1D719}})^{2}\rangle \!\rangle \right),\end{eqnarray}$$
with
 $b=4/3+\unicode[STIX]{x1D709}/\unicode[STIX]{x1D707}$
. Finally in the paraxial approximation (weak diffraction of the beam), we have the Lighthill–Westervelt equation
 $(\unicode[STIX]{x2202}_{i}\tilde{\unicode[STIX]{x1D719}})^{2}=(1/c_{0}^{2})(\unicode[STIX]{x2202}_{t}\tilde{\unicode[STIX]{x1D719}})^{2}$
, leading to:
 $$\begin{eqnarray}\unicode[STIX]{x2202}_{tt}^{2}\tilde{\unicode[STIX]{x1D719}}-c_{0}^{2}\unicode[STIX]{x2202}_{ii}^{2}\tilde{\unicode[STIX]{x1D719}}-\frac{\unicode[STIX]{x1D707}b}{\unicode[STIX]{x1D70C}_{0}}\unicode[STIX]{x2202}_{t}\unicode[STIX]{x2202}_{jj}^{2}\tilde{\unicode[STIX]{x1D719}}=\frac{\unicode[STIX]{x1D6FD}}{c_{0}^{2}}\unicode[STIX]{x2202}_{t}\langle \!\langle (\unicode[STIX]{x2202}_{t}\tilde{\unicode[STIX]{x1D719}})^{2}\rangle \!\rangle ,\end{eqnarray}$$
with
 $\unicode[STIX]{x1D6FD}=1+B/2A$
the so-called nonlinear parameter. This equation allows us to compute the damped nonlinear propagation of acoustic waves.
The question then arises as to whether the nonlinear propagation of the acoustic wave must be considered to compute the acoustic streaming sources in (3.11)? An elementary analysis solely based on the order of the nonlinear terms might lead to the misleading premature conclusion that since acoustic nonlinear terms on the right-hand side of (3.19) are of second order, their quadratic combination in (3.12) is of fourth order and thus could be safely neglected when computing the acoustic streaming. In fact these nonlinear terms are weak but nevertheless cumulative, so they can play a significant role over a distance called the ‘shock distance’
 $L_{s}=c_{0}^{2}/\unicode[STIX]{x1D714}\unicode[STIX]{x1D6FD}U_{ac}$
, which depends on the first-order velocity magnitude
 $U_{ac}$
. To answer this question correctly, it must thus be recalled that acoustic streaming is a consequence of the attenuation of the acoustic wave. This attenuation is proportional to the square of the acoustic wave frequency
 $\unicode[STIX]{x1D714}^{2}$
. Since nonlinear terms in (3.20) induce energy transfers from the driving frequency to higher harmonics, they promote the dissipation and thus the acoustic streaming. In an unbounded medium, the streaming enhancement by harmonics generation can be quantified by the ratio of the wave attenuation length
 $L_{a}=\unicode[STIX]{x1D70C}_{0}c_{0}^{3}/\unicode[STIX]{x1D714}^{2}\unicode[STIX]{x1D707}b$
to the shock distance
 $L_{s}$
:
 $$\begin{eqnarray}\frac{L_{a}}{L_{s}}=\frac{\unicode[STIX]{x1D70C}_{0}c_{0}\unicode[STIX]{x1D6FD}U_{ac}}{\unicode[STIX]{x1D714}\unicode[STIX]{x1D707}b}.\end{eqnarray}$$
Nonlinear terms in (3.20) can thus be neglected when
 $L_{a}/L_{s}\ll 1$
. In the present situation, since
 $U_{ac}<10~\text{mm}~\text{s}^{-1}$
, the maximum value of this ratio is
 $10^{-1}$
for water and goes down to
 $10^{-3}$
for water–glycerol mixtures. Moreover, in cavities with water/air interfaces such as drops, the shock distance must also be compared to the size of the cavity
 $L_{c}$
. Indeed, nonlinear effects are only significant when they are cumulative. Since it was shown by Tanter et al. (Reference Tanter, Thomas, Coulouvrat and Fink2001) that each wave reflection at an air–water interface results in the deconstruction of these nonlinear effects, these latter can only be significant if the characteristic size of the cavity
 $L_{c}$
is larger than the shock distance. Here
 $L_{c}\sim 1$
mm while
 $L_{s}\sim 1$
m. Consequently, nonlinear terms can be safely discarded in (3.20) for the analysis and simulation of the present experiments, leading to the equation of damped acoustic waves:
 $$\begin{eqnarray}\unicode[STIX]{x2202}_{tt}^{2}\tilde{\unicode[STIX]{x1D719}}-c_{0}^{2}\unicode[STIX]{x2202}_{ii}^{2}\tilde{\unicode[STIX]{x1D719}}-\frac{\unicode[STIX]{x1D707}b}{\unicode[STIX]{x1D70C}_{0}}\unicode[STIX]{x2202}_{t}\unicode[STIX]{x2202}_{jj}^{2}\tilde{\unicode[STIX]{x1D719}}=0.\end{eqnarray}$$
3.5 Streaming source term: the hydrodynamic Reynolds stress tensor
In this section we follow the Eckart (Reference Eckart1948) and Vanneste & Bühler (Reference Vanneste and Bühler2011) guidelines to analyse the different contributions of the streaming source (3.12). We discard all the gradient terms that are balanced by a change of static pressure and therefore to do not contribute to acoustic streaming. This simplification is essential since the magnitude of the neglected terms is much larger than that of the relevant terms and can lead to significant numerical error when calculating the flow produced by the acoustic wave.
Since the wave perturbation is irrotational, the first term of the force in (3.12) is easily integrated and identified as the kinetic energy
 ${\mathcal{K}}=(1/2)\unicode[STIX]{x1D70C}_{0}\tilde{v}^{2}$
:
 $$\begin{eqnarray}\unicode[STIX]{x1D70C}_{0}\langle \tilde{v}_{j}\unicode[STIX]{x2202}_{j}\tilde{v}_{i}\rangle =\unicode[STIX]{x2202}_{i}\langle {\mathcal{K}}\rangle .\end{eqnarray}$$
The second term is computed from the mass conservation equation (3.13) at leading order:
 $$\begin{eqnarray}\langle \unicode[STIX]{x1D70C}_{0}\tilde{v}_{i}\unicode[STIX]{x2202}_{j}\tilde{v}_{j}\rangle =-\langle \tilde{v}_{i}\unicode[STIX]{x2202}_{t}\tilde{\unicode[STIX]{x1D70C}}\rangle =\langle \tilde{\unicode[STIX]{x1D70C}}\unicode[STIX]{x2202}_{t}\tilde{v}_{i}\rangle ,\end{eqnarray}$$
where we used integration by parts to move from the second expression to the third. Then, if we use the classical vector identity
 $\unicode[STIX]{x1D735}\unicode[STIX]{x1D735}\boldsymbol{\cdot }\tilde{\boldsymbol{u}}=\unicode[STIX]{x1D6FB}^{2}\tilde{\boldsymbol{u}}+\unicode[STIX]{x1D735}\times \unicode[STIX]{x1D735}\times \tilde{\boldsymbol{u}}$
, the wave momentum equation (3.14) yields:
 $$\begin{eqnarray}\langle \unicode[STIX]{x1D70C}_{0}\tilde{v}_{i}\unicode[STIX]{x2202}_{j}\tilde{v}_{j}\rangle =-\left\langle \frac{\tilde{\unicode[STIX]{x1D70C}}}{\unicode[STIX]{x1D70C}_{0}}\unicode[STIX]{x2202}_{i}\tilde{p}\right\rangle +\left(\frac{4}{3}\unicode[STIX]{x1D707}+\unicode[STIX]{x1D709}\right)\left\langle \frac{\tilde{\unicode[STIX]{x1D70C}}}{\unicode[STIX]{x1D70C}_{0}}\unicode[STIX]{x2202}_{jj}^{2}\tilde{v}_{i}\right\rangle .\end{eqnarray}$$
Finally, the equation of state (3.7) yields:
 $\langle (\tilde{\unicode[STIX]{x1D70C}}/\unicode[STIX]{x1D70C}_{0})\unicode[STIX]{x2202}_{i}\tilde{p}\rangle =\langle (c^{2}/2\unicode[STIX]{x1D70C}_{0})\unicode[STIX]{x2202}_{i}\tilde{\unicode[STIX]{x1D70C}}^{2}\rangle$
. Consequently, this term is the gradient of the potential energy of the wave in a linear medium:
 $$\begin{eqnarray}\left\langle \frac{\tilde{\unicode[STIX]{x1D70C}}}{\unicode[STIX]{x1D70C}_{0}}\unicode[STIX]{x2202}_{i}\tilde{p}\right\rangle =\unicode[STIX]{x2202}_{i}\langle {\mathcal{V}}\rangle .\end{eqnarray}$$
If we combine (3.23), (3.25) and (3.26), we obtain the following expression of the force
 ${\mathcal{F}}_{i}$
(see e.g. Gusev & Rudenko Reference Gusev and Rudenko1979):
 $$\begin{eqnarray}{\mathcal{F}}_{i}=-\unicode[STIX]{x2202}_{i}\langle {\mathcal{L}}\rangle -\left(\frac{4}{3}\unicode[STIX]{x1D707}+\unicode[STIX]{x1D709}\right)\left\langle \frac{\tilde{\unicode[STIX]{x1D70C}}}{\unicode[STIX]{x1D70C}_{0}}\unicode[STIX]{x2202}_{jj}^{2}\tilde{v}_{i}\right\rangle ,\end{eqnarray}$$
with the acoustic Lagrangian
 ${\mathcal{L}}={\mathcal{K}}-{\mathcal{V}}$
. We can work out a more practical equation by substituting the linear undamped wave equation in the viscous term and assuming an harmonic wave motion:
 $$\begin{eqnarray}{\mathcal{F}}_{i}=-\unicode[STIX]{x2202}_{i}\langle {\mathcal{L}}\rangle +\frac{\unicode[STIX]{x1D714}^{2}\unicode[STIX]{x1D708}b}{c^{4}}\langle \unicode[STIX]{x1D6F1}_{i}\rangle ,\end{eqnarray}$$
with
 $\unicode[STIX]{x1D708}=\unicode[STIX]{x1D707}/\unicode[STIX]{x1D70C}_{0}$
. The first term derives from a potential and is independent of the bulk and shear viscosities, and thus of the wave attenuation. Since acoustic streaming relies on the momentum transfer from the wave mode (irrotational, compressible) to the viscous mode (solenoidal), through the wave attenuation, this term does not contribute to the steady flow; it is simply balanced by a hydrostatic pressure gradient. This can be easily verified by recasting equation (3.11) in the form:
 $$\begin{eqnarray}-\!\unicode[STIX]{x2202}_{i}\bar{p^{\ast }}+\unicode[STIX]{x1D707}\unicode[STIX]{x2202}_{jj}^{2}\bar{v}_{i}+{\mathcal{F}}_{i}^{\ast }=0,\end{eqnarray}$$
with
 $\bar{p}^{\ast }=\bar{p}+\langle {\mathcal{L}}\rangle$
and
 ${\mathcal{F}}_{i}^{\ast }=(\unicode[STIX]{x1D714}^{2}\unicode[STIX]{x1D708}b/c^{4})\langle \unicode[STIX]{x1D6F1}_{i}\rangle$
.
 ${\mathcal{F}}_{i}^{\ast }$
is related to the wave dissipation and has a much smaller magnitude than its counterpart
 $\langle {\mathcal{L}}\rangle$
. Nevertheless, it is not potential and hence is the sole source term of acoustic bulk streaming, as emphasized in Lighthill (Reference Lighthill1978) and Eckart (Reference Eckart1948) studies.
3.6 Final simplified system of equations
We recall briefly here the optimized expressions to simulate the experimentally observed acoustic streaming in droplets:
 $$\begin{eqnarray}\displaystyle & \displaystyle \text{acoustic wave: }\unicode[STIX]{x2202}_{tt}^{2}\tilde{\unicode[STIX]{x1D719}}-c_{0}^{2}\unicode[STIX]{x2202}_{ii}^{2}\tilde{\unicode[STIX]{x1D719}}-\frac{\unicode[STIX]{x1D707}b}{\unicode[STIX]{x1D70C}_{0}}\unicode[STIX]{x2202}_{t}\unicode[STIX]{x2202}_{jj}^{2}\tilde{\unicode[STIX]{x1D719}}=0, & \displaystyle\end{eqnarray}$$
 $$\begin{eqnarray}\displaystyle & \displaystyle \text{streaming Stokes flow: }\left\{\begin{array}{@{}c@{}}\unicode[STIX]{x2202}_{i}\bar{v}_{i}=0,\\ -\unicode[STIX]{x2202}_{i}\bar{p^{\ast }}+\unicode[STIX]{x1D707}\unicode[STIX]{x2202}_{jj}^{2}\bar{v}_{i}+{\mathcal{F}}_{i}^{\ast }=0,\end{array}\right. & \displaystyle\end{eqnarray}$$
 $$\begin{eqnarray}\displaystyle & \displaystyle \text{acoustic streaming source term: }{\mathcal{F}}_{i}^{\ast }=\frac{\unicode[STIX]{x1D714}^{2}\unicode[STIX]{x1D708}b}{c^{4}}\langle \unicode[STIX]{x1D6F1}_{i}\rangle . & \displaystyle\end{eqnarray}$$
4 Numerical model
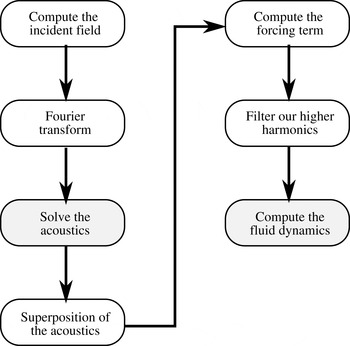
As stated in the experimental section, when a highly viscous droplet is exposed to megahertz surface acoustic wave excitation, the hydrodynamic flow may take up to tens of seconds to reach steady state. This colossal difference of time scales between acoustics and hydrodynamics prevents any attempt to compute dynamically the acoustic streaming in complex 3-D geometries. Instead, we first simulate the acoustic field and then the hydrodynamic flow, as shown in figure 4. The computation is not straightforward due to the large discrepancy between the droplet size and the acoustic wavelength. The acoustic problem is solved in cylindrical geometry to minimize memory usage, the incident field being resolved as a sum of the cylindrical functions by spatial Fourier transform. This allows to compute the three-dimensional acoustic field through several elementary calculations of acoustic fields in a two-dimensional geometry with reduced memory requirements. Then, the hydrodynamic flow is computed with a simplified forcing term reminiscent of large eddy simulation (LES) which mimics the effect of viscosity to minimize complex momentum source terms.
Computational method flowchart. White steps were performed with Matlab and grey steps with Comsol.

4.1 Computation of the acoustic field
The acoustic field is computed in the frequency domain. In this case, equation (3.30) becomes:
 $$\begin{eqnarray}\unicode[STIX]{x2202}_{ii}^{2}\tilde{\unicode[STIX]{x1D719}}+k^{2}\tilde{\unicode[STIX]{x1D719}}=0,\end{eqnarray}$$
with:
 $$\begin{eqnarray}k^{2}=\frac{k_{0}^{2}}{1+\text{i}/Re_{ac}}.\end{eqnarray}$$
Here,
 $k_{0}=\unicode[STIX]{x1D714}/c_{0}$
is the wavenumber of the unattenuated wave and
 $Re_{ac}$
is the acoustical Reynolds number (
 $Re_{ac}\gg 1$
).
The large discrepancy between the droplet size and the acoustic wavelength yields very large and intensive simulations. For instance, direct 3-D simulation of the acoustic field on a 32 GB RAM computer with the finite element method only allows us to simulate 2 mm diameter droplets up to 8 MHz. As shown in the supplemental material, RAM requirements sharply increase with increasing frequency, and extrapolation to 20 MHz culminates at 1.0 TB, thus preventing any direct computation of the acoustic field.
To minimize memory requirements, we took advantage of the droplet rotational symmetry to reduce the problem to a two-dimensional one. The protocol described in the following uses Fourier transform to resolve the incident field as a sum of circular harmonics, solves each of them separately and then reconstructs the field thanks to the superposition principle. In this way, the complete problem is decomposed into subproblems with low memory requirements which can be computed in parallel. This method thus ensures an optimal matching with the capacity of the computer (number of cores, memory).
4.1.1 Method: spatial Fourier transform
Working in cylindrical coordinates, Fourier transform allows resolving of any function into a convenient weighted sum of complex exponentials:
 $$\begin{eqnarray}f(r,\unicode[STIX]{x1D703})=\mathop{\sum }_{l=-\infty }^{+\infty }f_{l}(r)\text{e}^{\text{i}l\unicode[STIX]{x1D703}},\end{eqnarray}$$
with
 $$\begin{eqnarray}f_{l}(r)=\frac{1}{2\unicode[STIX]{x03C0}}\int _{-\unicode[STIX]{x03C0}}^{+\unicode[STIX]{x03C0}}f(r,\unicode[STIX]{x1D703})\text{e}^{-\text{i}l\unicode[STIX]{x1D703}}\,\text{d}\unicode[STIX]{x1D703}.\end{eqnarray}$$
Here, the only non-axisymmetric boundary condition is the normal displacement
 $\tilde{u}$
of the substrate due to the incident SAW. It is projected into Fourier harmonics:
 $$\begin{eqnarray}\tilde{u} _{l}(r)=\frac{1}{2\unicode[STIX]{x03C0}}\int _{-\unicode[STIX]{x03C0}}^{+\unicode[STIX]{x03C0}}\tilde{u} (r,\unicode[STIX]{x1D703})\text{e}^{-\text{i}l\unicode[STIX]{x1D703}}\,\text{d}\unicode[STIX]{x1D703}.\end{eqnarray}$$
In practice, the value of
 $l$
can be restricted. Indeed,
 $l_{max}\simeq \unicode[STIX]{x03C0}D/\unicode[STIX]{x1D706}_{s}$
corresponds to the maximum number of wavelengths
 $\unicode[STIX]{x1D706}_{s}$
the input surface acoustic wave can travel along the perimeter of the droplet, where
 $D$
is the droplet diameter. We computed this integral for
 $l\in [0,2l_{max}]$
,
 $l$
being an integer. The value of
 $\tilde{u}$
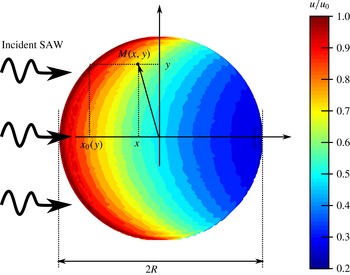
depends on the incident wave. Neglecting diffraction, the SAW magnitude decreases exponentially as soon as it meets the droplet interface at a given point
 $x_{0}$
. The attenuation rate
 $\unicode[STIX]{x1D6FC}$
is provided for instance by Campbell & Jones (Reference Campbell and Jones1970). For a given point
 $M(x,y)$
, the propagation length beneath the droplet is given by
 $x-x_{0}(y)$
(see figure 5). The vertical displacement field
 $\tilde{u}$
at the droplet base is then given by Shiokawa et al. (Reference Shiokawa, Matsui and Ueda1990):
 $$\begin{eqnarray}\displaystyle & \displaystyle \tilde{u} =u_{0}\exp (-\text{i}k_{s}x)\exp (-\unicode[STIX]{x1D6FC}(x-x_{0}(y))), & \displaystyle\end{eqnarray}$$
 $$\begin{eqnarray}\displaystyle & \displaystyle x_{0}(y)=-\sqrt{R^{2}-y^{2}}, & \displaystyle\end{eqnarray}$$
 $$\begin{eqnarray}\displaystyle & \displaystyle \unicode[STIX]{x1D6FC}=\unicode[STIX]{x1D6FC}_{0}\ln (10)F/20, & \displaystyle\end{eqnarray}$$
where
 $F$
is the SAW frequency in Hz,
 $u_{0}$
is the magnitude of the acoustic perturbation displacement and
 $\unicode[STIX]{x1D6FC}_{0}$
the attenuation coefficient (in
 $\text{s}~\text{m}^{-1}$
)
 $\unicode[STIX]{x1D6FC}_{0}\simeq 2.0\times 10^{-7}\times \unicode[STIX]{x1D70C}_{0}$
. We computed
 $\unicode[STIX]{x1D6FC}_{0}$
from the value given by Campbell & Jones (Reference Campbell and Jones1970) in the case of water loading (
 $0.2~\text{dB}~\text{MHz}^{-1}~\text{cm}^{-1}$
).
Model of the incident leaky SAW. Colours are indicative of the SAW magnitude. At 20 MHz and for a
 $12.5~\unicode[STIX]{x03BC}\text{l}$
water droplet (
 $2R=3.7$
mm), the incident SAW vertical displacement
 $\tilde{u}$
drops by 80 % as it propagates beneath the droplet.

We then solve all variables in the form:
 $\tilde{p}(r,\unicode[STIX]{x1D703},z)=\tilde{p}_{l}(r,z)\text{e}^{\text{i}l\unicode[STIX]{x1D703}}$
,
 $\tilde{v}_{j}(r,\unicode[STIX]{x1D703},z)=\tilde{v}_{j,l}(r,z)\text{e}^{\text{i}l\unicode[STIX]{x1D703}}$
with
 $j$
either
 $r,\unicode[STIX]{x1D703},z$
. Equation (4.1) becomes:
 $$\begin{eqnarray}k^{2}\tilde{p}=-\frac{1}{r}\unicode[STIX]{x2202}_{r}(r\unicode[STIX]{x2202}_{r}\tilde{p})-\frac{1}{r^{2}}\unicode[STIX]{x2202}_{\unicode[STIX]{x1D703}\unicode[STIX]{x1D703}}^{2}\tilde{p}-\unicode[STIX]{x2202}_{zz}^{2}\tilde{p},\end{eqnarray}$$
which can be re-cast using the axisymmetric variables:
 $$\begin{eqnarray}\left(k^{2}-\frac{l^{2}}{r^{2}}\right)\tilde{p}_{l}=-\unicode[STIX]{x2202}_{rr}^{2}\tilde{p}_{l}-\unicode[STIX]{x2202}_{zz}^{2}\tilde{p}_{l}-\frac{1}{r}\unicode[STIX]{x2202}_{r}\tilde{p}_{l}.\end{eqnarray}$$
This equation is solved with a finite element method by the commercial solver COMSOL 4.3b. (The default partial differential equation interface for axisymmetric systems does not include the last right-hand term of (4.10).) The boundary condition at the liquid–air interface reads:
 $$\begin{eqnarray}\tilde{p}_{l}=0.\end{eqnarray}$$
At the solid liquid interface, we enforce an impedance boundary condition with the source term computed from (4.5):
 $$\begin{eqnarray}\unicode[STIX]{x2202}_{z}\tilde{p}_{l}=\unicode[STIX]{x1D70C}_{0}\unicode[STIX]{x1D714}^{2}\tilde{u} _{l}-\text{i}\frac{\unicode[STIX]{x1D714}\unicode[STIX]{x1D70C}_{0}}{{\mathcal{Z}}_{s}}\tilde{p}_{l},\end{eqnarray}$$
where
 ${\mathcal{Z}}_{s}=\unicode[STIX]{x1D70C}_{s}c_{s}$
is the acoustic impedance of the solid. (This expression is exact only for plane waves with normal incidence falling on an isotropic unbounded solid medium. Nevertheless, the agreement of our simulations with experimental results was equally good at low attenuation (where this boundary condition might have played a role) and at high enough viscosity (where this boundary condition is irrelevant since the wave is attenuated even before bouncing back to the solid).) The solution
 $\tilde{p}$
can then be reconstructed thanks to the linearity of the equations:
 $$\begin{eqnarray}\tilde{p}(r,\unicode[STIX]{x1D703},z)=\mathop{\sum }_{-\infty }^{+\infty }\tilde{p}_{l}\text{e}^{\text{i}l\unicode[STIX]{x1D703}},\end{eqnarray}$$
and the velocity field can be reconstructed in a similar fashion described in appendix A. Thus, the acoustic field calculation can be summed up as follows: we start by computing the incident wave using (4.6)–(4.8), then its Fourier transform as given by (4.5). We combine these data and boundary conditions (4.11), (4.12) with the wave equation (4.10) to obtain the acoustic field for each individual harmonic. Finally, the total field is reconstructed using (A 7), (A 8). The algorithms ensuring the azimuthal Fourier transform were validated carefully by comparing the acoustic field in droplets exposed to 6 MHz SAWs as computed by a direct finite element model and by the Fourier method (figures available in supplemental material).
4.1.2 Resulting acoustical field in the droplet
To the best of our knowledge, the current computation of the acoustic field in a 3-D sessile droplet involves frequencies an order of magnitude above the only other work published so far by Quintero & Simonetti (Reference Quintero and Simonetti2013). As a result, it is significantly different and we will dedicate a few lines to detail the key features of this field.
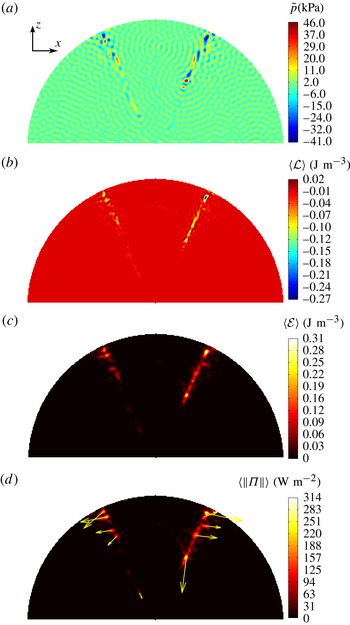
Meridian cross-section of the acoustic field in a water droplet excited by a 20 MHz acoustic field. (a) Acoustic pressure
 $\tilde{p}$
.
 $\tilde{p}_{max}=40$
kPa. (b) Average Lagrangian density
 $\langle {\mathcal{L}}\rangle$
.
 $-0.27~\text{J}<\langle {\mathcal{L}}\rangle <0.020~\text{J}~\text{m}^{-3}$
. (c) Average energy density
 $\langle {\mathcal{E}}\rangle =\langle {\mathcal{K}}+{\mathcal{V}}\rangle$
.
 $\langle {\mathcal{E}}\rangle _{max}=0.31~\text{J}~\text{m}^{-3}$
. (d) Poynting vector.
 $\Vert \langle \unicode[STIX]{x1D72B}\rangle \Vert _{max}=300~\text{W}~\text{m}^{-2}$
. Droplet volume is 12.5
 $\unicode[STIX]{x03BC}$
l, base diameter is 3.7 mm. The incident wave comes from the left with a vertical displacement of 10 pm.

In figure 6, we show the acoustic field in a sessile water droplet excited by a 20 MHz SAW. The acoustic pressure (6
a) appears with two caustics superimposed on a quasi-random background field. The incident wave is overwhelmed by the numerous reflections on the droplet surface. The two caustics are much more pronounced than what is found in the two-dimensional analogue shown in Brunet et al. (Reference Brunet, Baudoin, Bou Matar and Zoueshtiagh2010), probably due to the increased ray convergence in three dimensions. These caustics show no symmetry axis within the
 $x$
–
 $z$
plane and are therefore structurally stable under the assumption that the droplet contact line is not pinned (Berry Reference Berry1976). This legitimates a posteriori the validity of using hemispherical geometry to model droplets slightly flattened by gravity (De Gennes, Brochard-Wyart & Quéré Reference De Gennes, Brochard-Wyart and Quéré2013). The Lagrangian of the acoustic field (figure 6
b) is mostly focused along the two caustics. Its large magnitude indicates that the acoustic field is not even remotely related to plane waves. The energy of the acoustic field (figure 6
c) clearly shows the predominance of the caustics. The angle of this concentration of energy matches the Rayleigh refraction angle and the symmetry shows the stability of this particular acoustic ray. Finally, the Poynting vector (figure 6
d) is similar to the energy density and the Lagrangian, except that its divergence is almost zero in weakly attenuating media, and it gives some orientation to the flow forcing that is consistent with the experiment.
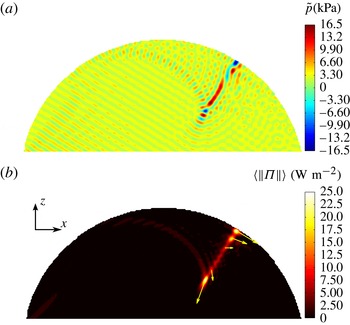
Meridian cross-section of the acoustic field in a 90 wt.% glycerol droplet excited by a 20 MHz acoustic field. (a) Acoustic pressure
 $\tilde{p}_{max}=16.5$
kPa. (b) Poynting vector.
 $\Vert \langle \unicode[STIX]{x1D72B}\rangle \Vert _{max}=25~\text{W}~\text{m}^{-2}$
Droplet volume is 12.5
 $\unicode[STIX]{x03BC}$
l, base diameter is 4.0 mm. The incident wave comes from the left with an amplitude of 10 pm.

Poynting vector in a 90 wt.% glycerol droplet excited by a 20 MHz acoustic field.
 $\Vert \langle \unicode[STIX]{x1D72B}\rangle \Vert _{max}=25~\text{W}~\text{m}^{-2}$
Droplet volume is 12.5
 $\unicode[STIX]{x03BC}$
l, base diameter is 4.0 mm. The incident wave propagates along the
 $x$
axis (from left to right) with an amplitude of 10 pm.

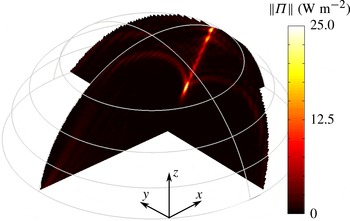
In figure 7, we display the radiation patterns obtained in 90 wt.% glycerol droplets. At such high viscosity, the pressure field becomes less symmetrical. Indeed, the incident wave is attenuated faster and hence undergoes less reflections at the droplet surface. Similarly to the low viscosity case, the acoustic power flow is concentrated in the meridian
 $x{-}z$
plane as shown in figure 8. The ray diameter is approximately the diffraction limit
 $\unicode[STIX]{x1D706}/2$
(figure 7). The Rayleigh radiation angle appears more clearly at higher dissipation, and the wave pattern loses its front–back symmetry. Remarkably, the Poynting vector becomes completely asymmetrical and forces the flow only on the right side of the droplet. We will detail the consequences of this change on the resulting flow pattern in the next section.
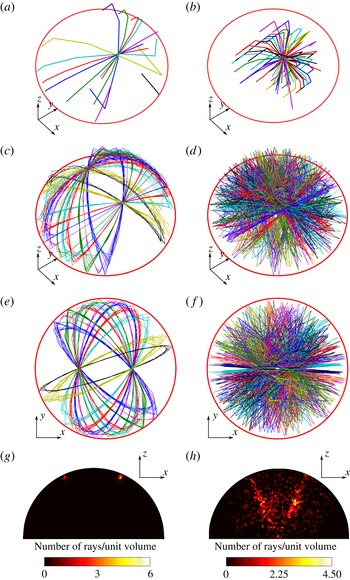
Surface (a,c,e,g) and volume (b,d,e,h) caustics deduced from geometrical acoustics. Surface caustics focus tangentially to the droplet surface whereas volume caustics focus orthogonally to the surface. The snapshots are taken after different acoustic path length: (a,b) 1.6 droplet radii, (c–h) 40 droplet radii; (g,h) depict the beam density. One unit volume is
 $r^{3}/10^{6}$
. The small mean free path caustics (a,c,e,g) follow periodical orbits along the droplet surface whereas large mean free path caustics (b,d,e,h) quickly show a more erratic behaviour. Animations of these trajectories are available in supplemental material.

Since the caustics play a major role in driving the droplet internal flow, we used geometrical acoustics to trace their origin. We simulated the propagation of multiple rays originating from the solid surface and propagating along the Rayleigh angle. These rays travel freely in the liquid volume but are reflected at the air–liquid and solid–liquid interfaces. We can then distinguish two types of rays depending on their mean free path. The rays with the shortest mean free path (figure 9 a,c,e) are guided by the droplet surface, whereas the rays with the longest mean free path (b,d,f) propagate in the droplet volume. The snapshots in figure 9(a,b) represent the wave after traveling approximately 1.6 droplet radii. At this stage, surface rays form a surface caustic tangential to the air–liquid interface, whereas volume rays form a volume caustic normal to the interface. As suggested by one referee, we allowed the wave to travel up to 40 times the droplet radius. Unexpectedly, the surface rays follow stable paths along the droplet surface (see figure 9 c,d) and maintain the same two caustics over a large number of periodic trajectories (orbits). Contrasting with the clean and periodic pattern of the surface rays, the volume rays yield a more chaotic arrangement. Interestingly, periodic echoes from sessile droplets have been observed before by Quintero & Simonetti (Reference Quintero and Simonetti2013), but were attributed to pseudo-Scholte waves propagating along the droplet contact line. The orbits observed here were not considered in Quintero et al. investigation and have a period compatible with the experimental echo. In figure 9(g,h), the density of rays faithfully reproduces the patterns observed in low-viscosity droplets. In the high-viscosity case, the acoustic rays attenuate before reaching the caustics at the back, which leads to the observed loss of symmetry.
4.2 Computation of the resulting flow
4.2.1 Direct numerical simulation (DNS)
The flow is computed with (3.31) and (3.32). These equations are combined with the no-slip boundary conditions at the solid–liquid interface and shear-free boundary condition at the air–liquid interface to perform the direct numerical simulation (DNS) of droplet acoustic streaming. DNS is a simulation from first principles and easy to implement.
The major shortcoming of DNS is the extensive use of memory. Indeed, the Poynting vector is a second-order quantity and has a typical variation length scale of
 $\unicode[STIX]{x1D706}/2$
. Consequently, DNS becomes computationally prohibitive for frequencies above 6 MHz. In the supplemental material, we report the memory required to simulate droplets exposed to SAW radiations with frequencies up to 8 MHz. Extrapolation to 20 MHz indicates that up to 580 GB of RAM would be necessary to perform the DNS simulation of our experiments.
4.2.2 Streaming source spatial filtering
In the field of turbulence, energy is accumulated and transported by large flow patterns but is dissipated only by the smallest eddies. The gigantic difference of length scale all along this energy cascade is a major issue. A well-established method called LES allows computation of turbulence on relatively coarse grids that account for subgrid-scale (SGS) dynamics through a SGS model (see e.g. Deardorff Reference Deardorff1970; Pope Reference Pope2004; Bou-Zeid Reference Bou-Zeid2015). The case of acoustic streaming appears as a reverse situation wherein a large-scale flow (the acoustic streaming) emerges from small-scale fluctuations (the acoustic wave). The SSSF method presented in this section relies on the fact that the small-scale variations of the streaming source term
 ${\mathcal{F}}^{\ast }$
do not contribute to the flow since they are filtered by the fluid viscosity. Indeed, the acoustic streaming under investigation is slow and laminar, yielding a linear equation with a momentum source term. It is then interesting to consider the Fourier transform of the velocity field. We can match each wavenumber of the flow field with a (possibly null) forcing term in order to solve each equation independently. It is then straightforward to notice that higher wavenumbers are filtered out by the Laplacian operator of the viscosity (decreasing in
 $1/k^{2}$
). In this regard, this SSSF model differs significantly from LES: in the former, smaller scales are sources of momentum and dissipation happens at larger scales, whereas in the latter, smaller scales act as momentum sinks because large-scale flows dissipate little energy.
Such filtering enables us to use grid cell sizes for the flow computation larger than the acoustic wavelength and thus considerably reduces the computational requirements for the resolution of the flow problem. It is important to note that since we work in the small Reynolds number regime, the characteristic length scale of the flow is entirely dictated by the streaming source term and the boundary conditions (no additional scale emerges from the flow itself like in the case of turbulent flows). The filtered source term
 $\text{}\underline{{\mathcal{F}}^{\ast }}$
is obtained in the real space from the convolution product with the filtering function
 ${\mathcal{H}}(x,y,z)$
:
 $$\begin{eqnarray}\text{}\underline{{\mathcal{F}}^{\ast }}=f\ast {\mathcal{H}},\end{eqnarray}$$
where the filtering function
 ${\mathcal{H}}(x,y,z)$
is defined from the filter transfer function
 $H(k_{x},k_{y},k_{z})$
according to the formula:
 $$\begin{eqnarray}{\mathcal{H}}(x,y,z)=\int _{{\mathcal{S}}}H(k_{x},k_{y},k_{z})\text{e}^{\text{i}k_{x}x+\text{i}k_{y}y+\text{i}k_{z}z}\,\text{d}{\mathcal{S}},\end{eqnarray}$$
with
 ${\mathcal{S}}$
the reciprocal space,
 $H(k_{x},k_{y},k_{z})=1$
when
 $k_{x}^{2}+k_{y}^{2}+k_{z}^{2}<k_{c}^{2}$
and zero otherwise, and
 $k_{c}$
is the critical wavenumber of the filtered flow structures. We choose the critical wavenumber
 $k_{c}$
as half the acoustical wavenumber in the fluid at working frequency. Indeed, the acoustic forcing term is the product of two acoustic quantities, which halves the spatial period. The exact choice of
 $k_{c}=k/2$
is somewhat arbitrary provided
 $k_{c}$
is below
 $2k$
and larger than
 $2\unicode[STIX]{x03C0}/L$
, where
 $L$
is the typical scale of the feature to be observed. This assertion was validated for various
 $0<L<D/40$
, and results are provided in supplemental material.
Consequently, the equations solved with the SSSF method are simply:
 $$\begin{eqnarray}\displaystyle & \displaystyle \unicode[STIX]{x2202}_{i}\bar{v}_{i}=0, & \displaystyle\end{eqnarray}$$
 $$\begin{eqnarray}\displaystyle & \displaystyle -\unicode[STIX]{x2202}_{i}\bar{p^{\ast }}+\unicode[STIX]{x1D707}\unicode[STIX]{x2202}_{jj}^{2}\bar{v}_{i}+\text{}\underline{{\mathcal{F}}_{i}^{\ast }}=0. & \displaystyle\end{eqnarray}$$
In the next section, we will show that the flow patterns computed from the DNS and the SSSF method agree qualitatively and quantitatively. Hence, in the remaining part of the paper all the simulations at 20 MHz will be performed with the SSSF method to overcome hardware limitations.
4.3 Results
The results of the simulation are presented from the most technical aspects to the most physical ones. First, we compare the flow pattern as given by the DNS and the SSSF method, and then we show the physical results relevant to the experimental study. More technical details are given in the supplemental material where we expose the memory requirements of direct methods versus the numerical recipes introduced previously.
4.3.1 Comparison of DNS and SSSF
SSSF reduces memory requirements by discarding the high spatial harmonics of the streaming source term. In this section, we evaluate the accuracy of this approach by comparing the flow field given by the DNS and the SSSF. The test case is the acoustic streaming in a 2 mm diameter sessile water droplet exposed to 6 MHz SAW radiations with an amplitude of 10 nm.
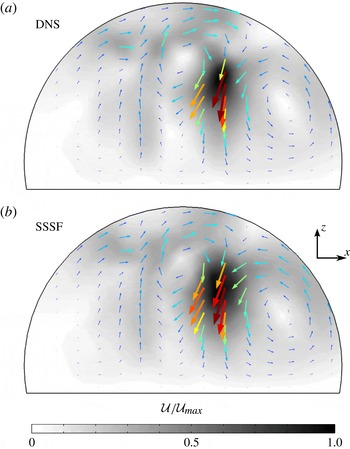
Meridian cross-section of the hydrodynamic flow pattern in a water droplet excited by a 6 MHz acoustic field. (a) DNS on a fine grid (311 000 elements). (b) Simulation with the SSSF method on a much coarser grid (11 090 elements). The velocity magnitude is indicated in grey scale, darker greys represent larger velocities. The flow patterns agree qualitatively well despite some mismatch on the velocity magnitude (
 ${\mathcal{U}}_{max}=30~\text{mm}~\text{s}^{-1}$
for DNS versus
 $19~\text{mm}~\text{s}^{-1}$
for SSSF). This discrepancy is discussed later in the text. Droplet contact angle
 $\unicode[STIX]{x1D703}_{c}$
is
 $100^{\circ }$
, and its base radius is 0.98 mm (
 $\unicode[STIX]{x1D6FC}D=0.27$
,
 $\unicode[STIX]{x1D6EC}=0.004$
).

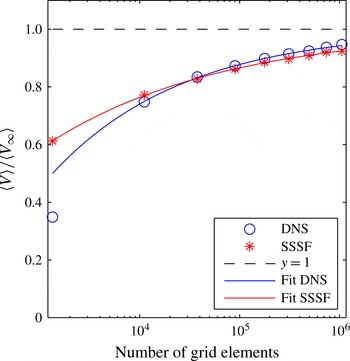
In figure 10, we display the flow fields computed by DNS and SSSF in the meridian plane of the droplet. The flow patterns are very similar, despite the large difference of memory requirements (2 GB for the SSSF, 10 GB for the DNS). This illustrates the ability of SSSF to show a convergent behaviour even for very rough grids. In order to be more quantitative, we computed the average flow speed in the droplet with DNS and SSSF for 9 degrees of grid refinements (minimum element size
 $l=\unicode[STIX]{x1D706}/n$
,
 $n\in \{1\ldots 9\}$
). Results shown in figure 11 were analysed by nonlinear curve fitting. Accordingly, the DNS (SSSF) converges towards
 $\langle V_{\infty }\rangle =3.1~\text{mm}~\text{s}^{-1}$
(
 $\langle V_{\infty }\rangle =2.6~\text{mm}~\text{s}^{-1}$
) at a rate in
 $O(N^{1/3})$
(
 $O(N^{1/4})$
). (We attribute the slight difference of asymptotic value of
 $\langle V\rangle$
(approximately 17 %) between DNS and SSSF to minor differences (8 %) in the acoustic field depending on whether they were computed by DNS or circular Fourier transform decomposition as described in § 4.1.1.) Importantly, DNS starts converging only after the number of grid elements has exceeded 10 000 as testified by the outlier on the left of the graph in figure 11, whereas SSSF consistently follows its convergence trend even for a such a rough grid.
Comparison of the convergence speed of DNS and SSSF methods versus the number of grid elements. The average flow speeds
 $\langle V\rangle$
returned by the numerical simulations were normalized by an estimation of their asymptotic value
 $\langle V_{\infty }\rangle$
. Nonlinear curve fitting returns
 $\langle V_{DNS}\rangle ~(\text{mm}~\text{s}^{-1})\simeq 3.1{-}16.4N^{-0.33}$
and
 $\langle V_{SSSF}\rangle ~(\text{mm}~\text{s}^{-1})\simeq 2.6{-}5.8N^{-0.25}$
. The simulation point computed from the coarsest grid was excluded during the fitting of the DNS since it appears no asymptotic convergence regime was reached at this point.

4.3.2 Comparison with experiments
In the previous sections, we have developed and characterized a numerical algorithm to compute the acoustic streaming in large cavities compared to the wavelength. We now apply it to sessile droplets of various viscosities exposed to 20 MHz SAW radiation and compare the results to experiments presented in § 2. Results are shown in figure 12.
Streamlines from SSSF flow field computations for various glycerol concentrations. The visualization is from below. The SAW propagates from left to right. The droplet volume is
 $V_{droplet}=12.5~\unicode[STIX]{x03BC}\text{l}$
and the magnitude of the acoustic perturbation displacement
 $u_{0}=44$
pm. As the viscosity increases, one remarks the progressive transition from a four-vortex to a two-vortex flow structure. (a) Pure water (
 ${\mathcal{U}}_{max}=173~\unicode[STIX]{x03BC}\text{m}~\text{s}^{-1}$
); (b) 30 wt.% glycerol (
 ${\mathcal{U}}_{max}=170~\unicode[STIX]{x03BC}\text{m}~\text{s}^{-1}$
); (c) 40 wt.% glycerol (
 ${\mathcal{U}}_{max}=137~\unicode[STIX]{x03BC}\text{m}~\text{s}^{-1}$
); (d) 60 wt.% glycerol (
 ${\mathcal{U}}_{max}=61~\unicode[STIX]{x03BC}\text{m}~\text{s}^{-1}$
); (e) 80 wt.% glycerol (
 ${\mathcal{U}}_{max}=23~\unicode[STIX]{x03BC}\text{m}~\text{s}^{-1}$
); (f) 90 wt.% glycerol (
 ${\mathcal{U}}_{max}=3.8~\unicode[STIX]{x03BC}\text{m}~\text{s}^{-1}$
).

Similarly to figure 2, the droplet flow pattern progressively switches from four eddies to two eddies. The agreement is not only qualitative but also quantitative as shown in figure 13 where we plot the average flow speed in the droplet versus the liquid viscosity. In this curve, the adjustable parameter was the solid displacement magnitude. Linear regression gives 44 pm which compares well to the 62 pm measured with a Doppler-shift interferometer (SH130, B.M. Industries). In order to segregate viscosity as the dominant factor for the change of velocity, we compare the experiment to two scenarios. In the first one, we implement all real values of physical quantities in the numerical model for the different water–glycerol mixtures (table 1) whereas the second one keeps the physical properties of water for all quantities (contact angle, density, sound speed) except for the viscosity which is set to the real water–glycerol system, yielding to idealized comparative situations where only the viscosity varies. The excellent agreement between the experiment and the realistic simulation validates our numerical model. More importantly, the good agreement between the idealized model and the experiments evidence unambiguously the strong dependence of Eckart acoustic streaming on the fluid viscosity.
Averaged velocity of the droplet internal flow versus viscosity. The stars correspond to numerical simulations performed with water–glycerol physical properties summarized in table 1, the circles to experimental data, the squares to numerical simulations performed by varying only the viscosity of the water–glycerol mixture and keeping all other parameters equal to those of water, and the dashed line to the best fit with a power law (
 $\langle V\rangle \propto \unicode[STIX]{x1D708}^{-3/4}$
). The only fitting parameter is the SAW amplitude, which is estimated to be 44 pm according to the simulations compared to 62 pm given by our measurements with the laser interferometer.

5 Flow topology and caustics
In the previous sections, we have presented the Eckart bulk streaming as the main contribution to the total flow observed in sessile droplets exposed to SAW radiation. We have developed a numerical model based on first principles to compute the acoustic streaming in three dimensions, and the results agree remarkably well with experimental data. In both cases, the flow pattern in the droplet shows a gradual transition from four to two eddies which has not been reported nor explained so far in the literature. In this section, we discuss these results based on our numerical model. Indeed, it unveils the acoustic field which generates the forcing term of the flow. This allows a qualitative and quantitative analysis of the flow development and enables us to single out the most influential parameters, which are the caustics and the surface wave attenuation.
5.1 Acoustic forcing term and flow pattern
The acoustic forcing term, given by (3.32) is proportional to the Poynting vector. This means that the knowledge of the acoustic power flow is tantamount to the knowledge of the forcing term. The Poynting vector in water and glycerol droplet is shown in figures 6 and 7. As stated in § 4.1.2, it is focused on small regions of the droplets corresponding to the caustics, illustrated in figure 9. As we compare the resulting flow pattern in figure 12 to the forcing term shown in figures 6 and 7, we notice that these caustics act as momentum source points to generate the flow. For instance, in the glycerol droplet, the forcing terms act on only one side of the droplet and push the flow towards the rear of the droplet. In the case of water, the momentum source terms are more symmetrical and push the fluid in the two opposite directions. Each individual momentum source term results in two eddies, forming the four-swirl pattern. This is particularly visible in figure 3.
Interestingly, these caustics can be easily constructed from geometrical acoustics. This means that the flow can be, at least qualitatively, predicted from simple geometrical arguments. This assertion must be mitigated by the important role played by the viscosity and the attenuation of sound in the system.
5.2 The four-to-two eddies transition
Since the flow pattern heavily relies on the formation of caustics, it is strongly influenced by the ratio between the droplet diameter and the acoustic wave attenuation length in the fluid:
 $$\begin{eqnarray}\unicode[STIX]{x1D6EC}=\frac{D}{L_{a}}=\frac{D\unicode[STIX]{x1D714}^{2}\unicode[STIX]{x1D708}b}{c_{0}^{3}}.\end{eqnarray}$$
For water sessile droplets with a 3.7 mm diameter,
 $\unicode[STIX]{x1D6EC}\simeq 0.07$
whereas for 90 % glycerol droplets
 $\unicode[STIX]{x1D6EC}\simeq 2.80$
. According to the numerical and experimental results, the progressive transition from two to four eddies is located within
 $0.29<\unicode[STIX]{x1D6EC}<1.0$
. In this regard, we understand why a transition of flow pattern happens for this range of viscosity. In glycerol droplets, the sound wave experiences very few reflections before fading whereas in water it should bounce at least sixteen times at the droplet interface. Hence, three regimes naturally emerge:
 $\unicode[STIX]{x1D6EC}\ll 1$
,
 $\unicode[STIX]{x1D6EC}\simeq 1$
and
 $\unicode[STIX]{x1D6EC}\gg 1$
. In the first one, the stable nature of the surface caustics favours the four eddies flow pattern as observed in water droplets. The intermediate regime happens for large glycerol concentrations. In this case, both surface and volume caustics are present as attested by figure 7(b). Thus, the flow in very viscous droplets is dominated by both the volume and surface caustics. Due to the large attenuation level, the surface caustic does not complete an orbit and the forcing is limited to only one side of the droplet, resulting in the two eddies flow pattern. Decreasing further
 $\unicode[STIX]{x1D6EC}$
was achieved previously by Beyssen et al. (Reference Beyssen, Le Brizoual, Elmazria, Alnot, Perry and Maillet2006) who worked at 40 MHz frequency with 90 wt.% glycerol mixtures. At such extreme regime, even the volume caustic vanishes and the flow pattern turns into a single vortex with a horizontal vorticity axis.
6 Dimensional analysis
The previous analysis can be transposed to other frequencies and viscosities by using the Buckingham
 $\unicode[STIX]{x03C0}$
-theorem. At moderate actuation power (low hydrodynamic Reynolds number), equation (3.31) yields the following scaling for the velocity:
 $$\begin{eqnarray}\langle V\rangle =f_{1}\frac{{\mathcal{F}}D^{2}}{\unicode[STIX]{x1D707}},\end{eqnarray}$$
with
 $\unicode[STIX]{x1D703}_{c}$
the contact angle,
 ${\mathcal{F}}$
the magnitude of the force,
 $D$
the droplet diameter and
 $f_{1}$
a function of dimensionless parameters. At low Reynolds number, the prefactor
 $f_{1}$
depends solely on the droplet geometry, which here can be mainly quantified by the contact angle
 $\unicode[STIX]{x1D703}_{c}$
only:
 $f_{1}=f_{1}(\unicode[STIX]{x1D703}_{c})$
. The force magnitude
 ${\mathcal{F}}$
depends on the acoustic field with input parameters
 $\tilde{p}$
and
 $\tilde{v}$
, whose magnitudes are proportional to
 $u_{0}$
(the magnitude of the acoustic perturbation displacement) by linearity and whose topologies are determined by the shape of the droplet (
 $\unicode[STIX]{x1D703}_{c}$
), the dimensionless wavenumber
 $kD$
, the wave radiation angle
 $\unicode[STIX]{x1D703}_{R}$
from the substrate to the liquid given by the Snell–Descartes law
 $\sin (\unicode[STIX]{x1D703}_{R})=c_{l}/c_{s}$
, the characteristic parameter of the wave attenuation in the bulk
 $\unicode[STIX]{x1D6EC}$
and the characteristic parameter for the surface wave attenuation due to its absorption by the liquid
 $D\unicode[STIX]{x1D6FC}$
, with
 $\unicode[STIX]{x1D6FC}$
the attenuation rate introduced in paragraph 4.1.1. In practice,
 $\unicode[STIX]{x1D703}_{c}$
is often chosen near
 $90^{\circ }$
and
 $kD\ll 1$
to optimize streaming efficiency. Consequently, the wave propagation mainly depends on
 $\unicode[STIX]{x1D6EC}$
,
 $\unicode[STIX]{x1D703}_{R}$
and
 $D\unicode[STIX]{x1D6FC}$
. Most liquid sound speeds range between
 $1200~\text{m}~\text{s}^{-1}$
(organic compounds) and
 $1500~\text{m}~\text{s}^{-1}$
, and SAW are mostly generated on lithium niobate with a phase velocity close to
 $3650~\text{m}~\text{s}^{-1}$
(median velocity of SAW propagating on a lithium niobate
 $X$
-cut over all the directions). This narrows considerably the range of possible Rayleigh angles (
 $19^{\circ }<\unicode[STIX]{x1D703}_{R}<24^{\circ }$
). Hence, the sound propagation in sessile droplets on lithium niobate chiefly depends on
 $\unicode[STIX]{x1D6FC}D$
and
 $\unicode[STIX]{x1D6EC}$
. The force magnitude is then given by:
 $$\begin{eqnarray}{\mathcal{F}}=f_{2}(\unicode[STIX]{x1D6EC},\unicode[STIX]{x1D6FC}D)\frac{\unicode[STIX]{x1D70C}_{0}\unicode[STIX]{x1D714}^{2}{u_{0}}^{2}\unicode[STIX]{x1D6EC}}{D}=f_{2}(\unicode[STIX]{x1D6EC},\unicode[STIX]{x1D6FC}D)\frac{\unicode[STIX]{x1D70C}_{0}\unicode[STIX]{x1D714}^{4}\unicode[STIX]{x1D708}b{u_{0}}^{2}}{c^{3}},\end{eqnarray}$$
where
 $f_{2}(\unicode[STIX]{x1D6EC},\unicode[STIX]{x1D6FC}D)$
accounts for the geometrical distribution of the acoustic field. Combining equations (6.1) and (6.2), and neglecting the influence of the contact angle for the practical reasons detailed previously, we obtain:
 $$\begin{eqnarray}\displaystyle & \langle V\rangle =V_{0}f(\unicode[STIX]{x1D6EC},\unicode[STIX]{x1D6FC}D), & \displaystyle\end{eqnarray}$$
 $$\begin{eqnarray}\displaystyle & \displaystyle \text{with }V_{0}=\frac{\unicode[STIX]{x1D714}^{4}{u_{0}}^{2}bD^{2}}{c^{3}}\text{ and }f(\unicode[STIX]{x1D6EC},\unicode[STIX]{x1D6FC}D)=f_{1}(\unicode[STIX]{x1D703}_{c}=90^{\circ })f_{2}(\unicode[STIX]{x1D6EC},\unicode[STIX]{x1D6FC}D). & \displaystyle\end{eqnarray}$$
We notice that although the viscosity has no explicit influence on the value of
 $V_{0}$
, it does appear in the expression of
 $\unicode[STIX]{x1D6EC}$
which represents the bulk attenuation of the acoustic wave in the droplet, and thus contributes to the final expression of
 $\langle V\rangle$
.
Numerical simulation of the four main types of acoustic streaming generated by a plane SAW propagating from left to right. (a)
 $\unicode[STIX]{x1D6FC}D=0.17$
,
 $\unicode[STIX]{x1D6EC}=5.0$
(▵), (b)
 $\unicode[STIX]{x1D6FC}D=6.0$
,
 $\unicode[STIX]{x1D6EC}=5.0$
(○), (c)
 $\unicode[STIX]{x1D6FC}D=0.17$
,
 $\unicode[STIX]{x1D6EC}=0.27$
(▿), (d)
 $\unicode[STIX]{x1D6FC}D=6.0$
,
 $\unicode[STIX]{x1D6EC}=0.27$
(▫). The symbols correspond to table 2. Velocity field is depicted on the left, and the forcing term is on the right. Numerical values are computed for an incident SAW of frequency
 $f=20$
MHz and amplitude 10 pm. The droplet diameter is 3.7 mm, fluid properties are those of water, except for the dynamic viscosity
 $\unicode[STIX]{x1D707}$
which was used to set
 $\unicode[STIX]{x1D6EC}$
. The other parameter
 $\unicode[STIX]{x1D6FC}D$
was set by tuning the SAW attenuation coefficient in the solid.

In order to gain a broader picture of the streaming induced by a progressive surface acoustic wave in a sessile droplet, we performed 100 simulations with
 $\unicode[STIX]{x1D6FC}D$
and
 $\unicode[STIX]{x1D6EC}$
ranging from 0.1 to 10, spanning two orders of magnitude. Depending on the value of these parameters, we observed four distinct streaming flow regimes (see the left column of figure 14). At low SAW attenuation and high bulk acoustic wave (BAW) dissipation (small droplet, viscous liquid – figure 14
a), the flow is driven by two eddies at the front of the droplet. Keeping constant the BAW dissipation but increasing the SAW attenuation (large droplet, viscous liquid – figure 14
b), the eddies migrate to the droplet rear. At low SAW attenuation and bulk dissipation (small droplet, low-viscosity liquid – figure 14
c), the flow forms a toroidal vortex which cross-section is shown in figure 14(c). Finally, for strong SAW dissipation (large droplet, low-viscosity liquid – figure 14
d), this yields a four eddies flow field. We related the transition to a switch of relative importance between the incident wave, the surface and the volume caustics (see the right column of figure 14). Two topological caustics were deduced from ray acoustics in § 4.1.2. These caustics are powered by the radiation of surface acoustic waves in the bulk. For a weak SAW attenuation and a strong BAW absorption (figure 14
a), the force is mainly exerted by the volume caustic of the acoustic field, and the surface waves radiating from the front of the droplet are attenuated before reaching the caustic, resulting in a force imbalance that creates the two eddies. Increasing the SAW attenuation, the caustics are less prevalent and the flow is solely driven by the incident SAW (figure 14
b) which is stronger close to the droplet edge. Decreasing the BAW absorption, the surface caustics overrun the volume caustic. Indeed, this focus is powered by the SAW radiating close to the droplet contact line and is therefore quite insensitive to the SAW attenuation. At very low BAW absorption like in water at the megahertz range, the waves guided along the droplet surface may bounce multiple times from the front to the back of the droplet, a phenomenon reminiscent of whispering gallery mode guided by the droplet free surface. This results in the symmetrization of the secondary focus and yields a quadripolar flow (figure 14
d). Finally, decreasing the SAW attenuation, the volume caustic dominates again, forming a toroidal flow (figure 14
c).
Under the guidance of the numerical results, we looked for a simple expression of the average velocity of the droplet inner flow. This amounts to finding the value of
 $f$
depending on the two parameters
 $\unicode[STIX]{x1D6FC}D,\unicode[STIX]{x1D6EC}$
. We assumed
 $f$
takes the form of a power law:
 $f(\unicode[STIX]{x1D6FC}D,\unicode[STIX]{x1D6EC})=k(\unicode[STIX]{x1D6FC}D)^{a}\unicode[STIX]{x1D6EC}^{d}$
with a set of coefficients (a,d) specific to each of the four flow regimes identified previously. The values of the coefficients
 $a$
and
 $d$
indicate the relative importance of the SAW attenuation and the BAW absorption respectively. These coefficients were regressed using multilinear curve fitting, with the resulting values given in table 2. These regression coefficients (table 2) yield fairly accurate average flow velocity as shown in figure 15. Interestingly, the average velocity of the flow patterns depicted in figure 14(c,d) shows little dependence on the magnitude of
 $\unicode[STIX]{x1D6EC}$
(
 $d\simeq 0.1$
) whereas the average flow velocity at higher BAW attenuation is adversely affected by
 $\unicode[STIX]{x1D6EC}$
and thus by the viscosity. This is in good agreement with Eckart’s and Nyborg’s view on acoustic streaming. In the former, the wave is assumed to be weakly attenuated over the reservoir extent so the flow velocity is independent of the viscosity. In the latter, the BAW is strongly attenuated within the reservoir length, so the wave momentum is integrally transferred to the fluid. This bounded amount of momentum is in turn dissipated by viscous shear such that increasing viscosity yields lower average velocity with a nearly linear relationship for small droplets.

Regression coefficients for the average streaming velocity in (6.4):
 $f(\unicode[STIX]{x1D6EC},\unicode[STIX]{x1D6FC}D)=k(\unicode[STIX]{x1D6FC}D)^{a}\unicode[STIX]{x1D6EC}^{d}$
.


We also provide a comparison with experimental data in table 3. These correlations are not limited to 20 MHz. For instance, in the 6 MHz simulation of § 4.2,
 $\unicode[STIX]{x1D6FC}D=0.27$
,
 $\unicode[STIX]{x1D6EC}=0.004$
and
 $V_{0}=1.0~\text{m}~\text{s}^{-1}$
, yielding
 $\langle V\rangle =2.6~\text{mm}~\text{s}^{-1}$
compared to 2.86 and
 $1.92~\text{mm}~\text{s}^{-1}$
obtained numerically depending on the model. This indicates that full similitude requirements (especially the non-dimensional acoustic wavelength
 $kD$
) are not mandatory to obtain quantitative results of acoustic streaming. Instead, our analysis provides some guidelines for the study of more complex acoustic fields: the most relevant parameters for a partial similitude computation of sessile droplet streaming are the BAW and SAW attenuation
 $\unicode[STIX]{x1D6EC}$
and
 $\unicode[STIX]{x1D6FC}D$
. Consequently, high frequency acoustic SAW induced streaming can be conveniently simulated at a few megahertz with a direct numerical simulation method, and then extrapolated to other cases with identical
 $\unicode[STIX]{x1D6FC}D$
and
 $\unicode[STIX]{x1D6EC}$
while at higher frequencies or droplet sizes.
7 Conclusion
In this paper, we investigated thoroughly the phenomenon of bulk (Eckart) acoustic streaming in hemispherical cavities much larger than the acoustic wavelength. This study is especially relevant for the MHz actuation of sessile drops with SAW, which served as case study and experimental check.
The main issues addressed by this study are the measurement of the acoustic and hydrodynamic fields in the drop and the simulation of systems with large characteristic size compared to the wavelength, which may lead to prohibitive memory requirements. In this paper, we presented a numerical method that reduces considerably the computational cost and thus enables such complex simulations on a desktop computer. From a physical perspective, we have shown that contrarily to a widespread belief, the viscosity plays a major role on the acoustic streaming in cavities. This effect is demonstrated both numerically and experimentally in sessile droplets excited by surface acoustic waves. Our numerical scheme not only faithfully reproduces the experimental hydrodynamic flow pattern and average droplet flow velocity, but also offers an accurate and up to now unreported view of the acoustic field in the drop, which in turn unveils the spatial distribution of the forcing term. It turns out that the streaming force is mainly concentrated in some caustics whose position can be obtained easily from geometrical acoustics. This guidance helps to predict qualitatively the flow pattern in large objects from geometrical acoustics. On a more applied perspective, we reduced the computation of acoustic streaming in sessile droplets to two non-dimensional parameters. This allows to study high frequency SAW droplet actuation (not restricted to plane waves) based on a partial similitude approach, simply by extrapolating the quantitative flow pattern obtained at lower SAW frequency simulations. Such an approach allows using direct numerical simulation strategies for convenient code development while keeping reasonable memory requirements.
A natural continuation to this work would include the boundary layer streaming in the simulations in order to model droplets commensurate with the acoustic wavelength. The resulting flow pattern is difficult to guess because the solenoidal flow in the boundary layer is due to the difference of speed between the solid and the bulk wave. On the one hand, the displacement of the solid is damped due to the leaky nature of the surface wave, which therefore should generate patterns similar to what is shown in Vanneste & Bühler (Reference Vanneste and Bühler2011). But on the other hand, we observed that even for large (water) droplets the incident wave field was negligible due to the multiple reflections of the wave. Therefore, the bulk wave may be a dominant and non-trivial factor to determine the streaming flow. Another prospect is to implement a fast ray–acoustic model and use the tremendous progress recently accomplished in the field of caustics to get explicitly the force terms acting on the fluid. This would preserve much time to perform ambitious simulations with moving boundaries as observed in experiments involving high acoustic power, including droplet deformation, displacement, mixing, heating and atomization.
Acknowledgements
We gratefully acknowledge T. Diarra for his important contribution in writing the azimuthal Fourier transform algorithm essential to this simulation. We also thanks B. Bonello for his support in providing the workstation to perform the simulations. This work is supported by ANR Project No. ANR-12-BS09-0021-01, ANR-12-BS09-0021-02, and Région Nord Pas de Calais.
Supplementary material
Supplementary material is available at https://doi.org/10.1017/jfm.2017.178.
Appendix A. Reconstruction of the acoustic velocity field
The 3-D acoustic field quantities
 $x$
are reconstructed from the individual axisymmetric projections
 $x_{l}$
as follows:
 $$\begin{eqnarray}\displaystyle & \displaystyle \tilde{v}_{r}(r,\unicode[STIX]{x1D703},z)=\frac{-1}{\unicode[STIX]{x1D70C}_{0}\text{i}\unicode[STIX]{x1D714}}\unicode[STIX]{x2202}_{r}\tilde{p}=\mathop{\sum }_{-\infty }^{+\infty }\tilde{v}_{r,l}\text{e}^{\text{i}l\unicode[STIX]{x1D703}}, & \displaystyle\end{eqnarray}$$
 $$\begin{eqnarray}\displaystyle & \displaystyle \tilde{v}_{\unicode[STIX]{x1D703}}(r,\unicode[STIX]{x1D703},z)=\frac{-1}{\unicode[STIX]{x1D70C}_{0}\text{i}r\unicode[STIX]{x1D714}}\unicode[STIX]{x2202}_{\unicode[STIX]{x1D703}}\tilde{p}=\mathop{\sum }_{-\infty }^{+\infty }\tilde{v}_{\unicode[STIX]{x1D703},l}\text{e}^{\text{i}l\unicode[STIX]{x1D703}}, & \displaystyle\end{eqnarray}$$
 $$\begin{eqnarray}\displaystyle & \displaystyle \tilde{v}_{z}(r,\unicode[STIX]{x1D703},z)=\frac{-1}{\unicode[STIX]{x1D70C}_{0}\text{i}\unicode[STIX]{x1D714}}\unicode[STIX]{x2202}_{z}\tilde{p}=\mathop{\sum }_{-\infty }^{+\infty }\tilde{v}_{z,l}\text{e}^{\text{i}l\unicode[STIX]{x1D703}}, & \displaystyle\end{eqnarray}$$
with:
 $$\begin{eqnarray}\displaystyle & \displaystyle \tilde{v}_{r,l}=\frac{-1}{\unicode[STIX]{x1D70C}_{0}\text{i}\unicode[STIX]{x1D714}}\unicode[STIX]{x2202}_{r}\tilde{p}_{l}, & \displaystyle\end{eqnarray}$$
 $$\begin{eqnarray}\displaystyle & \displaystyle \tilde{v}_{\unicode[STIX]{x1D703},l}=\frac{-l}{\unicode[STIX]{x1D70C}_{0}\unicode[STIX]{x1D714}}\tilde{p}_{l}, & \displaystyle\end{eqnarray}$$
 $$\begin{eqnarray}\displaystyle & \displaystyle \tilde{v}_{z,l}=\frac{-1}{\unicode[STIX]{x1D70C}_{0}\text{i}\unicode[STIX]{x1D714}}\unicode[STIX]{x2202}_{z}\tilde{p}_{l}. & \displaystyle\end{eqnarray}$$
If the incident field is symmetric about the
 $x$
–
 $z$
plane, we have:
 $$\begin{eqnarray}f(r,\unicode[STIX]{x1D703},z)=f_{0}+2\mathop{\sum }_{1}^{+\infty }f_{l}\cos (l\unicode[STIX]{x1D703}),\end{eqnarray}$$
where
 $f$
stands for either
 $\tilde{p}$
,
 $\tilde{v}_{r}$
or
 $\tilde{v}_{z}$
;
 $\tilde{v}_{\unicode[STIX]{x1D703},l}$
is odd due to the factor
 $l$
:
 $$\begin{eqnarray}\tilde{v}_{\unicode[STIX]{x1D703}}(r,\unicode[STIX]{x1D703},z)=2\text{i}\mathop{\sum }_{1}^{+\infty }\tilde{v}_{\unicode[STIX]{x1D703},l}\sin (l\unicode[STIX]{x1D703}).\end{eqnarray}$$