Implication
The issue of global warming is closely linked with the consumption of fossil energy. This study quantifies the impact of three possible adjustments in sheep breeding, showing significant potential for reduced use of non-renewable energy. The conclusions can be extended to other farming systems with the principle to associate livestock and crops in coming back on the basis of agronomy (rotations) that can limit the use of inputs, including nitrogen fertilization (that represents a major energy cost). Such adaptations could be decisive from an economic point of view in the medium-term (scarcity and increasing cost of oil).
Introduction
Most assessments of livestock farming systems now go beyond techno-economic results to encompass environmental impact, including energy indicators (Pervanchon et al., Reference Pervanchon, Bockstaller and Girardin2002; Halberg et al., Reference Halberg, Van der Werf, Basset-Mens, Dalgaard and de Boer2005) which are integrated into most of the tools used to assess production system sustainability (Van der Werf and Petit, Reference Van der Werf and Petit2002). Non-renewable energy use is a core factor in central agricultural activities and accounts for nearly 5% of total energy use worldwide (Stout, Reference Stout1990). Furthermore, consumption of non-renewable energy is a major driver of global warming (Tzilivakis et al., Reference Tzilivakis, Warner, May, Lewis and Jaggard2005). This issue is becoming increasingly important as fossil fuel resources become increasingly scarce, and the growing needs of our societies combined with competing uses has led to a sharp increase in fossil fuel prices. In July, 2008, the price of a barrel of oil was almost five times higher than in the 90s (US Energy Information Administration 2009). Not only does this increase result in lower business profitability, but the significant volatility in oil prices leaves businesses exposed to more risk, not only through their direct purchases of energy (fuel oil) but through purchases of inputs with a significant indirect energy content (as artificial nitrogen). Thus those farms, which were able to adjust to less direct or indirect dependency on fossil fuels would increase their competitiveness in the long run.
Energy efficiency calculated at farm level (EEf) makes it possible to assess the farm’s ability to deliver the maximum energy in the form of agricultural products, with minimum recourse to non-renewable sources of energy. The EEf of cropping systems is largely dependent on the use of nitrogen fertiliser and on fuel consumption (Deike et al., Reference Deike, Pallutt and Christen2008), while the EEf of mixed sheep-plus-crop systems is mainly linked to purchases of animal feed, fertilizers and fuel (Bochu et al., Reference Bochu, Couturier, Pointereau, Charru and Chantre2005; Boisdon and Benoit, Reference Boisdon and Benoit2006). The EEf is negatively correlated to non-renewable energy consumption per unit produced (meat, milk, etc.) (Boisdon and Benoit, Reference Boisdon and Benoit2006), which is the second criterion other authors on this topic have used for sheep-for-meat production (Bellet et al., Reference Bellet, Augas, Clenet, Fichet, Gouedard, Ingremeau, Migne, Pagnot and Bahier2008) or dairy production (Galan et al., Reference Galan, Dolle, Charroin, Ferrand and Hiet2007).
Despite a general fall-off over the last 20 years, sheep-for-meat production holds an important place in France (4.7 million ewes in 2007) as in Europe (70.8 million ewes in EU-27) (Institut de l’Elevage, 2008). French sheep meat production covers only 44% of the French consumption needs, but sheep farms play a role in maintaining low agronomic potential land in economically disadvantaged areas. Sheep breeding is therefore of great importance in France, not only from an economic and social standpoint but also for the maintenance of opened landscape and biodiversity. However, its environmental impact must be specified and improved, particularly in terms of non-renewable energy use.
We studied initiatives to improve energy efficiency on sheep farms in plainland areas (medium agronomic potentiality with wheat yields between 4.5 and 6.5 t/ha), as the possibility to produce cereals offers a broader range of potential farming system adaptations. This work, which was based on both field observations and on simulations at farming system level (Schils et al., Reference Schils, Verhagen, Aarts and Sebeket2005; Matthews et al., Reference Matthews, Wright, Buchan, Davies and Schwarz2006), aimed to highlight the main factors of EEf. It is essential to distinguish EEf and at sheep unit level (EEs), as the efficiency of cash crop unit (EEcc) is much higher than EEs and is a major contributor to EEf (Bochu, Reference Bochu2007). After studying variability in EEf and EEs levels according to farm typology, we took the most representative farm-type system as a basis for assessing potential EEs improvements. To this end, we used a constant total farm area context to simulate three successive adjustments of the production system, i.e. (i) animal feed patterns, (ii) nitrogen fertilization and (iii) production of agro-fuels (rapeseed), and studied the resulting economic impact. Finally, we ran a sensitivity study to assess the impact of four other factors involving a change in flock functioning and/or farm structure.
Material and methods
Farms references
This work was based primarily on a long-term study of a variety of production systems located in lowland areas in the Centre-West of France (Benoit and Laignel, Reference Benoit and Laignel2007). Specifically, this study was based on a 2004 survey (20 farms) conducted to identify the main production systems in the area (Benoit and Laignel, Reference Benoit and Laignel2004). Among the five farm types identified (‘graze’ n = 3, ‘extensive’ n = 2, ‘sheep and cash crop (CCrop)’ n = 2, ‘mixed sheep-crop with good fodder self-sufficiency’ n = 5, ‘mixed sheep-crop with lower fodder self-sufficiency’ n = 8), the first four, which are the most contrasting types, are studied here; the fifth type offered no new factors and was excluded from our analysis in order to streamline our investigation. Farm typology was built from a multivariate analysis using 14 variables covering farm structure definition and performances, including agricultural area, size of crop area, labour force, stocking rate, structural costs, gross margin per ewe, concentrates used per ewe, lambing season and fertilization. We used the individual data on the 20 farms (surveyed since 1988) to identify the minimum and maximum levels for the variables used in the sensitivity study (annual average carcass weight of the lambs, and ewe productivity).
Main criteria used for the energy analysis
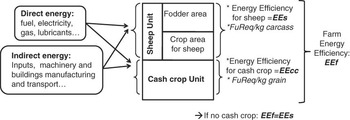
Energy analysis was based on two main criteria. Energy efficiency, that is the first, is defined as the ratio between the gross output in energy in the form of agricultural products and the total needs in non-renewable energy, whether direct (fuel and electricity) or indirect (linked to the manufacture of inputs), based on the lifecycle approach (Society of Environmental Toxicology and Chemistry (SETAC), 1993; Haas et al., Reference Haas, Wetterich and Geier2000) (Figure 1). As the energy efficiency of the farm (EEf) depends primarily on the proportion of cash crops in total farm activity (Table 1), we calculated energy efficiency by production unit: energy efficiency of the sheep unit (EEs) and energy efficiency of the cash crop unit (EEcc).
Schematic diagram showing the types of energies taken into account (direct or indirect) and the different calculations of the energy efficiencies and energy consumption.

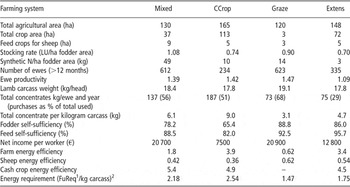
Main characteristics of the four farming systems

CCrop = cash crop.
1FuReq = equivalent fuel litres requirements.
2To be multiplied by 0.45 to get an approximation of this criteria per kilogram liveweight.
The second criterion focuses on the amount of non-renewable energy required (in Fureq) to produce one kilogram of feed (one kilogram carcass for us), as recommended by Halberg et al. (Reference Halberg, Van der Werf, Basset-Mens, Dalgaard and de Boer2005). This type of criteria has been used in the largest French study on on-farm energy use (Bochu, Reference Bochu2007) and in other studies focusing on either sheep-for-meat production (Bellet et al., Reference Bellet, Augas, Clenet, Fichet, Gouedard, Ingremeau, Migne, Pagnot and Bahier2008) or dairy production (Galan et al., Reference Galan, Dolle, Charroin, Ferrand and Hiet2007).
These two criteria are negatively correlated; the first one (EEs) highlights the ability of the system (sheep unit) to efficiently use renewable energy (solar); the second (FuReq/kg of product) takes into account the farm’s targets in terms of food production, and is more consumer-oriented.
We did not use net energy produced per hectare as a criterion since it would have been difficult to cross-compare the various studies on this criterion, which is largely dependent on agronomic potential (and stocking rate) in each individual situation. For example, the stocking rate in France ranges from 0.1 to 2.5 livestock unit (LU) per hectare depending on the region. Van der Werf et al. (Reference Van der Werf, Tzilivakis, Lewis and Basset-Mens2007) and Payraudeau and Van der Werf (Reference Payraudeau and Van der Werf2005) considered that there is complementarity between the two criteria (net energy per unit produced and net energy per hectare). Net energy per hectare is preferred in studies dealing with land use and focuses on the least productive systems, whereas net energy per unit produced focuses on the production function of agricultural activity. Net energy used per unit is considered the most appropriate criterion for global impacts such as energy (Haas et al., Reference Haas, Wetterich and Geier2000) or if the function of the system is the production of commodities (Guinée et al., Reference Guinée, Gorrée, Heijungs, Huppes, Kleijn, de Koning, van Oers, Wegener Sleeswijk, Suh, Udo de Haes, de Bruijn, van Duin and Huijbregts2002), as it is the case here (meat production).
This study deals with energy issues but not greenhouse gas emissions or soil carbon balance.
Other criteria used
Feed self-sufficiency was calculated as follows: [(energy requirements of the flock, i.e. ERF) – (energy of the feed purchased)]/ERF. The same kind ratio is calculated for fodder self-sufficiency: [ERF – (energy of the feed purchased and of concentrates produced on-farm)]/ERF. Energy of the feed purchased and ERF were estimated according to the Institut National de la Recherche Agronomique (INRA, 1989). The stocking rate calculation takes into account both ewes (1 ewe = 0.14 LU) and the other animals according to time spent on the farm (i.e. one lamb fattened on grass, aged 60 to 180 days, is 0.06 LU for 365 days spent on-farm). Ewe productivity is defined as the number of lambs (including ewe lambs) produced per ewe per year. Concentrate consumption per ewe is calculated for a 1-year period (kilogram per ewe and year) and includes on-farm cereals for the flock and concentrates for the lambs. Further details of the method used to calculate the technical and economic data are given in Benoit and Laignel (Reference Benoit and Laignel2006).
Presentation of the models used
Farm functions and performances were reconstructed using the OSTRAL simulation tool that is a deterministic and static model. It consists in a first module governing flock management (Benoit, Reference Benoit1998). This module is used to reconstruct the management of batches of animals during a 12-month campaign with up to three lambing seasons, with the possible between-batch transfer of females (especially empty ewes or ewes in ‘accelerated’ reproduction), including ewe culling schedules (number of animals and release dates) and the management of replacement ewes. This module gives the calendars of the flock events, making it possible to calculate the gross product of the flock and the corresponding inputs (particularly season-by-season concentrates needs). Other modules are integrated to (i) define the management of fodder areas and crops, their management (level of fertilization, type of equipment used and duration of use) and their production levels; (ii) calculate gross margin for each production unit (sheep unit and crop unit); (iii) calculate economic results at farm scale (net income, structural costs, capital structure, etc.). The model takes into account the required management strategy for crops and harvests, which along with the types of equipment required are defined according to the size of the areas concerned and the volumes produced.
The further integration of PLANETE software (Bochu, Reference Bochu2002) makes it possible to calculate energy balance and calculate energy efficiency. We used OSTRAL output data as input data for PLANETE (e.g. quantities of inputs such as fertilizers, concentrates or fuel or the use of equipment with the number of hours of tractor use). As OSTRAL separates out the production units, we can distinguish energy inputs (direct or indirect) for the two production units (sheep and cash crops; see Figure 1) considered in OSTRAL.
The PLANETE methodology is based on a lifecycle assessment approach (SETAC, 1993; Haas et al., Reference Haas, Wetterich and Geier2000) defined by the ISO 14040:1997 series (International Organization for Standardization (ISO), 1997). The boundary of the system is at the farm gate, and the calculation is made for a 1-year period (mirroring the economic results in OSTRAL). The energy flows calculated take into account inputs used in terms of both direct energy (fuel, electricity and oil) and indirect energy related to the manufacture and transport of the inputs (including equipment and buildings). To illustrate, the model uses the following energy contents: 1 l of fuel = 40.7 MJ (primary energy + energy to make it available); 1 kg nitrogen (urea) = 64.7 MJ; 1 kg cereal = 2.4 MJ; 1 kg soya cake = 5.8 MJ; 1 kg herbicide = from 260 to 414 MJ/kg. For a given equipment, the total energy used to make it is depreciated (from an energy point of view) according to a specific amortization method. For example, an 88 kW tractor (weight 5300 kg) will initially be assessed at 487 070 MJ (manufacturing), and with a life utilization of 8400 hours, the energy cost for 1 h of use will be 58 MJ. The energy value of a 5-plate plough (1350 kg) will be assessed at 133 920 MJ with a yearly average use of 120 ha and a 12-year utilization period; thus 1ha ploughed will be assessed at 93 MJ (without tractor use). These figures include the energy costs involved in equipment maintenance. The calculation principle is the same for the buildings (with a 25-year amortization period). The energy cost is finally expressed in fuel requirements (FuReq) at the rate 1 FuReq = 35.8 MJ. The PLANETE methodology does not take in account impact on indirect land use (for concentrate purchase for example).
Use of the model
In the first simulation step, the management system and the technical and economic results (based on the 2006 economic outlook) of the four farm group types were reconstructed (OSTRAL) a posteriori (with PLANETE) as energy consumptions and energy efficiencies, with the same standardized method of equipment and buildings choices for all four types. These assessments had been validated through surveys conducted in 2002 and 2003 in the 20 farms (Benoit and Laignel, Reference Benoit and Laignel2004).
In the second step, the simulations were based on the Mixed system considered as the most representative farm type of the area. It is a 130 ha farm including 37 ha of crops (of which 28 ha for cash crops) and 3 ha fallow land. The flock counted 610 ewes, with 40% of lambing taking place in late autumn. Fertilization is 49-23-33 (N-P-K) kilogram per hectare of fodder area, 160-60-100 for wheat, 120-60-70 for triticale, 60-50-70 for mixed triticale-peas, 150-80-100 for rapeseed, and 50-50-80 for sunflower. The adaptations studied did not alter flock management patterns, and ewe productivity together with the type of lambs fattened, mostly in sheepfold, was maintained. On the basis of previous surveys (Boisdon and Benoit, Reference Boisdon and Benoit2006), and with the aim of improving EEs, we studied three successive adaptations: (i) switching from cash crops (wheat, sunflower) to feed crops (triticale, protein mixtures) with the aim of achieving full feed self-sufficiency (FeedSS); (ii) obtaining full nitrogen fertilisation self-sufficiency (NitrSS), where the rotation was based on 2 years of violet clover cultivation followed by 4 years of crops (Triboï and Triboï-Blondel, Reference Triboï and Triboï-Blondel2004), with systematic integration of legumes in the forage area; (iii) factoring in the production of agro-fuel, with two levels of production, i.e. at 30% (Fu30) and at 100% (Fu100) of fuel needs for the farm tractors and combine harvester (calculated by the model), with the flock using rapeseed cake as a substitute for grain and protein-rich plants. When replacing artificial nitrogen fertilisation by legumes in the rotation, we maintained P and K fertilization, reduced triticale and triticale-pea yields by 10%, and reduced rapeseed yield by 13%.
In the third simulation stage, we studied the impact of four other factors (always with the Mixed system as baseline). With the two first factors studied (flock size and farm structure, i.e. average distance between plots and farm centre), we attempted to highlight a potential farm size-related economy of scale in energy costs. The assumption for the two other factors (ewe productivity and lamb weight) is that the main share of the farm’s energy needs stems from breeding ewes, and thus a high level of meat production per ewe (through high ewe productivity and carcass weight) could lower the amount of energy required per kilo of meat produced.
Results
Diversity of the systems studied: general features and energy efficiency
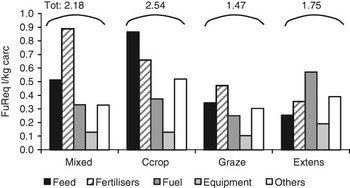
The results (Table 1) show that the EEf of the farms is a function of relative shares of animal and cash crop production within the farming systems, with higher EEf as cash crop is more important. This is a reflection of animal production being less efficient in terms of resource use than crop production. Thus, CCrop (sheep and cash-crop production system), with a low EEs (0.36), achieved the highest EEf, at 3.9, thanks to cash crops (EEcc: 4.9). Graze system posted the best EEs (0.62, i.e. 48% higher than Mixed) due to good levels of meat production (ewe productivity and high lamb weights) combined with a very high fodder self-sufficiency. Consequently, in this system, the total non-renewable energy used for the sheep unit only reached 1.47 FuReq/kg of carcass produced (33% less than Mixed). This lower non-renewable energy need (Figure 2) is mainly linked to lower purchases of fertilizers (representing 0.47 FuReq/kg carc or −48% compared with the Mixed system), feed (0.35 FuReq/kg carc, or −31% compared with Mixed) and fuel (0.25 FuReq/kg carc, or −24% compared with Mixed). The Graze system generated the highest income levels, comparable to the Mixed system. It should however be noted that this farming system is based on summer and autumn lamb production, which could not be practicably generalized given the needs of the sheep industry, where the lamb off-season is preferentially covered by Mixed or CCrop systems.
Energy consumption by item (Feed, Fertilisers, Fuel, Equipment and Others) and total energy use, presented as equivalent fuel requirements (FuReq) in litres per kg carcass produced, for the four modelled farming systems.

The use of inputs, in particular feed purchases, is kept low for the Extens system, with a high feed self-sufficiency. However, this system also had the lowest level of ewe productivity. Thus, the meat produced per ewe and the output energy in the form of meat are both low. Finally, the FuReq of fuel or fertiliser per kilogram carcass is higher than for Graze and the total non-renewable energy needs per kilo carcass produced is 1.75 v. 1.47 for Graze, and the EEs is lower.
For all four systems, feed and fertiliser purchases are the two most significant items of energy use, followed by fuel (higher under Extens) (Figure 2). Feed and fertiliser purchases represent an average 0.5 and 0.6 FuReq/kg carcass produced, and fuel 0.4 FuReq. The equipment item lags far behind, at 0.14 FuReq. Feeding, fertilizers and fuel together represent on average 76% of total energy use (from 74% to 80% according to system).
Impacts of three successive and cumulative adjustments on the Mixed system
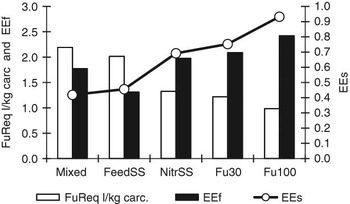
Initially (Mixed, Figure 3), the EEs was 0.42. Obtaining 100% feed self-sufficiency (Case FeedSS) generates a 10% gain in EEs (0.46). The improvement is far stronger when legumes were introduced to replace nitrogen purchases (Case NitrSS), which drives EEs up to 0.69. Producing 30% to 100% of fuel needs (Cases Fu30 and Fu100) raised EEs up to 0.75 and 0.93. Meanwhile, in global terms, non-renewable energy needs expressed in FuReq decreased from 2.18 to 0.98 per kilogram carcass produced, with a major impact of nitrogen fertiliser removal (nearly 0.7 FuReq/kg carc.). It should be noted that the energy efficiency of the farm (EEf) declined between Mixed and FeedSS as the improvement in flock feed self-sufficiency was realized to the detriment of cash crops which present a much higher EEcc (between 5.0 and 6.0).
For the baseline system (Mixed) and four cumulative adaptations: equivalent fuel requirements in l/kg carcass produced (FuReql/kg carc) and levels of energy efficiencies (EEf: farm; EEs: for sheep unit).

In the 2006 economic climate (wheat at €100/T, rapeseed €200/T, sheep at €5.27/kg carc, fuel at €0.55/l), there was no incompatibility between improving EEs and economic performance: income was primarily improved by better feed sufficiency (+12%) (FeedSS) and nitrogen self-sufficiency (+14%) (NitrSS). Fuel self-sufficiency (Fu30 and Fu100), in the 2006 setting, generated only a small gain in net income (+1% and +2%).
Other factors affecting energy efficiency
Average distance between plots and increase in flock size
For the Mixed system, we varied the average distance between the parcels and the farm centre from 592 m (concentration of the plots around the farm centre, circular farm layout) to 11 800 m (remote ‘islands’; equi-distribution of plots according to usage in remote areas and near the farm centre). For the Mixed system, as the average distance rose from 592 m to 11 800 m, the EEs decreased from 0.42 to 0.37.
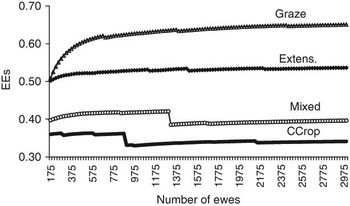
Under the Mixed system (Figure 4), an increase from 175 to 1200 ewes only led EEs to increase from 0.40 to 0.42 and a threshold effect appeared when flock size reached 1300, with a fall in EEs to 0.39.
Evolution in energy efficiency of the sheep unit (EEs) in relation to flock size (four systems).

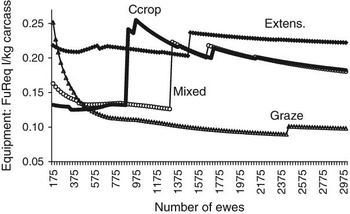
Figure 5 illustrates the changes in indirect energy driven by machinery use as a function of flock size.
Indirect energy consumption of equipment (without fuel) in relation to flock size (four systems).

Ewe productivity and lamb weight
Ewe productivity has a very positive influence on EEs, which rose from 0.29 to 0.48 when ewe productivity increased from 0.80 to 1.70 (with concomitant use of inputs), while FuReq/kg carcass dropped from 3.39 to 1.88. The same pattern repeated when lamb weight at market increased, as EEs increased from 0.38 to 0.44 when lamb weight increased from 15.3 to 20.3 kg carcass per head.
Discussion
Level of calculated energy consumption and energy efficiency
Feeding, fertilizers and fuel are the major energy inputs (76% of total energy needs), in agreement with Bellet et al. (Reference Bellet, Augas, Clenet, Fichet, Gouedard, Ingremeau, Migne, Pagnot and Bahier2008) on sheep-for-meat production. For dairy production (Galan et al., Reference Galan, Dolle, Charroin, Ferrand and Hiet2007), electricity is the fourth most important factor. The energy consumption calculated in comparison of the four farming systems (Table 1) was established at between 1.47 (minimum: Graze) and 2.54 (maximum: CCrop) FuReq/kg carcass, or between 0.66 and 1.14 FuReq/kg liveweight. This is consistent with Bochu (Reference Bochu2007), who reported national survey figures of 1.0 FuReq/kg liveweight for both sheep-for-meat (n = 18) and beef cattle (n = 37) production systems, with a variation of between 0.50 and 1.50 FuReq.
Energy efficiency and economic performance
The simulations showed a positive but relatively low correlation between farm EEs level and economic profitability. It should be stressed that these simulations were run according to the 2006 economic context, when oil was selling at $65 a barrel (Brent), whereas the price quoted in spring 2008 was $110 (+69%) and had reached $140 in July (+115%). A sharp increase in energy prices over the long-term raises the question of the impact on the prices of many other inputs. There would be some difficulties in identifying the levels of price increases for inputs regarded as indirect energy contributors, such as fertilizers, feed or equipment, due to the possible transfer of energy sources used by suppliers for their manufacture, and possibly even extending to adaptations in manufacturing processes, transport systems, etc.
On the other hand, if the mid-2008 economic context had continued, bringing sharp increases in concentrate and cereal prices, then sheep farmers would be under strong pressure to reduce flock size and grow more cash crops. In such a context, rapeseed for fuel production would be economically much more profitable, and the breeding systems most heavily based on the use of forage resources would have offer stronger economic resistance than the systems based on cereals for animal feeding. Either way, there is no doubt that the correlation between level of energy efficiency and economic profitability is expected to increase if, as expected, raw material prices increase in the future.
Highlighting the origin of the between-system differences in energy efficiency
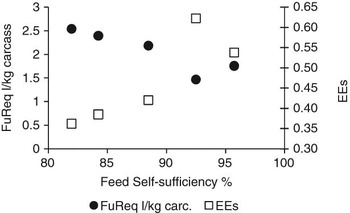
Differences in EEs between simulated cases are largely related to energy use, as illustrated by evaluating the potential gains of improving EEs through lower feed, nitrogen and fuel use. High levels of feed self-sufficiency are correlated to low energy consumption. The fourth point on Figure 6 (Graze system) shows a particularly low energy consumption per kilogram carcass and high EEs that also depends on the level of energy production (meat). Thus, the good position of the Graze system in terms of EEs (0.62) lies in its strong fodder self-sufficiency and low use of artificial nitrogen and fuel, as well as its ability to drive high per ewe meat production. Indeed, the simulation of enhanced ewe productivity (and carcass weight) showed an increase in EEs. In suckling livestock systems, the main driver of energy costs is rearing the females, particularly concentrate feed, production of forage and the corresponding fertilizer needs. Moreover, higher ewe productivity and higher lamb weights can ‘dilute’ this initial energy use.
Relationship between feed self-sufficiency and (i) equivalent fuel requirements (litres) per kilogram carcass and (ii) energy efficiency of the sheep unit (EEs), for five typological farm-system groups.

In sheep-for meat production systems, feeding has a major impact on energy consumption: Bellet et al. (Reference Bellet, Augas, Clenet, Fichet, Gouedard, Ingremeau, Migne, Pagnot and Bahier2008) found a strong correlation between concentrate consumption per kilogram carcass and energy consumption per kilogram carcass: for two groups of farms, the authors found 9.1 and 9.2 kg concentrates per kilogram carcass corresponding to 1.64 and 1.75 FuReq/kg carcass; for the third group, much more based on forage consumption, 7.7 kg concentrates per kilogram carcass corresponded to 1.23 FuReq/kg carcass. For suckler cattle production in France, there was no correlation between concentrate consumption (or feed self-sufficiency) and energy consumption per kilogram carcass, as concentrate consumption is much lower than for sheep production (on average −35% concentrates per LU compared with sheep production, and less variability; Veysset et al., Reference Veysset, Lherm and Bebin2005).
Analysis of the impact of increasing flock size
The simulations performed previously were carried out assuming an optimal distribution of plots around the farm centre (minimum distance). However, real-world dispersions would translate into a large or small average distance between plots and farm centre, and thereby require materials to be moved over longer distances, which in turn requires more energy. Even in an optimized situation (maximum concentration of plots around the farm centre), the average between-plot distance increases as flock size rises, insofar as the area required is proportional to the number of ewes, at a constant stocking rate. Furthermore, it becomes possible to achieve a further economy of scale on energy when flock size increases, due to a better depreciation of equipment energy. But there may be also changes for bigger equipments when the number of sheep increases.
Finally, increasing flock sizes had a broad range of impacts on EEs, without any significant improvement (very little economy of scale on equipment) (Figure 4). Indeed, the increase in flock size is accompanied by increases in farm size, average distance to plots, and thus fuel consumption. A threshold effect is observed in Figure 4 when the size of the flock achieved 1300 ewes (Mixed); it is in relation with the large number of animals fed inside in winter. The work involved in distributing feed is mechanized with the acquisition of a feed mixer trailer, which has very high annual energy costs (high fuel consumption and daily and yearly duration of use). The threshold triggering purchase of this type of equipment is reached earlier under the CCrop system (at 870 ewes).The Extens and Graze systems did not need to purchase this kind of equipment as the lambings are primarily concentrated in the spring, as diet is based on grazing and winter feeding mainly occurs outside.
Figure 5 highlights the economies of scale effect for the Graze system (FuReq/kg carcass from 0.25 to 0.10 between 175 and 3000 ewes) together with the sharp increases in energy costs after 1300 ewes under the Mixed system and after 870 ewes under the CCrop system, which are the thresholds marking when mechanisation of feed distribution was introduced. Slight curve inflections (for 2500 ewes under Graze for example) correspond to the change in range of traction-related equipment (power increased when workload threshold is achieved).
Under the Graze system, economies of scale were much clearer between 175 and 600 sheep (Figure 4). Indeed, energy use per ewe was relatively high when flock size was low (175 to 300 ewes) since there were no cash crops to ‘amortize’ the equipment facilities, in contrast with the three other systems where for a small-sized flock, only a small share of this machinery is used for the sheep unit, the major share being reassigned to cash crops whose surface remains constant when simulating a change in flock size. Furthermore, under the Graze system, the equipment base is small (less tillage, etc.) and is rapidly amortized from an energy point of view when flock size increases.
Validation of assumptions for the three simulation levels
The final level of simulation including both feed, nitrogen and fuel sufficiency points out the more efficient farming system from an energy efficiency point of view (lowest FuReq/kg carcass). However, this shift required changes to animal diet. The main adaptation is for protein intake, using mixed cultivation of peas and cereals (36% of the total concentrate use) and cake from rapeseed (13% of total concentrates). Private farm monitoring under an experimental design at farm scale (Benoit et al., Reference Benoit, Tournadre, Dulphy, Laignel, Prache and Cabaret2009) showed that there is no physiological problem with using a mixture of cereal and peas for ewes or lambs for end-fattening. Oil-seed cake can be used for dairy cow feeding within the limit of 5% of lipids in the total diet, with favourable impact on milk production (Brunschwig and Lamy, Reference Brunschwig and Lamy2006). Anil Kumar et al. (Reference Anil Kumar, Panwar, Yadav and Sihag2002) showed that mustard cake can completely replace peanut cake without affecting the feed intake, feed efficiency and growth performance of growing lambs. A number of recent trials have shown that rapeseed cake can be used to fatten ewes and lambs (Bellet, Reference Bellet2007) if attention is paid to the possible variability in residual oil rate, as it is the case in other ruminant production systems (Brandon et al., Reference Brandon, Pelletier and Cabon2008).
Organic farming systems have shown how total substitution of synthetic nitrogen by legumes is not just a viable option but an increasingly feasible option in farms where animal production occupies a larger share of the activity, as it offers a means of organizing the rotation with temporary pasture based on legumes (Olesen et al., Reference Olesen, Eltun, Gooding, Jensen and Köpke1999; Benoit et al., Reference Benoit, Tournadre, Dulphy, Laignel, Prache and Cabaret2009). There are alternative solutions that can be implemented to improve nitrogen balance, such as growing undersown legume crops to increase nitrogen fixation. We opted not to reduce the use of pesticides in simulation but modifying the crop rotation by introducing legumes would have made it possible to reduce pesticide use (as in organic farming) and that could reduce a little energy needs (equipment to spread and pesticides).
Conclusion
The main way to improve EEs is through eliminating nitrogen fertilizer purchases and introducing legumes into the rotation, which offers good added-value when rearing ruminants. In sheep suckler breeding systems, an increase in animal productivity in terms of either ewe productivity or marketed carcass weight generates an improvement in EEs. Higher EEs levels are achieved when animal feed inputs are increasingly based on on-farm resources, especially fodder, with a maximum amount of grazing. Finally, based on these factors, the Graze system emerges as the best system for energy efficiency. It could be useful to analyze organic farming systems to highlight the technical possibilities for enhancing EEs. Indeed, the organic farming principles are particularly focused on nitrogen and feed self-sufficiencies. An increase in farm size is not necessarily associated with an improvement in EEs, since it can also imply an expansion in farm area and thus higher plot-to-farm distances, mechanization costs and fuel consumption per unit produced. On the basis of our analysis of the farm types presented, other ways for improving EEs could include optimizing flock management for better use of forages and thus improve fodder self-sufficiency, as illustrated in the Graze system.