

I
Entry plays a crucial role in achieving competitive efficiencies.Footnote 1 When entry is free, prices tend towards marginal costs and profits tend towards the competitive norm, market shares are less stable and the threat of entry diminishes the effectiveness of overt or tacit collusion. Nearly every modern introductory economics textbook includes free entry as a defining characteristic of competitive markets. It is not surprising then that political and financial historians believe that free banking represented a significant break from the system of legislative chartering that preceded it. Free banking created a system closer to the textbook norm, which resulted in more competitive markets.Footnote 2 Free entry is not without its costs, however. The adoption of free banking led to periods of increased bank failure rates in New York, Indiana and Minnesota and note holders sometimes suffered heavy losses, which may have mitigated the pace at which the nineteenth-century US economy monetised.Footnote 3 Bray Hammond was not extolling the virtues of free banking when he noted that mid-nineteenth-century New Yorkers found it ‘somewhat harder to become a banker than a brick-layer, but not much’.Footnote 4
Despite a long-standing belief that free banking represented a fundamental policy shift, recent statistical studies provide conflicting interpretations of its effects on entry. Kenneth Ng finds that bank assets in states enacting free banking did not grow relative to regional or national trends.Footnote 5 After controlling for a number of factors likely to influence bank entry, Howard Bodenhorn finds that free banking had little influence on entry into six antebellum urban markets.Footnote 6 But in their study of ten free banking states Andrew Economopoulos and Heather O'Neill find that growth in bank capital and net entry was more responsive to underlying economic influences in free banking states than in states that retained legislative chartering.Footnote 7 It remains unclear whether free banking increased entry and, thus, whether it represented the fundamental policy shift traditionally attributed to it.Footnote 8
Instead of state-level data, this article tests free banking's entry effects using county-level data from New York, Massachusetts and Pennsylvania in the 1830s and 1850s. There are obvious disadvantages to ignoring the experience of all states, but more inclusive studies employing state-level data have shortcomings of their own. One such disadvantage is the potential endogeneity of a state's banking policy.Footnote 9 Adoption was neither geographically random nor unrelated to economic growth and political change. Michigan (1837) and New York (1838) were the first to adopt free banking. Sixteen more states would follow, but only after a lag of a decade or more.Footnote 10 Economic growth surely increased the demand for credit and may have induced states that did not adopt free banking to respond with more liberal chartering. If non-free banking states changed de facto policy without altering de jure policy, using such states as controls may lead to inappropriate inference about the effect of free banking. Moreover, the geographic clustering of adoption in the brief interval between 1849 and 1853 suggests the decision to implement free banking should not be considered an exogenous event.
By focusing on Massachusetts, New York and Pennsylvania, the analysis reduces potential endogeneity bias in estimates of entry following a policy change. These three states' policies were exogenous to economic events in their own and neighbouring states during the relevant decades. While the idea of free banking was, as Fritz Redlich contends, in the air in the 1830s, New York's adoption was driven by internal political factors, namely a growing popular discontent with the cronyism and corruption surrounding legislative chartering, as much as, or more than, by economic factors.Footnote 11 New York certainly did not change policy in response to policy innovations in neighbouring states.Footnote 12 Massachusetts adopted free banking in 1851 but the state's liberal chartering policy dated to the 1820s and was driven more by fiscal than regulatory concerns; liberal chartering made free banking a dead letter.Footnote 13 Only a handful of banks were organised under the Massachusetts law. Resistant to the end, Pennsylvania retained a conservative early nineteenth-century chartering policy throughout the first six decades of the century.Footnote 14 Of the eighteen eventual adopters, Pennsylvania's 1860 Act was one of the last passed prior to the federal adoption of a free-banking-style system during the US Civil War.
A second difference between this and previous studies is that in using county-level data it considers entry into meaningful banking markets. With the exception of Bodenhorn's study of six urban markets, scholars have used the state as the unit of analysis. Except for a few southern states with statewide branch bank networks, potential bankers entered local markets and banking was both legally and economically a local affair.Footnote 15 Charters and corporate bylaws that restricted a bank's office to a specific place did not, of course, restrict its lending to that place, but information asymmetries narrowed the field of potential borrowers. Familiarity with customers was closely associated with geographic proximity because proximity lowered the cost of gathering information, monitoring borrowers and enforcing the terms of the lending agreement. It is not surprising then that in 1836 a legislative committee from Rhode Island reported that ‘by far the greater part of the banks are, properly speaking, local, and managed for the accommodation of the people residing in or near the places of their location’.Footnote 16
Given the potential endogeneity and market definition issues in earlier research, this study focuses on the New York experience, using Massachusetts and Pennsylvania as a comparison group. The results provide a partial reconciliation of the contradictory results offered in earlier studies. Free banking represented an abrupt change in bank entry measured by the creation of new banks, but it did not lead to a notable acceleration in the rate of new capital formation in the industry. Empirical evidence alone does not reveal whether this feature of free banking followed from purposeful choices by contemporaries, but it was the practical consequence of the law.
II
Prior to passage of New York's free banking Act in 1838, all aspiring bankers were required to obtain a special act of incorporation from the legislature. Between 1804 and 1818 several restraining Acts limited the rights of individuals and corporations to engage in banking. The 1818 Act ultimately prohibited any individual or corporation, except those explicitly authorised by statute, to engage in any banking activity. The restraining Act precluded operating an office of discount or deposit, discounting promissory notes, or issuing any debt instrument intended to circulate as money.Footnote 17 The restraining Acts did not explicitly outlaw private lending, but the legal separation of note issue and deposit taking from lending meant that each private lender's ability to provide credit was limited by the size of his or her personal fortune. It was not until passage of the 1838 free banking Act that most of these restrictions were lifted.
New York's restraining Acts would have been of modest import had the state adopted Massachusetts's liberal chartering policy.Footnote 18 The illiberal nature of chartering in New York, however, was established early with the legislature's treatment of Alexander Hamilton's Bank of New York. The bank was established and opened for business in 1784 without legislative approval. Despite annual legislative petitions, a charter was not forthcoming until 1791. In the interim, the Bank of New York operated extra-legally and without corporate protections for its shareholders. The state's conservative approach persisted up to 1810, during which time it chartered just nine additional banks, three of which were in New York City and two in Albany.
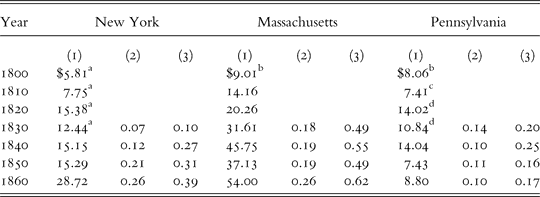
Table 1 provides three common measures of the relative size of New York's financial sector at seven benchmark dates. Column (1) reports paid-in bank capital per capita and shows that up to 1850 New York's financial sector was about one-third to one-half the size of Massachusetts's and about the same size as Pennsylvania's. From this evidence alone, it is inappropriate to conclude that New York's banking sector was inefficiently small. Drawing such a conclusion demands an understanding of an optimal banking sector and then calculating the distance between New York's actual and a hypothetically optimal banking sector. I am unaware of any method for determining the optimal size of a state's banking sector. Nevertheless, the data show that, up to 1850, even though it was quickly emerging as the nation's commercial centre, New York's banking system was not catching up with Massachusetts's system and not growing markedly more quickly than Pennsylvania's.
Financial depth in New York, Massachusetts and Pennsylvania, 1800–60
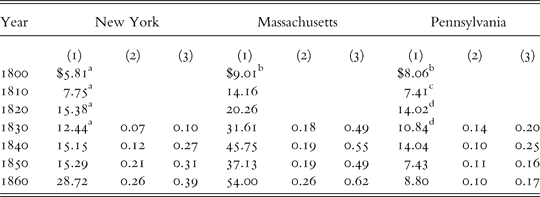
Notes: Columns (1) report bank capital per capita; columns (2) report bank money (banknotes + deposits)/State GDP; columns (3) report Loans/State GDP.
Sources: Columns (1), unless otherwise noted, estimates are derived from US Comptroller of the Currency, Report of the Comptroller of the Currency (Washington, DC, 1876) and US Census Office, A Compendium of the Ninth Census (Washington, DC, 1870); aBank capital from E. Williams, The New York Annual Register of the Year of Our Lord 1837 (New York, 1837); bestimates for 1801; cestimate for 1811, bank capital reported in A. Gallatin, Considerations on the Currency and Banking System of the United States (Philadelphia, 1831); dbank capital reported in Gallatin, Considerations. Columns (2) and columns (3) are taken from H. Bodenhorn, A History of Banking in Antebellum America: Financial Markets and Economic Development in an Era of Nation Building (Cambridge, 2000), tables 2.3 and 2.4. See source for explanation of series construction.
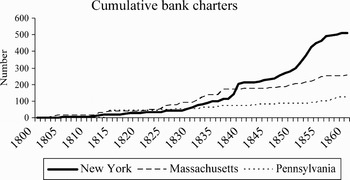
A second common measure of entry is the number of new banks formed. Figure 1 charts the cumulative number of charters granted by legislatures or incorporations registered under free banking laws for three states. The figure does not report the number of banks in operation in a given year because some charters lapsed without a bank having organised; other banks closed voluntarily or in bankruptcy. Figure 1 reveals the sharp break in bank organisations that occurred in New York after 1838. Up to the early 1830s, Massachusetts was the chartering leader. A sharp increase in new bank formation after 1838 put New York in the lead, where it remained throughout the antebellum era. After a lull in free bank formation during the 1840s, bank formation again accelerated in the 1850s, but slowed after the panic of 1857.
Cumulative bank charters in three states, 1800–60
Sources: J. V. Fenstermaker, The Development of American Commercial Banking, 1782–1837 (Kent, OH, 1965) provides exhaustive lists of all bank chartered up to 1837. Information for the post-1837 period comes from Massachusetts, Private and Special Statutes of the Commonwealth of Massachusetts, vols. 1–10 (Boston, 1822–61); John Thom Holdsworth, Financing an Empire: History of Banking in Pennsylvania (Chicago, 1928); and New York, Annual Report of the Bank Commissioners (1837–43); New York, Annual Report of the Superintendent of the Baking Department (1852–62); Albany Argus (various issues, 1850–54).

Raymond Goldsmith's pioneering work, as extended by John Gurley and Edward Shaw, suggests two reasonable benchmarks of financial development.Footnote 19 Although contemporary estimates placed the money–GDP (or money–income) ratio in developed economies at between 0.05 and 0.10, Gurley and Shaw conclude that money–income ratios below 0.10 are common in poor countries and exceed 0.30 in rich countries.Footnote 20 Column (2) of Table 1, taken from Bodenhorn's study of finance and growth in the early US, reports money–income ratios for 1830 and after. While Massachusetts exhibited moderate financial depth by 1830, New York achieved a modern standard only around 1850 and Pennsylvania failed to achieve it during the antebellum era. Column (3) reports an alternative measure of financial development, namely, bank loan-to-income ratios for the same period. Gurley and Shaw's analysis provides no comparative benchmark for loan–income ratios, but they mirror money–income ratios and suggest that New York banks were not able to leverage a given capital or bank money into substantially more credit than banks in Massachusetts or Pennsylvania.
If the posited connection between finance and growth is correct and contemporary New Yorkers recognised it, they may have looked upon these numbers with concern.Footnote 21 Some contemporaries, but not all, accepted the finance–growth nexus. In their 1835 annual report, for example, the state's bank commissioners wrote, ‘It is … impossible to account for the rapid augmentation of wealth which is daily witnessed, upon any other hypothesis, than that use which has been made of credit in this country has been exceedingly productive.’Footnote 22 By the late 1820s, other observers expressed concern with the slow growth of and impending crisis faced by the state's banking sector. By any of the three measures reported in Table 1, New York in the late 1820s was financially underdeveloped. Moreover, at the end of 1828 the charters of 30 of the 40 existing banks were due to expire in the next five years. A clause in the state's 1821 state constitution requiring a two-thirds majority vote to charter or recharter a bank hamstrung well-meaning legislators, encouraged log-rolling and, for less well-meaning men, opened the door to corruption.
Legislative chartering of corporations had its roots in the commonwealth ideal described by Oscar and Mary Handlin.Footnote 23 The commonwealth ideal held that the state owed a duty to its citizens to promote economic growth through all available means, including the chartering of corporations.Footnote 24 At the same time, the state owed a duty to its citizens to protect their persons and property from violence, theft and fraud. By reserving the right of incorporation to itself, the legislature provided the first line of defence against corporate fraud. As one contemporary noted, the act of appearing before the legislature ‘would deter men of straw, and respectable men would not appear save on solid grounds’.Footnote 25 Ironically, a practice designed to protect the people and promote the common weal undermined the legislature's credibility as protector of the common weal because chartering came to be viewed as a mechanism of legislative rent extraction and corruption.
Charges of corruption date to 1803 and the chartering of the State Bank of Albany. In 1828, Elihu Root recalled his experience with the petitioners for that bank. ‘I was urged,’ he wrote, ‘to be a subscriber to the Bank; it was said the shares were to be scattered over the State, and the members of the legislature were to have shares. It was one of the most open, palpable, barefaced acts of bribery that can be imagined.’Footnote 26 Root's experience was not unique; it was replayed in nearly every legislative session between 1803 and 1838, the most notorious of which occurred in 1812. Federalist petitioners seeking a charter for the Bank of America of New York City hired two prominent Republican lobbyists who spread influence and cash liberally on both sides of the aisle.Footnote 27 Their actions became a public scandal and induced the governor to exercise his constitutional right to suspend both houses of the legislature for sixty days. In his message suspending the legislature, Governor Tompkins alluded to charges of bribery and accused four Federalist members of the state Assembly and one state senator of accepting bribes from the lobbyists.Footnote 28 Tompkins asked the Attorney General to investigate, but little came of it. Ultimately, the governor's decision to suspend the legislature had no effect; the Bank of America received its charter shortly after the legislature reconvened. Charges of bribery and reports of corruption surrounded nearly every subsequent chartering bill, but none rose to the level of the Bank of America scandal.
By 1829 Martin Van Buren's Democratic faction controlled the legislature and he and his close advisors were building one of America's first party machines. Van Buren viewed the impending banking crisis as an opportunity to entrench his faction's power further if he could just provide a reform agenda capable of breaking the chartering logjam.Footnote 29 Van Buren's reform centred on the so-called Safety Fund system, adopted in 1829, which created a bank liability insurance fund, comparable in some ways to modern deposit insurance.Footnote 30 The Safety Fund's mutual guarantee mechanism, funded by premiums paid by the banks themselves, reduced legislators' concerns that they might unleash a competent lobbyist but an incompetent banker on an unsuspecting public. Under the Safety Fund New York chartered or rechartered 71 banks in the next nine years, compared to 14 in the preceding decade.Footnote 31 The Safety Fund established a system of bank inspection by three bank commissioners, but the appointment of commissioners remained partisan and the legislature retained chartering authority. The commissioners' roles were to mitigate fraud; they were not expected to eliminate corruption. Van Buren and his allies retained the chartering prerogative.
Political spoils permeated the entire Van Buren machine structure, from the appointment of low-level government functionaries, such as sheriffs and justices of the peace, to the highest levels of the administration. Spoils similarly permeated bank chartering and, more importantly, the distribution of shares in newly established banks. Party insiders received lucrative bank charters and partisan administrators then allocated shares among themselves and other party regulars. In 1836 the distribution of shares in 12 newly chartered banks was so overtly partisan that even the partisan bank commissioners criticised them and recommended changes in allocation practices.Footnote 32
By 1837, however, the public had little remaining tolerance for the Democrats' spoils system and the distribution of economic privileges through political machinations. Flagrantly inequitable practices, such as the highly partisan distribution of bank shares, offended Republican sensibilities. The legislature enacted a change requiring that initial public offerings be sold at public auctions and limited the number of shares an individual could purchase or control by proxy. Ultimately, the 1837 law was of no consequence because the legislature never passed another bank chartering Act prior to the Civil War.
The backlash against Democratic excesses and a sharp economic downturn led to a resounding Whig victory in the 1837 November legislative elections. In the opening days of the 1838 session the state senate established a committee to make recommendations for banking reform. Its members reported that the time had come to replace legislative chartering with a general incorporation law, mostly because chartering was ‘utterly at war with equal rights and free government’.Footnote 33
New York's free banking Act stripped the legislature of its chartering prerogative, depoliticised incorporation, and made it a purely administrative function. Prospective bankers who cleared the comparatively modest regulatory hurdles were allowed to operate a banknote-issuing, deposit-taking, lending bank. The Act imposed minimum capital requirements, one for joint-stock associations with several shareholders and a much lower one for associations with just one or two owners. The defining characteristic of free banking, however, was bond-secured note issue. Bankers were required to deposit with the state comptroller acceptable government bonds – mostly New York and US securities – or mortgages on improved, unencumbered property. Bankers received engraved banknotes in return. With banknotes in hand, bankers could lend and engage in most other common contemporary banking functions.
Bond-secured note issue was viewed by contemporaries as a mechanism to protect the public from bank failure. If a noteholder informed the state comptroller that a bank had refused to redeem one or more of its notes in specie, the comptroller instructed the bank to resume payments within 10 days or its assets would be attached and the collateral bonds would be sold to reimburse noteholders. Bond-secured note issue is reminiscent of, but not identical to, the so-called Friedman rule, in which regulators pursuing monetary stability construct ‘narrow banks’ that would hold a 100 per cent reserve of high-grade government debt against their deposits.Footnote 34 A criticism of the Friedman rule is, of course, that it sacrifices the banks' intermediating function in search of macroeconomic stability.Footnote 35 Contemporaries did not view free banking as 100 per cent reserve banking.Footnote 36 The law limited banknote circulation to the value of government bonds deposited with the state comptroller, but placed no limits on deposits and offered depositors no guarantee of recovery other than as general unsecured creditors. Although some contemporary critics of the law failed to understand the mechanism, free banks were capable of intermediating and, through fractional reserve policies, creating credit in a multiple of their specie holdings.Footnote 37 That at least some contemporaries recognised that bond security did not preclude intermediation is evident in proposals to include an explicit specie reserve requirement, a policy that was adopted and later repealed.Footnote 38
Other contemporaries criticised bond security on several grounds. Henry Carey argued that free banking would actually make banks more, rather than less, risky.Footnote 39 Because banks were forced to hold a large proportion of their earning assets in low-return, risk-free debt, they would be encouraged to discount riskier paper on average than if they could invest their entire capital in good commercial paper or some other asset offering a greater return. George Tucker generally supported free banking proposals, but believed that the bond security provision would inhibit entry, though he failed to elaborate on the deterrent mechanism he had in mind.Footnote 40 A large literature dating to the early twentieth century documents how national banks of the postbellum era failed to issue more notes despite the apparent profitability of doing so.Footnote 41 Failure to exploit seemingly profitably opportunities, a feature of bond security also documented for the free banking era, is suggestive, but not conclusive, evidence of entry deterrence under bond-secured note issue.Footnote 42
No brief survey of the contemporary and historical literature can do justice to the complex debates surrounding the enactment of free banking, but the published discussion focused on ideological rather than practical arguments. Chartering was a usurpation of the Republican ideal. It interfered not only with a man's ‘right of exclusive possession, but the liberty of free use’ of his property.Footnote 43 It created monopolies that ‘taxed’ the people.Footnote 44 Once a majority of New York's electorate became convinced that the costs of chartering outweighed the potential costs of free entry, their representatives adopted a general incorporation law for banks. L. Ray Gunn contends that New York's free banking law represented ‘one of the most important pieces of legislation in the first half of the nineteenth century’.Footnote 45 It reflected a fundamental transformation of the role of the state, a movement away from the notion of the state as commonwealth. Incorporation changed from being based on the principle of the common weal to one of private gain. The legislature relinquished its power to bestow privilege and created a bureaucracy charged with treating all alike. Thus, the corporation lost its essentially public character and became a purely private matter. The question investigated below is whether this fundamental political change, in New York at least, represented a substantive shift in the economics of bank entry.
III
Although formal models of bank entry have been offered for the antebellum era, most of the important theoretical determinants of entry are unobservable.Footnote 46 Instead of positing a formal model, then, it may be more useful to turn to contemporary statements about bank market structure and the conditions favourable to entry to test whether bank formation was responsive to factors believed to be important at the time.
As with free banking generally, contemporary debates about optimal market structure and bank entry centred on the desirability of free versus chartered banking. Theodore Sedgewick expressed a widely, but not universally, held belief that a charter was a ‘grant of exclusive privilege, and every grant of exclusive privilege, strictly speaking, creates a monopoly.’Footnote 47 Not every charter created a monopoly, of course, as New York City, Philadelphia and Boston each had several chartered banks operating simultaneously. But in providing banking services for smaller cities and towns, legislators were wary of open competition. It was widely believed that competitors would, through specie raids and other aggressive practices, undermine each other and, ultimately, threaten the entire system.Footnote 48 By design, competition was limited in larger cities and precluded in smaller cities and towns.
What rules of thumb did contemporaries, whether private entrepreneurs in search of profit or legislators in pursuit of the common weal, use in assessing whether a certain town or city merited a bank? I have failed to uncover any statements from contemporary entrepreneurs revealing what drove their decisions, but there are numerous, though often vague, pronouncements from contemporary economists and legislators about the factors they considered relevant in awarding charters. William Gouge, for instance, believed that the natural order implied that when there was little population, little wealth and little commerce, there would be little banking. ‘In each city,’ Gouge continued, ‘the number of Banks would be in proportion to the amount of business to be done, and their capital in proportion to the trade of the city’.Footnote 49 Similarly, Marcius Willson argued that under free entry, banks would enter when the current or expected demand for banking services grew. With ‘an increase in productiveness,’ banking capital should increase ‘proportionately to the greater amount of exchanges’.Footnote 50
Political pronouncements on the issue found their way into print, but meaningful statements of policy must often be extracted from the often flowery political rhetoric of the day. One New York legislator, in a moment of rare candour, simply said that banking services should expand as ‘population, wealth, and business increase’.Footnote 51 Pennsylvania's legislative banking committee emphasised the same factors.Footnote 52 In 1853 the Massachusetts senate offered the most complete statement of legislative decision making. Despite having enacted a free banking law two years earlier, the 1853 legislative session received dozens of bank petitions, 16 for new charters and 48 from existing banks to increase their capital for a requested total of $17 million in new capital.Footnote 53 The state senators noted that bank capital should increase in proportion with the growth of business but, noting the difficulty of measuring business, they turned to population and property tax assessments as guides. After comparing the growth in bank capital at the city level to population growth and increases in taxable property, the committee concluded that ‘the present bank capital is insufficient for the proper supply of wants, and that it should be increased in some proportion to the growth of business’.Footnote 54
Although legislators in all three states repeatedly argued that the ‘needs of business’ should drive bank entry, whether chartered or free, the statement is sufficiently vague as to have little empirical content and provide historians with little guidance as to what they meant. Thus, I follow the Massachusetts senate committee and include several demand-side factors likely to influence entry into necessarily reduced-form regression estimates.Footnote 55
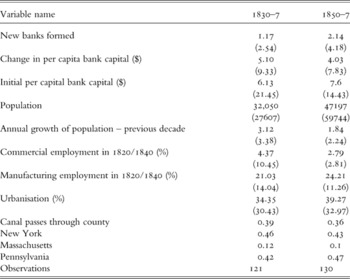
Table 2 summarises the variables used in the empirical analysis. Note that the analysis is restricted to two seven-year intervals in the 1830s and 1850s. These two periods are chosen because they are both periods of sustained economic expansion abruptly terminated by a financial panic. The panic of 1837 signalled the onset of a long financial downturn that persisted through the early to mid 1840s. The financial sector recovered more quickly from the panic of 1857, but the panic itself marked the end of a nearly decade-long economic expansion.
Summary statistics for county-level data, 1830s and 1850s

Notes: Population in 1837 and 1857 computed from continuously compounded growth rates between 1830 and 1840 or 1850 and 1860.
Sources: Population and urbanisation: US Department of State, Census for 1820 (Washington, DC, 1821); US Department of State, Fifth Census, Or Enumeration of the Inhabitants of the United States, 1830 (Washington, DC, 1832); US Department of State, Sixth Census or Enumeration of the Inhabitants of the United States (Washington, DC, 1841); US Census Office, The Seventh Census of the United States, 1850 (Washington, DC, 1853); US Census Office, Population of the United States in 1860 (Washington, DC, 1864). Commercial and manufacturing employment: US Department of State, Census for 1820; US Department of State, Sixth Census. Canals: H. S. Tanner, A Description of the Canals and Railroads of the United States (1840, reprinted New York, 1970). Bank capital – New York: New York Assembly, Assembly Document No. 59 (Albany, 1830); New York Assembly, Assembly Document No. 71 (Albany, 1838); Daily Albany Argus (25 Nov. 1850); New York Assembly, Assembly Document No. 4 (1858). Bank capital – Massachusetts: US House, 26th Cong. 2nd Sess., Executive Document No. 172; US House, 32d Cong. 1st Sess. Executive Document No. 122; US House, 35th Cong. 1st Sess. Executive Document No. 107. Bank capital – Pennsylvania: Pennsylvania, Senate, ‘Communication from the Auditor General’, Senate Journal (1830–1); Pennsylvania, Senate Journal (1837–8), pp. 48–145; Pennsylvania, Senate, ‘Tabular statement of the condition of various banks of Pennsylvania’, Senate Journal (1851); Pennsylvania, ‘Tabular statement of the resources of various banks in the Pennsylvania’, Legislative Documents (1857), pp. 202–13.
The feature of principal interest – entry – is measured, first, by the number of new banks receiving a charter to operate in a particular county or, in the case of free banks, registering with the relevant state authority.Footnote 56 The second measure of entry is change in per capita bank capital in the relevant seven-year period.Footnote 57 One feature of note is that although the average county experienced an increase of more than $5.00 in per capita bank capital between 1830 and 1837, the overall growth in average per capita bank capital increased by slightly less than $1.50 between 1830 and 1850. Relatively substantial increases in banks and bank capital between 1830 and 1837 were very nearly offset by population growth in the intervening years (1838–50) and the closure of banks during the financial turmoil of the late 1830s and early 1840s.
As explanatory variables the empirical work follows the features commonly mentioned by contemporaries as determinants of whether a particular place was a suitable candidate for a new bank. In addition to initial population, the regressions also include population growth lagged one decade. The regressions designed to explain entry in the 1830s, then, will include as independent variables the county population in 1830 as well as population growth between 1820 and 1830. These variables were chosen because: (1) contemporary observers repeatedly mention that places with larger and more rapidly growing populations were more promising candidates for banks; and (2) they are values that contemporaries could have observed in the relevant intervals. A related variable is the level of county urbanisation, measured as the percentage of a county's population living in a city or town of more than 2,500 inhabitants.
Quantifying the oft-mentioned ‘needs of business’ is more problematic. Two available measures, which could have been known by contemporaries, are the percentage of people employed in commerce or manufacturing. Both the 1820 and 1840 censuses instructed marshals to determine whether a household head's principal employment was in agriculture, commerce or trade, or manufacturing. Given that nineteenth-century banking theory considered agricultural loans, especially mortgage loans, inconsistent with good banking practice, the regressions include the proportion of households engaged in commerce and the proportion engaged in manufacturing as separate regressors. The data are not without problems, notably that different marshals may have interpreted the meaning of commercial or manufacturing differently. Moreover, some counties reported suspiciously small numbers of people (sometimes zero) engaged in trade or professions. To ensure that undercounts, oversights or mistaken interpretations of the directions are not driving the results, regressions are estimated including and excluding counties with apparent errors or gross undercounts.
Two additional variables used to capture the ‘needs of business’ are whether a canal passed through the county and the initial level of per capita bank capital in the county as of either 1830 or 1850. Kenneth Sokoloff finds that proximity to a canal had a significant influence on inventive activity, which increases the likelihood that it also increased other types of market-oriented activity.Footnote 58 In addition, contemporary statements about finance leading growth to the contrary, there was an equally prominent view that before receiving a bank charter a locality had to first exhibit some minimum level of commercial activity. Given the potential errors in the census data on sectoral employment, the presence of an earlier chartered bank – measured here as the initial level of per capita banking capital – is used to indicate legislative acknowledgment of adequate commercial activity to warrant a bank. This variable may also proxy for other unobserved economic and political factors influencing the decision to approve charters for any or all kinds of corporations.
Before estimating models of entry, it is necessary to make some assumptions about the process generating the observed distribution of entrants. New entry is observed as count data, that is, we observe between zero and eight new entrants in each period and the dependent variable takes on non-negative integer values. Discrete, non-negative events are often assumed to follow a Poisson process, which for a discrete random variable, Y (with observed frequencies yi, i = 1,…, N), and explanatory variables, X, can be modelled as:

One problem that commonly arises in practice is that the Poisson specification assumes that the mean and variance are both equal to λ(i). If the variance exceeds the mean (overdispersion), estimated coefficients will be consistent, but the standard errors will be biased downward, which may lead to inappropriate inference. The negative binomial regression model is more general than the Poisson model in that it can explicitly account for overdispersion. Count variables displaying overdispersion, can be estimated by assuming that: lnλ(i) = α +βx(i), where exp(α) has a gamma distribution with mean 1.0 and variance α. The Poisson regression, then, is just a special case of the negative binomial regression and is nested within it. Like many count variables, antebellum bank entry exhibits overdispersion. I therefore report ‘incidence rate ratios’ calculated from coefficient estimates generated by negative binomial regression procedures. Incidence rate ratios are similar to marginal effects and are interpreted as the effect on the dependent variable of a one unit change in the independent variable of interest, holding all other independent variables constant.Footnote 59
IV
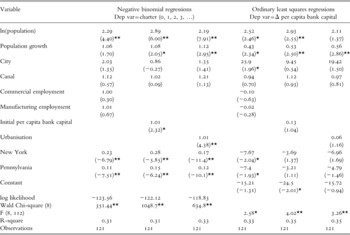
The first three columns of Table 3 report the results of negative binomial regressions where the number of entrants in the 1830s is the dependent variable. Because initial per capita bank capital, urbanisation and commercial/manufacturing employment are all highly correlated, they are included in separate regressions. Incidence ratios reveal that new bank entry was highly responsive to the initial population size and population growth in the previous decade. The estimates imply that a one unit increase in the natural log of a county's population increased the mean ratio of entry by a factor of between 2.2 and 2.9. Similarly, a unit percentage point increase in the rate of population growth increases the mean incidence rate ratio by a factor of about 1.10. Contemporaries consistently mention population size and growth as determinants of legislative chartering. The regressions are consistent with their assertions.
Determinants of bank entry, 1830–7

Notes: For negative binomial regressions, values reported are Incidence Ratios rather than estimated coefficients. Incidence ratios are similar to marginal effects. Values greater than 1 imply that an increase in given variable increases the likelihood of observing entry; values less than 1 imply that an increase in given variable reduces likelihood of observing entry. Values in parentheses are Z-statistics for negative binomial regressions and t-statistics for OLS regressions. *implies p-value < 0.05; **implies p-value < 0.01.
Sources: see text and notes to Table 2.
Ordinary least squares (OLS) estimates are reported in the last three columns of Table 3. The dependent variable is the county-level change in per capita bank capital between 1830 and 1837. The OLS estimates are consistent with the negative binomial regressions in that they show that changes in bank capital were reasonably responsive to population size and population growth. According to the estimated coefficients, a 1 per cent increase in the natural log of population is associated with an additional $2.11 to $2.93 in per capita bank capital. Similarly, a 1 per cent increase in the rate of population growth increased county-level per capita bank capital by about 50 cents. A one standard deviation increase in the rate of population growth, evaluated at the mean rate of population growth, then increased per capita bank capital by between $1.46 and $1.90. Given that the mean of per capita bank capital in 1830 was $6.14, an increase of about $1.5 (or 24 per cent) appears to be economically meaningful.
Contemporaries also provided a ‘needs of business’ justification of bank chartering. Either the available measures of contemporary needs of business fail to serve as reasonable proxies or contemporary statements were mostly empty. Coefficient estimates from the negative binomial regressions reveal that local commercial and manufacturing employment had no statistical or economic influence. The coefficients on initial per capita bank capital and urbanisation are more precisely estimated, but the estimated effects are very small. A one percentage point increase in the urbanisation rate, for example, increases the incidence ratio by a factor of just 1.01. OLS provides similarly small and imprecise coefficient estimates.
Finally, both the negative binomial and OLS estimates imply that chartering policies in New York and Pennsylvania were markedly different from policy in Massachusetts. Estimated incidence rate ratios based on count data imply that a county with a given set of characteristics in New York was just 0.17 to 0.23 times as likely as a Massachusetts county with the same characteristics to witness the opening of a new bank. A Pennsylvania county with the same characteristics was just 0.11 to 0.15 times as likely to receive a new bank. The political systems in New York and Pennsylvania were also less responsive than Massachusetts in allocating increases in new bank capital, though again the coefficients, while large, are imprecisely estimated.
Taken in whole, the statistical evidence from the 1830s is consistent with both contemporary and historical accounts of bank chartering in these three states. Legislators took their responsibilities seriously and allocated charters based mostly on population size and growth. Although a ‘needs of business’ justification was also commonly provided, the extant data fails to reveal legislative responsiveness to urbanisation or nonagricultural employments. It is equally clear that, consistent with existing interpretations, chartering policy in Massachusetts was more liberal than elsewhere. New York and Pennsylvania legislators were less likely, all other things the same, to provide a charter to a county with a given set of characteristics than Massachusetts's legislators. Legislators in New York and Pennsylvania were especially reluctant to supply de novo charters. On a per capita basis, bank capital growth was also substantially lower in these two states than in Massachusetts.
V
The crux of the issue addressed here is whether and to what extent free banking represented a meaningful break in banking policy in New York. Much evidence suggests that no meaningful chartering innovations occurred in Pennsylvania or Massachusetts between 1830 and 1857, enactment of a free banking statute in Massachusetts notwithstanding.Footnote 60 Given that the only meaningful innovation occurred in New York, its effects should be apparent by the 1850s. Even the New York bank commissioners recognised that free banking was an experiment and that it would take some time ‘to fully test the practical effects of the system’.Footnote 61 Free banking lifted existing restrictions on free entry and ‘the occasion was seized with avidity’ immediately after enactment, as is well documented, but the fruits of free banking in the longer term will be more apparent in the 1850s after the economy recovered from the prolonged economic downturn of the 1840s and contemporaries gained a better appreciation of the mechanics of free banking.
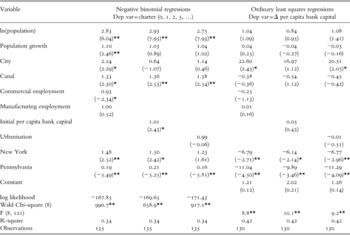
Table 4 reports regressions for the 1850s specified in the same manner as those reported earlier for the 1830s. Bank entry per se was highly responsive to population. Estimated incidence rate ratios for the 1850s show that a one unit change in the natural logarithm of county population increased the mean incidence of new banks by a factor of 2.75 to 2.93. Prospective bankers clearly preferred to locate in more populous places but, interestingly for the 1850s, became less responsive to prior population growth. A one percentage point increase in the rate of population growth in the 1840s increased the incidence ratio by a factor of 1.03 to 1.04, and the incidence rates are imprecisely estimated in two of three instances. Comparisons of either point estimates or 95 per cent confidence intervals around the incidence ratios imply that entry did not become markedly more responsive to population size or population growth in the 1850s relative to the 1830s.
Determinants of bank entry, 1850–7

Notes: For negative binomial regressions, values reported are Incidence Ratios rather than estimated coefficients. Incidence ratios are similar to marginal effects. Values greater than 1 imply that an increase in given variable increases the likelihood of observing entry; values less than 1 imply that an increase in given variable reduces likelihood of observing entry. Values in parentheses are Z-statistics for negative binomial regressions and t-statistics for OLS regressions. *implies p-value < 0.05; **implies p-value < 0.01.
Sources: see text and notes to Table 2.
The OLS regressions reported in columns 4 through 6 of Table 4 reveal one dramatic difference between the 1830s and the 1850s. Although population size and growth continued to be powerful influences of de novo entry in the 1850s, the connection between population size and population growth and incremental additions to per capita bank capital disappeared. The estimated coefficients are small, particularly compared to the 1830s, and statistically insignificant. In the 1830s, a one standard deviation increase in the natural log of population was associated with a 2.1 per cent increase in per capita bank capital; in 1850 it was a notably smaller 0.86 per cent increase. The connection between the rate of population growth and increases in per capita bank capital also broke down between the 1830s and the 1850s.
The coefficients on the state dummy variables also reveal notable differences between the pre- and post-free banking era. Recall that the estimated incidence ratios in the negative binomial regressions on the New York dummy variable in the 1830s are about 0.20. In the 1850s, the estimated incidence rates are between 1.23 and 1.50. Whereas the incidence of bank entry in a New York county with the same characteristics as a Massachusetts county was lower by a factor of 0.20 in the 1830s, it was higher by a factor of about 1.5 in the 1850s. The statistical evidence confirms the visual evidence in Figure 1, which is that free banking represented a fundamental shift in de novo bank entry policy.
Comparing the results of the negative binomial and OLS estimates in Table 4 reveals the puzzle evident in the literature on free banking. It is clear that free banking led to the organisation of many new banks. But it is also evident that free banking did not lead to a notable increase in per capita capital formation in the industry. Indeed, New York's comparatively lower rate in the 1830s persisted into the 1850s. The estimated coefficients in the fourth through sixth columns of Table 4 show that a New York county with the sample mean characteristics had about $6 less in per capita bank capital growth than a similarly situated Massachusetts county.
The question remains as to why free banking effectively broke the link between growth in banks and growth in per capita bank capital. It was not that free banking encouraged small banks. Massachusetts's banks were smaller, on average, than New York's. It was not that the securities accepted by the comptroller to secure note issues were dear.Footnote 62 Note issue remained profitable despite rising bond prices. So what were the features of free banking that led Thomas G. Cary to write that ‘none of the advantages have been realised which were anticipated’ from the law?Footnote 63 He argued that, relative to traditional chartered banking, free banking's bond security feature tied up an inordinate share of the free banks' capitals in long-term securities, which limited their ability to intermediate. Bond security probably reduced incentives to invest large sums in bank capital, as well.
Cary was not alone in his assertion that free banking was less attractive than chartered banking. Alexander B. Johnson, a long-time New York banker and one-time state bank commissioner, published a practical treatise on banking in 1850.Footnote 64 Johnson argued that, while free banking was not 100 per cent reserve banking, the terms under which free banks issued banknotes limited both their ability to intermediate and their profitability. Although free banking was not a Friedman-style 100 per cent reserve system, contemporaries believed that bond security inhibited intermediation.
To make his point, Johnson provided the following example. A capitalist could invest in government debt and earn a nearly risk-free return between 5 and 6 per cent. In the alternative, he could invest in bank shares and receive dividends.Footnote 65 Free banks could lend at a maximum legal rate of 7 per cent.Footnote 66 If the expenses of operating the bank exceeded 1 per cent, and Johnson estimates them at between 2 and 3 per cent, an investment in bank stock rarely offered a competitive return if the bank relied solely on its note issues to intermediate. A bank could, of course, intermediate by leveraging its deposits, as in the standard textbook description of fractional-reserve banking. But few banks outside the state's urban places reported deposits of sufficient magnitude to overcome the intermediation disadvantage implied by bond-secured note issue.Footnote 67
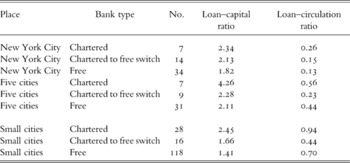
Compared to free banks, the standard pre-1838 charter limited a bank's note issues to twice its paid-in capital. Moreover, a chartered bank did not have a large fraction of its portfolio tied up in low-return securities. Even absent a meaningful deposit base, a chartered bank could leverage its capital into more credit than a free bank and, therefore, earn a return greater than many alternative investments of comparable risk. Statistics from New York's 1849 bank report cited by Johnson reveal differential leverage capabilities. For 90 free banks outside New York City and Albany (those with limited deposit bases), the mean loan–capital ratio was 1.18; for 51 still-operating chartered banks outside the two cities, the loan–capital ratio was 1.80.Footnote 68
Statistics constructed from data in the 1856 annual report of the state banking department, summarised in Table 5, reveal sharp differences in two important leverage ratios between chartered and free banks. Among New York City's banks chartered prior to 1838 and still operating under the terms of their original charters, the average loan–capital ratio – a measure of how efficiently a bank can transform shareholder investments into earning assets – was notably higher than that for banks initially organised as free banks. For the same comparison group, the circulation–capital ratio – a measure of regulatory restrictions – for chartered banks was about twice that of free banks. Table 5 shows that this latter ratio was the same regardless of a bank's location. Whether in New York City, one of the state's five other cities or in small towns, the circulation-capital ratio among chartered banks was roughly 1.5 to 2 times that of free banks, whether those banks were initially organised as free banks or reorganised as a free bank after their original charter expired. The bond-security provision limited the free banks' abilities to create money, which also limited their abilities to intermediate. Loan–capital ratios at chartered banks were notably higher than at free banks, though the gap was smaller when compared to banks that had reorganised. Reorganised banks, perhaps, were better able to capture learning by doing effects or exploit some other unobservable experience-based advantage.
Selected capital ratios by bank type in 1856

Notes: Chartered banks includes banks chartered before 1838 and still operating under the terms of that charter. Charter to free switch banks include banks chartered before 1838 that reorganised as free banks, typically only after charter expired. Free banks includes banks originally organised under the 1838 free banking law. Five cities all had more than 25,000 inhabitants and include Albany, Brooklyn, Buffalo, Rochester and Troy. Small cities category includes all banks in minor civil divisions (incorporated cities and towns or unincorporated villages) with less than 25,000 people. Utica, with 22,000 people is the marginal city. Most other cities had 10,000 or fewer inhabitants; some as few as 700.
Sources: New York State Banking Department. Annual Report of the Superintendent of the Banking Department of the State of New York, Transmitted to the Legislature, January 7, 1857 (Albany, 1857); Census of the State of New York for 1855 (Albany, 1857), pp. xvi-xxxii.
Bond-security offers a partial explanation of how the link between entry per se and increases in per capita bank capital was broken. To the extent Johnson was correct, the combination of a binding usury ceiling and bond-secured note issue made investments in free bank shares less attractive than shares in chartered banks. A well-diversified investor might still hold bank shares in a portfolio, but the lesser returns realised from bank shareholding may have discouraged growth in bank capital commensurate with population growth or with growth in the ‘needs of business’. Banks, of course, profited from fees charged for other services and could differentially leverage capital and specie to influence profitability. Unfortunately for the historian, New York's bank commissioners did not ask banks to report dividends when forwarding quarterly balance sheets, so potential differences in profitability between free and chartered banks remain open to speculation. The historical record makes clear, however, that bond-secured note issue, whether under free banking in antebellum New York or national banking across the postbellum United States, imposed some unaccounted-for costs on banks. Despite the measured profitability of adding to a bank's capital and increasing its lending and note issues, banks failed to exploit these apparent opportunities. Why they failed to do so remains an open question.
VI
This article documents that free banking disconnected bank entry from growth in per capita bank capital. In the 1830s, when New York, Massachusetts and Pennsylvania all relied on special Acts of incorporation for banks, growth in banks per se was also associated with increases in per capita bank capital. In the 1850s, that connection broke down. That decade witnessed a sharp increase in the number of banks in New York, and to a lesser extent in Massachusetts, but growth in per capita bank capital failed to respond to factors contemporaries considered important determinants of entry, most notably the absolute size of the population and prior population growth.
Ng uncovered a similar phenomenon. He speculated that chartered banking was, perhaps, more competitive than previously believed; or free banking exchanged one set of entry barriers under chartered banking for a different set of barriers under free banking. Ng did not, however, offer any evidence in support of either hypothesis. One problem with the first of Ng's hypotheses is that any answer is highly dependent on time and place. Chartered banking was, in fact, highly competitive in Massachusetts or Rhode Island after the 1820s.Footnote 69 It was less so in New York and, outside limited competition in Philadelphia, was even less so in Pennsylvania. Although the results reported here accord with Ng's second hypothesis, the exclusive focus on New York avoids having the many unaccounted-for factors driving the results. Ng repeatedly mentions the Louisiana experience as evidence that free banking failed to encourage entry, but Louisiana's banking law imposed several onerous portfolio restrictions on its banks, free and chartered alike, that would have discouraged entry regardless of the other terms of the Act.Footnote 70 Failing to control for these confounding regulations vitiates any blanket statement concerning the broader market structure implications of free banking. Thus, while this study sacrifices much by focusing on the New York experience, the advantages of doing so are large.
Ultimately, the answer to this riddle is likely to be found in a better understanding of the political economy of bank organisation in Massachusetts. That state's 1851 Act was a dead letter from the outset. Despite the possibility of organising banks under a general incorporation law, prospective bankers in Massachusetts sought legislative chartering Acts. When the legislature received an extraordinary number of chartering petitions in 1853, a state House committee recommended denying all such applications and forcing banks to organise under the general law. Despite the committee's recommendation, Massachusetts continued to provide special incorporation Acts. Contemporary bankers, as Johnson's 1850 Treatise makes clear, were unenthusiastic about free banking despite widespread public and legislative support. Bankers saw costs that elude historians. Future research should labour to reveal those costs.