Introduction
Schizophrenia is a devastating and disabling neuropsychiatric disorder. The neural mechanisms of this disorder have been attributed to structural and functional abnormalities of the brain (Ellison-Wright et al. Reference Ellison-Wright, Glahn, Laird, Thelen and Bullmore2008; Andreasen, Reference Andreasen2010; Andreasen et al. Reference Andreasen, Nopoulos, Magnotta, Pierson, Ziebell and Ho2011; Chan et al. Reference Chan, Di, McAlonan and Gong2011; Asami et al. Reference Asami, Bouix, Whitford, Shenton, Salisbury and McCarley2012; Liu et al. Reference Liu, Zhuo and Yu2016). The orbitofrontal cortex (OFC) has been implicated in multiple functions, including sensory integration and reward learning, cognitive flexibility, control of emotion, decision making, social behavior and mnemonic functions (Zald & Kim, Reference Zald and Kim1996; Kringelbach & Rolls, Reference Kringelbach and Rolls2004; Kringelbach, Reference Kringelbach2005). Most of these functions are impaired in schizophrenia (Mandal et al. Reference Mandal, Pandey and Prasad1998; Mullen et al. Reference Mullen, Burgess, Wallace, Palmer and Ruschena2000; Kester et al. Reference Kester, Sevy, Yechiam, Burdick, Cervellione and Kumra2006; Shad et al. Reference Shad, Keshavan, Tamminga, Cullum and David2007), which has been ascribed to the structural and functional deficits in the OFC in schizophrenia (Naudts & Hodgins, Reference Naudts and Hodgins2006; Sapara et al. Reference Sapara, Cooke, Fannon, Francis, Buchanan, Anilkumar, Barkataki, Aasen, Kuipers and Kumari2007; Baas et al. Reference Baas, Aleman, Vink, Ramsey, de Haan and Kahn2008; Dolan & Fullam, Reference Dolan and Fullam2009).
The human OFC is a rather heterogeneous region and can be further divided into several subregions based on the features in cytoarchitecture and connection (Ongur et al. Reference Ongur, Ferry and Price2003; Mackey & Petrides, Reference Mackey and Petrides2010; Kahnt et al. Reference Kahnt, Chang, Park, Heinzle and Haynes2012), which may account for functional diversity of the OFC (Zald & Kim, Reference Zald and Kim1996; Kringelbach & Rolls, Reference Kringelbach and Rolls2004; Kringelbach, Reference Kringelbach2005). Disconnection has been considered as an important feature of schizophrenia (Pettersson-Yeo et al. Reference Pettersson-Yeo, Allen, Benetti, McGuire and Mechelli2011). Several studies have suggested the reduction in the resting-state functional connectivity (rsFC) of the OFC in schizophrenia (Lynall et al. Reference Lynall, Bassett, Kerwin, McKenna, Kitzbichler, Muller and Bullmore2010; Hoptman et al. Reference Hoptman, Antonius, Mauro, Parker and Javitt2014; Pu et al. Reference Pu, Rolls, Guo, Liu, Yu, Xue, Feng and Liu2014). However, these studies have regarded the OFC as a single region, leaving the rsFC changes in the OFC subregions in schizophrenia largely unknown. The more precise information may improve our understanding of the role of the OFC in the physiopathology of schizophrenia.
In previous functional magnetic resonance imaging (fMRI) studies of the OFC, the use of the echo planar imaging (EPI) sequence to acquire imaging data is technically problematic because this sequence would inevitably introduce imaging signal dropout, geometric distortion, and susceptibility artifacts in the OFC region, which may lower our confidence in interpreting our findings. To reduce susceptibility artifacts in air/tissue interfaces, a sensitivity-encoded spiral imaging (SENSE-SPIRAL) technique has been proposed to acquire fMRI data (Pruessmann et al. Reference Pruessmann, Weiger, Scheidegger and Boesiger1999; Truong & Song, Reference Truong and Song2008). This technique can improve the functional imaging quality of the OFC and make the rsFC analysis of the OFC more reliable than the EPI sequence.
In this study, we used the SENSE-SPIRAL technique to acquire the resting-state fMRI data to investigate the rsFC changes of the OFC subregions in schizophrenia. The OFC subregions were defined according to a previous parcellation study of the OFC based on the structural imaging (Liu et al. Reference Liu, Qin, Qi, Jiang and Yu2015b ). Two potential influential factors were also considered: the effect of cortical atrophy and the effect of the global signal regression (GSR) (Yang et al. Reference Yang, Murray, Repovs, Cole, Savic, Glasser, Pittenger, Krystal, Wang, Pearlson, Glahn and Anticevic2014).
Materials and method
Participants
A total of 98 right-handed schizophrenia patients and 102 sex-, age- and handedness-matched healthy controls were recruited in this study. Diagnoses for schizophrenia patients were confirmed using the Structured Clinical Interview for DSM-IV. All the participants were aged from 18 to 55 years. Exclusion criteria for all participants were MRI contraindications, poor image quality, presence of a systemic medical illness or CNS disorder, history of head trauma, and lifetime history of substance abuse (determined by self-report of participants). Additional exclusion criteria for healthy controls were history of any Axis I or II disorders, a psychotic disorder and first-degree relative with a psychotic disorder. The Positive and Negative Syndrome Scale (PANSS; Kay et al. Reference Kay, Fiszbein and Opler1987) was used to quantify the clinical symptoms of schizophrenia patients. This study was approved by the Medical Research Ethics Committee of Tianjin Medical University General Hospital, and all participants provided written informed consent.
Imaging data acquisition
MRI was performed using a 3.0-T MR system (Discovery MR750, General Electric, USA). Tight but comfortable foam padding was used to minimize head motion, and earplugs were used to reduce scanner noise. Sagittal 3D.
T1-weighted images were acquired by a brain volume sequence with the following scan parameters: repetition time (TR) = 8.2 ms; echo time (TE) = 3.2 ms; inversion time = 450 ms; flip angle (FA) = 12°; field of view (FOV) = 256 mm × 256 mm; matrix = 256 × 256; slice thickness = 1 mm, no gap; and 188 sagittal slices. Two sets of resting-state fMRI data were acquired. A gradient-echo single-shot EPI sequence was performed with the following parameters: TR/TE = 2000/45 ms; FOV = 220 mm × 220 mm; matrix = 64 × 64; FA = 90°; slice thickness = 4 mm; gap = 0.5 mm; 32 interleaved transverse slices; 180 volumes. A SENSE-SPIRAL sequence was performed with the following parameters: TR/TE = 1400/30 ms; FA = 60°, acceleration factor = 2. The FOV, matrix, slice thickness, gap, and slice number were the same as the EPI sequence. During these fMRI scans, all subjects were instructed to keep their eyes closed, to relax and move as little as possible, to think of nothing in particular, and to not fall asleep.
Definition of OFC subregions
The OFC subregions for the rsFC analysis were defined according to a previous parcellation study of the OFC based on the artifact-free structural imaging (Liu et al. Reference Liu, Qin, Qi, Jiang and Yu2015b ). The human OFC was parcellated into 10 symmetrical subregions, including the anterior (OFCa), medial (OFCm), posterior (OFCp), intermediate (OFCi), and lateral (OFCl) subregions in each hemisphere (Supplementary Fig. S1).
Image quality assessments
Image quality of the OFC was compared between the EPI and SENSE-SPIRAL sequences, including the relative signal intensity (rSI), distortion, signal-to-noise ratio (SNR), and variance coefficient of the signal intensity. The specific methods are provided in Supplementary Material and the results are show in Supplementary Table S1 and Supplementary Figs S2–S4. Although the SENSE-SPIRAL sequence had lower SNR, this sequence showed less distortion, higher rSI and lower variance coefficient of SI in several OFC subregions than the EPI sequence. These results indicate that the SENSE-SPIRAL sequence is more suitable for imaging the OFC than the EPI sequence. To further exclude the possible effect of signal loss on our results, we excluded subjects whose rSI in any OFC subregion was <0.5.
Gray-matter volume (GMV) calculation
The GMV of each voxel was calculated using Statistical Parametric Mapping software (SPM8; http://www.fil.ion.ucl.ac.uk/spm/software/spm8/). The structural MR images were segmented into gray matter (GM), white matter and cerebrospinal fluid using the standard unified segmentation model. After an initial affine registration of GM concentration map into the Montreal Neurological Institute (MNI) space, GM concentration images were nonlinearly warped using diffeomorphic anatomical registration through the exponentiated Lie algebra (DARTEL) technique (Ashburner, Reference Ashburner2007) and were resampled to 1.5-mm cubic voxels. The GMV of each voxel was obtained by multiplying GM concentration map by the nonlinear determinants derived from the spatial normalization step. Finally, GMV images were smoothed with a Gaussian kernel of 6 × 6 × 6 mm3 full-width at half maximum (FWHM). After spatial preprocessing, the normalized, modulated, and smoothed GMV maps were used for statistical analysis.
fMRI data preprocessing
The two sets of resting-state fMRI data were preprocessed using SPM8 with the same procedures. The resting-state fMRI data were preprocessed in the following steps. The first 10 volumes from each subject were discarded to allow the signal to reach equilibrium and to allow the participant to adapt to the scanning noise. The remaining 240 volumes were corrected for the acquisition time delay between slices. Rigid realignment was then performed to estimate and correct for the motion displacement. Three schizophrenia patients were excluded because of excessive head motion; the remaining subjects’ fMRI data were within the defined head motion thresholds (translational or rotational motion parameters lower than 2 mm or 2°). We also calculated frame-wise displacement (FD), which indexes the volume-to-volume changes in head position (Power et al. Reference Power, Barnes, Snyder, Schlaggar and Petersen2013). There was no significant difference in mean FD (t = 0.16, p = 0.872) between schizophrenia patients and healthy controls. Then nuisance covariates were regressed out from the motion corrected fMRI data, including the mean signals of whole brain, white matter and cerebrospinal fluid, six rigid motion parameters and their first-level derivatives, linear trends, and spike volumes that had FD >0.5. Because some recent studies suggested that the results without GSR may differ from the results with GSR in schizophrenia (Yang et al. Reference Yang, Murray, Repovs, Cole, Savic, Glasser, Pittenger, Krystal, Wang, Pearlson, Glahn and Anticevic2014), both the results with and without GSR were reported. The datasets were band-pass filtered with a frequency range of 0.01–0.08 Hz. A two-step co-registration method was used to transform the regressed fMRI data into the MNI space. First, the mean realigned fMRI images were affinely (12 parameters) co-registered with individual structural images; then the structural images were affinely (12 parameters) co-registered with the standard MNI T1-weighted template. The generated parameters for these two co-registration steps were used to normalize the regressed fMRI data. The normalized fMRI data were resampled into a voxel size of 3 × 3 × 3 mm3. Finally, the normalized fMRI volumes were smoothed with a Gaussian kernel of 6 × 6 × 6 mm3 FWHM.
The rsFC patterns of OFC subregions
After OFC subregions were normalized to the MNI space, we conducted seed-based rsFC analysis with the following procedures. For each individual dataset, Pearson's correlation coefficients between the mean time series of each seed and time series of each voxel in other parts of the brain were computed and converted to z values using Fisher's r-to-z transformation to improve the normality (Liu et al. Reference Liu, Xie, Wang, Guo, Fouche, Long, Wang, Chen, Li, Duan, Zhang, Qiu and Chen2015a ). To show rsFC pattern of each OFC subregion, individuals’ z values of each seed were separately entered into a one-sample t test in a voxel-wise manner using SPM8. A false discovery rate (FDR) correction with p < 0.05/10 =0.005 was used to identify brain regions that showed significant positive correlations with each OFC subregion. The negative correlations may be caused by GSR, and they might not reflect true neural activity (Weissenbacher et al. Reference Weissenbacher, Kasess, Gerstl, Lanzenberger, Moser and Windischberger2009). To avoid misleading readers, we only focused on positive correlations. We used paired t tests to compare voxel-wise connectivity differences between every two of OFC subregions (FDR correction). Because we only interested in connectivity differences between OFC subregions at the same hemisphere, the paired t test was applied to the left and right OFC subregions, respectively. To account for these additional 20 comparisons, we used a FDR-corrected p value of 0.05/20 = 0.0025 to correct for multiple comparisons.
We also generated fingerprints to quantitatively show connectivity differences across OFC subregions. The detailed methods are provided in the Supplementary material. We designed a bootstrap analysis to verify the consistency of these connectivity patterns over subjects. For each OFC subregion, we performed resampling 1000 times, and then computed the mean overlap ratio and standard deviation of its connectivity maps. Moreover, to test the effect of distance factor to the connectivity pattern, we reconstructed these connectivity maps by multiplying the square root of Euclidian distance for each OFC subregion.
Intergroup rsFC differences of OFC subregions
We identified brain regions that are positively correlated with OFC subregions in schizophrenia patients and healthy controls, respectively. We then transformed these connectivity maps into binary masks. For each OFC subregion, the connectivity mask from patients and that from controls were merged into one union mask. In this union mask, each voxel was significantly correlated with the OFC subregion at least in one of two populations. This union mask was used to define the spatial range for intergroup comparisons. For GSR data, after controlling for the effects of age and gender, we performed voxel-wise intergroup comparisons using two-way repeated measures ANOVA with diagnostic group and OFC subregion as two factors. We only focused on the group × subregion interaction effect (p < 0.05, FDR correction). If there were significant interactions, post-hoc analysis were performed to identify specific OFC subregion's connectivity that showed significant intergroup differences (p < 0.05, Bonferroni correction).
GMV analysis
We extracted GMV of each OFC subregion and compared between the two groups using a two-sample t test. Multiple comparisons were corrected using the Bonferroni method with a significant threshold of p < 0.05.
The effect of GMV atrophy on the rsFC alterations
To test the effect of GMV atrophy on the rsFC alterations of the OFC subregions, we extracted each rsFC of the OFC subregions with significant intergroup differences in the voxel-based analysis. Then we compared intergroup differences in these rsFCs with and without GMV correction.
Correlations between the rsFC alterations and clinical parameters
To test whether rsFCs of the OFC subregions with significant intergroup differences were correlated with clinical variables, we extracted these rsFCs and calculated Spearman's correlation coefficients between these rsFCs and clinical parameters (i.e. PANSS scores, illness duration, and antipsychotic dosage) (p < 0.05, uncorrected).
Ethical standards
The authors assert that all procedures contributing to this work comply with the ethical standards of the relevant national and institutional committees on human experimentation and with the Helsinki Declaration of 1975, as revised in 2008.
Results
Demographic and clinical characteristics
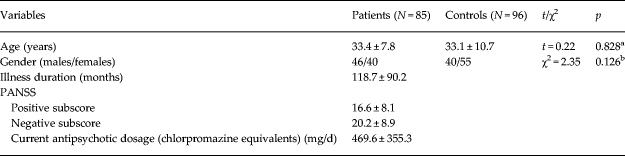
After excluding subjects without enough signal intensity in the OFC and those with an excessive head motion, a total of 86 schizophrenia patients and 95 healthy controls were included in the further analysis. The demographic and clinical characteristics of these subjects are shown in Table 1. There were no significant intergroup differences in sex (χ2 = 2.35, df = 1, p = 0.126) and age (t = 0.22, df = 179, p = 0.828). Eighty-one patients were receiving treatment with one or more atypical antipsychotics, and the remaining five patients had never received any medications.
Demographic and clinical characteristics of schizophrenia patients and healthy controls

N, Number; PANSS, Positive and Negative Syndrome Scale; s.d., standard deviation.
The data are shown as the mean ± s.d.
a Two-sample t test was used to test the difference in age between the two groups.
b χ2 test was used to test the difference in gender between the two groups.
The rsFC patterns of the OFC subregions
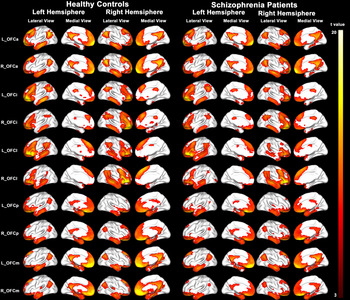
The rsFC maps of the OFC subregions in healthy controls and schizophrenia patients are shown in Fig. 1. There were significant differences in rsFC patterns between any two subregions (Supplementary Fig. S5). The fingerprints showed specific connectivity pattern for each OFC subregion (Supplementary Fig. S6). Here, we only described the main connectivity pattern of each OFC subregion. Both the OFCa and OFCm connected with the posterior cingulate cortex (PCC), anterior cingulate cortex (ACC), and medial prefrontal cortex (MPFC). The OFCa also connected with the angular gyrus (AG). The OFCp connected with the parahippocampus (PH) and temporal pole (TP). The OFCi connected with the inferior frontal gyrus (IFG), middle frontal gyrus (MFG), inferior temporal gyrus (ITG), and inferior parietal lobule (IPL). The OFCl connected with the insular (Ins), IFG, and TP. Bootstrap analysis showed that the mean overlap ratios of each OFC subregion's connectivity were >80% except for the bilateral OFCp (Supplementary Fig. S7). Although distance factor may alter specific connectivity strengths, both voxel-wise connectivity map (Supplementary Fig. S8) and fingerprint (Supplementary Fig. S9) of each OFC subregion showed similar connectivity patterns with original ones when multiplying the square root of Euclidian distance. We overlaid the rsFC maps of schizophrenia patients onto those of healthy controls. We found that both healthy controls and schizophrenia patients exhibited similar rsFC patterns for each OFC subregion (Supplementary Fig. S10). For a specific OFC subregion, the left and right seeds showed similar rsFC patterns.
The resting-state functional connectivity maps of the OFC subregions in healthy controls and schizophrenia patients. Only the positive connectivity map of each subregion is depicted (p < 0.05/10 = 0.005, FDR correction). L, left; R, right; OFC, orbitofrontal cortex; OFCa, anterior OFC; OFCi, intermediate OFC; OFCl, lateral OFC; OFCm, medial OFC; OFCp, posterior OFC.

Intergroup rsFC differences of the OFC subregions with GSR
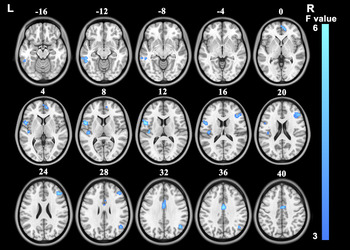
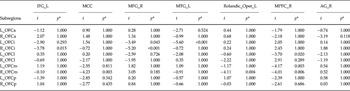
For GSR data, there were seven brain regions showing significant group × subregion interaction, including the middle cingulate cortex (MCC), the left IFG, MTG and Rolandic operculum (RO), and the right AG, MFG and MPFC (Fig. 2). Post-hoc comparisons are shown in Table 2. In schizophrenia patients, the left OFCi showed significant reduced rsFC with the left MTG and the right MFG. The right OFCi showed reduced rsFC with the left IFG and the right MFG. Both the left OFCl and the bilateral OFCm showed reduced rsFC with the right MPFC. The right OFCm also showed reduced rsFC with the MCC and the left RO.
Brain regions whose connectivity with OFC subregions shows significant group × subregion interaction with global signal regression (FDR corrected, p < 0.05). L, left; R, right.

Post-hoc comparisons (patients v. controls) of the resting-state functional connectivity of the orbitofrontal subregions with global signal regression

L, left; R, right; AG, angular gyrus; IFG, inferior frontal gyrus; MCC, middle cingulate cortex; MFG, middle frontal gyrus; MPFC, medial prefrontal cortex; MTG, middle temporal gyrus; OFC, orbitofrontal cortex; OFCa, anterior OFC; OFCi, intermediate OFC; OFCl, lateral OFC; OFCm, medial OFC; OFCp, posterior OFC; Rolandic_Oper, Rolandic operculum.
*p values are those after Bonferroni correction.
Intergroup rsFC differences of the OFC subregions without GSR
To test the effect of GSR, we also repeated two-way repeated-measures ANOVA (p < 0.001, uncorrected) for fMRI data without GSR. There were seven brain regions showing significant group × subregion interaction, including the MCC, the left IFG, MTG, AG, Ins and RO, and the right MFG (Supplementary Fig. S11).
Consistent rsFC differences of the OFC subregions with and without GSR
Although it is a matter of debate on the correctness of GSR in the rsFC comparisons between schizophrenia patients and healthy controls, we found some consistent findings across the two methods. We overlaid the brain regions showing significant group × subregion interaction with GSR onto those without GSR. From the overlap map, there were five regions consistently showing significant interaction (Supplementary Fig. S12), including the MCC, the left IFG, MTG, RO, and the right MFG.
Volumetric alterations of the OFC subregions
Compared with healthy controls, the schizophrenia patients had significantly reduced GMV (p < 0.05, Bonferroni corrected) in all 10 OFC subregions (Supplementary Table S2).
The effect of the GMV on rsFC of the OFC subregions
GMV alterations may affect the results of the rsFC analysis. In order to exclude the effect of the GMV, we repeated the rsFC analysis with GMV correction. Compared with the results without GMV correction, all brain regions showing consistent rsFC reduction also remained statistically significant after GMV correction (Supplementary Table S3).
Correlations between rsFC of the OFC subregions and clinical parameters
In schizophrenia patients, we performed a partial correlation analysis to examine the correlations between these changed rsFCs and clinical parameters (i.e. duration of illness, PANSS positive scores, PANSS negative scores and current antipsychotic dosage in chlorpromazine equivalents). However, we did not find any significant correlations between rsFC alterations and those clinical parameters.
Discussion
In this study, we systematically investigated rsFC changes of the OFC subregions in schizophrenia. We found that three OFC subregions consistently showed decreased functional connectivity, suggesting that the OFC has a selective functional disconnection in schizophrenia.
Method consideration
In contrast with most previous resting-state fMRI studies that acquired data using an EPI sequence, we also collected fMRI data using a SENSE-SPIRAL sequence, which has been proposed to be superior to the EPI sequence in terms of imaging quality (Truong & Song, Reference Truong and Song2008). The SENSE is a parallel imaging method and has been used to shorten scan time and to reduce susceptibility-induced artifacts (Pruessmann et al. Reference Pruessmann, Weiger, Scheidegger and Boesiger1999). As expected, we found that fMRI data acquired with the SENSE-SPIRAL sequence exhibited less signal loss and distortion in the OFC regions compared with those acquired with the EPI sequence. Unfortunately, the SNR penalty is an inevitable drawback in the SENSE sequence. The SNR in SENSE images is limited by the square root of the acceleration factor. The geometry factor and k-space sampling patterns may also result in the decrease of SNR (Pruessmann et al. Reference Pruessmann, Weiger, Scheidegger and Boesiger1999). Hence the SENSE-SPIRAL sequence is appropriate only when the need for image quality outweighs SNR concerns. Consequently, fMRI data acquired with the SENSE-SPIRAL sequence were used for the rsFC analysis in the study.
The global signal has traditionally been thought to reflect non-neuronal noise and has been commonly regressed out during the fMRI processing. The GSR has found to improve the anatomical specificity of rsFC findings (Fox et al. Reference Fox, Zhang, Snyder and Raichle2009) and to enhance the detection of system-specific correlations and correspondence between resting-state correlations and anatomy (Fox et al. Reference Fox, Zhang, Snyder and Raichle2009). Recently, two studies have shown a huge effect of the GSR on the observed rsFC changes in schizophrenia (Yang et al. Reference Yang, Murray, Repovs, Cole, Savic, Glasser, Pittenger, Krystal, Wang, Pearlson, Glahn and Anticevic2014; Wang et al. Reference Wang, Zhou, Zhuo, Qin, Zhu, Liu, Xu and Yu2015), suggesting that global brain signal may contain neurobiological meaningful information (Scholvinck et al. Reference Scholvinck, Maier, Ye, Duyn and Leopold2010). Therefore, we performed the rsFC analysis with and without GSR. Although more functional disconnections in schizophrenia were detected in data with GSR than in data without GSR, the most significant changes are highly consistent between the two preprocessing strategies. These findings suggest that the effect of the GSR is region-specific in schizophrenia. Conservatively, we only discuss the consistent findings of the rsFC analysis with and without GSR.
The GMV atrophy in multiple brain regions including the OFC has been consistently shown in schizophrenia (Baare et al. Reference Baare, Hulshoff Pol, Hijman, Mali, Viergever and Kahn1999; Herold et al. Reference Herold, Feldmann, Simon, Tenyi, Kover, Nagy, Varga and Fekete2009). In consistent with these previous findings, we also found GMV atrophy in all of the OFC subregions. One may suspect that the rsFC alterations of the OFC subregions may be secondary to the GMV atrophy. To exclude this possibility, we repeated the rsFC analysis with GMV correction. We found that all the previously changed rsFCs of the OFC subregions in schizophrenia also remained significant after GMV correction, suggesting that these rsFC changes are independent of GMV atrophy.
The selective functional disconnections of the OFC subregions
We found functional disconnection between the OFCi and DLPFC in schizophrenia. As shown in Fig. 1, the OFCi was closely correlated with brain regions of the frontal-parietal network, which is composed of the DLPFC and PPC and is involved in cognitive control (Dosenbach et al. Reference Dosenbach, Fair, Cohen, Schlaggar and Petersen2008; Zanto & Gazzaley, Reference Zanto and Gazzaley2013). Thus, our finding may represent functional disconnection within the prefrontal cognitive control system, which is consistent with the functional impairment of the DLPFC in schizophrenia (Barch & Ceaser, Reference Barch and Ceaser2012). The functional disconnection of the DLPFC has been related to executive dysfunction in schizophrenia (Su et al. Reference Su, Lan, Hsu, Biswal, Tsai, Lin and Lin2013) and genetic vulnerability for schizophrenia (Woodward et al. Reference Woodward, Waldie, Rogers, Tibbo, Seres and Purdon2009). Therefore, the OFCi-DLPFC functional disconnection may be associated with cognitive control impairment in schizophrenia.
The OFCi also functionally correlated with the anterolateral temporal cortex (Fig. 1), which may reflect the underlying anatomical connection of the uncinate fasciculus connecting the frontal and temporal cortices. Our finding of the functional disconnection between the OFCi and temporal cortex in schizophrenia may represent the fronto-temporal disconnection. This is in line with functional impairments in both of these regions in schizophrenia (Brown & Thompson, Reference Brown and Thompson2010; Guo et al. Reference Guo, Tang, Li, Zhang, Li, Sheng, Liu, Li and Wang2014a ). The uncinate fasciculus has been related to cognitive abilities, such as intelligence and memory in healthy subjects (Von Der Heide et al. Reference Von Der Heide, Skipper, Klobusicky and Olson2013). In schizophrenia, the white matter integrity reduction of the uncinate fasciculus is an important feature (McIntosh et al. Reference McIntosh, Munoz Maniega, Lymer, McKirdy, Hall, Sussmann, Bastin, Clayden, Johnstone and Lawrie2008; Wu et al. Reference Wu, Calhoun, Jung and Caprihan2015), which may account for our finding of the fronto-temporal functional disconnection.
We also found functional disconnection between the OFCm and the posterior part of MCC (pMCC) and RO in schizophrenia. These two regions belong to the sensorimotor network and subserve sensorimotor integration and motor control. They have been found to be impaired in schizophrenia (Kim et al. Reference Kim, Sui, Rachakonda, White, Manoach, Clark, Ho, Schulz and Calhoun2010; Yu et al. Reference Yu, Zhou, Liu, Jiang, Dong, Zhang and Walter2011; Hammer et al. Reference Hammer, Oranje, Skimminge, Aggernaes, Ebdrup, Glenthoj and Baare2013; Guo et al. Reference Guo, Kendrick, Yu, Wang and Feng2014b ; Behroozmand et al. Reference Behroozmand, Shebek, Hansen, Oya, Robin, Howard and Greenlee2015). Our finding of the functional disconnection between the right OFCm and the pMCC in schizophrenia is consistent with a previous study (Wang et al. Reference Wang, Zhou, Zhuo, Qin, Zhu, Liu, Xu and Yu2015). Thus, the functional disconnection between the right OFCm and the pMCC may represent the impairment of sensorimotor integration and motor control in schizophrenia. Besides, the RO and IFG were involved in speech production (Behroozmand et al. Reference Behroozmand, Shebek, Hansen, Oya, Robin, Howard and Greenlee2015). Our finding of the functional disconnection between the OFC subregions and these two regions in schizophrenia may represent the impairment of speech system.
Limitations
Several limitations in this study should be noted. First, most of these schizophrenia patients were receiving antipsychotic drug treatment, which may potentially influence on our findings, although no significant correlations were found between medication and rsFCs of the OFC in schizophrenia. Future studies with medication-naïve, first-episode schizophrenia patients are required to eliminate the medication effects and confirm the findings of this study. Second, in schizophrenia, we found changed rsFCs of the OFC subregions with multiple brain regions involved in cognitive and emotional processing. However, the lack of specific behavioral assessments may prevent us from investigating the functional relevance of these changes in schizophrenia.
Conclusion
Based on an improved imaging technique, a recently identified subregion model of the OFC, and appropriate validation approaches, we found that schizophrenia patients consistently and reliably showed functional disconnections in the bilateral OFCi and the right OFCm. These findings may not only confirm the previously proposed disconnection hypothesis of schizophrenia, but also improve our understanding of which and how OFC subregions are implicated in schizophrenia.
Supplementary material
The supplementary material for this article can be found at https://doi.org/10.1017/S0033291717000101.
Acknowledgements
This work was supported by grants from the National Natural Science Foundation of China (81425013, 91332113 and 81271551), and Tianjin Key Technology R&D Program (14ZCZDSY00018).
Declaration of Interest
None.