


Statement of Research Significance
Research Question(s) or Topic(s): Previous work has demonstrated that young deaf American Sign Language (ASL)-English bilinguals show Stroop effects when presented with American Sign Language stimuli, but no study has examined between-language Stroop effects, nor aging effects on the Stroop task in deaf signers. Main Findings: Presenting deaf signers with written English Stroop stimuli elicited larger Stroop effects in response times and errors compared to a within-ASL Stroop task, and older deaf participants showed larger Stroop effects than younger deaf participants, especially in English. Study Contributions: The current study is the first to examine both between-language and within-language Stroop effects using a naturalistic response mode for deaf participants (i.e., signing), and across a wide age range of deaf ASL-English bilinguals. This work constitutes a critical first step in determining potential diagnostic sensitivity of Stroop tests to cognitive decline in this population by demonstrating how testing language and aging modulate Stroop effects in deaf bilinguals.
Introduction
The Stroop task (Stroop, Reference Stroop1935) is one of the most widely studied experimental paradigms, giving insight into processes such as attentional control (MacLeod, Reference MacLeod1991) and automaticity in lexical access (Brown et al., Reference Brown, Joneleit, Robinson and Brown2002). Color Stroop interference refers to the robust phenomenon in which participants have difficulty ignoring the automaticity of reading instead of naming the ink color in which the word is written. For example, it is difficult to say red when the word blue is written in red ink. Stroop tasks have been used to probe interference effects across languages in bilinguals, for example, prompting individuals to look at a word written in Spanish, but to name the color of the ink in English; the results of these cross-language studies have informed our understanding of how two languages are represented and interact within a single cognitive system (Fang et al., Reference Fang, Tzeng and Alva1981; Rosselli et al., Reference Rosselli, Ardila, Santisi, Arecco, Salvatierra, Conde and Lenis2002; Tzelgov et al., Reference Tzelgov, Henik and Leiser1990). The extent to which Stroop effects transfer across languages is modulated by language proficiency and language dominance (Naylor et al., Reference Naylor, Stanley and Wicha2012; Rosselli et al., Reference Rosselli, Ardila, Santisi, Arecco, Salvatierra, Conde and Lenis2002; Suarez et al., Reference Suarez, Gollan, Heaton, Grant and Cherner2014). Stroop effects have also been useful for understanding aging-related changes in cognitive processing. Stroop effects are larger in older than in young participants (Cohn et al., Reference Cohn, Dustman and Bradford1984; Comalli Jr. et al., Reference Comalli, Wapner and Werner1962; Nicosia et al., Reference Nicosia, Cohen-Shikora and Balota2021), indexing aging-related declines in processing speed and attentional control. Production of errors in Stroop tasks is especially magnified in early stage Alzheimer’s dementia (AD; Balota et al., Reference Balota, Tse, Hutchison, Spieler, Duchek and Morris2010; Belleville et al., Reference Belleville, Rouleau and Van der Linden2006, Reference Belleville, Fouquet, Hudon, Zomahoun and Croteau2017), making the Stroop task clinically useful.
Despite the vast body of work investigating Stroop effects in hearing individuals across the lifespan (see MacLeod, Reference MacLeod1991 and Nicosia et al., Reference Nicosia, Cohen-Shikora and Balota2021 for reviews), little research has examined Stroop effects in deaf bilinguals who know ASL and English, and no studies have evaluated Stroop effects in older deaf signers. We can address several questions of interest by investigating Stroop performance in this unique group of deaf bimodal bilinguals, that is, deaf individuals who know a sign language and a spoken language and who may differ from unimodal bilinguals who know two spoken languages. These include theoretical questions about the automaticity of cognitive processing of sign languages, how testing language affects Stroop interference in different types of bilinguals, and the nature of possible interactions between aging and bilingualism on Stroop interference effects. These are critical considerations for evaluating if Stroop tasks are clinically useful in the diagnosis of cognitive decline in deaf signers, and for understanding this unique form of bilingualism.
Stroop effects in hearing unimodal bilinguals
In unimodal bilinguals who know two spoken languages, Stroop interference effects are often larger when the stimulus and response languages match (e.g., participants respond in Hebrew and the words are written in Hebrew) compared to when they mismatch (e.g., participants respond in Arabic and the words are written in Hebrew; Tzelgov et al., Reference Tzelgov, Henik and Leiser1990). The finding of stronger within-language than between-language Stroop effects is also more pronounced when the two languages do not share orthography. For example, Spanish-English bilinguals show more similarly sized within-language and between-language Stroop effects compared to Chinese-English bilinguals, who show much larger within-orthography Stroop effects than between-orthography Stroop effects (Fang et al., Reference Fang, Tzeng and Alva1981). These results suggest that there is greater competition between languages in bilinguals who use languages that rely on overlapping orthographies because the two languages engage the same script processing mechanisms. In contrast, bilinguals reading a logographic script (Chinese) do not experience as much competition from an alphabetic script (English), which leads to reduced Stroop effects between the two languages.
Language proficiency and dominance can also impact Stroop performance; unimodal bilinguals sometimes show greater Stroop interference in their more proficient or dominant language (Naylor et al., Reference Naylor, Stanley and Wicha2012), and Stroop interference effects increase with increasing proficiency level (Rosselli et al., Reference Rosselli, Ardila, Santisi, Arecco, Salvatierra, Conde and Lenis2002; Suarez et al., Reference Suarez, Gollan, Heaton, Grant and Cherner2014). In addition, Stroop tasks involve automatic processing (i.e., automatic lexical retrieval of the printed word) as well as cognitive control (i.e., ability to inhibit the automatic reading of the printed word), both of which can vary with proficiency in the testing language. Tzelgov et al. (Reference Tzelgov, Henik and Leiser1990) suggested that the relationship between language proficiency and Stroop interference may be U-shaped; some proficiency is needed to show any interference between languages, but at the highest level of proficiency bilinguals may be better able to control Stroop interference. They found larger within-language than between-language Stroop interference in balanced bilinguals, whereas in unbalanced bilinguals, Stroop effects were larger whenever stimuli were presented in the dominant language. Thus, Stroop effects could both under-or overestimate cognitive control abilities in bilinguals, depending on proficiency level and the language of administration.
Stroop effects in deaf signers
Deaf bilinguals differ from hearing bilinguals in many aspects of language use and exposure. Some deaf individuals use speech or lip reading to access English, but many use English primarily in the written modality, and many learn English through reading and writing. By contrast, hearing bilinguals typically learn a second language by hearing and speaking it (in addition to reading and writing it). Additional considerations are important for predicting how these factors may influence Stroop performance in deaf ASL-English bilinguals. ASL and other sign languages do not have a widely adopted written form, and consequently deaf bilinguals read and write in just one of their two languages. All of these factors potentially impact Stroop performance, yet few studies have investigated Stroop effects in this population.
Initial attempts to elicit Stroop effects in a sign language used static drawings of ASL color signs and asked deaf participants to sign the name of the drawing’s ink color, but these studies yielded inconclusive results with nonsignificant Stroop effects (Marschark & Shroyer, Reference Marschark and Shroyer1993; Marschark, Reference Marschark1988). We suggest that the null results found in these early studies were likely due to the use of static images. Movement is an essential feature of ASL color signs and without movement, the color sign drawings resemble ASL letter signs because most color signs have a handshape that represents the first letter of the English translation. For example, the sign YELLOW involves moving the Y handshape with a repetitive twisting movement, but a static Y handshape is the sign for the letter “Y”. Static drawings of letter names may simply not be sufficient to elicit activation of ASL color signs and thus are not appropriate stimuli for an ASL Stroop task.
To date only two studies elicited Stroop effects using dynamic videos of ASL color signs. Dupuis & Berent (Reference Dupuis and Berent2015) used videos of ASL signers from the torso up producing color signs, overlaid with a color that was either congruent or incongruent with the sign being produced. A small group of 10 deaf ASL signers (age not reported) completed two ASL Stroop tasks in which they were instructed to name the color of the signer while ignoring the sign that was produced; one task used button-pressed responses and one used signed responses. Regardless of response mode, participants were slower and less accurate when responding to incongruent trials (the hand color and the color sign were different) compared to congruent trials (the hand color and the color sign were the same), thus demonstrating significant Stroop effects for ASL. This result was taken as evidence for the automatic activation of the semantics of ASL signs, since participants experienced interference from the signed lexical items, even though they were instructed to ignore the meaning of the sign and respond only to the color (Dupuis & Berent, Reference Dupuis and Berent2015).
More recently, Bosworth et al. (Reference Bosworth, Binder, Tyler and Morford2021) tested 15 deaf ASL-English bilinguals, ages 19–39, using both ASL and English Stroop tasks with button-pressed responses. The color responses (blue, green, yellow, purple) were labeled on a keyboard with color patches that participants used to respond to either ASL signs or printed English words. For ASL, participants were shown dynamic videos of colored hands producing the ASL color signs, which were all produced in a neutral location with the same movement and differed only in handshape. For both languages, participants completed both a traditional Stroop interference task (i.e., they identified the color of the hand for signs, and the font color for English words), and a control task in which they indicated the color expressed by the sign or word. Both the ASL and English Stroop tasks exhibited robust Stroop effects. Additionally, within the ASL task, participants with higher ASL proficiency (measured by the ASL-Comprehension Test; Hauser et al., Reference Hauser, Paludneviciene, Riddle, Kurz, Emmorey and Contreras2016) exhibited larger ASL Stroop effects (English proficiency was not assessed). This result replicates the association between proficiency level and the magnitude of Stroop interference found in unimodal bilinguals (Rosselli et al., Reference Rosselli, Ardila, Santisi, Arecco, Salvatierra, Conde and Lenis2002; Tse & Altarriba, Reference Tse and Altarriba2012). Thus, this initial investigation into deaf ASL-English bilinguals’ Stroop performance reveals some similarities to the literature on Stroop effects in hearing unimodal bilinguals. However, additional work is needed with larger sample sizes to better understand Stroop performance in deaf ASL-English bilinguals (the previous studies included n = 10, Dupuis & Berent, Reference Dupuis and Berent2015; and n = 15 deaf participants, Bosworth et al., Reference Bosworth, Binder, Tyler and Morford2021). In addition, Bosworth et al. (Reference Bosworth, Binder, Tyler and Morford2021) did not investigate the impact of English proficiency on English Stroop performance in deaf bimodal bilinguals, nor did they investigate between language Stroop effects (i.e., English stimuli with ASL responses). Finally, neither study tested participants above the age of 40, leaving a critical gap in understanding of Stroop performance in older deaf bilinguals.
Current study
Investigating deaf bimodal bilinguals’ Stroop effects in both ASL and English presents an opportunity to explore a variety of theoretical questions regarding the impact of bilingualism, language proficiency, and modality on Stroop performance. The absence of a writing system for ASL makes it more difficult to predict the expected magnitude of within-language vs. between-language Stroop effects in deaf bilinguals. The lack of a shared orthographic system could suggest similar within-and between-language Stroop effects for ASL-English bilinguals, given the lack of competition at the perceptual form level. However, it is unknown how the cross-modal nature of the between-language task (i.e., signing the color of the printed English word) might influence Stroop effects.
Language proficiency may also be critical in assessing Stroop effects. Although many deaf individuals consider ASL to be their dominant language, they also typically use written English on a daily basis and may become skilled readers (e.g., Sehyr & Emmorey, Reference Sehyr and Emmorey2022). English also represents the main form of connection to the hearing-dominant society in which deaf people are immersed. Thus, if language proficiency is an important predictor of Stroop performance in this population, ASL-English bilinguals with high levels of proficiency in both of their languages might exhibit similar within-language and between-language Stroop effects, as has been reported for balanced hearing bilinguals (Rosselli et al., Reference Rosselli, Ardila, Santisi, Arecco, Salvatierra, Conde and Lenis2002).
Another factor that may be important to consider is the age of acquisition (AoA) of ASL which is variable across deaf individuals and has been shown to affect performance on some cognitive and linguistic tasks (see Mayberry, Reference Mayberry, Segalowitz and Rapin2002, for review). In contrast to hearing bilinguals, the AoA of ASL can reflect the timing of acquisition of a first language because deafness prevents early acquisition of spoken English, and most deaf people (90-95%) are born to hearing parents who do not know a sign language (Mitchell & Karchmer, Reference Mitchell and Karchmer2004). Deaf adults with a later ASL AoA have been shown to have poorer language skills in both English and ASL and are at risk for early language deprivation which impacts cognition and mental health (Hall et al., Reference Hall, Levin and Anderson2017). Thus, it is possible that individuals who acquired ASL later in life will show smaller Stroop effects as a result of lower levels of language proficiency. However, another possibility is that those with a later ASL AoA could show larger Stroop effects due to the detrimental effects of language deprivation on executive control abilities (Botting et al., Reference Botting, Jones, Marshall, Denmark, Atkinson and Morgan2017; Merchán et al., Reference Merchán, Fernández García, Gioiosa Maurno, Ruiz Castañeda and Daza González2022).
Finally, given the above-mentioned meta-analysis by Nicosia et al. (Reference Nicosia, Cohen-Shikora and Balota2021) which concluded that Stroop effects are significantly larger in older than in younger hearing adults, even after controlling for general aging-related slowing in response times we expected that older deaf bilinguals would show larger Stroop interference effects compared to younger deaf bilinguals. However, it is unknown whether aging effects on Stroop performance will be equal for both languages or larger in one language than the other.
To characterize Stroop performance in deaf ASL-English bilinguals across a wide age range we administered Stroop tasks using both ASL and English stimuli while allowing participants to respond with ASL (the preferred and dominant language of communication for many deaf individuals). We aimed to understand how testing language and modality influences Stroop performance, potentially revealing differences between how unimodal and bimodal bilinguals engage in cognitive control when asked to complete a between-language Stroop task. Results of this study may also inform clinical applications of the Stroop task with this population, particularly which language may be better for presentation of the task. Finally, understanding how aging impacts Stroop performance in deaf older adults is critical for interpreting Stroop performance as a possible diagnostic tool to identify the earliest signs of cognitive decline, and to differentiate changes associated with typical aging from those of disordered aging (e.g., AD) in deaf signers.
Methods
Participants
One hundred twelve deaf ASL-English bilinguals ranging in age from 21-88 completed two computerized Stroop tasks, one with videos of dynamic ASL color signs and one with printed English color words. Three participants were excluded from analysis due to self-reported difficulties with memory and struggles to complete many tasks presented on the day of examination. Sixty-four participants were tested in San Diego or Riverside, CA, and 45 were tested in Rochester, NY. Participants were recruited through presentations at Deaf community events, communication with Deaf senior citizen centers, and through flyers distributed at community events. Participants self-reported their race and ethnicity in a background questionnaire. The race breakdown for the participants was 87% White (95/109), 3.7% Black (4/109), 1.8% Asian (2/109), 5.5% reported more than one race (6/109), and 1.8% declined to answer (2/109). The ethnicity breakdown was 11% Hispanic or Latino (112/109), 85% not Hispanic or Latino (93/109), and 4% of participants reported that their ethnicity was unknown or declined to answer (4/109). The reported gender breakdown was 53% female (58/109), 45% male (49/109), and 1.8% preferred not to say (2/109). Participants were divided into four age groups: Young, ranging from age 21–45 (n = 34); Middle, from 46–63 (n = 17); Young-Old, from 64–70 (n = 29); and Older-Old, from 71–88 (n = 29). The cutoffs for the young and middle age groups followed those reported in our previous study on list memory performance in this population (Camilliere et al., Reference Camilliere, Emmorey, Hauser, Contreras, McKee and Gollan2026). The cutoffs for the young-old and older groups were determined by a median split for the group of participants who were 64 or older. This split also delineated the older group as above the age of 70, and some aging effects emerge more robustly after this age (Verhaegen & Poncelet, Reference Verhaegen and Poncelet2013; Wen & Dong, Reference Wen and Dong2023). All participants reported that they use ASL in their daily life and as a primary language.
This research protocol was approved by the University of California, San Diego Institutional Review Board in accordance with the Helsinki Declaration. All participants were given informed consent and were given monetary compensation for participation.
Procedure and stimuli
Participants completed the Stroop tasks as part of a larger battery of cognitive and language tasks for deaf ASL-English participants. Following a comprehensive language background and demographics questionnaire, participants completed three testing blocks. Stroop tasks were administered following a ten-item list memory task (conducted in the same language; Camilliere et al., Reference Camilliere, Emmorey, Hauser, Contreras, McKee and Gollan2026). Language of testing order (first, second) was counterbalanced across participants, such that they completed the memory and Stroop tasks in English then both tasks in ASL, or vice versa.
Testing was conducted in ASL by a signing researcher. The ASL and English Stroop tasks were presented via PsychoPy v2.2 (Peirce et al., Reference Peirce, Gray, Simpson, MacAskill, Höchenberger, Sogo, Kastman and Lindeløv2019) in a counterbalanced order between participants. Task instructions were given in both ASL and written English for each task, and participants were instructed to sign the color of the hand/font while ignoring the sign/word. Initially, participants were instructed to respond in ASL for the ASL task and were given a choice between speaking and signing their responses for the English task. This choice was necessary as many deaf individuals do not use speech in their everyday life, and speaking would be an unnatural response mode for those participants. After the first 25 participants (who all preferred to use ASL to respond), we decided it was not necessary to give the choice to respond in English and instructed participants to respond in ASL. Participants completed a 12-item practice block in each language to familiarize themselves with the procedure, during which they were given feedback on their performance. For each trial, participants were instructed to depress the spacebar until the stimuli appeared on the screen. As soon as they identified the color of the hand/font, participants were instructed to lift their hand and sign their response. The stimuli remained on the screen for 2 s or until the spacebar was released. Trials were self-paced, as trial initiation was triggered by the participant depressing the space bar. Reaction time was recorded from the stimulus onset to the response onset. Response onset was indicated by the release of the spacebar, which was taken as a proxy for the onset of sign production (see Emmorey et al., Reference Emmorey, Petrich and Gollan2012). Response accuracy was scored after the experiment by two ASL-fluent coders with reference to the video recording. Ten percent of data was independently scored by each coder to establish interrater reliability, and scores were in agreement for 98.9% of total trials. Trials were coded as errors if the participant produced an incorrect handshape or sign following the release of the spacebar. Hesitations, in which a participant released their hand from the space bar and produced a neutral handshape with a marked pause, were not scored as errors but were removed from reaction time analyses. Hesitations accounted for 2% of total trials.
ASL stimuli for this experiment were adapted from Bosworth et al. (Reference Bosworth, Binder, Tyler and Morford2021) and included three ASL color signs (BLUE, GREEN, and YELLOW) and their corresponding English words (see Figure 1). These ASL color signs are articulated in the same neutral space and differ only in handshape. English stimuli were presented in Impact font in the center of the screen. ASL videos were filmed and cropped to match the size of the English print stimuli (52 point font). Nine stimuli were created for each language, with three congruent color-word/sign stimuli and six incongruent color-word/sign stimuli. Each participant saw 120 trials in each language, with 84 congruent and 36 incongruent trials. This ratio was selected following a previous study that found larger Stroop effects in participants with MCI (Mild Cognitive Impairment) and AD (Alzheimer’s Disease) compared to healthy controls when fewer incongruent than congruent trials were presented (Bélanger et al., Reference Bélanger, Belleville and Gauthier2010).
ASL and English stimuli. The ASL signs show still images taken from the video stimuli of color signs used. The English stimuli matching the ASL signs are shown above each image. The top row (a) shows examples of congruent stimuli in ASL and English, and the bottom row (b) shows examples of incongruent stimuli in ASL and English.

As part of the larger testing battery, participants also completed several tests of ASL and English proficiency, including the American Sign Language Comprehension Test (ASL-CT; Hauser et al., Reference Hauser, Paludneviciene, Riddle, Kurz, Emmorey and Contreras2016) and the English version of the Multilingual Naming Test (MINT Sprint 2.0 version; Gollan et al., Reference Gollan, Garcia, Murillo, Vargas, Pulido and Salmon2024). The ASL-CT consists of 30 multiple choice questions probing understanding of ASL complex signs and sentences. The English MINT Sprint consists of 80 pictures that participants were asked to name in English with the option to speak, fingerspell, or write their responses.Footnote 1 Of the 107 participants with English MINT scores available, 87 chose to fingerspell (81%), 13 chose to speak (12%), and 7 chose to write (7%).
Results
Analysis plan
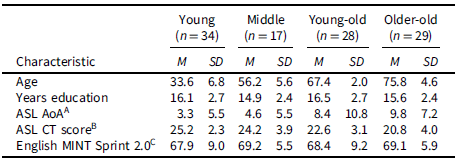
The participant characteristics shown in Table 1 reflect means and SDs after removing one participant who produced errors on 55% of incongruent trials in the ASL Stroop task (more than 5 SDs greater than the mean) and who was therefore excluded from the analyses. Preliminary exploratory correlations including the remaining n = 108 participants and are shown in Table 2. The outcome variables used to define Stroop performance were baseline-adjusted Stroop response times (RTs) [Baseline-adjusted Stroop RT = ((Incongruent RT – Congruent RT/Incongruent RT))] and Stroop error production (i.e., proportion errors on incongruent trials – proportion errors on congruent trials). These analyses revealed positive correlations between the size of English Stroop effects in baseline-adjusted RTs and age (see Figure 2), but no significant correlations with ASL Stroop effects in baseline-adjusted RTs, Stroop effects in error rates in either language, AoA of ASL, ASL proficiency (measured by the ASL Comprehension Test; Hauser et al., Reference Hauser, Paludneviciene, Riddle, Kurz, Emmorey and Contreras2016) or English proficiency (measured by the English MINT Sprint 2.0; Gollan et al., Reference Gollan, Garcia, Murillo, Vargas, Pulido and Salmon2024; Neveu et al., Reference Neveu, Garcia, Escobedo, Vazquez, Mejia, Hoversten and Gollan2025). See Figure 3 for an illustration of the null correlation between proficiency and Stroop performance.Footnote 2
Scatterplots illustrating the effects of age on baseline-adjusted Stroop interference effects in RTs with ASL versus with English stimuli (n = 108).

Scatterplots illustrating the null relationship between English proficiency and English baseline-adjusted Stroop interference effects (left) and the null relationship between ASL proficiency and ASL baseline-adjusted Stroop interference effects (right).

Participant characteristics divided into four age-groups

Table 1. Long description
The table presents participant characteristics divided into four age groups: Young, Middle, Young-old, and Old. It has 6 rows and 8 columns. The columns are labeled as Younger (n=34), Middle (n=17), Young-old (n=28), and old (n=29), with each age group having Mean (M) and Standard Deviation (SD) values. The rows are labeled with characteristics: Age, Years education, ASL AoA, ASL CT score, and English MINT Sprint 2.0. Each row provides the mean and standard deviation for each age group. For example, the Age row shows the mean age and standard deviation for each group, with the Younger group having a mean age of 33.6 and a standard deviation of 6.8, and the Older group having a mean age of 75.8 and a standard deviation of 4.6. The table also includes data on years of education, age of acquisition of American Sign Language (ASL AoA), ASL Comprehension Test (ASL CT) scores, and English proficiency measured by the English MINT Sprint 2.0.
AAoA = reported age of acquisition of ASL. BASL CT = ASL Comprehension Test. CTotal number of pictures named correctly in English (out of 80) on the Sprint 2.0 version of the Multilingual Naming Test (MINT).
Correlations between demographics, proficiency tests and Stroop measures (n = 108)

Table 2. Long description
The table presents correlations between various demographic and proficiency measures and Stroop performance metrics for 108 participants. It includes 11 rows and 11 columns. The row labels and column headers are identical and include Age, Education, ASL AoA, ASL CT, English MINT, ASL Stroop RT, English Stroop RT, and ASL Stroop errors. Each cell contains a correlation value. Notable trends include significant correlations such as a positive correlation between Age and ASL AoA (0.344***), a negative correlation between ASL CT and ASL Stroop RT (-0.361***), and a positive correlation between English MINT and ASL Stroop RT (0.209*). The table provides a detailed look at how different factors relate to Stroop task performance.
p ≤.001, **p ≤.01, *p < .05.
Note: AAoA = reported age of acquisition of ASL. BASL CT = ASL Comprehension Test. CTotal number of pictures named correctly in English (out of 80) on the Sprint 2.0 version of the Multilingual Naming Test (MINT). DStroop RTs reported here are baseline adjusted Stroop RT Effects ((Incongruent RT – Congruent RT/Incongruent RT)).
To further illustrate the effects of age and stimulus language we conducted 2 × 2 ANOVAs with RTs and errors as dependent variables, age as a continuous covariate, and stimulus language (ASL, English) and trial type (incongruent, congruent) as within-subjects factors. Finally, to ensure that the effects we observed were not driven by baseline differences in response speed, with baseline-adjusted Stroop effects as the dependent variable instead of raw RTs.
Response times (RTs)
The analysis of the raw RTs revealed robust Stroop effects; incongruent trials elicited slower RTs than congruent trials, F(1,104) = 168.7; η p 2 = 0.62; p < 0.001, a main effect of trial type. Additionally, participants responded more slowly to ASL than to English stimuli, F(1, 104) = 29.5; η p 2 = 0.22; p < 0.001, a main effect of language that was equivalent in size across ages, that is, there was no interaction between age and language, F < 1. Stimulus language also modulated the size of the Stroop effect, which was larger with English than with ASL stimuli, indicated by a significant interaction between trial type and language, F(1, 104) = 16.1; η p 2 = 0.13; p < 0.001. Older participants tended to respond more slowly overall, a significant main effect of age, F(1, 104) = 7.0; η p 2 = 0.06; p = 0.009. Additionally, Stroop effects were significantly larger in older than in younger participants, a significant interaction between trial type and age, F(1, 104) = 12.2; η p 2 = 0.11; p < 0.001, and the aging-related increase in Stroop interference effect was especially large with English compared to ASL stimuli, a significant three way interaction between trial type, age, and language, F(1, 104) = 6.3; η p 2 = 0.06; p = 0.01.
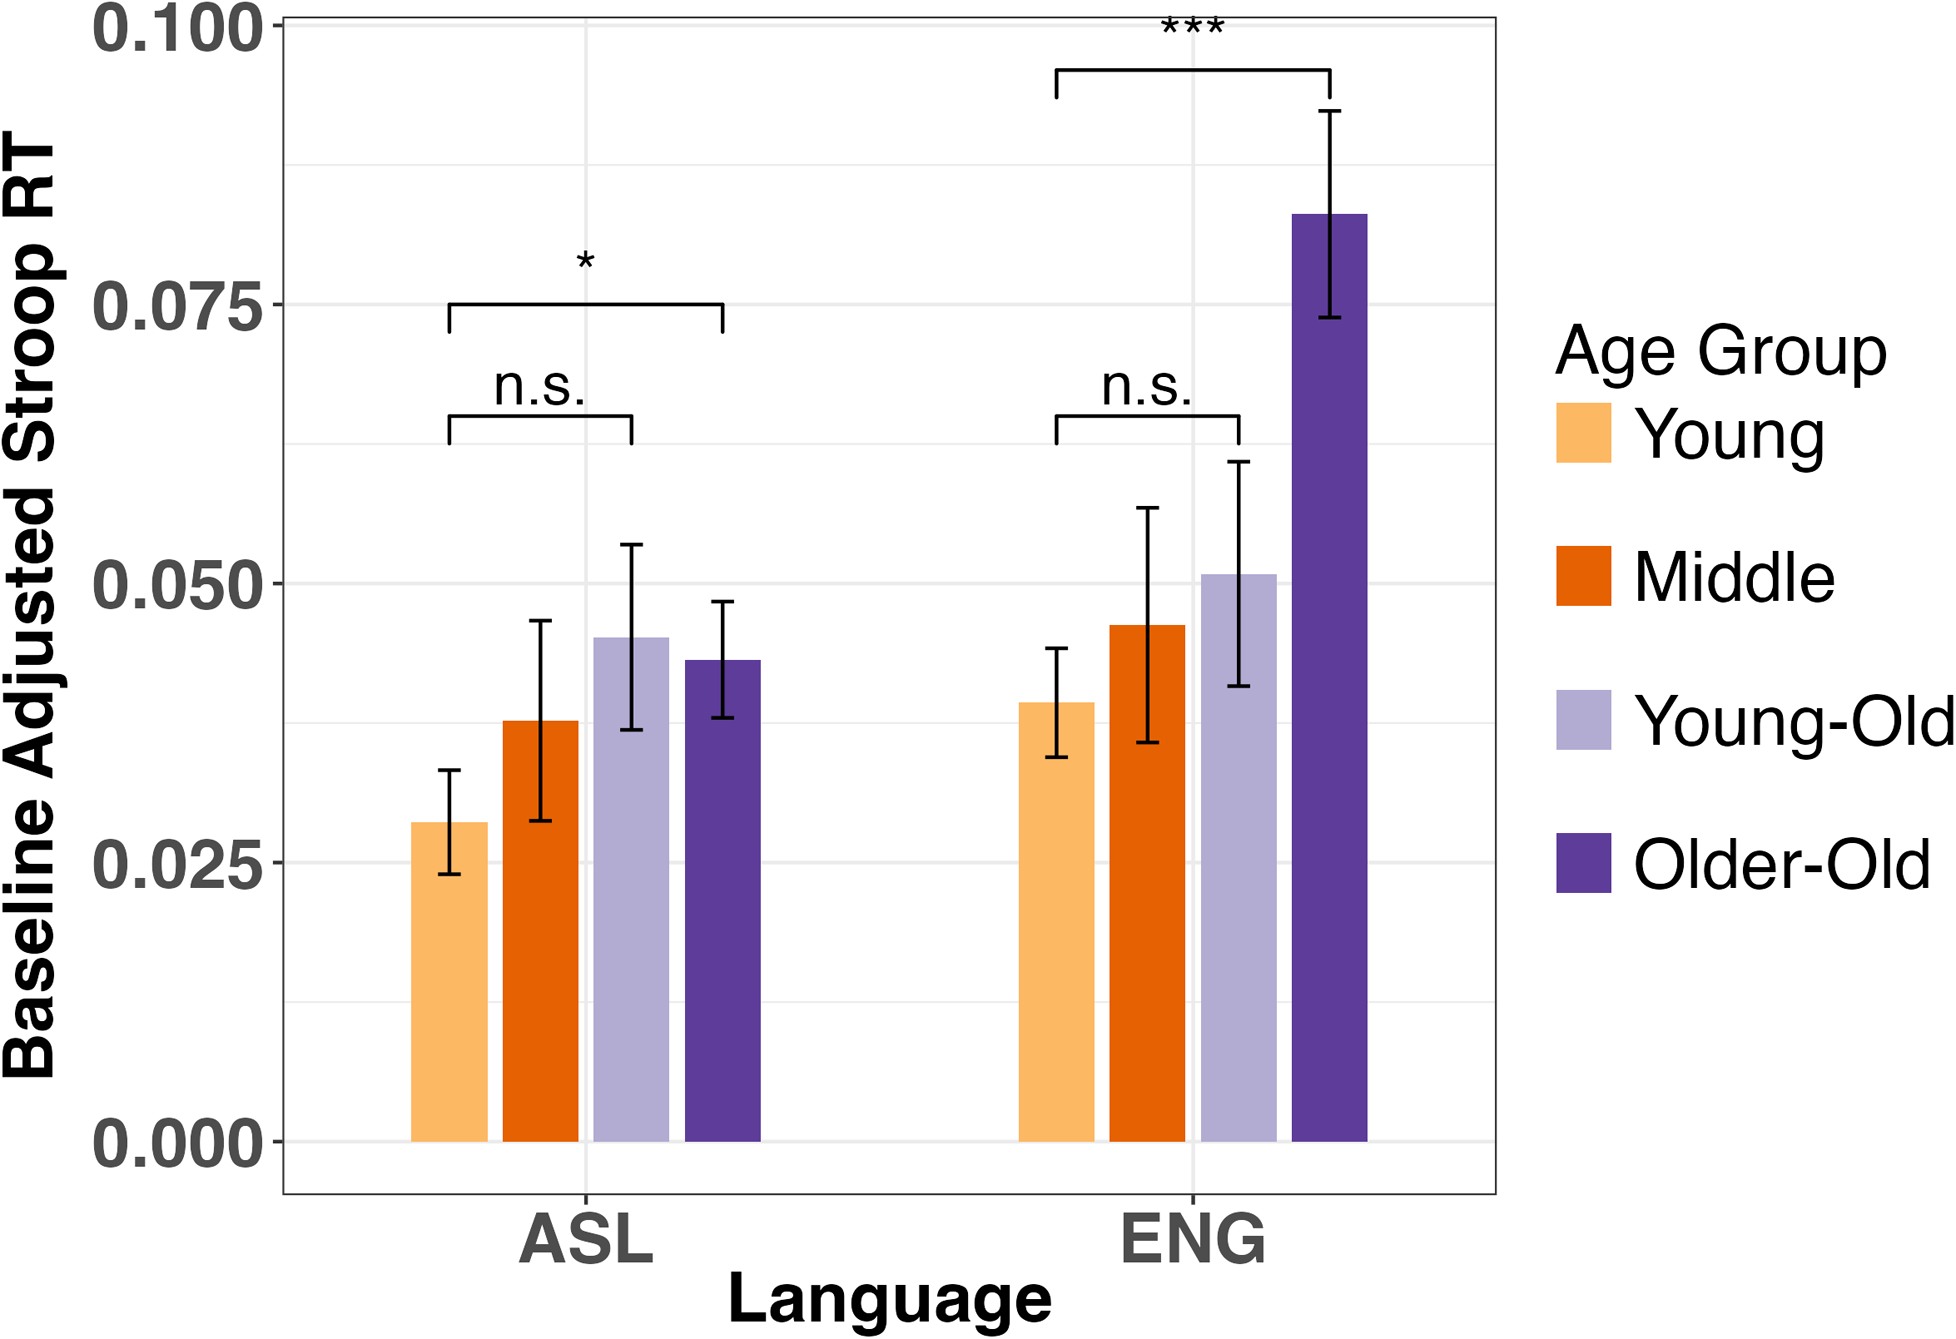
Analysis of baseline adjusted Stroop RT effects showed that the main effects survived the control for baseline response speed, including the effect of age, F(1, 104) = 12.3; η p 2 = 0.11; p < 0.001, and stimulus language, F(1, 104) = 20.7; η p 2 = 0.17; p < 0.001. In fact, Stroop effects were especially larger with English than with ASL stimuli, after controlling for baseline speed. Given that ASL elicited slower response times, Stroop effects were proportionally even smaller after adjusting for baseline response speed (see Figure 4). As reported for raw RTs, age effects were larger with English than ASL stimuli, that is, there was a significant interaction between age and language in baseline-adjusted Stroop interference effects, F(1, 104) = 5.8; η p 2 = 0.05; p = 0.018.
Baseline-adjusted Stroop interference effect in RTs in the four age groups (see Table 1) with ASL and English stimuli. Error bars denote standard error. ***p ≤.001, *p < .05.

Error rates
The analysis of error rates showed robust Stroop interference effects, evidenced by more errors on incongruent trials compared to congruent trials, F(1, 104) = 109.8; η p 2 = 0.51; p < 0.001, a main effect of trial type. Additionally, participants produced more errors when stimuli were presented in English versus in ASL, F(1, 104) = 3.9; η p 2 = 0.04; p = 0.05, a main effect of language. Young and older participants had similar error rates, F< 1, but participants showed larger Stroop effects with English than with ASL stimuli, producing a larger difference between incongruent and congruent trials with English than with ASL stimuli, F(1, 104) = 4.6; η p 2 = 0.04; p = 0.03, a significant interaction between trial type and language. None of the other interactions were significant (all Fs < 1 for interactions between age and language, age and trial type, and the 3-way interaction).
Discussion
Summary of key results
The present study revealed robust Stroop effects both within ASL (i.e., ASL stimuli with ASL responses) and between languages (i.e., English stimuli with ASL responses). However, Stroop effects were larger with English than with ASL stimuli for both older and younger participants, an effect of stimulus language that was significant in both RTs and errors. Additionally, participants responded more slowly when stimuli were presented in ASL compared to written English words, and the difference between languages in the size of Stroop interference effects was even larger after adjusting for baseline response speed. The age-related increase in Stroop effects in the RTs, and the age by language interaction, survived control for baseline speed. Overall, older participants showed significantly larger Stroop effects than younger participants in RTs (see Tables 2 and 3; Figures 2 and 4), but not in error rates (see Tables 2 and 3). However, with English stimuli there was a significant positive correlation between age and baseline adjusted Stroop RT effects, whereas this correlation was not significant with ASL stimuli (see Table 2). Finally, ASL and English proficiency did not appear to be related to Stroop performance, as there were no significant correlations between Stroop RTs or errors and scores on independent measures of ASL and English proficiency.
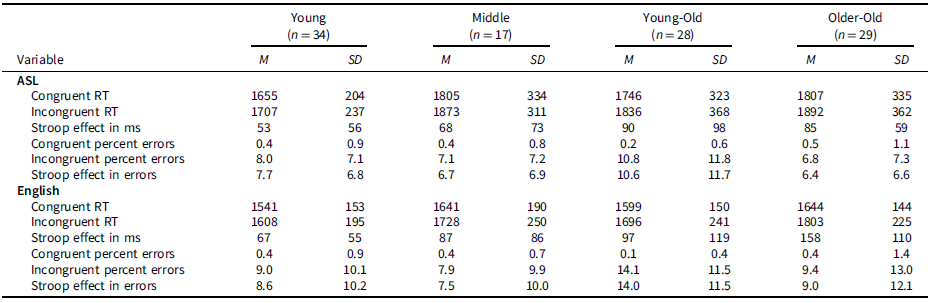
Means (and SDs) for raw RTs and percent errors by condition in each age group

Table 3. Long description
The table presents means and standard deviations for raw reaction times (RTs) and percent errors by condition in each age group. It is divided into two main sections: ASL and English. Each section contains data for four age groups: Younger, Middle, Younger-Old, and Older. The columns include Congruent RT, Incongruent RT, Stroop effect in milliseconds, Congruent percent errors, Incongruent percent errors, and Stroop effect in errors. For ASL, the Younger group has Congruent RT of 1655 ms and Incongruent RT of 1707 ms, with a Stroop effect of 53 ms. The Middle group has Congruent RT of 1805 ms and Incongruent RT of 1873 ms, with a Stroop effect of 68 ms. The Younger-Old group has Congruent RT of 1746 ms and Incongruent RT of 1836 ms, with a Stroop effect of 90 ms. The Older group has Congruent RT of 1807 ms and Incongruent RT of 1892 ms, with a Stroop effect of 85 ms. For English, the Younger group has Congruent RT of 1541 ms and Incongruent RT of 1608 ms, with a Stroop effect of 67 ms. The Middle group has Congruent RT of 1641 ms and Incongruent RT of 1728 ms, with a Stroop effect of 87 ms. The Younger-Old group has Congruent RT of 1599 ms and Incongruent RT of 1696 ms, with a Stroop effect of 97 ms. The Older group has Congruent RT of 1644 ms and Incongruent RT of 1803 ms, with a Stroop effect of 158 ms.
Note: RT = response time, ms = milliseconds, Stroop effect = Incongruent trials minus Congruent trials in raw RTs (for baseline adjusted Stroop effects see Figure 2).
Testing language effects on Stroop performance
Our observation of robust Stroop effects with ASL and with English stimuli (i.e., longer RTs and more errors on incongruent than congruent trials) replicate those of Dupuis & Berent (Reference Dupuis and Berent2015) for ASL and Bosworth et al. (Reference Bosworth, Binder, Tyler and Morford2021) for both ASL and English. These findings indicate that deaf ASL-English bilinguals rapidly and automatically access the meaning of both ASL signs and written English words. The present study was the first to implement a between-language condition for deaf bilinguals in which the response language did not match the language of the stimuli, revealing the presence of between-language Stroop effects in bimodal bilinguals and replicating the existence of between-language Stroop effects previously found in unimodal bilinguals (Rosselli et al., Reference Rosselli, Ardila, Santisi, Arecco, Salvatierra, Conde and Lenis2002; Tse & Altarriba, Reference Tse and Altarriba2012).
Surprisingly, the between-language (English-ASL) Stroop effect was also larger than the within-language (ASL-ASL) Stroop effect (in both RTs and errors), that is, Stroop effects were larger when deaf participants signed responses to English compared to ASL stimuli. This pattern of results has not been seen in previous studies of unimodal bilinguals who either showed equivalent Stroop effects within- vs. between-languages, or smaller between-language than within-language Stroop effects (Fang et al., Reference Fang, Tzeng and Alva1981; Tzelgov et al., Reference Tzelgov, Henik and Leiser1990). Bosworth et al. (Reference Bosworth, Binder, Tyler and Morford2021) did not test between-language Stroop effects – participants in that study responded with button presses for both the ASL and English stimuli. However, Stroop effects were larger with English than with ASL stimuli, which resembles the pattern of results reported here. A key difference between unimodal and bimodal bilinguals that might explain the differences in the relative size of Stroop effects with ASL vs English stimuli may be that processing written words – which are presented as a whole – is faster than processing signs which unfold more slowly over time. Indeed, ASL stimuli elicited slower responses overall compared to English stimuli. Recognition times for spoken words, which also unfold over time, are also typically longer than for printed words (Carver, Reference Carver1990). Dynamic ASL signs may allow more time to control interference effects when responding compared to static English words, thus leading to weaker within-language Stroop effects.
Larger Stroop effects in English than in ASL may also be due to increased competition between activated lexical items. Previous studies have shown that deaf signers automatically access ASL signs when reading printed English (Meade et al., Reference Meade, Midgley, Sevcikova Sehyr, Holcomb and Emmorey2017; Morford et al., Reference Morford, Wilkinson, Villwock, Piñar and Kroll2011; Saunders et al., Reference Saunders, Mirault and Emmorey2025). Thus, in the English-ASL condition participants may be suppressing competition from both the incongruent printed English word and its ASL translation. In contrast, for the within-language (ASL-ASL) condition, participants only need to inhibit producing the ASL color sign that was presented. Additionally, even if a deaf individual’s first language is ASL, their first written language is typically English, and all of their subsequent reading and writing is in English. This situation may create a different type of proficiency profile for deaf bilinguals compared to hearing bilinguals. In fact, several studies comparing skilled deaf and hearing readers have found that deaf signers are more efficient in processing print (Bélanger & Rayner, Reference Bélanger and Rayner2015; Cooley et al., Reference Cooley, Emmorey, Saunders, Sinclair, Stringer and Schotter2025; Schotter et al., Reference Schotter, Stringer, Saunders, Cooley, Sinclair and Emmorey2024), and make faster word and non-word decisions (Fariña et al., Reference Fariña, Duñabeitia and Carreiras2017; Lee et al., Reference Lee, Martinez, Midgley, Holcomb and Emmorey2022; Morford et al., Reference Morford, Occhino, Piñar, Wilkinson and Kroll2015). Thus, we speculate that deaf bilinguals make more errors and have longer RTs with English stimuli because they process English words faster than ASL signs, and this leads to early co-activation of ASL color sign translations which compete with the ASL signs that must be retrieved to name the ink color.
Finally, a critical difference between the current study and previous studies investigating Stroop performance in unimodal bilinguals is that the English task in the current study also represents a modality difference between the stimulus and the response, making this condition both a cross-modal and a between-language task. Thus, the differences seen in Stroop effects for the within-language (ASL-ASL) and between-language (English-ASL) conditions could be related to the modality difference in the stimuli (as argued above) or to the language modality difference for the between-language condition. A future study could control for modality by testing Stroop performance in deaf signers who are bilingual in two sign languages (e.g., ASL and DGS – German Sign Language). The between-language condition (ASL-DGS) for these bilinguals would be more comparable to unimodal between-language conditions, and the differences related to static text vs dynamic videos would be removed.
Aging effects on Stroop performance
Older participants showed larger Stroop effects in the analysis of both raw RTs and baseline-adjusted RTs compared to younger participants, aligning with previous research that has identified a robust aging related increase in Stroop effects (Nicosia et al., Reference Nicosia, Cohen-Shikora and Balota2021). As in previous studies with hearing participants, aging effects survived a control for baseline response speed, and unique to the present study, aging effects were larger in English than in ASL, possibly for some of the same reasons as noted above to explain why Stroop effects were larger in English. Finally, it is notable that older participants did not produce more errors on incongruent trials than younger participants. Stroop errors have been found to be particularly sensitive for predicting conversion to AD in hearing participants (Balota et al., Reference Balota, Tse, Hutchison, Spieler, Duchek and Morris2010). The lack of aging effects on error rates in the current sample raises questions to explore in future studies comparing patients to healthy controls to see if Stroop errors are predictive of cognitive decline in this population.
Proficiency and AoA effects on Stroop performance
Though previous studies with unimodal bilinguals (Rosselli et al., Reference Rosselli, Ardila, Santisi, Arecco, Salvatierra, Conde and Lenis2002; Tse & Altarriba, Reference Tse and Altarriba2012) and bimodal bilinguals (Bosworth et al., Reference Bosworth, Binder, Tyler and Morford2021) have found an association between language proficiency and the magnitude of the Stroop effect in reaction times, there was no evidence for this relationship in the current group of ASL-English bilinguals. Importantly, we used the same ASL proficiency measure as Bosworth et al. (Reference Bosworth, Binder, Tyler and Morford2021), and we included a similar (or wider) range in ASL-CT scores. Their scores ranged from 67–97% (M = 85%; SD = 31) whereas our participants’ scores ranged from 36–93% (M = 79%; SD = 12). The present study also had a much larger number of participants with ASL-CT scores (n = 108 versus n = 14, one participant from Bosworth et al., was missing an ASL-CT score). The absence of a relationship between proficiency level and Stroop effects is consistent with Tzelgov et al.’s (Reference Tzelgov, Henik and Leiser1990) suggestion that Stroop effects vary little in magnitude once a minimal level of proficiency level is reached as participants in the present study regularly used both ASL and English to communicate in their daily lives.
Age of acquisition (AoA) of ASL increased steadily across age groups from 3.3 years for the young participants to 9.8 years for the older participants (see Table 1). This difference most likely reflects changes in US education and in the acceptance of ASL as a language between the 1940s and 1950s when the oldest signers attended school and the 1990s/2000s when the youngest signers began pre-school (Humphries, Reference Humphries2013; Lane, Reference Lane1984). Bilingual pre-school and kindergarten programs were not available for older signers who typically learned ASL from deaf signing peers when they entered elementary or junior high school. Importantly, we found no effect of AoA on any of our Stroop effect measures (see Table 2), suggesting no cognitive impact from potential language deprivation that can occur with late AoA. However, AoA was correlated with ASL proficiency – those with a later AoA performed worse on the ASL Comprehension Test. This result is consistent with many studies that report poorer ASL skill with later AoA, even when acquisition occurs during childhood (see Mayberry & Kluender, Reference Mayberry and Kluender2018, for review).
Limitations
Although the current sample size is larger than those of any previous study investigating Stroop effects in ASL-English bilinguals, it is still relatively small and more research is necessary to determine if these findings hold across deaf participants with more varied backgrounds. The current sample was relatively homogenous in terms of education (i.e., primarily individuals with a high school education and some college education), race, and ethnicity (i.e., primarily individuals who identified as white). Additionally, while both measures of language proficiency are established, well-normed tasks, they are not directly comparable to each other, that is, picture naming (English MINT Sprint 2.0) vs. sentence comprehension (ASL-CT).
Finally, we examined aging effects as a continuous variable in our analyses, but for illustration purposes we also considered how Stroop effects varied in different age groups (see Tables 1, 3, and Figure 4). Though we had roughly equal numbers of young-old (ages 64–70) and older-old participants (ages 71–88), we had relatively fewer middle aged participants (ages 46–63), and our young participants tended to be older on average than in previous studies (which typically focused on undergraduates whereas our young group included participants up to 45 years old). Though young-old participants clearly showed trends towards larger Stroop effects than the young participants, the aging-related increase in Stroop effects was also noticeably much larger in the older-old group (see Figure 4). Additional work with more even numbers of participants within different age subgroups will be needed to determine how Stroop effects vary across the lifespan in deaf signers.
Conclusions
The results of the current study present a more in-depth understanding of deaf ASL-English bilinguals’ performance on Stroop tasks in each of their languages. Overall response times were slower with ASL stimuli, likely due to modality differences between dynamic sign videos and static printed words. However, participants demonstrated larger Stroop interference with English stimuli, in both reaction time and error rates. There was also an effect of aging on Stroop performance (reaction times) for both English and ASL, but the aging effect was larger in English, the non-dominant language for these participants, than it was in ASL. This pattern of results is unexpected given that standard recommended practice for unimodal bilinguals is to administer tests in the dominant language, which will generally be more sensitive for detecting group differences (Gollan et al., Reference Gollan, Garcia, Murillo, Vargas, Pulido and Salmon2024). Understanding how typical aging influences Stroop performance is a critical first step in determining whether a Stroop task can be used for identifying signs of cognitive decline within populations of deaf ASL-English bilinguals. Our finding that English stimuli elicited larger Stroop effects than ASL stimuli could be useful in clinical practice. Currently, English Stroop tasks are more easily accessible in that many clinicians already administer tasks with English Stroop stimuli, and the materials are easier to create given that they only require presenting static English words while ASL Stroop stimuli require presenting dynamic videos of signs. The current study suggests that, so long as participants are allowed to respond in ASL, it may be possible to detect aging effects using the Stroop task in English with deaf participants. However, to know which version of the Stroop test will be sensitive to cognitive decline in older deaf ASL-English bilinguals requires both longitudinal and patient studies.
Acknowledgements
This research was supported by NIH grant R01-AG074928. The authors have no conflicts of interest to disclose. We would like to thank Lucinda Farnady and Julie Fisher for their help with participant recruitment and data collection; Chehally Soto, Emma Kane, Hayden Orr, and Gigi Zheng for their help with data collection; and Caitlin Pearson for her help with data coding. We would also like to thank all of our deaf participants.




 Open access

