Introduction
Ants are dominant social insects that markedly affect the ecology and dynamics of the animal and plant populations with which they interact (Hölldobler and Wilson, Reference Hölldobler and Wilson1990). They are especially dominant in tropical regions where they are remarkably diverse, both on the ground and on vegetation (Belshaw and Bolton, Reference Belshaw and Bolton1994; Longino et al., Reference Longino, Coddington and Colwell2002; Weiser et al., Reference Weiser, Sanders, Agosti, Andersen, Ellison, Fisher, Gibb, Gotelli, Gove, Gross, Guenard, Janda, Kaspari, Lessard, Longino, Majer, Menke, McGlynn, Parr, Philpott, Retana, Suarez, Vasconcelos, Yanoviak and Dunn2010), and comprised over 90 % of the individuals sampled in the canopy of tropical rainforests (Tobin, Reference Tobin, Lowman and Nadkarni1995), with even greater diversity at ground level (Antoniazzi et al., Reference Antoniazzi, Viana-Junior, Pelayo-Martínez, Ortiz-Lozada, Neves, Leponce and Dáttilo2020).
Despite their ecological importance, few studies have been reported on the flight phenology of sexual morphs of Afrotropical ants. Light-trap studies have been reported for several species of Dorylinae (Bowden and Church, Reference Bowden and Church1973; Bowden and Morris, Reference Bowden and Morris1975; Haddow et al., Reference Haddow, Yarrow, Lancaster and Corbet1966; Leston, Reference Leston1979), the formicine Oecophylla longinoda (Latreille) and the ponerine Odontomachus troglodytes Santschi (Gibbs and Leston, Reference Gibbs and Leston1970) (as Od. haematodus Auctt., a misidentification corrected by Brown, Reference Brown1976). Bowden and Morris (Reference Bowden and Morris1975) trapped insects in Uganda nightly from January 1958 to December 1962 (Bowden, Reference Bowden1973) and collected over 62000 doryline males from four species. Bowden and Morris (Reference Bowden and Morris1975) correct an error in Bowden and Church (Reference Bowden and Church1973), noting that data analysed in the earlier paper refer to Dorylus fulvus (Westwood) alone and not to the combined data for the four species. Nevertheless, other than reporting that the ants were trapped in 44 of the 61 lunar months (lunations), or in almost ¾ of months, and that there were few nights in a year when none were seen at light, they make no further discourse on seasonal flight phenology, although such a publication was intended (Bowden and Church, Reference Bowden and Church1973).
A companion study to this (Bigger and Campbell, in preparation) reports the capture of 135 species over a 42-month nightly trapping period and the effects of rainfall and low monthly temperatures on the 65 commonest species, i.e. those with captures of 20+ individuals (Kaspari et al., Reference Kaspari, Pickering, Longino and Windsor2001). Here, Fourier analysis is used to identify key periodicities in catches of 25 of the most numerous ant species from that 42-month trapping period.
Materials and methods
A Rothamsted light-trap (Williams, Reference Williams1948) with a 150-W clear incandescent filament bulb was operated from 18:00 to 06:00 h nightly at the CRIG, from 10 October 1974 to 31 March 1978, a total of 1269 nights encompassing 43 lunations. Owing to power failures, the trap was inoperative on 11 nights (1975; 20-23/3, 8-9/7. 1976; 27/1, 16/9, 24/10. 1977; 18/1, 28/10). The collecting bottle contained absorbent paper impregnated with dichlorvos as a killing agent. The trap was sited in open ground 1.2 m above mown grass in the residential area of the CRIG, at least 20 m from the nearest buildings. The surrounding area comprised cacao plots under thinned secondary forest tree shade, open areas, other residential compounds and patches of farm-bush and secondary forest.
Winged ants were sorted, sexed, and identified daily under a stereo-zoom microscope. Non-definitive determinations of species are tabulated by ‘cf.,’ usually signifying that males have not been collected previously in association with either workers or gynes. Only named species and those named tentatively as such are reported here. All ant names have been updated to conform to those accepted currently (AntWeb, 2024).
Data analysis
Unless stated otherwise, analyses were performed with GenStat9 (Payne et al., Reference Payne, Harding, Murray, Soutar, Baird, Welham, Kane, Gilmour, Thompson and Webster2006) and ± values are SEM’s. Nightly catch data were transformed (Log10 (n + 1)) to stabilise variances and then smoothed by a seven-day-moving-average (7-d-m-a) to dampen high-frequency oscillations. The first day that a specimen was captured was taken as the start date for analyses of that species. Autocorrelations and periodograms were calculated from each transformed data set to identify major periodic behaviours (Bloomfield, Reference Bloomfield1976; Taylor, Reference Taylor1986). Ordinary least squares regressions of the computed coupled sine and cosine curves were used to decompose each major wavelength (Wi) in the time series, using programs listed in Bloomfield (Reference Bloomfield1976) and run in Fortran77. Where ‘best fit’ wavelengths were non-significantly different from their ecologically more meaningful parallels of 365, 182.5, and 29.5 days, i.e. annual, six-monthly, and lunar periodicities, the latter periodicities were imposed and regressions re-calculated.
The composite curves were fitted as:
 \begin{equation*}{y_{\text{t}}} = {{\mu }} + \mathop \sum \limits_{{\text{i = 1}}}^m {\text{COS}}\left( {{c_{\text{i}}}{\text{t}}} \right)*{a_{\text{i}}} + {\text{SIN}}\left( {{c_{\text{i}}}{\text{t}}} \right)*{b_{\text{i}}} + {\varepsilon _{\text{t}}}\end{equation*}
where  ${{\mu }} = {\bar y_{\text{t}}}$, m = total number of cosinusoids, c i = i’th frequency (i.e. 2π/Wi), t = dayno, and ε t is the t’th residual. With u i = COS(c it) and v i = SIN(cit), a i = Σ (u i y)/Σ u i2 and b i = Σ (v i y)/Σ v i2.
Where a significant lunar cycle was identified, responses to moon phase were assessed using Bowden’s (Reference Bowden1973) protocol in which the 29.5 day lunation is expanded into 32 groupings of moon phase within each of which average illumination and its distribution through the night are almost the same every month and for any site within 10° of the equator. Transformed catches from each night were placed in one of the 32 phase groups using the daily phase values published in the Astronomical Ephemeris and Nautical Almanac (Anon, 1974, 1975, 1976, 1977, 1978). Missing values were inserted as per Bowden (Reference Bowden1973) by averaging the catches for the preceding and succeeding phase groups. ANOVAs were made of transformed catches against phase group using data only from complete lunations in which the species was caught. Periodic regressions were then fitted to the mean catches from each of the 32 fractions using wavelengths of 32 and 16 phase groups (i.e. one lunation and a half lunation). Further terms were not used as together these two explained 84–99 % of variances.
Both sexual morphs of eight species were sufficiently numerous for comparisons of their separate responses to moon phase. Because the two sexes of each species differ in numbers caught (table 1) the whole species responses in the above analyses are biased positively towards the influence of the numerically dominant morph. Therefore, the data were standardised by transforming the respective catches of the two morphs to zero mean before comparing their responses. The respective curves were then compared by periodic regression analyses after testing for homoscedasticity of residual variances using a two-tailed F-test (Snedecor and Cochrane, Reference Snedecor and Cochrane1976).
Species and abundance of Formicidae collected in a light trap at Tafo, Ghana from 10 October 1974 to 31 March 1978

Results
The climate at the CRIG (6.22° N, 0.37° W), situated in Ghana’s moist semi-deciduous tropical forest zone is equatorial, with two rainy seasons annually, and mean annual rainfall above 1600 mm (Walker, Reference Walker and Wills1962). The main rains usually occur from March to June with the minor rains from September to November. They are separated by a short dry season around August and a longer dry period from December to February. In the 42-month study period, January 1975 was the only month with no rain.
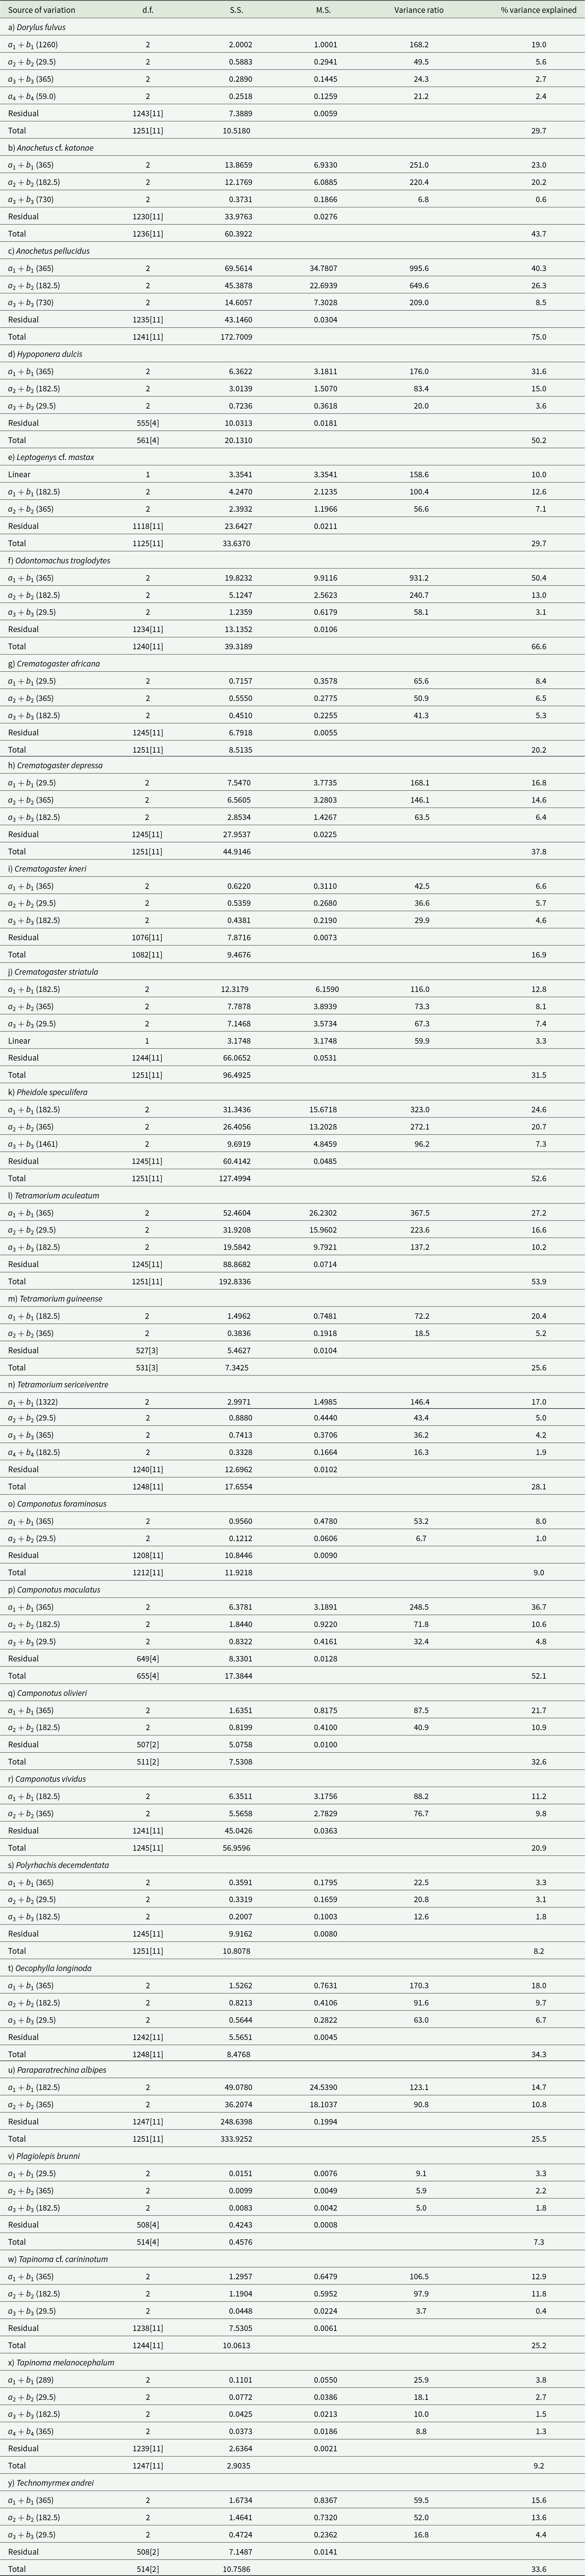
Twenty-five species (table 1) were sufficiently numerous for periodic least-square regression analyses of their population fluctuations. The best-fit models for these data comprised from two to four terms that accounted for between seven and 75 % of variances (table 2). All species exhibited circa-annual cycles, while all but Dorylus fulvus and Camponotus foraminosus also exhibited approximately semi-annual ones. Five species exhibited supra-annual rhythms, Pheidole speculifera and Tetramorium sericeiventre with cycles of four years and 1322 days, respectively, so longer than the 1269 day time series itself; while the strongest cycle for D. fulvus, which accounted for 19 % of the variance, was 1260 days. Both Anochetus cf. katonae and A. pellucidus exhibited wavelengths of two years which, although highly significant (P < 0.001), were the weakest terms for both species. Simple linear regression relationships were examined as possible alternatives to long-period cycles. Although that for D. fulvus was also highly significant (F1,1261 = 88.5), it explained 6.5 % of the variance compared with 19.0 % for the periodic model, so the latter was retained. Similar disparities in the significance of the 1316 and 1461 days’ period cosinusoids and simple linear regressions were apparent for Ph. speculifera and Tet. sericeiventre (11.8 vs 2.8 % and 17.0 vs 14.1 % of variance explained, respectively). By contrast, simple linear regressions provided as good or better fits than the 1541 and 855 day cycles calculated initially for Crematogaster striatula and Leptogenys cf. mastax (3.2 vs 2.7 % and 9.9 vs 2.8 % variance explained, respectively). This showed that these species were being caught in steadily increasing numbers throughout the three and a half year trapping period. The data for Tapinoma melanocephalum produced a highly significant (P < 0.001) 289 days’ cycle which, although the strongest term, explained less than 4 % of the total variance.
Anovas of fitted periodic models. Periods (days), i.e. 2π/ci in parentheses. Data are 7-d-m-a of Log10 (n + 1) where (n) is the nightly catch

Seventeen of the 25 species exhibited significant lunar periodicities. The exceptions were A. cf. katonae, A. pellucidus, L. cf. mastax (Ponerinae, fig. 1B, C, E), Ph. speculifera, Tet. guineense (Myrmicinae, fig. 2E, G), Camponotus olivieri, Ca. vividus, and Paraparatrechina albipes (Formicinae, fig. 3B, C and E). Dorylus fulvus also exhibited an additional significant (P < 0.001) two lunar term period, albeit its weakest term. Substituting fixed 365, 182.5, and 29.5 days for the close ‘best-fit’ terms reduced the % variances explained by an average 0.93, 0.85, and 0.81 %, respectively.
Total alates in nuptial flights and fitted Fourier curves (parameters from table 3). Dorylinae: (A) Dorylus fulvus. Ponerinae: (B) Anochetus cf. katonae, (C) A. pellucidus, (D) Hypoponera dulcis, (E) Leptogenys cf. mastax, (F) Odontomachus troglodytes. Rain = months with > 10 cm total rainfall.

Scatter plots of the transformed data and line plots of the periodic models (table 3) are presented in figs. 1–3 for the 21 species for which greater than 10 % of the variance was explained. That, thereby, excludes Ca. foraminosus, Polyrhachis decemdentata, Plagiolepis brunni, and Ta. melanocephalum for which there were no strong periodic cycles, despite some wavelengths having statistical significance (table 2), and all but Pl. brunni of these being caught throughout most of the trapping period. The influence of lunar illuminance on catches is small in magnitude relative to seasonal responses and is mostly obscured in the scatter plots, but is visible as high frequency oscillations in the accumulated periodic line-plots. They are particularly evident for Crematogaster spp. (fig. 2A–D) and Tetramorium spp. (fig. 2F–H) and least obvious for Ta. cf. carininotum (fig. 3F) for which only 0.4 % of the variance was attributable to lunar periodicity.
Total alates in nuptial flights and fitted Fourier curves (parameters from table 3). Myrmicinae: (A) Crematogaster africana, (B) C. depressa, (C) C. kneri, (D) C. striatula, (E) Pheidole speculifera, (F) Tetramorium aculeatum, (G) T. guineense, (H) T. sericeiventre. Rain = months with > 10 cm total rainfall.

Total alates in nuptial flights and fitted Fourier curves (parameters from table 3). Formicinae: (A) Camponotus maculatus, (B) C. olivieri, (C) C. vividus, (D) Oecophylla longinoda, (E) Paraparatrechina albipes. Dolichoderinae: (F) Tapinoma cf. carininotum, (G) Technomyrmex andrei. Rain = months with > 10 cm total rainfall.

Parameters for fitted models:  ${y_{\text{t}}} = {{\mu }} + \mathop \sum \limits_{{\text{i = 1}}}^m {\text{COS}}\left( {{c_{\text{i}}}{\text{t}}} \right)*{a_{\text{i}}} + {\text{SIN}}\left( {{c_{\text{i}}}{\text{t}}} \right)*{b_{\text{i}}} + {\varepsilon _{\text{t}}}$ where
 ${{\mu }} = \bar y$, n = total number of sinusoids, t = dayno, (start date is dayno 1), and εt is the t’th residual. Semi-amplitude ai = (ai2 + bi2)0.5

For all species other than D. fulvus and Ca. foraminosus, which lacked six-month cycles, the combination of a yearly and a six-month period cosinusoid produced two annual peaks, contemporaneous with the main (March–June) and minor (September–November) rainy seasons (figs. 1–3). The six-month period oscillations combined with annual peaks boosted the latter’s amplitudes. The semi-amplitudes for each term are presented in table 3 together with SE’s for all parameters. With the exception of Tetramorium guineense (fig. 2G), which was based on one full year’s data only, the second seasonal peak was generally the lower of the two. The four-term model for D. fulvus produced a single mid-year annual peak near the end of the main rains and lunar terms of similar semi-amplitudes (table 3).
The overlapping of the annual and semi-annual terms produced major peaks in March for Od. troglodytes, Cr. depressa, Tet. sericeiventre, Oe. longinoda, Ca. maculatus, and Ca. olivieri near the start of the main rains, in March–April for Hypoponera dulcis, albeit from one full year’s data only for the last three named. The peak for D. fulvus was in June, near the end of the main rains, while peaks for all other species were April–early May in the middle of the main rains (table 4). Confirmation of timings is needed for those species trapped for just one full year. The effects of lunar periodicity also disrupted the apparent seasonal peak timings for affected species creating bimodality in the two major peaks, and further affects them as the 12.36 lunations in each calendar year advances the lunar cycle by ca. 11 days in successive years. This matches the apparent ca.11 day precession in the seasonal peak for Dorylus fulvus, and similarly for the seasonal peaks for Crematogaster africana, Cr. depressa, Cr. striatula, and Oe. longinoda (table 4) which the models suggest all occur within 3 days of a new moon.
Predicted peak flight dates (d/m) from fitted models

The influence of moon phase on the 17 affected species is shown in fig. 4 which also includes the number of lunations (L) within which each species was trapped. The % of the lunar response variance explained is also presented, together with catch ratios for new moon: full moon and maximum: minimum phase group means (the latter in italics). Catches of D. fulvus, Od. troglodytes, Cr. africana, Cr. kneri, Ca. foraminosus, Ca. maculatus, Po. decemdentata, Oe. longinoda, Ta. melanocephalum, and Tec. andrei were all higher near new than full moon, while the opposite pattern was shown by H. dulcis. Catches of Cr. striatula, Tet. aculeatum, Tet. sericeiventre, and Pl. brunni were highest around the moon’s first quarter, but highest at the moon’s last quarter for Cr. depressa and Ta. cf. carininotum.
Average catches in relation to moon phase of A) Dorylus fulvus, B) Hypoponera dulcis, C) Odontomachus troglodytes, D) Crematogaster africana, E) C. depressa, F) C. kneri, G) C. striatula, H) Tetramorium aculeatum, I) T. sericeiventre, J) Camponotus cf. foraminosus, K) C. maculatus, K) Polyrhachis decemdentata, M) Oecophylla longinoda, N) Plagiolepis brunni, O) Tapinoma cf. carininotum, P) T. melanocephalum, Q) Technomyrmex andrei. Line is best fit from two Fourier terms. L = number of lunations, % of variance explained by the two Fourier terms, ratio of geometric catches at new vs full moon and ratio of highest and lowest geometric catches (in italics).

A notable feature for several species was a distinct dip in catches after the moon’s last quarter (fig. 4), most clearly observed among Crematogaster spp. and Tec. andrei, while catches of Ca. foraminosus increased at full moon from their lows at first and last quarters. However, combining catches for males and gynes as a whole species response as in fig. 4 confounds any sexual difference in responses. That is most clearly evident for the two Tapinoma spp. (fig. 5F, G), whereby peak catches were six phase groups later (about six days) for males than gynes of Ta. carininotum, and vice versa for Ta. melanocephalum. Separating the responses of the sexes shows that the dip in catches during the moon’s last quarter was predominantly a response of gynes among Cr. africana, Ta. carininotum, Ta. melanocephalum, and Tec. andrei, and by males of Oe. longinoda. Catches of gynes peaked ca. two phase groups later than males for Cr. africana, Cr. depressa, Tet. sericeiventre, Oe. longinoda, and Tec. andrei.
Deviations from mean catches in relation to moon phase of gyne (●) and male (∎), A) Crematogaster africana, B) C. depressa, C) Tetramorium aculeatum, D) T. sericeiventre, E) Oecophylla longinoda, F) Tapinoma cf. carininotum, G) T. melanocephalum, H) Technomyrmex andrei. Lines (gynes solid and males dashed) are best fits from two Fourier terms. L = number of lunations and % of variance explained for gynes and males.

Although pronounced differences were shown by the two sexes of Tec. andrei in phase and amplitude (fig. 5H), for this species formal statistical tests were invalid as the variances of the two sexes by Fisher’s two-tail test were significantly different (F27,27 = 2.7, P < 0.05). For all other species Fisher’s tests (all at F27,27) were non-significant (Cr. africana, F = 1.9, P = 0.1; Cr. depressa, F = 1.5, P = 0.3; Tet. aculeatum, F = 1.6, P = 0.2; Tet. sericeiventre, F = 1.5, P = 0.3; Oe longinoda, F = 1.5, P = 0.3; Ta. cf. carininotum, F = 1.7, P = 0.2; Ta. melanocephalum, F = 1.1, P = 0.7). However, owing to the high percentages of variances explained by the fitted periodic curves, every parameter of phase and amplitude between the two sexes of each species was significantly different statistically. For example, the curves as plotted for the two sexes of Tet. aculeatum (fig. 5C) appear visually the most similar of the eight species considered, yet their responses to both phase (F1,54 = 549.2) and to amplitude (F1,54 = 1549.7) were highly significantly different, and explained by comparing the ranges for gynes and males on their respective ordinate axes.
The two sexes of all eight species showed further significant differences. After corrections to zero-means, males responded more strongly than gynes to moon phase for Cr. africana (6.9x vs 2.0x), Cr. depressa (8.1x vs 1.8x), Ta. cf. carininotum (2.2x vs 1.4x), and Tec. andrei (2.8x vs 1.6x). By contrast, males were less responsive than gynes for Tet. aculeatum (4.3x vs 5.0x), Tet. sericeiventre (2.5x vs 4.0x), Oe. longinoda (3.0x vs 3.8x), and Ta. melanocephalum (2.0x vs 7.1x), and all differed highly significantly.
Discussion
This is the first multi-year light-trap study of ant flight phenology in the Afrotropical region. The previous longest phenological study published was 400 days by Leston (Reference Leston1979) of 11 Dorylus spp males. Although Bowden trapped eight Dorylus spp males nightly for five whole years, seasonal flight phenologies were unreported (Bowden, Reference Bowden1973; Bowden and Church, Reference Bowden and Church1973; Bowden and Morris, Reference Bowden and Morris1975). All 25 species in this study showed annual cycles and 23 also showed semi-annual cycles with peak catches during each of the two rainy seasons. Anochetus cf. katonae and A. pellucidus also showed ca. two-year cycles, albeit the weakest terms. From suction trap records, Bigger (Reference Bigger1973) found that the coffee leaf-miner moths Leucoptera meyricki Ghesq. and L. caffeina Washb. in Tanzania also exhibited both annual and two-year cycles, while Taylor (Reference Taylor1986) reported annual and four-year cycles from light-trap catches among eight of the nine Lepidopteran species he studied in East Africa; the latter ascribed to four-year cycles of increased abundance. More recently, Uquillas et al. (Reference Uquillas, Bonilla, Arizala, Basset, Barrios and Donoso2025) reported consistent four-year cycles of abundance during 16 years from Malaise trapping of male winged ants in Panama. Although the strongest terms statistically for D. fulvus and L. cf. mastax indicated longer period oscillations of up to four years, much longer data sets would be needed to confirm whether such long-term periodic oscillations persist. All nine of Taylor’s (Reference Taylor1986) moth species also had lunar cycles. Peak flights in those moths were associated with the seasonal changing elevation of the sun, and not with the rainy seasons as with the ants in this study, so it is unsurprising that none of the moths had semi-annual cycles although the study sites in both East and West Africa experience two rainy seasons annually (Rwegasira et al., Reference Rwegasira, Mwatawala, Rwegasira and Offenberg2015), as both regions are affected by the north-south passage of the inter-tropical convergence zone. Modelling daily rainfall (y) from this study as a 7-d-m-a of Log10 (y + 1) showed that the dominant cycles were annual (F2, 1258 = 43.1; P < 0.001) and semi-annual (F2, 1258 = 29.6; P < 0.001) and explained just 6.1 and 4.2 % of the variance, respectively, as some rain is possible every month with only January 1975 entirely devoid of rain.
From 400 nights of light-trapping at Legon, in Ghana’s coastal savannah zone, the country’s driest region (Agyrifo and Otwe, Reference Agyrifo, Otwe and Oloyede2012; Walker, Reference Walker and Wills1962), Leston (Reference Leston1979) found that peak flights for D. atriceps Shuckard, D. fulvus, and Dorylus sp. 15, were synchronous in May–June 1970, coinciding with the wettest months in Accra (Agyrifo and Otwe, Reference Agyrifo, Otwe and Oloyede2012). Similarly, in the present study made in the moist equatorial forest zone 71 km north of Legon, catches of D. fulvus also followed an annual cycle that peaked at the end of the main rains.
The effects of moonlight on light-trap catches of insects are often difficult to interpret because of the need to distinguish between (i) the effect of the moon on trap efficiency, and (ii) its effect on the insects themselves (Bowden and Gibbs, Reference Bowden and Gibbs1973). Bowden and Morris (Reference Bowden and Morris1975) showed that D. atriceps, D. fimbriatus Shuckard, D. fulvus, and D. nigricans Illiger (Dorylinae) were all caught more frequently at new than at full moon. They report the most divergent response, accounting for 86 % of the variance, was for D. fulvus which at 3.5:1 new: full was similar to the 2.9:1 from the 7-d-m-a in this study [or 3.8:1 from a simple log (n + 1) transformation without 7-d-m-a smoothing, hence directly comparable with that earlier study], which showed a similar asymmetric curve with catches before full moon less than those after full moon. Although Gibbs and Leston (Reference Gibbs and Leston1970) captured more than 5300 gynes of Odontomachus troglodytes, and more than 17700 gynes of Oecophylla longinoda in 14 months of light-trapping, they presented their results as sums of 20-day periods, thereby masking their responses to moon phase.
Light-trap records for New World Dorylinae showed lunar responses similar to those for Dorylus spp., independent of their phasic seasonal responses (Baldridge et al., Reference Baldridge, Rettenmeyer and Watkins1980; Kannowski, Reference Kannowski and Dorylinae1969), and as high as 10:1 for Nomamyrmex hartigi (Westwood) in Panama (Kannowski, Reference Kannowski and Dorylinae1969), although Schneirla (Reference Schneirla1948) opined that flights of Eciton burchelli (Westwood) and E. hamatum (Fabricius) in Panama were more frequent on moonlit nights than at other times. It seems likely that the synchronous ca. 30-day oscillations in catches of D. (as Alaopone) atriceps, and D. (as Typhlopone) fulvus, reported by Leston (Reference Leston1979), were also responses to lunar periodicity (29.5 day), rather than his interpretation as evidence for Schneirla cycles, i.e. regular alternations between reproductive and nomadic phases. Schneirla cycles repeating every 30 days are unknown in New World Dorylinae, which mostly also have single one to two month annual peaks of sexuals production, often triggered by the onset of the dry season (reviewed by Hölldobler and Wilson, Reference Hölldobler and Wilson1990 and by; Kronauer, Reference Kronauer2020). Schneirla cycles of any length are unknown among Old World Dorylinae.
Dorylus fulvus, Od. troglodytes, and Cr. kneri all showed a similar asymmetric lunar-mediated periodicity, with catches in the moon’s waxing phase predominantly higher than during the luminary equivalent waning phase which, according to Bowden and Morris (Reference Bowden and Morris1975), indicate that flights occur largely in the first half of the night. The opposite pattern was shown by Tet aculeatum males (fig. 5C) and Ca. maculatus (fig. 4K), indicating that their flights occurred mostly post-midnight. Nene et al. (Reference Nene, Rwegasira, Nielsen, Mwatawala and Offenberg2016) reported that in Tanzania all flights of Oe. longinoda took place just before sunset. The flight patterns were broadly symmetrical for Cr. africana, Cr. depressa, Tet. aculeatum gynes, Tet. sericeiventre, Oe. longinoda gynes (fig. 5E), and Ta. cf. carininotum males (fig. 5F), indicating that they were trapped most likely throughout the night.
Bright moonlight is a trigger for dispersal in a wide range of flying insects (Bowden and Morris, Reference Bowden and Morris1975; Williams, Reference Williams1936), including H. dulcis in this study, with catches 3x higher after full than at new moon, and probably for Pl. brunni also with a two-fold increase. Although catches of the majority of species were depressed by increased moonlight, the ratios of that depression were in the range from 1.5x to 5.3x, and up to 8.1x for Cr. depressa males, whereas the diminution in lunar plus starlight illuminance between new (0.0009 lx) and full moon (0.2009 lx) is 223-fold (Bowden, Reference Bowden1973), which suggests that lowered catches around full moon are mostly the result of reduced trap efficiency rather than reduced flight activity. Indeed, Nene et al. (Reference Nene, Rwegasira, Nielsen, Mwatawala and Offenberg2016) reported that flights of Oe. longinoda occurred mainly at full moon, while our results show a 3.5x reduction in catch for this species at full than at new moon (fig. 4), hence only a small fraction of the 223-fold that would be expected if dispersal was affected adversely and in proportion by a brightening moon.
The dip in catches in the last quarter observed for D. fulvus, all four Cr. spp., Oe. longinoda, and by gynes of Ta. cf. carininotum, Ta. melanocephalum, and Tec. andrei, is consistent with a reduction in numbers departing their natal nests at that point in the lunar cycle. Similar last quarter dips in catches were shown for total moths by Brown and Taylor (Reference Brown and Taylor1971), and by Bowden and Morris (Reference Bowden and Morris1975) among early flying Mantispidae and some Pyralidae, also among late flying Sphingidae and some Arctiidae, plus the nolid moth Earias biplaga Walker which flies during the whole night, so a consistent effect irrespective of the time of night that these insects flew. Nowinszky et al. (Reference Nowinszky, Petranyi and Puskas2010) similarly recorded dips during the moon’s last quarter for Winter Moth Operophtera brumata L., the cockchafer Melolontha melolontha L., Fall Webworm Hyphantria cunea Drury, and cumulative Macrolepidoptera and Coleoptera spp which they attributed to reduced frequency of emergence of adult broods.
Brown and Taylor (Reference Brown and Taylor1971) reported that East African moths trapped at light exhibited a bimodal curve with a high maximum at new moon, and a lower maximum at full moon, with almost symmetrical minima at first and third quarters, which they attributed to a conflict between greater dispersal at full moon competing with reduced trap efficiency at that time. That pattern was also repeated here by Ca. foraminosus and with a delay by Cr. striatula which may also signal greater nuptial flights around full moon.
Acknowledgements
I thank E. Ampomah for servicing the trap and for sorting ants from the nightly catches of insects.
Competing interests
The author declares none.