


Introduction
The dominant species in a majority of intertidal communities of the White Sea are the blue mussels of the genus Mytilus (Berger et al., Reference Berger, Dahle, Galaktionov, Kosobokova, Naumov, Rat'kova, Savinov and Savinova2001). Two blue mussel species, Mytilus edulis L. (1758) and M. trossulus Gould (1850), and their hybrids were identified in the mussel beds in Kandalaksha Bay of the White Sea (Katolikova, Khaitov, Väinölä, Gantsevich & Strelkov, Reference Katolikova, Khaitov, Väinölä, Gantsevich and Strelkov2016; Väinölä & Strelkov, Reference Väinölä and Strelkov2011). It is known that M. edulis and M. trossulus adults and larvae differ in their tolerance to thermal effects (Koehn, Reference Koehn1991; Rayssac, Pernet, Lacasse & Tremblay, Reference Rayssac, Pernet, Lacasse and Tremblay2010). Unlike M. trossulus mussels, M. edulis are less tolerant to low-temperature effects (Koehn, Reference Koehn1991; Rayssac et al., Reference Rayssac, Pernet, Lacasse and Tremblay2010). It is assumed that differences in thermal tolerance determine the biogeographical distribution of these mussels (Koehn, Reference Koehn1991; Rayssac et al., Reference Rayssac, Pernet, Lacasse and Tremblay2010). Similarly, M. trossulus is not found to occur in all mussel beds in Kandalaksha Bay (Katolikova et al., Reference Katolikova, Khaitov, Väinölä, Gantsevich and Strelkov2016; Väinölä & Strelkov, Reference Väinölä and Strelkov2011). Mytilus edulis from one of the intertidal mussel beds in Kandalaksha Bay were examined in this study.
As a result of their high ecological plasticity, blue mussels can survive in harsh intertidal environments. Intertidal habitats are exposed to variable environmental factors, such as temperature, salinity, desiccation and food availability (Newell, Reference Newell1989). Phenotypic distinctions caused by the environmental conditions of intertidal (rocky shore) and subtidal (including aquaculture) habitats are common at the physiological (including growth rate, clearance rate, ingestion rate, absorption rate, respiration rate) and biochemical (such as heat shock proteins, lipid and fatty acid composition) levels in bivalves (Babarro, Fernández-Reiriz & Labarta, Reference Babarro, Fernández-Reiriz and Labarta2000; Dahlhoff & Somero, Reference Dahlhoff and Somero1993; Fernández-Reiriz, Irisarri & Labarta, Reference Fernández-Reiriz, Irisarri and Labarta2016; Fokina, Shklyarevich, Ruokolainen & Nemova, Reference Fokina, Shklyarevich, Ruokolainen, Nemova and Snyder2016; Freites, Fernandez-Reiriz & Labarta, Reference Freites, Fernandez-Reiriz and Labarta2002a,Reference Freites, Fernandez-Reiriz and Labartab,Reference Freites, Labarta and Fernández-Reirizc; Hofmann & Somero, Reference Hofmann and Somero1995; Labarta, Fernández-Reiríz & Babarro, Reference Labarta, Fernández-Reiríz and Babarro1997; Nemova, Fokina, Nefedova, Ruokolainen & Bakhmet, Reference Nemova, Fokina, Nefedova, Ruokolainen and Bakhmet2013; Sukhotin, Abele & Portner, Reference Sukhotin, Abele and Portner2002; Sukhotin & Portner, Reference Sukhotin and Pörtner1999; Williams & Somero, Reference Williams and Somero1996; Wilson & Elkaim, Reference Wilson and Elkaim1991). In particular, periodic desiccation of intertidal zones results in considerable alteration of mussel energy stores, including triacylglycerols, saturated and polyunsaturated fatty acids (Freites et al., Reference Freites, Fernandez-Reiriz and Labarta2002a,Reference Freites, Fernandez-Reiriz and Labartab). Importantly, the role of lipids in the cell is not limited to energy supply. They are also structural components of membranes, being involved in regulation of the activity of membrane-bound enzymes, ion channels and receptors (Vance & Vance, Reference Vance and Vance2002). Membrane associated processes are generally highly susceptible to temperature modifications (Hochachka & Somero, Reference Hochachka and Somero2002). Low temperatures increase the packing order of membrane lipids, decreasing the overall fluidity of membranes. Like all poikilothermic organisms, marine bivalve molluscs must adapt their membrane lipid composition in order to maintain membrane fluidity in the cold. This adaptive mechanism, termed homeoviscous adaptation, includes processes such as remodelling membrane lipids, comprising changes in proportions of cholesterol and phospholipids, ratio of polar head group of phospholipids, and fatty acid composition of phospholipids (average acyl chain length and amount of double bonds in acyl chain) (Hazel, Reference Hazel1995; Hazel & Williams, Reference Hazel and Williams1990). Cholesterol and predominant membrane phospholipids such as phosphatidylcholine (PC) stabilise membrane packing and increase the order of the surrounding acyl chains in membranes in the fluid phase (Crockett, Reference Crockett1998; Logue, De Vries, Fodor & Cossins, Reference Logue, De Vries, Fodor and Cossins2000), whereas phosphatidylethanolamine (PE) has a destabilising effect on membranes due to its conical molecular form (Hazel, Reference Hazel1995; Logue et al., Reference Logue, De Vries, Fodor and Cossins2000). Elevated content of PE as well as increased proportions of polyunsaturated fatty acids (PUFA) containing three or more double bonds (mainly eicosapentaenoic acid 20:5n-3, EPA, and docosahexaenoic acid 22:6n-3, DHA) to saturated fatty acids have a destabilising effect on membrane order and increase fluidity of the membranes during low-temperature effect (Hall, Parrish & Thompson, Reference Hall, Parrish and Thompson2002; Logue et al., Reference Logue, De Vries, Fodor and Cossins2000; Parent, Pernet, Tremblay, Sevigny & Ouellette, Reference Parent, Pernet, Tremblay, Sevigny and Ouellette2008; Pernet, Tremblay, Gionet & Landry, Reference Pernet, Tremblay, Gionet and Landry2006; Pruitt, Reference Pruitt1988). Furthermore, some fatty acids (namely, arachidonic acid - 20:4n-6, AA and eicosapentaenoic acid - 20:5n-3, EPA) are precursors for the synthesis of physiologically active molecules such as eicosanoids, which are known to modulate animals’ resistance to environmental stresses (Bell & Sargent, Reference Bell and Sargent2003; Parrish, Reference Parrish, Arts, Brett and Kainz2009; Stanley-Samuelson, Reference Stanley-Samuelson1987).
Seasonal metabolic modifications in bivalves, including those related to lipid composition, are known to reflect the interaction of environmental factors (namely temperature and salinity), food quality and availability, and reproductive activity (Gabbot, Reference Gabbott and Hochachka1983; Hurtado et al., Reference Hurtado, Racotta, Arcos, Morales-Bojórquez, Moal, Soudant and Palacios2012; Narváez et al., Reference Narváez, Freites, Guevara, Mendoza, Guderley, Lodeiros and Salazar2008). In contrast to the lipid composition of the mantle and digestive gland, which undergoes considerable modifications associated with reproductive processes (Cancio, Ibabe & Cajaraville, Reference Cancio, Ibabe and Cajaraville1999; Gabbot, Reference Gabbott and Hochachka1983), the lipid composition of mussel gills is primarily influenced by external environmental factors (Fokina, Ruokolainen, Nemova & Bakhmet, Reference Fokina, Ruokolainen, Nemova and Bakhmet2013; Fokina, Bakhmet, Shklyarevich & Nemova, Reference Fokina, Bakhmet, Shklyarevich and Nemova2014; Fokina, Ruokolainen, Bakhmet & Nemova, Reference Fokina, Ruokolainen, Bakhmet and Nemova2015; Nemova et al., Reference Nemova, Fokina, Nefedova, Ruokolainen and Bakhmet2013). In particular, alterations in the gill lipid composition in response to various temperatures (Fokina et al., Reference Fokina, Ruokolainen, Bakhmet and Nemova2015), salinities (Nemova et al., Reference Nemova, Fokina, Nefedova, Ruokolainen and Bakhmet2013) and different types of pollutants (Fokina et al., Reference Fokina, Ruokolainen, Nemova and Bakhmet2013, Reference Fokina, Bakhmet, Shklyarevich and Nemova2014) were shown to occur in our experiments with the White Sea mussels M. edulis. In bivalves, gills are the gateway for environmental impacts and are thus often used in biomonitoring as the target organ of various toxic pollutants (e.g. Avery, Dunstan & Nell, Reference Avery, Dunstan and Nell1998; Barsiene et al., Reference Barsiene, Schiedek, Rybakovas, Syvokiene, Kopecka and Förlin2006; Venier, Maron & Canova, Reference Venier, Maron and Canova1997). Furthermore, it is known that the accumulation of pollutants in mussel tissues, as well as the susceptibility of polar mussels to their toxic impacts, are determined by the lipid composition of molluscs (Camus, Grøsvik, Børseth, Jones & Depledge, Reference Camus, Grøsvik, Børseth, Jones and Depledge2000; Endo, Escher & Goss, 2011). Nonetheless, seasonal modifications of gill lipid composition in the White Sea mussels have not been adequately studied. In some species of bivalves, seasonal changes in gill lipid composition have been illustrated (Delaporte et al., Reference Delaporte, Soudant, Moal, Kraffe, Marty and Samain2005; Parent et al., Reference Parent, Pernet, Tremblay, Sevigny and Ouellette2008; Pernet, Tremblay, Comeau & Guderley, Reference Pernet, Tremblay, Comeau and Guderley2007; Thyrring, Tremblay & Sejr, Reference Thyrring, Tremblay and Sejr2017), but some authors have reported the absence of seasonal alterations in gill lipid composition in some Bivalvia species, including M. edulis L. (Williams & Somero, Reference Williams and Somero1996). To add to our understanding, we assessed the effect of season (spring, summer, autumn) and habitat (intertidal zone and aquaculture) on gill and digestive gland lipid composition in blue mussels, M. edulis L, from the White Sea. We assumed that the differences in seasonal environmental conditions of the molluscs' habitats can affect the physiological state of mussels, including their lipid composition and, therefore, may cause differences in susceptibility of the molluscs to various types of environmental factor impacts, including pollutants.
Materials and methods
Mussel sampling and environmental conditions
Blue mussels, Mytilus edulis L., were sampled in the vicinity of the Biological Research Station “Kartesh” of the Zoological Institute, Russian Academy of Sciences (Fig. 1) from May to November 2013. The intertidal mussel bed was situated in the tidal zone of Matrenin Island in Chupa Inlet of the Kandalaksha Bay, White Sea (66°18′34″N 33°37′56″W), which is characterised by sandy and rocky bottoms. Intertidal mussels were collected from the centre of this zone during low tide. Aquaculture mussels were collected from artificial substrates in the raft suspension aquaculture Sonostrov in the Kandalaksha Bay, White Sea (66°09′00″N 34°10′00″W) from a depth of 3 m. Seawater temperature and salinity, as well as ice thickness at the time of sampling, were recorded (Table 1).
Sampling locations in the White Sea: (1) intertidal zone of Matrenin Island in Chupa Inlet of Kandalaksha Bay, and (2) raft suspension substrates in the aquaculture “Sonostrov” in Kandalaksha Bay.

Environmental conditions in the intertidal zone and raft suspension substrates of aquaculture in the White Sea. Water temperature and salinity were recorded continuously using underwater loggers, and ice thickness was measured using a special slide rule. The data are presented as single measurements for the day of mussel sampling during low tide.

Blue mussels (M. edulis L., n = 10 per zone) were sampled in May, June, August and November. The length of mussel shells was measured using a digital caliper, the values being 44.9–49.1 mm for intertidal mussels and 57.5–65.6 mm for aquaculture mussels.
Mantle tissues were removed and fixed in 4% formaldehyde for histological analysis to determine sex and reproductive stages (Maximovich, Reference Maximovich and Lukanin1985). Gill and digestive gland tissues were cut out and fixed in 97% ethanol (with the addition of butylated hydroxytoluene as antioxidant) and stored in a fridge at +4°C until further biochemical analyses.
Analysis of lipid profiles
Quantitative analyses of lipid profiles in gills and digestive glands of intertidal and cultured blue mussels were conducted in the Equipment Sharing Centre of the Institute of Biology of the Karelian Research Centre, Russian Academy of Sciences (Petrozavodsk, Russia).
Lipids were extracted with chloroform/methanol (2:1, v/v) according to Folch, Lees and Stanley (Reference Folch, Lees and Stanley1957). The extracted lipids were spotted onto silica gel thin-layer chromatography plates (TLC Silica gel 60 F254 plates, Merck, Germany) and separated into different fractions of lipid classes using petroleum ether/diethyl ether/acetic acid (90:10:1, v/v) as the mobile phase. Identification of the fractions was performed using standards: phospholipid mixture (P3817, Supelco, USA), cholesterol (C8667, Sigma, USA), glyceryl trioleate (92860, Sigma, USA) and cholesteryl palmitate (C78607, Aldrich, USA). The quantitative composition of the fractions was measured at 540 nm wave length for phospholipids, triacylglycerols and sterol esters and at 550 nm wave length for the sterols fraction using an SF-2000 UV/Vis spectrophotometer (Saint-Petersburg, Russia) (Engelbrecht, Mari & Anderson, Reference Engelbrecht, Mari and Anderson1974; Sidorov, Lizenko, Bolgova & Nefedova, Reference Sidorov, Lizenko, Bolgova, Nefedova, Potapova and Smirnov1972).
Determination of phospholipid fractions
The composition of individual phospholipid fractions (phosphatidylinositol (PI), phosphatidylserine (PS), phosphatidylethanolamine (PE), phosphatidylcholine (PC), lysophosphatidylcholine (LPC) and sphingomyelin (SM)) was determined by high-performance liquid chromatography using the method of Arduini et al. (Reference Arduini, Peschechera, Dottori, Sciarroni, Serafini and Calvani1996) on a Nucleosil 100–7 column (Elsiko, Russia) with the liquid phase acetonitrile/hexane/methanol/phosphorus acid (918:30:30:17.5, v/v), UV-spectrophotometer with 206 nm wave length and using a liquid chromatograph (Aquilon Stayer, Moscow, Russia). Peaks were identified by reference to retention times of authentic standards: phospholipid mixture (P3817, Supelco, USA), phosphatidylserine (P7769, Sigma, USA) and sphingomyelin (S7004, Sigma, USA).
Analysis of fatty acid composition of total phospholipids and triacylglycerols
Total phospholipid and triacylglycerol fractions were separated from total lipids using thin-layer chromatography on TLC Silica gel 60 F254 plates (Merck, Germany). Fatty acid methyl esters (FAME) from the fractions were prepared using methanol and acetyl chloride. The separation of FAME was in a gas-liquid chromatograph, Agilent 7890A (Agilent Technologies, USA), with flame ionisation detector using columns DB-23 (60 m – 0.25 mm) (Agilent Technologies, USA) and nitrogen as the mobile phase. FAMEs from mussel total lipids were identified by comparison with standard mixes (Supelco, USA).
Statistical analyses
Statistical analysis was carried out using StatSoft Statistica v 7.0. A three way ANOVA test was used to compare lipid composition of mussel gills and digestive glands according to the factors ‘sex’, ‘sampling date’ and ‘habitat’. A one-way ANOVA test followed by post hoc Tukey's multiple comparison tests was used to detect significant differences among lipid composition of mussels collected on studied sampling dates as well as among lipid composition of mussels collected from different tidal zones on the same sampling dates. The differences were considered significant at P < 0.05.
The degree of unsaturation of the phospholipids and triacylglycerols was estimated using both an Unsaturation Index (UI) and a Chain Fluidity Index (CFI), which were calculated as
 $UI = \frac{\begin{array}{l} (\% MUFA + 2 \times \% DienoicFA + 3\\ \quad \times \% TrienoicFA + 4 \times TetraenoicFA + 5\\ \quad \times \% PentaenoicFA + 6 \times \% HexaenoicFA )\end{array}}{\it{\sum SFA}}$
(Pirini et al., Reference Pirini, Manuzzi, Pagliarani, Trombetti, Borgatti and Ventrella2007), and CFI = (1 × %MUFA) + (1.5 × %PUFA) (Munro, Martel & Blier, Reference Munro, Martel and Blier2015).
Results
Since the results of the three way ANOVA analysis (Table 2) revealed no sex-specific differences in the composition of lipids and their fatty acids in mussel gills and digestive glands, data for males and females were pooled for further analyses.
Three way ANOVA results comparing the lipid and fatty acid content in gills and digestive glands of Mytilus edulis depending on the habitat conditions (“habitat”), sampling period (“sampling date”) and sex (“sex”).

PI, phosphatidylinositol; PS, phosphatidylserine; PE, phosphatidylethanolamine; PC, phosphatidylcholine; LPC, lysophosphatidylcholine; SM, sphingomyelin; CFI, chain fluidity index; UI, unsaturation index; NMIFA, non-methylene-interrupted fatty acids.
Total phospholipids and their individual fraction content, as well as the level of sterols and their esters in the gills and digestive glands of intertidal mussels sampled in early May were significantly higher in comparison with mussels from aquaculture (Figs 2–4). Most classes of phospholipids, except for LPC (in gills and digestive glands) and PI (in digestive glands) were present in the gills and digestive glands of intertidal mussels (Figs 2 & 3). Sterol content in gills of intertidal mussels was reduced from early May to August, and in aquaculture mussels from late May to November, with the exception of its increase in August (Fig. 2). In the digestive glands of intertidal mussels, the sterol level decreased from May to June, while in August there was an increase in its concentration in both intertidal and aquaculture mussels (Fig. 3).
Total content (% total lipids dry weight) of (A) phospholipids, (B) sterols, (C) phosphatidylcholine (PC), (D) lysophosphatidylcholine (LPC), (E) phosphatidylethanolamine (PE), (F) phosphatidylinositol (PI), (G) phosphatidylserine (PS), and (H) sphingomyelin (SM) in gills of intertidal (open circle) and aquaculture (open square) mussels Mytilus edulis. Plots represent the mean ± SE.

Total content (% total lipids dry weight) of (A) phospholipids, (B) sterols, (C) phosphatidylcholine (PC), (D) lysophosphatidylcholine (LPC), (E) phosphatidylethanolamine (PE), (F) phosphatidylinositol (PI), (G) phosphatidylserine (PS), and (H) sphingomyelin (SM) in the digestive glands of intertidal (open circle) and aquaculture (open square) mussels Mytilus edulis. Plots represent the mean ± SE.

(A, B) Triacylglycerol (TAG) and (C, D) sterol ester content (% total lipids dry weight) in the gills (A, C) and digestive glands (B, D) of intertidal (open circle) and aquaculture (open square) mussels Mytilus edulis. Plots represent the mean ± SE.

There was an increase of phospholipid levels (mainly PC and its lysoform) and a decrease in PE concentration in the gills of intertidal and aquaculture mussels sampled in June, compared with the mussels collected later in May and August (Fig. 2). The unsaturation index (UI) and chain fluidity index (CFI) of phospholipids decreased in the gills of aquaculture mussels collected in August, whereas they increased in gills of intertidal mussels by November (Figs 5 & 6). These modifications of the fatty acids ratios occurred mainly due to changes in the content of such dominant polyunsaturated fatty acids (PUFA) as EPA, DHA and AA (Figs 7–9). Moreover, elevated CFI values in gill phospholipids were observed in intertidal mussels collected in early May. The level of non-methylene-interrupted fatty acids (NMIFA) increased in the gill phospholipids of the intertidal mussels collected later in May, while in the aquaculture mussels it did not differ between sampling dates.
Unsaturation index (UI) of (A, B) phospholipids and (C, D) triacylglycerols in the gills (A, C) and digestive glands (B, D) of intertidal (open circle) and aquaculture (open square) mussels Mytilus edulis. Plots represent the mean ± SE.

Chain fluidity index (CFI) of (A, B) phospholipids and (C, D) triacylglycerols in the gills (A, C) and digestive glands (B, D) of intertidal (open circle) and aquaculture (open square) mussels Mytilus edulis. Plots represent the mean ± SE.

Eicosapentaenoic 20:5n-3 acid (EPA) content (% sum fatty acids) in (A, B) phospholipids and (C, D) triacylglycerols in the gills (A, C) and digestive glands (B, D) of intertidal (open circle) and aquaculture (open square) mussels Mytilus edulis. Plots represent the mean ± SE.

Docosahexaenoic 22:6n-3 acid (DHA) content (% sum fatty acids) in (A, B) phospholipids and (C, D) triacylglycerols in the gills (A, C) and digestive glands (B, D) of intertidal (open circle) and aquaculture (open square) mussels Mytilus edulis. Plots represent the mean ± SE.

Arachidonic 20:4n-6 acid (AA) content (% sum fatty acids) in (A, B) phospholipids and (C, D) triacylglycerols in the gills (A, C) and digestive glands (B, D) of intertidal (open circle) and aquaculture (open square) mussels Mytilus edulis. Plots represent the mean ± SE.

In the digestive glands of intertidal and aquaculture mussels, some fractions of phospholipids (PC, PE, LPC and PS) decreased in August and subsequently increased in November (Fig. 3). At the same time, there was an increase in SM and PI concentration in digestive glands of mussels collected in August, followed by decreased concentrations in November. Decreases in UI and CFI of phospholipids were observed in digestive glands of intertidal mussels sampled later in May (Figs 5 & 6), whereas these increased in the aquaculture mussels collected in November (mainly due to changes in the content of EPA, AA and NMIFA) (Figs 7–10).
Non-methylene-interrupted fatty acid (NMIFA) content (% sum fatty acids) in (A, B) phospholipids and (C, D) triacylglycerols in the gills (A, C) and digestive glands (B, D) of intertidal (open circle) and aquaculture (open square) mussels Mytilus edulis. Plots represent the mean ± SE.

Triacylglycerols (TAG) were present in trace amounts in both gill and digestive glands of intertidal mussels collected in early May (Fig. 4). Subsequently, an increase in the TAG content was noted in the gills of intertidal mussels collected later in May. In gills of aquaculture mussels the decrease in TAG content was noted in molluscs collected in August. The level of TAG in digestive glands of intertidal mussels did not differ between sampling dates, whereas TAG content in aquaculture mussels decreased in June and subsequently increased in August. An increase in fatty acid unsaturation of TAG (UI and CFI) in gills and digestive glands was noted in intertidal mussels collected in late May and August (Figs 5 & 6), and in aquaculture mussels collected in August (mainly due to changes in content of EPA, DHA, AA and NMIFA). There was a significant decrease in UI (mainly due to NMIFA) in the TAG of gills and a decrease in CFI of TAG (due to changes in content of EPA, DHA and NMIFA) in the digestive glands of intertidal mussels collected in November (Figs 5–10).
In August the gills of intertidal mussels contained reduced sterol ester levels that subsequently increased in November (Fig. 4). The opposite changes in sterol ester content were noted in digestive glands of intertidal mussels. Increased levels of sterol esters were observed in the gills and digestive glands of aquaculture mussels sampled late in May, while a decrease in sterol esters was noted in gills of aquaculture mussels sampled in June and August. In contrast, an increase in sterol esters was observed in the digestive glands of aquaculture mussels sampled in August.
Discussion
In bivalves, seasonal metabolic activity, including lipid metabolism, reflects an interplay of environmental factors (temperature, salinity), food quality and availability, as well as reproductive activity (Gabbot, Reference Gabbott and Hochachka1983; Hurtado et al., Reference Hurtado, Racotta, Arcos, Morales-Bojórquez, Moal, Soudant and Palacios2012; Narvaez et al., Reference Narváez, Freites, Guevara, Mendoza, Guderley, Lodeiros and Salazar2008). Utilisation of lipids during gametogenesis in bivalves (Gabbot, Reference Gabbott and Hochachka1983) and their shuffling between reproductive (mantle) and non-reproductive (digestive gland) organs, depending on the stage of the mussels’ reproductive cycle, have been described in detail (Cancio et al., Reference Cancio, Ibabe and Cajaraville1999; Gabbot, Reference Gabbott and Hochachka1983). In this study we show that modifications of the lipid composition of the gills and digestive glands of Mytilus edulis L. are mainly defined by seasonal environmental conditions. Changes in the lipid composition of mussels inhabiting different environmental conditions (intertidal zone and aquaculture) are also shown.
Intertidal mussels and ice-covered conditions: lipid composition modifications
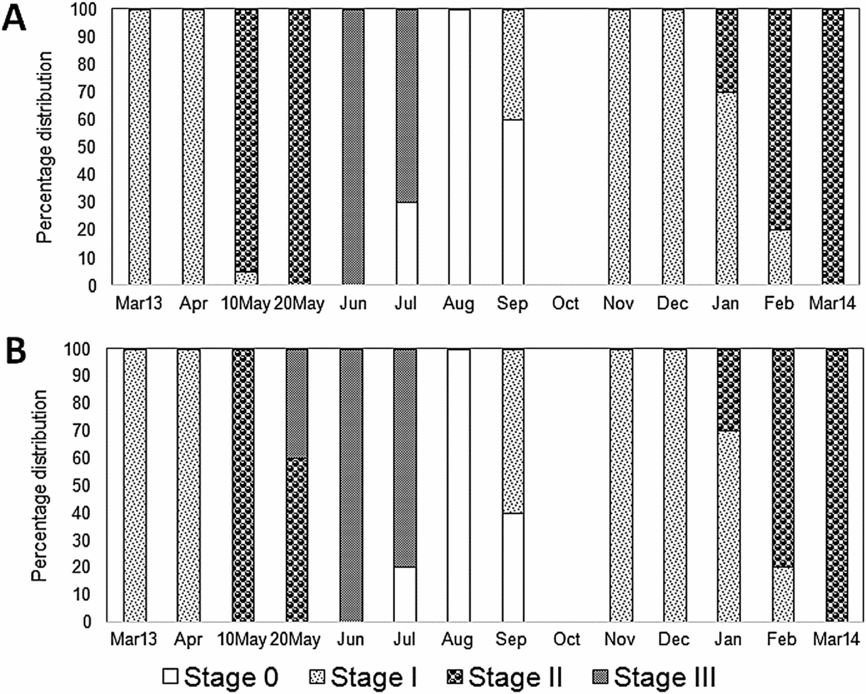
During the winter period (November–April) the White Sea is covered in ice. In spring (April–May) the ice begins to melt and intertidal organisms find themselves in low salinity conditions (Berger et al., Reference Berger, Dahle, Galaktionov, Kosobokova, Naumov, Rat'kova, Savinov and Savinova2001). The metabolism of mussels slows down considerably under such conditions, which also influences their reproductive and growth processes (Aarset, Reference Aarset1982; Petes, Menge & Harris, Reference Petes, Menge and Harris2008; Sukhotin & Portner, Reference Sukhotin and Pörtner1999; Sukhotin et al., Reference Sukhotin, Abele and Portner2002; Thorarinsdottir & Gunnarsson, Reference Thorarinsdóttir and Gunnarsson2003; Thyrring, Rysgaard, Blicher & Sejr, Reference Thyrring, Rysgaard, Blicher and Sejr2015). Moreover, low temperatures could prevent the maturation of gonads. In particular, temperatures below 7°C suppress or completely stop gonad development in subarctic blue mussels (Thorarinsdottir & Gunnarsson, Reference Thorarinsdóttir and Gunnarsson2003; Thyrring et al., Reference Thyrring, Rysgaard, Blicher and Sejr2015). In the White Sea, until late April–early May intertidal mussels are under ice cover and exposed to freezing temperatures and reduced salinity, whereas aquaculture mussels are in relatively stable temperature and salinity conditions at a depth of 2–3 m. Our studies have demonstrated differences in the timing of gametogenesis activation in mussels collected in different tidal zones (Fig. 11). During May, intertidal mussels were in active gametogenesis (stage II), unlike cultured mussels, in which mature gonads (stage IIIA1) were already found by late May. Importantly, the most studied level of lipid classes in gills and digestive glands of intertidal mussels sampled in early May was significantly higher than for other sampling dates. The elevated level of phospholipids (chiefly PI, PS, PE and PC), as well as sterols, in mussel gills and digestive glands probably reflects harsh environmental conditions, including ice cover and low salinity. It is known that cellular dehydration and cell volume reduction occur in freezing conditions, securing tolerance to ice formation and resistance to cold in bivalve molluscs (Aarset, Reference Aarset1982; Thyrring et al., Reference Thyrring, Tremblay and Sejr2017). Our early aquarium experiments showed that a reduction of salinity to 15 psu promotes increased PC and PS levels in gills of intertidal and cultured mussels (Nemova et al., Reference Nemova, Fokina, Nefedova, Ruokolainen and Bakhmet2013). We know that these phospholipids in membranes are responsible for the regulation of the membrane-bound enzyme activity and action of receptors, which are involved in gill cell volume regulation under low salinity scenarios (Boldyrev, Reference Boldyrev1998; Vance & Vance, Reference Vance and Vance2002). At the same time, exposure to critically low seawater salinity (5‰) was, on the contrary, associated with a marked reduction in PC in gills in both intertidal and cultured mussels, apparently pointing to destruction of cell membranes (Nemova et al., Reference Nemova, Fokina, Nefedova, Ruokolainen and Bakhmet2013). In the present study, the gills and digestive glands of the mussels sampled in early May simultaneously demonstrated an elevated membrane lipid content and a low level of triacylglycerols and some PUFAs, chiefly EPA, DHA and AA, which suggests that metabolic reserves in the mussels were depleted after the long winter, i.e. after a prolonged period of starvation (Ezgeta-Balic, Najdek, Peharda & Blazina, Reference Ezgeta-Balić, Najdek, Peharda and Blažina2012; Pernet et al., Reference Pernet, Tremblay, Comeau and Guderley2007). Furthermore, the reduction concerned not only PUFA content but also the level of non-methylene-interrupted fatty acids (NMIFA), both within phospholipids and triacylglycerols of gills. As it is known that bivalve molluscs can synthesise NMIFA (Barnathan, Reference Barnathan2009; Zhukova, Reference Zhukova1991, Reference Zhukova1992), the reduced NMIFA level in the gills of mussels in our study indicates the lack of additional synthesis of these fatty acids in the winter season on the one hand, and utilisation of these acids for energy supply to secure cold resistance of mussels on the other.
Storage lipids and their fatty acid modifications in gills and digestive glands of intertidal and aquaculture mussels depending on the season
In bivalves the metabolism of TAG varies according to seasonal cycles (Cancio et al., Reference Cancio, Ibabe and Cajaraville1999; De-Zwaan, Mathieu & Gosling, Reference De-Zwaan, Mathieu and Gosling1992; Gabbot, Reference Gabbott and Hochachka1983). TAGs are accumulated in mussels during periods of high food availability and are subsequently used to maintain metabolism during periods of low feeding in the winter and for initiation of gametogenesis (Cancio et al., Reference Cancio, Ibabe and Cajaraville1999; De-Zwaan et al., Reference De-Zwaan, Mathieu and Gosling1992; Gabbot, Reference Gabbott and Hochachka1983; Hurtado et al., Reference Hurtado, Racotta, Arcos, Morales-Bojórquez, Moal, Soudant and Palacios2012; Narvaez et al., Reference Narváez, Freites, Guevara, Mendoza, Guderley, Lodeiros and Salazar2008). In the present study we noted reduced content of TAG in intertidal mussel gills in early May, followed by an increased concentration of the PUFA-rich TAGs in the mussels later in May. This was probably caused by a rise in phytoplankton content in seawater induced by increasing ambient temperature and stabilisation of salinity (Ezgeta-Balic et al., Reference Ezgeta-Balić, Najdek, Peharda and Blažina2012; Gaillard et al., Reference Gaillard, Meziane, Tremblay, Archambault, Layton, Martel and Olivier2015; Pirini et al., Reference Pirini, Manuzzi, Pagliarani, Trombetti, Borgatti and Ventrella2007). Low concentrations of EPA, DHA and AA in TAGs of mussel gills in early May could be the result of utilisation of these fatty acids for metabolic energy needs during the long winter period with low food availability (Ezgeta-Balic et al., Reference Ezgeta-Balić, Najdek, Peharda and Blažina2012; Pernet et al., Reference Pernet, Tremblay, Comeau and Guderley2007). Despite the absence of significant changes in TAG content in the digestive glands of intertidal mussels, modifications in the PUFA composition (mainly in CFI and UI) were noted. The increase in unsaturation level is probably due to the high food availability in the White Sea in late May and August (Berger et al., Reference Berger, Dahle, Galaktionov, Kosobokova, Naumov, Rat'kova, Savinov and Savinova2001). Reductions of TAG content in the gills of aquaculture mussels collected in August may be associated with the redistribution of the storage lipids between non-reproductive organs in mussels at the resting stage of the reproductive cycle (Gabbot, Reference Gabbott and Hochachka1983). The increase in content of TAG enriched with EPA and DHA in digestive glands of aquaculture mussels was noted in August. We showed that the unsaturation index of the digestive gland TAG was also raised in August. Decreases in TAG levels in the digestive glands of aquaculture mussels collected in June are probably related to reproductive processes, namely, the decrease in stored lipids in non-reproductive organs associated with spawning – stage III (Cancio et al., Reference Cancio, Ibabe and Cajaraville1999; De Zwaan et al., Reference De-Zwaan, Mathieu and Gosling1992; Gabbot, Reference Gabbott and Hochachka1983).
The high content of sterol esters (the stored form of sterols and PUFAs) in both the gills and digestive glands of intertidal and aquaculture mussels collected in May can be related to their important role in reproductive processes (Abad, Ruiz, Martinez, Mosquera & Sánchez, Reference Abad, Ruiz, Martinez, Mosquera and Sánchez1995). In May, the White Sea mussels are in stage II – active gametogenesis, when the presence of the sterols and their esters are necessary as precursors of steroid hormones (Abad et al., Reference Abad, Ruiz, Martinez, Mosquera and Sánchez1995; Vance & Vance, Reference Vance and Vance2002). At the same time, the accumulation of sterol esters and TAGs in the digestive glands of intertidal and aquaculture mussels in August can serve as a biomarker of the resting stage (stage 0), when there is a recovery of metabolic reserves, including stored lipids (Cancio et al., Reference Cancio, Ibabe and Cajaraville1999; Gabbot, Reference Gabbott and Hochachka1983).
Membrane lipids and their fatty acid modifications in gills and digestive glands of intertidal and aquaculture mussels, depending on the season
Phospholipids and cholesterol (as the main sterol in mussels) play an important role in the metabolism of the organisms as structural components of their membranes (Vance & Vance, Reference Vance and Vance2002). They ensure the fluidity of the membranes and the functioning of membrane-bound proteins (enzymes, ion channels and receptors). In addition, cholesterol is a precursor for the synthesis of steroid hormones, which are involved in the process of gonad maturation (Abad et al., Reference Abad, Ruiz, Martinez, Mosquera and Sánchez1995; Vance & Vance, Reference Vance and Vance2002). Apparently, high sterol content in the gills of aquaculture mussels and in the digestive glands of intertidal mussels collected later in May may be associated with gonad maturation (Ahn, Woong Cho, Choi, Seo & Shin, Reference Ahn, Woong Cho, Choi, Seo and Shin2000; Pollero, Ré & Brenner, Reference Pollero, Ré and Brenner1979; Vance & Vance, Reference Vance and Vance2002). As noted above, the mussels collected in May were at stage II – active gametogenesis (Fig. 11) and they had a high level of sterol esters in their gills and digestive glands. At the same time, the elevated content of PE in the gills and digestive glands of intertidal and aquaculture mussels collected in May counteracts the stabilising effect of cholesterol on membrane packing and secures the necessary fluidity and permeability of the cell membranes at low temperatures (Vance & Vance, Reference Vance and Vance2002). It is known that PE has a predominantly conical molecular shape and serves as the destabilising lipid, which increases proportionally under low-temperature effects (Logue et al., Reference Logue, De Vries, Fodor and Cossins2000; Pruitt, Reference Pruitt1988). In June and August, when ambient temperatures rise, PE concentration decreases in the gills and digestive glands of intertidal and aquaculture mussels and subsequently increases (in November) when seawater temperature drops. In August the increased level of SM in the gills and digestive glands of intertidal and aquaculture mussels, accompanied by a reduced content of PC, indicates a substitute function of SM caused by a deficiency of predominant membrane phospholipid content (Vance & Vance, Reference Vance and Vance2002). In addition to changes in the cholesterol and phospholipid content, a well-studied adaptation mechanism of poikilothermic organisms to low-temperature effects is lipid remodelling by modifying the fatty acid composition of membrane phospholipids (Hazel, Reference Hazel1995). Remodelling by increasing the fatty acid unsaturation in the phospholipids can counteract the fluidity and destructive effect of low temperatures via a process termed homeoviscous adaptation (Hazel, Reference Hazel1995; Thyrring, Tremblay & Sejr, Reference Thyrring, Tremblay and Sejr2017). Increases in UI and CFI of phospholipids are signs of homeoviscous adaptation (Munro et al., Reference Munro, Martel and Blier2015). Elevated values of CFI were noted in the gills and digestive glands of intertidal and aquaculture mussels collected in early May and November, i.е. when the ambient temperature was lowered. Reductions in the fatty acid unsaturation indexes of phospholipids were observed in gills and digestive glands of the mussels collected later in May and August (with a rise in ambient temperature), whereas unsaturation of triacylglycerols was increased. This phenomenon confirms the assumption of selective incorporation of PUFAs in mussels’ phospholipids and triacylglycerols (Delaporte et al., Reference Delaporte, Soudant, Moal, Kraffe, Marty and Samain2005; Munro et al., Reference Munro, Martel and Blier2015; Parent et al., Reference Parent, Pernet, Tremblay, Sevigny and Ouellette2008; Pernet et al., Reference Pernet, Tremblay, Comeau and Guderley2007; Thyrring et al., Reference Thyrring, Tremblay and Sejr2017), and probably points to different mechanisms of regulating their unsaturation level. The accumulation of unsaturated fatty acids in TAGs occurred during a period of food availability that included dominant phytoplankton enriched with PUFAs (in later May and August), whereas phospholipid unsaturation level was determined by the ambient temperature and reflected the processes of membrane lipid remodelling. The accumulation of n-3 PUFAs (chiefly EPA and DHA) and n-6 PUFAs (in particular AA) in the composition of phospholipids was observed predominantly in the gills of intertidal mussels in November. The mussels apparently stored up unsaturated fatty acids, mainly of the n-3 PUFA family, within membrane lipids prior to the long winter to survive the below-zero temperatures, ice-covered conditions and prolonged starvation. The reserves of n-3 PUFA in gills of intertidal mussels were depleted by the end of the winter (in May), mainly at the expense of EPA and DHA. At the same time, the level of AA (the main fatty acid of the n-6 PUFA family) in phospholipids of gills and digestive glands sampled late in winter remained quite high, probably because of the regulatory function of these fatty acids (Vance & Vance, Reference Vance and Vance2002), which maintain the requisite membrane fluidity while n-3 PUFA and NMIFA are deficient. AA is actively utilised in the synthesis of eicosanoids, biologically active molecules, which participate in the molecular adaptations of animals to various impacts (Freas & Grollman, Reference Freas and Grollman1980; Stanley-Samuelson, Reference Stanley-Samuelson1987). As bivalve molluscs derive these PUFA from food and can hardly synthesise them endogenously (Berge & Barnathan, Reference Bergé, Barnathan, Le Gal and Ulber2005; Kelly & Scheibling, Reference Kelly and Scheibling2012), the accumulation of these acids in mussels is probably attributable to their sufficiently high exogenous supply, i.e. with phytoplankton. NMIFA have been reported (Barnathan, Reference Barnathan2009) to substitute PUFA where they are deficient in membrane phospholipids, thus regulating membrane fluidity. In addition, their specific structure makes NMIFA more resistant to oxidation processes compared to methylene-interrupted unsaturated acids (Barnathan, Reference Barnathan2009; Zhukova, Reference Zhukova1992). Increased concentrations of NMIFA in gill phospholipids were noted in mussels collected in all studied seasons except for early May. In early May and November, digestive gland phospholipids contained elevated NMIFA concentrations, which make the membranes resistant to low-temperature effects.
Proportion of intertidal (A) and aquaculture (B) mussels Mytilus edulis at different reproductive stages presented in the samples collected in Kandalaksha Bay, in the White Sea, throughout the year. The reproductive stages were identified histologically as gonadal restoration after spawning (Stage 0), early gametogenesis (Stage I), active gametogenesis (Stage II), and maturity (Stage III). A full description of the data is provided in Fokina et al. (Reference Fokina, Storhaug, Bakhmet, Maximovich, Frantzen and Nahrgang2018).
The effect of habitat conditions (tidal zone) on seasonal lipid composition changes in mussels
In early May, the membrane lipid composition in intertidal mussels was significantly different, the distinctions, as described above, being associated with intertidal habitat conditions in spring in the White Sea (low salinity and ice-covered conditions). High levels of phospholipids and sterols are likely to perform a protective function in cell membranes against freezing and low salinity effects. It has been shown in experimental works that the addition of cholesterol and phospholipids to cell cultures including mussel embryonic cells during cryopreservation increased the stability of cell membranes under a freezing effect (Kostetsky, Boroda & Odintsova, Reference Kostetsky, Boroda and Odintsova2008; Odintsova, Ageenko, Kiselev, Sanina & Kostetsky, Reference Odintsova, Ageenko, Kiselev, Sanina and Kostetsky2006).
The elevated levels of TAGs, as well as high n-3 PUFA content (mainly EPA and DHA) and increased unsaturation indexes (UI and CFI) of phospholipids in the gills and digestive glands of aquaculture mussels, points to high food availability and relatively stable conditions for the mussels growing on raft suspended substrates in comparison with intertidal mussels (Ezgeta-Balic et al., Reference Ezgeta-Balić, Najdek, Peharda and Blažina2012). The differences detected in the lipid composition of mussels from studied tidal zones are also associated with differences in food (seston) availability and quality (Ezgeta-Balic et al., Reference Ezgeta-Balić, Najdek, Peharda and Blažina2012; Fernandez-Reiriz et al., Reference Fernández-Reiriz, Irisarri and Labarta2016; Freites et al., Reference Freites, Fernandez-Reiriz and Labarta2002a,Reference Freites, Fernandez-Reiriz and Labartab; Gaillard et al., Reference Gaillard, Meziane, Tremblay, Archambault, Layton, Martel and Olivier2015; Labarda et al., Reference Labarta, Fernández-Reiríz and Babarro1997). During periodic desiccations, when intertidal molluscs experience food shortage, energy reserves (including triacylglycerols and polyunsaturated fatty acids) undergo substantial modifications (Freites et al., Reference Freites, Fernandez-Reiriz and Labarta2002a,Reference Freites, Fernandez-Reiriz and Labartab). Moreover, origin-related differences in the physiological and metabolic characteristics of intertidal and aquaculture mussels reflect specific energy distribution patterns: a major part of the energy use of intertidal mussels is to build a thicker shell, whereas cultured mussels use their energy to grow (Fernandez-Reiriz et al., Reference Fernández-Reiriz, Irisarri and Labarta2016).
In intertidal mussels the high AA content mainly in phospholipids and TAGs of digestive glands is probably a result of selective accumulation of this acid in the mussels, as it is needed for the synthesis of eicosanoids (Freites et al., Reference Freites, Fernandez-Reiriz and Labarta2002b,Reference Freites, Labarta and Fernández-Reirizc). In addition, habitat conditions caused changes in the timing of accumulation of phytoplankton-origin n-3 PUFAs (EPA and DHA) in phospholipids of gills. Intertidal mussels accumulated these acids in November, whereas cultured mussels accumulated them in June, with noted declines by August–November. Apparently this was caused by differences in the availability and distribution of plankton species enriched with n-3 PUFAs in the tidal zones (Gaillard et al., Reference Gaillard, Meziane, Tremblay, Archambault, Layton, Martel and Olivier2015)
Conclusions
We demonstrate that the lipid composition of gills and digestive glands in both intertidal and aquaculture blue mussels, Mytilus edulis L., from the White Sea undergoes seasonal modifications associated with environmental factors (primarily low temperature), reproductive activity and food availability. The data from this study indicate that intertidal blue mussels possess adaptive biochemical mechanisms at the level of gill- and digestive-gland lipid composition, which are meant to maintain the integrity of the membrane structure in these molluscs, constantly exposed to environmental fluctuations in the coastal zone. In particular, under low salinity and ice-covered conditions (in early May) gills and digestive glands of intertidal mussels contained high concentrations of lipids, chiefly phospholipids and sterols, apparently pointing to their protective role in stabilisation of the membrane structure. Moreover, these environmental factors in early May affected the timing of gametogenesis activation in intertidal mussels. Furthermore, elevated concentrations of triacylglycerols and phytoplankton-origin n-3 PUFA in the gills and digestive glands of mussels from aquaculture reflect the relatively stable conditions in their habitat (constant temperature, salinity, and food availability).
Despite significant differences in lipid composition of intertidal and aquaculture mussels, seasonal changes in the membrane lipid content (mainly PE) and phospholipids' fatty acid composition of mussels from both tidal zones reflected the remodelling processes providing homeoviscous adaptation under low-temperature effects. Similar changes in the TAG levels and fatty acid composition in intertidal and aquaculture mussels were probably due to differences in food availability between the seasons. Thus, the result of selective incorporation of PUFAs in membrane (phospholipids) and storage (triacylglycerols) lipids was also found in both intertidal and aquaculture mussels. Nevertheless, variations of storage lipid (TAGs and sterol esters) content testified also to reproductive activity in the mussels from both tidal zones.
Given that gills of bivalve molluscs are often used as the target organ in assessments of the toxic effect of pollutants and in monitoring surveys of coastal waters, the seasonal dynamics of the lipid and fatty acid composition of gills should be taken into account when interpreting the results. For instance, in intertidal molluscs exposed to a large drop in salinity and sub-zero temperatures in spring in the polar zone, pollution can significantly modify the response of the metabolic indices. The metabolic response of polar inhabitants counterbalances the combined effect of abiotic and anthropogenic factors of the environment on the organism, as compared to temperate ones. Further research will include a comparative study of interspecific features in the seasonal distribution of lipid composition in two mussel species (Mytilus edulis and Mytilus trossulus) coexisting in Kandalaksha Bay of the White Sea. This will reveal possible biochemical mechanisms providing different thermal tolerance of these blue mussel species.
Acknowledgements
We are deeply grateful to the staff of the White Sea Biological Station, Zoological Institute of the Russian Academy of Sciences, especially Drs V.J. Berger, A.A. Sukhotin and V.V. Khalaman for the possibility to carry out research at the station. We are also deeply grateful to Dr N.V. Maximovich for detection of the gonad maturation stages in mussels. We would also like to thank I.N. Bakhmet and I.V. Sukhovskaya for sampling mussels. We thank the anonymous reviewers for valuable comments on the manuscript.
Financial support
This study was supported by federal funding for governmental-order project theme nr. 0221-2017-0050 (nr. АААА-А17-117031710039-3).



