1 Introduction
Modern turbofan engines have increasingly high bypass ratios. Fan broadband noise has, therefore, become a dominant noise source, particularly at approach conditions. One of the major noise sources arises from the interaction between rotor wake turbulence and the leading edge of the downstream outlet guide vanes. Recent flightpath 2050 targets have been set aimed at reducing noise emissions by 65 % by 2050. Wind turbines are another important environmental noise source where the interaction of turbulence with the aerofoil leading edge is believed to be the dominant noise source at low frequencies in which large-scale atmospheric turbulence interacts with the rotating blades.
The effects of aerofoil geometry on turbulence–aerofoil interaction noise has been studied extensively (Evers & Peake Reference Evers and Peake2002; Gershfeld Reference Gershfeld2004; Moriarty, Guidati & Migliore Reference Moriarty, Guidati and Migliore2005; Devenport, Staubs & Glegg Reference Devenport, Staubs and Glegg2010; Roger Reference Roger2010; Gill, Zhang & Joseph Reference Gill, Zhang and Joseph2013; Lysak, Capone & Jonson Reference Lysak, Capone and Jonson2013; Chaitanya et al. Reference Chaitanya, Gill, Narayanan, Joseph, Vanderwel, Zhang and Ganapathisubramani2015a ). It has been demonstrated by the authors of the current paper (Haeri et al. Reference Haeri, Kim, Narayanan and Joseph2014; Narayanan et al. Reference Narayanan, Joseph, Haeri, Kim, Chaitanya and Polacsek2014, Reference Narayanan, Chaitanya, Haeri, Joseph, Kim and Polacsek2015; Chaitanya et al. Reference Chaitanya, Narayanan, Joseph, Vanderwel, Turner, Kim and Ganapathisubramani2015b ; Kim, Haeri & Joseph Reference Kim, Haeri and Joseph2016) and others that introducing leading edge serrations can be an effective method of reducing far field noise. This previous work was limited in scope and provided no insight in the optimum serration geometry. The present paper aims to identify the optimum serration geometry and apply it to aerofoils. A comprehensive study into the effectiveness of sinusoidal leading edge serrations is presented for reducing aerofoil interaction noise that includes an investigation into their effect on aerodynamic performance. Acoustic measurements are made alongside aerodynamic measurements to provide a detailed assessment of their potential effectiveness in reducing the noise from an aerofoil of 10 % thickness and 1.2 camber, which is expressed as a lift coefficient. This paper also presents a preliminary investigation into the use of leading edge (LE) serrations for the reduction of trailing edge self-noise. Detailed noise measurements are made on both flat plates and three-dimensional (3-D) aerofoils. Similar noise reduction characteristics are observed in both cases suggesting that the flat plate experiments capture the essential physical noise reduction mechanisms (Haeri et al. Reference Haeri, Kim, Narayanan and Joseph2014; Narayanan et al. Reference Narayanan, Joseph, Haeri, Kim, Chaitanya and Polacsek2014).
The objectives of this paper are as follows.
-
(i) To examine the sensitivity of noise reductions to variations in serration parameters (amplitude and wavelength) and turbulence integral length scale on flat plates.
-
(ii) To examine the noise generation mechanism and therefore identify the optimum serration geometry.
-
(iii) To apply the above findings to inform the design of effective leading edge serrations on 3-D aerofoils.
-
(iv) To investigate the effect of leading edge serrations on aerofoil self-noise.
-
(v) To provide a simple model to predict the observed frequency dependence of the noise reduction spectra.
-
(vi) To visualize the flow around the peak and valley regions of the leading edge serration to assess the effect of these regions on the steady aerodynamic behaviour.
-
(vii) To quantify the aerodynamic performance of serrated aerofoils at low angles of attack.
2 Background
Leading edge serrations can be found on owl wings and whale flippers to reduce noise and enhance hydro and aerodynamic performance. It has long been established that introducing LE serrations on aerofoils can improve their aerodynamic performance at post-stall conditions (Johari et al. Reference Johari, Henoch, Custodio and Levshin2007; Hansen, Kelso & Dally Reference Hansen, Kelso and Dally2011; Yoon et al. Reference Yoon, Hung, Jung and Kim2011; Zhang, Wang & Xu Reference Zhang, Wang and Xu2013; Skillen et al. Reference Skillen, Revell, Pinelli, Piomelli and Favier2014). Collins (Reference Collins1981) has observed that the presence of leading edge serrations on wings can improve the low-speed lift and stall performance of aircraft during take-off and landing. Bachmann et al. (Reference Bachmann, Kln, Baumgartner, Klaas, Schrder and Wagner2007) showed that the barn owl exhibits ‘silent’ flight due to serrations at the leading edge of the wing and the fringes at the edges of each feather. They proposed that the topographies and mechanisms underlying this silent flight might eventually be employed for aerodynamic purposes, thus resulting in new wing designs in modern aircraft. They showed that the owl is quieter than the pigeon due to the presence of serrations at its leading edge and the fringes at the edges of each quill.
Soderman (Reference Soderman1972) was one of the first to investigate the aerodynamic effects of LE serrations on an aerofoil in a closed wind tunnel. He observed that, at a flow speed Mach number of 0.13, by placing small serrations on the aerofoil leading edge, vortices were generated which could enhance the maximum lift at high angles of attack. It was also observed that the presence of small amplitude serrations on the aerofoil does not increase the drag at smaller angles of attack and reduces it at larger angles. Visualization of the flow showed that the serrated edges introduce vortices which energize the boundary layer thereby delaying leading edge flow separation at higher angles of attack.
Hersh, Soderman & Hayden (Reference Hersh, Soderman and Hayden1974) have demonstrated the effectiveness of LE serrations in reducing the narrow band vortex shedding noise radiated from stationary and rotating aerofoils. Noise reductions of between 4 and 8 dB were observed at the peak shedding frequency, which they attributed to the formation of vortices breaking up the periodic structure of the wake.
A significant amount of work has been undertaken experimentally and numerically aimed at assessing the effectiveness of leading edge serrations on delaying stall. Miklosovic et al. (Reference Miklosovic, Murray, Howle and Fish2004) conducted the first wind tunnel tests using idealized models of humpback whale flippers at mean chord Reynolds numbers in the range of
 $5.05\times 10^{5}$
–
 $5.20\times 10^{5}$
and attack angles in the range of
 $-2^{\circ }{-}20^{\circ }$
. They demonstrated experimentally that the angle of attack at which stall occurred was significantly delayed when leading edge serrations were introduced onto a model whale flipper geometry. Miklosovic, Murray & Howle (Reference Miklosovic, Murray and Howle2007) performed the aerodynamic evaluation on a full-scale humpback whale flipper geometry to simulate the effects of LE tubercles. They demonstrated experimentally that serrations on the aerofoil leading edge produced vortices from the serration peaks which significantly altered the performance of the serrated aerofoil. The significance of these vortices in affecting aerodynamic behaviour was also observed by Stanway (Reference Stanway2008) in particle image velocimetry (PIV) measurements of the flow in the vicinity of a serrated leading edge. A number of researchers (Fish & Lauder Reference Fish and Lauder2006; Van Nierop, Alben & Brenner Reference Van Nierop, Alben and Brenner2008; Fish et al.
Reference Fish, Weber, Murray and Howle2011; Zhang et al.
Reference Zhang, Wang and Xu2013) have investigated the mechanism by which stall can be delayed by the introduction of serrations at the aerofoil leading edge. They observed that the LE serrations generate streamwise vortices, which were attributed to greatly enhanced momentum transfer. This results in a significant reduction of flow separation and therefore improvement in the aerofoil aerodynamics within the wide range of post-stall angles of attack. More recently, Skillen et al. (Reference Skillen, Revell, Pinelli, Piomelli and Favier2014) have also explored the mechanism involved in the reduction of the separation region at high angles of attack by the use of serrated aerofoils. They showed that the serrated leading edge introduces a strong spanwise pressure gradient which results in the formation of secondary flows (additional streamwise flow along the serration edge). This secondary flow transports the near-wall fluid which is replaced by the high-momentum fluid available in the flow. The boundary layer is then re-energized which might be a reason for the delay in flow separation for serrated aerofoils.
Recently, Rostamzadeh et al. (Reference Rostamzadeh, Kelso, Dally and Hansen2013) proposed a design of a leading edge comprising out-of-plane sinusoidal modulations with the objective of improving aerodynamic performance. They compared the aerodynamic characteristics of aerofoils with tubercles (modulation in the chord plane) with predictions obtained from Prandtl’s nonlinear lifting-line theory. They demonstrated that both in-plane and out of plane leading edge modulations have similar aerodynamic lift and drag characteristics. The wavy serrated aerofoil with the highest peak-to-valley amplitude and smallest wavelength was found to have the most favourable post-stall behaviour. They also showed, using computation fluid dynamics (CFD), that the valley of the serrated aerofoils was subjected to adverse pressure gradients resulting in flow separation.
Favier, Pinelli & Piomelli (Reference Favier, Pinelli and Piomelli2012) performed a direct numerical simulations (DNS) study on serrated geometries for low Reynolds number flow. They observed a 35 % reduction in drag and a significant reduction in lift compared with the baseline (straight leading edge) aerofoil. Hansen et al. (Reference Hansen, Kelso and Dally2011) measured the lift and drag of several serrated geometries. They observed that, for the aerofoil of maximum thickness at 50 % chord, the effect on the lift in the pre-stall regime was negligible but beneficial in the post-stall regime. For the NACA0021 aerofoil, where the maximum thickness is at 30 % chord, the lift performance in the post-stall regime increased but was degraded in the pre-stall regime. It was also observed that optimizing the serration amplitude and wavelength can increase the lift performance in both pre-stall and post-stall regimes. Skillen et al. (Reference Skillen, Revell, Pinelli, Piomelli and Favier2014) have noted discrepancies the measured and predicted lift on serrated aerofoils, which they attributed to uncertainties in reproducing wind tunnel experimental conditions.
Chong et al. (Reference Chong, Vathylakis, McEwen, Kemsley, Muhammad and Siddiqi2015) have measured the lift and drag of a serrated aerofoil and found that increasing the serration wavelength tended to improve performance at angles of attack close to stall. However, the lift coefficient in the pre-stall region was observed to be lower compared to the baseline (straight edge) aerofoil. The explanation for the increased stall angle compared to the straight edge aerofoil was investigated using oil visualization. In the case of a straight leading edge, boundary layer separation is apparent whereas LE serrations produce counter-rotating vortices causing the boundary layer separation to be suppressed.
Whilst the use of leading edge serrations have been investigated extensively for improving aerodynamic performance, comparatively little work has been undertaken aimed at its aeroacoustics performance.
Roger, Schram & Santana (Reference Roger, Schram, Santana and De2013) have formulated an analytic model for the sound generation due to a turbulent flow interacting with a flat plate serrated leading edge of the infinite chord. Their model treats the serrations as a continuously varying leading edge sweep whose unsteady aerodynamic response is predicted by splitting the aerofoil into strips of a small spanwise extent and assimilating the local curved edge to its tangent to make each strip a slice of a swept aerofoil, whose response functions are known. The model makes explicit the relative significance of super-critical and sub-critical gust components to the overall far-field noise radiation.
Lau, Haeri & Kim (Reference Lau, Haeri and Kim2013) have investigated numerically the effects of serrated leading edges on the noise due to a single harmonic vortical gust. This work has demonstrated that one of the key factors in determining the level of noise reduction is the ratio between the leading edge amplitude and the hydrodynamic wavelength. This finding is supported by the experimental work presented in the present paper for a turbulent in-flow but only at the optimum serration angle which is related to the turbulence integral length scale. Lau et al. (Reference Lau, Haeri and Kim2013) found from numerical simulations that significant noise reductions were achieved when the ratio between the leading edge amplitude to the gust wavelength exceeds approximately 0.3. In their paper, they attribute the reductions in noise to a more rapid phase variation of pressure fluctuations along the serrated LE compared to the straight leading edge. This explanation of the noise reduction mechanism is consistent with the strip model proposed by Roger et al. (Reference Roger, Schram, Santana and De2013).
Clair et al. (Reference Clair, Polacsek, Garrec, Reboul, Gruber and Joseph2013) have presented a numerical and experimental investigation into the effect of sinusoidal leading edge serrations for the reduction of turbulence–aerofoil interaction noise. Reductions in sound power level over a wide frequency range of between 3 and 4 dB were both measured and predicted for a NACA65 aerofoil with 0.15 m chord over a range of flow speeds between
 $20{-}80~\text{m}~\text{s}^{-1}$
. The reason for these modest noise reductions compared to the much larger noise reductions presented in Narayanan et al. (Reference Narayanan, Chaitanya, Haeri, Joseph, Kim and Polacsek2015) is due to the relatively short serration amplitudes investigated. In Clair et al. (Reference Clair, Polacsek, Garrec, Reboul, Gruber and Joseph2013) noise reductions at high frequencies (between approximately 3 and 4 kHz) were predicted to be greater than that measured, which were attributed to the spanwise gusts contribution being neglected in the computations.
Through numerical simulations based on the compressible 3-D Euler equations and a synthetic eddy method for the turbulence generation, Kim et al. (Reference Kim, Haeri and Joseph2016) investigated the noise reduction mechanisms of sinusoidal leading edge serrated aerofoils. They found that the surface pressure fluctuations along the leading edge exhibit a source cutoff effect due to oblique edge which results in reduced radiated sound power levels. He also demonstrated destructive interference effect between the peak and hill region is one of the reasons for noise reductions.
Lyu, Azarpeyvand & Sinayoko (Reference Lyu, Azarpeyvand and Sinayoko2016) have developed a complete mathematical model to predict the sound radiated by serrated leading edge geometries. The model is based on an iterative form of the Amiet approach solved using the Schwarzschild technique. The solution most likely converges to the exact solution for a single component of gust turbulence. However, in practice, only a few terms were needed to obtain good convergence of the solution. The response to a turbulent flow is synthesized by the summing the response incoherently due to each oblique gust component. The predictions are in close agreement with the experimental data. In this paper, Lyu et al. (Reference Lyu, Azarpeyvand and Sinayoko2016) attribute the noise reduction mechanism to destructive interference of the scattered surface pressure induced by the presence of serrations.
The authors of this paper (Narayanan et al.
Reference Narayanan, Chaitanya, Haeri, Joseph, Kim and Polacsek2015) have recently undertaken a preliminary parametric study to quantify experimentally the sensitivity of the reductions in radiated noise to variations in the serration amplitude and wavelength. They identified the minimum frequency
 $f_{3\,\text{dB}}$
, above which significant noise reductions are achieved (
 ${>}3$
dB). For all the serration geometries investigated,
 $f_{3\,\text{dB}}$
was observed to closely follow the relationship
 $f_{3\,\text{dB}}=\unicode[STIX]{x1D6FC}U/2h$
, where
 $h$
is the serration amplitude,
 $U$
is the flow velocity and
 $\unicode[STIX]{x1D6FC}$
is a constant varying between 0.4 and 0.6. This relation is consistent with the simulations of Clair et al. (Reference Clair, Polacsek, Garrec, Reboul, Gruber and Joseph2013), who found that the frequency range where noise reductions are observed increases as the mean flow speed
 $U$
is reduced. Most of the work in Narayanan et al. (Reference Narayanan, Chaitanya, Haeri, Joseph, Kim and Polacsek2015) was performed on flat plates with only a limited comparison being presented with serrations on 3-D aerofoils. Another study by the present authors (Chaitanya et al.
Reference Chaitanya, Narayanan, Joseph, Vanderwel, Turner, Kim and Ganapathisubramani2015b
) showed the possible existence of an optimum serration inclination angle
 $\unicode[STIX]{x1D703}_{o}$
at which maximum noise reductions occur. This angle was found to be dependent on the integral length scale of the incoming turbulence. The evidence of an optimal serration angle
 $\unicode[STIX]{x1D703}_{o}$
may help to explain the conflicting findings of Hansen et al. (Reference Hansen, Kelso and Dally2011) and Narayanan et al. (Reference Narayanan, Chaitanya, Haeri, Joseph, Kim and Polacsek2015) regarding the influence of LE wavelength on noise reductions. It is likely that in the cases investigated by Narayanan et al. (Reference Narayanan, Chaitanya, Haeri, Joseph, Kim and Polacsek2015) the leading edge profiles represent serration angles greater than the optimum angle, resulting in sub-optimal noise reductions. In the case of Hansen et al. (Reference Hansen, Kelso and Dally2011) the opposite is true and the inclination angles investigated were smaller than the optimum angle identified in Chaitanya et al. (Reference Chaitanya, Narayanan, Joseph, Vanderwel, Turner, Kim and Ganapathisubramani2015b
). The present study explores this finding in greater detail. Here we show that the optimum serration wavelength, rather than angle, provides a more fundamental interpretation of the experimental noise data. More recent work by Kim et al. (Reference Kim, Haeri and Joseph2016) has investigated numerically the possible noise reduction mechanism due to leading edge serrations. These noise reduction mechanisms are consistent with the experimental results reported here. In the present paper, the preliminary findings outlined above are investigated in greater detail. The sound power reduction spectra are observed to collapse when plotted against Strouhal frequency,
 $St_{h}$
, where
 $St_{h}=fh/U$
. This finding strongly suggests that, at the optimum serration wavelength, noise reductions are determined solely by the ratio of the serration amplitude
 $h$
to hydrodynamic wavelength
 $\unicode[STIX]{x1D706}_{h}=U/f$
. Moreover, at the optimum wavelength, sound power reductions are observed to follow an inverse Strouhal dependence
 $\propto 1/St_{h}$
. A very simple model is developed in this paper aimed at interpreting this Strouhal dependence.
3 Experimental set-up and procedure
3.1 Flat plate aerofoils
A parametric experimental study was undertaken to investigate the effect on radiated noise due to variations in serration amplitude and wavelength on flat plates based on the assumption that the flat plate serrations capture the same noise reduction mechanisms as those for 3-D aerofoils. The optimal serration geometry identified from this flat plate study was used to investigate a limited number of 3-D aerofoils.
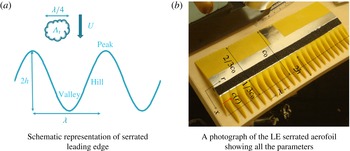
The serrated flat plate is constructed from two metallic plates of 1 mm thickness riveted together. The flat plate serrations made from acrylic plate of 2 mm thickness are inserted in between the two 1 mm plates. The two steps caused by the serration inserts are ‘ground down’ to smooth the step. The trailing edge of the plate is sharpened to prevent vortex shedding noise, although the leading edge was left blunt i.e. was not sharpened like the trailing edge for consistency across all serrations investigated. The dimensions of the flat plate are 15 cm mean chord and 45 cm span. A schematic of the serrated sinusoidal geometry is shown in figure 1(a) located downstream of a single turbulent eddy whose size is one-fourth the serration wavelength, which we will later show corresponds to the optimum serration wavelength for maximum noise reduction. In the present study, a total of 50 flat plate serrations were investigated. A systematic variation of up to 15 serration wavelengths
 $\unicode[STIX]{x1D706}/\unicode[STIX]{x1D6EC}_{t}$
from 0.8 to 100 was investigated comprising five different serration amplitudes (
 $h/c_{0}$
) of 0.033, 0.67, 0.1, 0.133 and 0.167.
Leading edge geometry with serrated wavelength,
 $\unicode[STIX]{x1D706}$
; serrated amplitude,
 $h$
; flow speed,
 $U$
; transverse integral length scale of incoming turbulence,
 $\unicode[STIX]{x1D6EC}_{t}$
; mean chord length,
 $c_{0}$
.

3.2 Three-dimensional aerofoil models
The results from the flat plate study presented in § 4.1 below were used to define five 3-D serrated leading edge aerofoil geometries on the NACA-65(12)10 aerofoil. Serration wavelengths
 $\unicode[STIX]{x1D706}/\unicode[STIX]{x1D6EC}_{t}$
ranged between 2.67–8, chosen to be close to the optimum wavelength
 $\unicode[STIX]{x1D706}_{o}$
of
 ${\approx}4\unicode[STIX]{x1D6EC}_{t}$
(discussed below in § 4.1). These were fabricated using a 3-D printer from durable acrylonitrile butadiene styrene (ABS) photo polymer that has a high-quality surface finish. The material and printer were chosen specifically for their high-quality finish. The surface roughness can only be detected and measured using a microscope. The self-noise was measured on a NACA0012 aerofoil constructed from this polymer with an aerofoil constructed from carbon fibre, which has a much smoother finish. The noise spectra were well within repeatability errors (less than 0.5 dB).
Three serration amplitudes (
 $h/c_{0}$
) of 0.067, 0.1, 0.167, with a constant serration wavelength (
 $\unicode[STIX]{x1D706}/\unicode[STIX]{x1D6EC}_{t}$
) of 2.67 were investigated. Two of the aerofoils were chosen to have constant amplitudes (
 $h/c_{0}$
) of 0.167 with differing serration wavelengths (
 $\unicode[STIX]{x1D706}/\unicode[STIX]{x1D6EC}_{t}$
) of 5.33 and 8.
A photograph of a typical serrated aerofoil is shown in figure 1(b), with the serration parameters, wavelength
 $\unicode[STIX]{x1D706}$
, total peak–valley distance
 $2h$
, mean chord
 $c_{0}$
, defined. The serrated leading edge profiles are such that if
 $y(X)=f(X)$
defines the variation of height above the origin for the NACA-65(12)10 aerofoil profile, where
 $X=0$
represents the trailing edge and
 $X=1$
the leading edge, the profile
 $y(X,r)$
at any spanwise position
 $r$
along the aerofoil is given by,
 $$\begin{eqnarray}y(X,r)=\left\{\begin{array}{@{}ll@{}}f(x/c_{0}),\quad & 0<x/c_{0}<2/3\\ f(x/c(r)),\quad & 2/3<x/c(r)<1,\end{array}\right.\end{eqnarray}$$
where the chord is a function of span
 $r$
, i.e.
 $c(r)=c_{0}+h\sin (2\unicode[STIX]{x03C0}r/\unicode[STIX]{x1D706})$
and
 $x$
varies between 0 at the trailing edge and
 $x=c(r)$
at the leading edge. The small discontinuity at
 $c_{0}/3$
implied by (3.1) will only affect boundary layer development downstream of this location, and hence affect trailing edge self-noise. However, this is also the location of the trip and is therefore not a significant issue in these leading edge noise measurements.
Note that in this paper the serration amplitude (
 $h$
) is normalized by the mean chord
 $c_{0}$
for convenience although there is no evidence to suggest that this is a meaningful parameter in determining noise reductions. The mean chord and span of the aerofoils are 15 cm and 45 cm, respectively.
3.3 Open-jet test facility and instrumentation
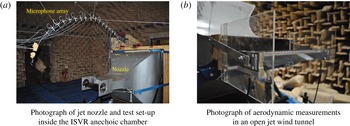
Far-field noise measurements were carried out at the Institute of Sound and Vibration Research’s open-jet wind tunnel facility. Figure 2(a) shows a photograph of the facility within the anechoic chamber of dimensions 8 m
 $\times$
8 m
 $\times$
8 m. The walls are acoustically treated with glass wool wedges. The cutoff frequency of the chamber is approximately 80 Hz. A detailed description of the facility is presented by Chong, Joseph & Davies (Reference Chong, Joseph and Davies2008). To maintain two-dimensional flow around the aerofoil, side plates are mounted to the nozzle exit which will also support the aerofoil. Care is taken to ensure that there are no gaps between the side plates and aerofoils and that all surfaces are smooth by using speed tape. We made sure the noise is clearly radiated from the leading edge and trailing edge of the aerofoil, with no evidence of additional noise sources as shown previously by Gruber (Reference Gruber2012). The nozzle dimensions are 15 cm
 $\times$
45 cm. Aerofoils are located 0.15 m downstream of the nozzle to ensure that the entire aerofoil is located well within the jet potential core, whose width is at least 12cm, as shown in figure 11 (a) in Chong et al. (Reference Chong, Joseph and Davies2008). As shown in Chong et al. (Reference Chong, Joseph and Davies2008) the flow is two-dimensional (no spanwise variation) to within an deviation of approximately 4 %. The turbulence intensity in the clean jet is approximately 0.4 %. The maximum jet speed investigated in this study is 80 m s
 $^{-1}$
.
Experimental set-up.

In order to prevent tonal noise generation due to Tollmien–Schlichting waves convecting in the laminar boundary layer, and to ensure complete consistency between the different cases, the flow near the leading edge of the aerofoil was tripped to force transition to turbulence using a rough band of tape of width 1.25 cm located 16.6 % of chord from the leading edge, on both suction and pressure sides. The tape has roughness of SS 100, corresponding to a surface roughness of
 $140~\unicode[STIX]{x03BC}\text{m}$
. Transition is forced by the use of trip tape, which is many orders of magnitude rougher than the aerofoil surface, and is therefore highly unlikely to affect transition. Previous noise measurements in our facility have indicated that self-noise is insensitive to the method of tripping.
3.4 Far-field noise measurements
Far-field noise measurements were made using 11 half-inch condenser microphones (B&K type 4189) located at a constant radial distance of 1.2 m from the mid-span of the aerofoil leading edge. These microphones are placed at emission angles of between
 $40^{\circ }$
and
 $140^{\circ }$
measured relative to the downstream jet axis. Measurements were carried for 10 s duration at a sampling frequency of 50 kHz, and the noise spectra were calculated with a window size of 1024 data points corresponding to a frequency resolution of 48.83 Hz and a
 $BT$
product of about 500, which is sufficient to ensure negligible variance in the spectral estimate.
The acoustic pressure at the microphones was recorded at the mean flow velocities (
 $U$
) of 20, 40, 60 and 80 m s
 $^{-1}$
at the exit of the jet nozzle. Details of the calculation method for deducing the sound pressure level spectra
 $\text{SPL}(f)$
, and the sound power level spectra
 $\text{PWL}(f)$
are presented in Narayanan et al. (Reference Narayanan, Chaitanya, Haeri, Joseph, Kim and Polacsek2015).
3.5 Turbulence characterization
A bi-planar rectangular grid with overall dimensions of 630
 $\times$
690 mm
 $^{2}$
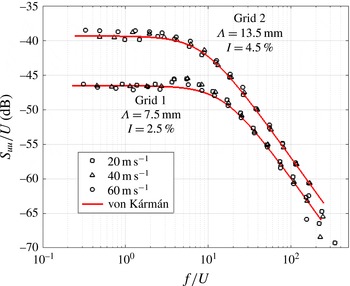
located in the contraction section of the nozzle was used to generate turbulence that is closely homogeneous and isotropic. The grid was located 75 cm upstream of the nozzle exit. The streamwise velocity spectrum was measured using a hot-wire at a single on-axis position 145 mm downstream from the nozzle exit. It is found to be in close agreement with the von Kármán spectrum for homogeneous and isotropic turbulence with a 2.5 % turbulence intensity and a 7.5 mm integral length scale. This turbulent intensity is sufficient to make the leading edge noise source dominant over trailing edge noise across the frequency range where interaction noise is dominant. Another grid of the same overall dimension but with multiple holes of 40 mm diameter was also used to generate homogeneous and isotropic turbulence but at a much larger length scale of approximately 13.5 mm and a turbulence intensity of 4.5 %. The turbulence integral length scale was obtained by matching the theoretical spectra to the measured streamwise velocity spectra and dividing by two, assuming perfect isotropic turbulence. The integral length scale (
 $\unicode[STIX]{x1D6EC}_{t}$
) associated with the transverse velocity component (responsible for noise generation on a flat plate) was inferred from the streamwise length scale to be 3.75 mm and 6.75 mm respectively. A comparison of the two measured streamwise velocity spectra (
 $S_{uu}/U$
) plotted against
 $f/U$
together with the theoretical von Kármán spectra are plotted in figure 3, where close agreement is observed.
Comparison between the measured axial velocity spectra and theoretical von Kármán spectra.

3.6 Particle image velocimetry set-up
To assess whether the presence of leading edge serrations on an aerofoil is detrimental to its aerodynamic behaviour the flow field around the serrated NACA65 aerofoil was investigated in detail using PIV. Two LaVision Imager-LX 29MP (megapixel) charged couple device (CCD) cameras, fitted with lenses having a focal length of 100 mm and with an aperture of f5.6, was focused on the aerofoil for two different field of views. One field of view focuses on the aerofoil leading edge while the second focuses on the complete aerofoil to observe the boundary layer development and wake properties. The laser source is a Nd:YAG laser Bernoulli 200-15 PIV which was focused into a thin laser sheet oriented parallel to the chord and was sequentially aligned with the valley and a peak of the leading edge serrations. A fog machine (Magnum 1200) was placed at the inlet of the fan of the wind tunnel resulting in homogeneous smoke emerging from the jet nozzle and passing over the aerofoil. Camera measurements were recorded at 1 Hz, with an image pair separation time (
 $\text{d}t$
) of
 $20~\unicode[STIX]{x03BC}\text{s}$
. An average of 500 measurements were taken to obtain the mean velocity vectors around the aerofoil. The arrangement of cameras and lasers in relation to the jet nozzle are discussed in more detailed in Chaitanya et al. (Reference Chaitanya, Narayanan, Joseph, Vanderwel, Turner, Kim and Ganapathisubramani2015b
).
3.7 Aerodynamic measurements
To evaluate the aerodynamic performance of the baseline and serrated aerofoils, the vertical and horizontal forces acting on the aerofoil were measured using a two-axis load cell (NOVATECH
 $F314$
) which were mounted on either side of the aerofoil as shown in figure 2(b). Aerofoils were directly mounted on the load cell using a single shaft which minimizes the other reaction forces that could influence the lift and drag measurements. The force resolution of the load cell is 0.1 N corresponding to a measurement error of less than 1 %. The measurements were carried out at jet velocities of 20, 40 and 60 m s
 $^{-1}$
and the geometric angles of attack were varied between
 $-2.5^{\circ }$
and
 $10^{\circ }$
corresponding to an effective angle of attack between
 $-0.7^{\circ }{-}2.8^{\circ }$
due to jet deflection (Brooks, Pope & Marcolini Reference Brooks, Pope and Marcolini1989). Brooks et al. (Reference Brooks, Pope and Marcolini1989) showed that in the presence of an aerofoil the flow from the open-jet wind tunnel is deflected downwards which does not occur in free air. The geometrical angle of attack is therefore corrected to obtain the effective angle of attack in free air. The lift and drag were calculated by resolving the vertical and horizontal force components in the directions normal and parallel to the jet deflection direction which were estimated from the difference between the geometric and effective angles of attack. The effects on lift and drag due to corner effects are believed to be relatively small due to the relatively large aerofoil aspect ratio 3 : 1 used in this study, and in any case only the relative difference in lift and drag between baseline and serrations are of interest in this paper.
4 Acoustic performance
4.1 Optimal serration wavelength
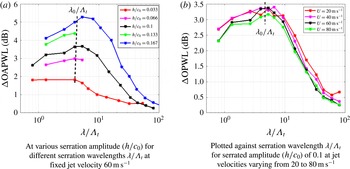
We first present in figure 4(a) the measured variation in overall sound power reductions integrated over the non-dimensional frequency (
 $fc_{0}/U$
) band between 1–10, versus serration wavelength normalized on turbulence length scale,
 $\unicode[STIX]{x1D706}/\unicode[STIX]{x1D6EC}_{t}$
for five different serration amplitudes
 $h$
. Here,
 $U=60$
m s
 $^{-1}$
and the turbulent in-flow has an transverse integral length scale
 $\unicode[STIX]{x1D6EC}_{t}$
of 3.75 mm and a turbulence intensity of 2.5 %. This figure suggests the existence of an optimum non-dimensional serration wavelength
 $\unicode[STIX]{x1D706}_{o}/\unicode[STIX]{x1D6EC}_{t}\approx 4$
at which maximum noise reductions occur. It is particularly well defined for the larger amplitude serrations where noise reductions are much greater. The reason for this value as an optimum ratio is explained in detail in the next section.
In figure 4(b), overall noise reductions integrated over non-dimensional frequency (
 $fh/U$
) 0.1–0.5 are plotted against serration wavelength normalized on turbulence length scale
 $\unicode[STIX]{x1D706}/\unicode[STIX]{x1D6EC}_{t}$
at each of the four flow speeds: 20, 40, 60 and 80 m s
 $^{-1}$
for a fixed serration amplitude
 $h/c_{0}$
of 0.1. This figure reveals two important principles. The first arises from the collapse of the noise reduction spectra, which is better than 0.5 dB, suggesting that noise reductions are a function of non-dimensional frequency
 $fl/U$
, where
 $l$
is some linear dimension related to the serration geometry that remains to be determined. The second is that the optimum serration wavelength
 $\unicode[STIX]{x1D706}_{o}/\unicode[STIX]{x1D6EC}_{t}\approx 4$
is almost independent of flow speed thereby confirming the generality of this optimum value.
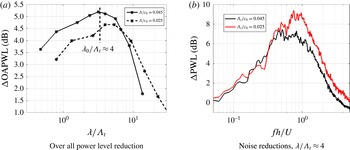
Overall sound power reduction level (
 $\unicode[STIX]{x0394}\text{OAPWL}$
) variation with
 $\unicode[STIX]{x1D706}/\unicode[STIX]{x1D6EC}_{t}$
.

We now confirm the generality of
 $\unicode[STIX]{x1D706}_{o}/\unicode[STIX]{x1D6EC}_{t}\approx 4$
as the optimum condition for maximum noise reductions. The measured variation in noise level in a frequency bandwidth
 $fh/U$
of 0.1–0.5, versus
 $\unicode[STIX]{x1D706}_{o}/\unicode[STIX]{x1D6EC}_{t}$
plotted logarithmically at the two different length scales
 $\unicode[STIX]{x1D6EC}/c_{0}$
of 0.045 and 0.025 is plotted in figure 5(a). The optimum wavelength at these length scales remains approximately 4. Furthermore, the optimum value appears to be well defined on this logarithmic scale in the sense that overall noise reductions diminish quite sharply for serration wavelengths lower and higher than the optimum value.
In figure 5(a) we provide further evidence for the existence of a similarity condition at the optimum wavelength
 $\unicode[STIX]{x1D706}_{o}/\unicode[STIX]{x1D6EC}_{t}\approx 4$
in which the sound power reduction spectra are plotted versus Strouhal number
 $St_{h}$
for the same value of
 $\unicode[STIX]{x1D706}_{o}/\unicode[STIX]{x1D6EC}_{t}=4$
for the two length scales. Thus, in this comparison the ratio of turbulence length scale to serration wavelength
 $\unicode[STIX]{x1D706}_{o}/\unicode[STIX]{x1D6EC}_{t}$
and the ratio of serration amplitude to hydrodynamic wavelength,
 $fh/U$
, are identical. The sound power reduction spectra are remarkably similar at frequencies up to which self-noise starts to dominate, thereby providing compelling evidence for the existence of self-similarity in this interaction process.
Influence of integral length scale (
 $\unicode[STIX]{x1D6EC}/c_{0}$
) on noise reductions.

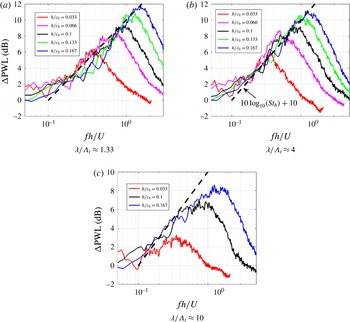
Finally, we present the sensitivity of the sound power reduction spectra to serration amplitude and serration wavelength at a single turbulence integral length scale. Sound power reductions are plotted in figure 6(a,c) versus
 $St_{h}$
for the two sub-optimal serration wavelengths of
 $\unicode[STIX]{x1D706}/\unicode[STIX]{x1D6EC}_{t}=1.33$
and 10, and at the optimum wavelength of 4 in figure 6(b). Each figure is plotted at different serration amplitudes. It is clear that at the optimum wavelength
 $\unicode[STIX]{x1D706}/\unicode[STIX]{x1D6EC}_{t}\approx 4$
the noise reduction spectra plotted in figure 6(b) collapse to within 1 dB suggesting that noise reductions are solely a function of Strouhal number
 $St_{h}$
in the frequency range where leading edge noise is dominant and self-noise can be neglected. No such collapse is observed for the wide serration
 $\unicode[STIX]{x1D706}/\unicode[STIX]{x1D6EC}_{t}=10$
and perceptibly worse collapse for the narrower serration
 $\unicode[STIX]{x1D706}/\unicode[STIX]{x1D6EC}_{t}=1.33$
. At the optimum serration wavelength, therefore, the noise reduction spectra plotted in figure 6(b) follow a similarity principle since they are determined solely by the ratio of hydrodynamic wavelength
 $U/f$
to the serration amplitude
 $h$
. Moreover, for this optimum geometry, the variation in sound power reduction level is observed to closely follow
 $10\log _{10}(St_{h})+10$
(dB) and therefore represents an upper limit on the sound power reductions obtainable using single-wavelength leading edge serrations. In terms of the ratio of sound power due to the serrated aerofoil
 $W_{s}$
and the baseline aerofoil
 $W_{bl}$
, this dependence corresponds to an inverse Strouhal number scaling of
 $W_{s}/W_{bl}\propto 1/St_{h}$
. A model aimed at explaining this behaviour is presented in § 4.2.
Sound power reductions for various serration amplitudes at three different fixed serration wavelength
 $\unicode[STIX]{x1D706}/\unicode[STIX]{x1D6EC}_{t}$
of 1.33, 4 and 10 for jet velocity,
 $U=60$
m s
 $^{-1}$
.

Figure 6 provides further confirmation of the existence of an optimum serration wavelength
 $\unicode[STIX]{x1D706}_{o}/\unicode[STIX]{x1D6EC}_{t}\approx 4$
(for the case shown in figure 6
b) at which maximum noise reductions occur.
The sound power noise reduction spectra
 $10\log _{10}(W_{bl}/W_{s})$
presented above at the optimum serration wavelength
 $\unicode[STIX]{x1D706}_{o}$
and non-optimum wavelengths follow a different frequency scaling, which may be summarized in (4.1) as follows:
 $$\begin{eqnarray}\frac{W_{s}(\unicode[STIX]{x1D714})}{W_{bl}(\unicode[STIX]{x1D714})}=f\left(\frac{fl}{U},\frac{\unicode[STIX]{x1D706}}{\unicode[STIX]{x1D6EC}_{t}}\right),\quad \left.\begin{array}{@{}ll@{}}l=h & \text{for }\unicode[STIX]{x1D706}=\unicode[STIX]{x1D706}_{o}\\ l=\text{const.} & \text{for }\unicode[STIX]{x1D706}\neq \unicode[STIX]{x1D706}_{o}.\end{array}\right\}\end{eqnarray}$$
4.2 Interpretation
In the next section, we exploit the similarity behaviour observed at the optimum serration wavelength to develop a simple model aimed at explaining the inverse Strouhal dependence observed in figure 6.
4.2.1 Derivation of optimum wavelength
 $\unicode[STIX]{x1D706}_{0}=4\unicode[STIX]{x1D6EC}_{t}$

Previously, we have shown that optimum noise reductions are obtained when the serration wavelength
 $\unicode[STIX]{x1D706}_{o}\approx 4\unicode[STIX]{x1D6EC}_{t}$
. Previously, Kim et al. (Reference Kim, Haeri and Joseph2016) have demonstrated that compact sources at the valleys are the dominant noise source on a serrated leading edge. In this section, we use this finding to provide the explanation for this relationship. An aerofoil with serration wavelength
 $\unicode[STIX]{x1D706}$
provides
 $N_{r}=L/\unicode[STIX]{x1D706}$
equally distributed compact sources over the aerofoil span located at the valley positions separated one wavelength
 $\unicode[STIX]{x1D706}$
apart. For simplicity, if the path length differences between each compact source and a far-field observer is neglected (since adjacent sources are generally much closer together than the acoustic wavelength), retarded time differences can be ignored and the total radiated pressure at time
 $t$
is proportional to the sum of source strengths
 $q(r_{n},t)$
(with time delay also ignored) where
 $r_{n}$
is the position along the span on the
 $n\text{th}$
valley source, i.e.
 $$\begin{eqnarray}p(t)\propto \mathop{\sum }_{n=1}^{N_{r}}q(r_{n},t),\end{eqnarray}$$
where
 $r_{n}=n\unicode[STIX]{x1D706}$
.
The radiated sound power
 $W_{s}$
is related to the mean square far-field pressure integrated over some suitable closed surface. The overall mean square pressure will depend on the degree of correlation between adjacent sources on the serrated leading edge, which of course is related to the serration wavelength compared to the turbulence integral length scale. Following (4.2), the far-field mean square pressure, and hence radiated sound power, can therefore be written as,
 $$\begin{eqnarray}W_{s}\propto \overline{p^{2}}\propto \mathop{\sum }_{n=1}^{N_{r}}\mathop{\sum }_{n^{\prime }=1}^{N_{r}}\overline{q(r_{n},t)q(r_{n^{\prime }},t)},\end{eqnarray}$$
where
 $W_{s}$
and
 $\overline{p^{2}}$
represent the integration over all spectral components,
 $\int _{-\infty }^{\infty }W_{s}(\unicode[STIX]{x1D714})\,\text{d}\unicode[STIX]{x1D714}$
and
 $\int _{-\infty }^{\infty }\overline{p^{2}}(\unicode[STIX]{x1D714})\,\text{d}\unicode[STIX]{x1D714}$
. Assuming that the source strength at each valley is identical and that the spatial correlation coefficient
 $\unicode[STIX]{x1D70C}$
between the compact source strengths at the valleys is only a function of the separation distance between them i.e.
 $\unicode[STIX]{x1D70C}(r_{n},r_{n^{\prime }})=\unicode[STIX]{x1D70C}(|n-n^{\prime }|\unicode[STIX]{x1D706})$
, (which is the case when excited by homogeneous turbulence), the source strength spatial correlations in (4.3) can be written as,
 $$\begin{eqnarray}\overline{q(r_{n},t)q(r_{n^{\prime }},t)}=\overline{q^{2}}\unicode[STIX]{x1D70C}(|n-n^{\prime }|\unicode[STIX]{x1D706}),\end{eqnarray}$$
where
 $\overline{q^{2}}=\overline{q^{2}}(r_{n},t)$
. In this analysis we adopt a highly simplified model for the spatial correlation coefficient function defined in terms of the turbulence integral length scale
 $\unicode[STIX]{x1D6EC}_{t}$
,
 $\unicode[STIX]{x1D70C}(|n-n^{\prime }|\unicode[STIX]{x1D706})=\text{e}^{-|n-n^{\prime }|\unicode[STIX]{x1D706}/\unicode[STIX]{x1D6EC}_{t}}$
. The radiated sound power can now be written in the form,
 $$\begin{eqnarray}W_{s}\propto \overline{q^{2}}\mathop{\sum }_{n=1}^{N_{r}}\mathop{\sum }_{n^{\prime }=1}^{N_{r}}\text{e}^{-|n-n^{\prime }|\unicode[STIX]{x1D706}/\unicode[STIX]{x1D6EC}_{t}}.\end{eqnarray}$$
Finally, expanding the terms in (4.5) and replacing
 $\overline{q^{2}}$
by
 $W_{r}$
, the sound power produced by a single valley source radiating in isolation, leads to (4.6) for the total sound power radiated by the serrated leading edge excited by turbulence with length scale
 $\unicode[STIX]{x1D6EC}_{t}$
, divided by the sound power radiated by
 $N_{r}$
valley sources radiating incoherently,
 $$\begin{eqnarray}\frac{W_{s}}{W_{r}N_{r}}=\left[1+2\mathop{\sum }_{n=1}^{N_{r}-1}(1-n/N_{r})\text{e}^{-n\unicode[STIX]{x1D706}/\unicode[STIX]{x1D6EC}_{t}}\right].\end{eqnarray}$$
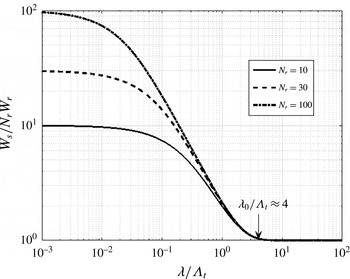
One interpretation of this power ratio is that it represents the ratio of coherent valley sources to incoherent valley sources (i.e. when the serration wavelength is much larger than the turbulence integral length scale). Equation (4.6) is plotted below in figure 7 as a function of
 $\unicode[STIX]{x1D706}/\unicode[STIX]{x1D6EC}_{t}$
for the three cases,
 $N_{r}=10$
, 20 and 30.
Variation in total sound power versus
 $\unicode[STIX]{x1D706}/\unicode[STIX]{x1D6EC}_{t}$
.

This figure clearly reveals the significance of turbulence length scale to the effectiveness of the noise reductions obtained using leading edge serrations. The figure clearly defines a minimum serration wavelength,
 $\unicode[STIX]{x1D706}_{o}/\unicode[STIX]{x1D6EC}_{t}\approx 4$
, below which adjacent sources are excited coherently, leading to constructive interference in the far field, and hence provide relatively poor noise reductions. In the small-wavelength limit (compared to length scale), the sound power ratio tends to
 $N_{r}$
, i.e. the sound power from the serrated aerofoil radiates as
 $N_{r}^{2}$
, since all
 $N_{r}$
sources radiate in-phase. Above this value,
 $\unicode[STIX]{x1D706}_{o}/\unicode[STIX]{x1D6EC}_{t}\approx 4$
, the sound power ratio tends to 1, indicating that all source are excited incoherently. Note that this limit appears to be independent of
 $N_{r}$
. Precisely this value of 4 is identified in figure 4 as the optimum serrated wavelength. The optimum condition for maximum noise reductions, therefore, occurs when adjacent sources are only just excited incoherently. Note that the coherence length
 $l(\unicode[STIX]{x1D714})<\unicode[STIX]{x1D6EC}$
, therefore the condition
 $\unicode[STIX]{x1D706}_{o}/\unicode[STIX]{x1D6EC}_{t}\approx 4$
assumes uncorrelated sources at all frequencies.
Also note that a good approximation to (4.6) in the vicinity of
 $\unicode[STIX]{x1D706}_{o}/\unicode[STIX]{x1D6EC}_{t}\approx 4$
can be obtained by including only contributions from adjacent valley sources since pairs of sources further than the nearest neighbour have negligible correlation coefficient. At the optimum serration wavelength, therefore, coherent interaction between valley sources only occurs between adjacent sources.
4.2.2 Geometric similarity interpretation of Strouhal number scaling
The previous section has shown both experimentally and theoretically that maximum noise reductions are obtained when
 $\unicode[STIX]{x1D706}_{o}/\unicode[STIX]{x1D6EC}_{t}\approx 4$
. One of the main findings of this paper is that at the optimum wavelength
 $\unicode[STIX]{x1D706}_{o}$
, the sound power reduction spectra collapse on the non-dimensional frequency
 $St_{h}$
, which may be interpreted as the ratio of serration height
 $h$
to hydrodynamic wavelength
 $\unicode[STIX]{x1D706}_{h}=U/f$
. This finding suggests the existence of a geometric similarity condition in which the sound power reduction is only a function of these two length scales. In this section, we demonstrate that this finding is consistent with the hypothesis that the length
 $l(\unicode[STIX]{x1D714},h,\unicode[STIX]{x1D6EC}_{t})$
of the sources along the sinusoidal leading edge scale linearly with the hydrodynamic wavelength.
In this analysis the length
 $l$
of the source along the sinusoidal leading edge is expressed as,
 $$\begin{eqnarray}l(\unicode[STIX]{x1D714},h,\unicode[STIX]{x1D6EC}_{t})=\unicode[STIX]{x1D702}(h,\unicode[STIX]{x1D6EC}_{t})\unicode[STIX]{x1D706}_{h}(\unicode[STIX]{x1D714}),\end{eqnarray}$$
where
 $\unicode[STIX]{x1D702}$
is a non-dimensional constant of proportionality that is dependent on the transverse turbulence length scale and serration height. Another important finding of the numerical simulations of Kim et al. (Reference Kim, Haeri and Joseph2016) is that the source strength
 $\unicode[STIX]{x1D71B}(\unicode[STIX]{x1D714})$
(surface pressure per unit edge length) at the valley at all frequencies is similar to that of the straight leading edge. As shown in § 4.2.1, at the optimum serration wavelength the total sound power radiation
 $W_{s}$
equals the sound power per valley
 $W_{r}$
multiplied by the number of valleys
 $N_{r}$
, i.e.
 $W_{s}(\unicode[STIX]{x1D714})=N_{r}(\unicode[STIX]{x1D706})W_{r}(\unicode[STIX]{x1D714})$
. The radiated sound power for each valley is assumed here to be equal to the ‘length’
 $l$
of the source along the sinusoidal leading edge and the sound power per unit length
 $\unicode[STIX]{x1D71B}$
, i.e.
 $$\begin{eqnarray}W_{r}(\unicode[STIX]{x1D714})=\unicode[STIX]{x1D71B}(\unicode[STIX]{x1D714})l(\unicode[STIX]{x1D714},h,\unicode[STIX]{x1D6EC}_{t}),\end{eqnarray}$$
where,
 $l$
is the length of the source given by (4.7) which is assumed to be proportional to
 $\unicode[STIX]{x1D706}_{h}$
and
 $N_{r}(\unicode[STIX]{x1D706})=L/\unicode[STIX]{x1D706}$
, where
 $L$
is the aerofoil span. Following an identical argument, the noise power from the straight baseline leading edge is simply,
 $$\begin{eqnarray}W_{bl}(\unicode[STIX]{x1D714})=\unicode[STIX]{x1D71B}(\unicode[STIX]{x1D714})L.\end{eqnarray}$$
The ratio of the sound power of the serrated aerofoil to the straight leading edge is therefore,
 $$\begin{eqnarray}\frac{W_{s}(\unicode[STIX]{x1D714})}{W_{bl}(\unicode[STIX]{x1D714})}=\frac{\unicode[STIX]{x1D702}(h,\unicode[STIX]{x1D6EC}_{t})\unicode[STIX]{x1D706}_{h}(\unicode[STIX]{x1D714})}{\unicode[STIX]{x1D706}_{o}}.\end{eqnarray}$$
Finally, expressing
 $\unicode[STIX]{x1D706}_{o}$
in terms of serration height and angle
 $\unicode[STIX]{x1D703}_{o}=\tan ^{-1}(4h/\unicode[STIX]{x1D706}_{o})$
, the power ratio may be written as
 $$\begin{eqnarray}\frac{W_{s}(\unicode[STIX]{x1D714})}{W_{bl}(\unicode[STIX]{x1D714})}=\frac{\unicode[STIX]{x1D702}(h,\unicode[STIX]{x1D6EC}_{t})\tan (\unicode[STIX]{x1D703}_{o})}{4St_{h}}\propto \frac{1}{St_{h}},\end{eqnarray}$$
where
 $St_{h}$
is the Strouhal number based on serration height
 $St_{h}=fh/U$
, as observed in the experimental data at the optimum wavelength.
4.2.3 Phase model for the prediction of noise reduction spectra at the optimum wavelength
The simple scaling-law analysis above has provided a framework for understanding the inverse Strouhal number behaviour observed conclusively in figures 5 and 6. In this section we present a very simple, idealized model to provide a partial explanation for the constant of proportionality in (4.11), which is approximately 0.1. We emphasize that this is not a complete model for predicting the noise reductions from the serrated leading edge, which may be found in the recent paper by Lyu et al. (Reference Lyu, Azarpeyvand and Sinayoko2016), but provides a simple physical basis for understanding the noise reduction spectra, which was found to be of the form
 $10\log _{10}(St_{h})+10$
at the optimum serration wavelength. In the following analysis we make the following assumptions.
-
(i) The edge is excited coherently, i.e. the serration wavelength is equal to its optimum value.
-
(ii) The surface pressure response is concentrated along the leading edge.
-
(iii) Phase compatibility is assumed in which the phase of the surface pressure response along the leading edge is identical to that of the impinging gusts along the leading edge.
-
(iv) The length of the sources in the streamwise (flow) direction is identical to that of the flat plate.
-
(v) The unsteady aerofoil surface response is dominated by the gust component convecting parallel to the flow direction.
We write the far-field sound power spectra
 $W_{s}(\unicode[STIX]{x1D714})$
in terms of the transverse vortical gust component convecting parallel to the flow direction of the form, i.e.
 $$\begin{eqnarray}W_{s}(\unicode[STIX]{x1D714})=\overline{v^{2}}(\unicode[STIX]{x1D714})S(\unicode[STIX]{x1D714})R(\unicode[STIX]{x1D714}),\end{eqnarray}$$
where
 $\overline{v^{2}}(\unicode[STIX]{x1D714})$
is the mean square transverse turbulence velocity of the normally incident gust at frequency
 $\unicode[STIX]{x1D714}$
,
 $S(\unicode[STIX]{x1D714})$
is the sound power per unit mean square velocity
 $\overline{v^{2}}(\unicode[STIX]{x1D714})$
at the leading edge of the baseline aerofoil and
 $R(\unicode[STIX]{x1D714})$
is the sound power reduction coefficient (
 $0\leqslant |R|\leqslant 1$
) due to the serrated aerofoil. For simplicity, given the basic assumptions listed above, the sound power reduction coefficient is predicted by integrating the phase variation
 $\unicode[STIX]{x1D714}h\cos (\unicode[STIX]{x1D703})/U$
along one cycle of the sinusoidal leading edge, i.e.
 $$\begin{eqnarray}R(\unicode[STIX]{x1D714})=\left|\frac{1}{2\unicode[STIX]{x03C0}}\int _{0}^{2\unicode[STIX]{x03C0}}\text{e}^{-\text{i}\unicode[STIX]{x1D714}h\cos (\unicode[STIX]{x1D703})/U}\,\text{d}\unicode[STIX]{x1D703}\right|^{2}.\end{eqnarray}$$
This integral expression evaluates to
 $$\begin{eqnarray}R(\unicode[STIX]{x1D714})=\text{J}_{0}^{2}(\unicode[STIX]{x1D714}h/U),\end{eqnarray}$$
where
 $\text{J}_{0}$
is the Bessel function of the first kind of order 0. This simple expression for the sound power of the leading edge serration is now compared to that for the baseline leading edge
 $h=0$
, which in (4.13) becomes 1.
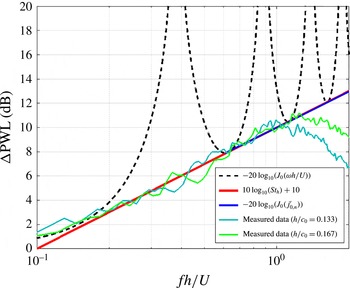
Comparison of simple analytical model against experiments at optimum serration angle.

The sound power level reduction predicted by the very simple, single-gust model is therefore given by
 $$\begin{eqnarray}\unicode[STIX]{x0394}\text{PWL}(\unicode[STIX]{x1D714})=10\log _{10}(W_{bl}(\unicode[STIX]{x1D714})/W_{s}(\unicode[STIX]{x1D714}))=-20\log _{10}(\text{J}_{0}(\unicode[STIX]{x1D714}h/U)).\end{eqnarray}$$
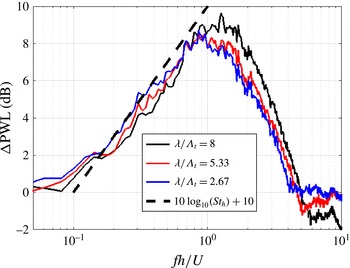
Figure 8 provides a comparison of the measured noise reduction spectra with the simple analytical expression of (4.15). Also plotted is the line
 $10\log _{10}(St_{h})+10$
obtained by observation of the measured spectra. Excellent agreement is obtained from all three curves at the stationary values of
 $\text{J}_{0}(\unicode[STIX]{x1D714}h/U)$
. At all other frequencies, agreement is poor, particularly at the zeros of
 $\text{J}_{0}(\unicode[STIX]{x1D714}h/U)$
, where complete cancellation of the leading edge response is predicted. Clearly, the major deficiency with this simple single-gust model is the assumption of uniform source strengths along the leading edge. As shown by Clair et al. (Reference Clair, Polacsek, Garrec, Reboul, Gruber and Joseph2013) and Kim et al. (Reference Kim, Haeri and Joseph2016) for example the source strengths along the hill region is generally weaker due to the combined effect of gust components becoming cut off and a smaller mean flow component in the direction normal to the edge (Kim et al.
Reference Kim, Haeri and Joseph2016). However, this simple single-gust model is nevertheless useful for speculating on the reasons underlying the trend in the noise reduction spectra. The model, therefore, predicts the maximum noise reductions for a sinusoidal serration. In practice, however, noise reductions are considerably less than this value due to the presence of multiple oblique gusts, imperfect phase cancellation along the leading edge and partial correlation of the blade response along the leading edge due to the finite eddy size.
4.2.4 Balance between source strength per valley and number of valleys
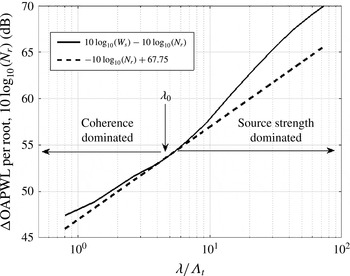
Figures 5 and 6 provide strong experimental evidence for the existence of an optimum serration wavelength at which maximum noise reductions occur. In § 4.1, this has been directly linked to the turbulence integral length scale. In this section, we provide an alternative, but consistent, interpretation of the optimum serration wavelength as the wavelength that provides the optimum combination of source strength per valley and the number of valleys. For serration wavelengths greater than the optimum wavelength, the valley sources radiate incoherently and hence the sound power due to the serrated aerofoil can be written as the product of the sound power per valley
 $W_{r}$
and the number of valleys, which is simply
 $N_{r}=L/\unicode[STIX]{x1D706}$
, i.e.
 $$\begin{eqnarray}W_{s}=W_{r}(\unicode[STIX]{x1D706})\frac{L}{\unicode[STIX]{x1D706}}.\end{eqnarray}$$
Note that
 $W_{r}$
could be sound power at a single frequency or integrated over a frequency bandwidth. The optimum serration wavelength
 $\unicode[STIX]{x1D706}=\unicode[STIX]{x1D706}_{o}$
occurs when
 $$\begin{eqnarray}\left.\frac{\text{d}W_{s}}{\text{d}\unicode[STIX]{x1D706}}\right|_{\unicode[STIX]{x1D706}=\unicode[STIX]{x1D706}_{o}}=0.\end{eqnarray}$$
The solution to (4.17) gives the condition for the optimum wavelength of the form,
 $$\begin{eqnarray}\left.\frac{1}{W_{r}}\frac{\text{d}W_{r}}{\text{d}\unicode[STIX]{x1D706}}\right|_{\unicode[STIX]{x1D706}=\unicode[STIX]{x1D706}_{o}}=\left.\frac{1}{\unicode[STIX]{x1D706}}\right|_{\unicode[STIX]{x1D706}=\unicode[STIX]{x1D706}_{o}},\end{eqnarray}$$
which says that the optimum serration wavelength
 $\unicode[STIX]{x1D706}_{o}$
occurs when the rate of change of sound power per valley with
 $\unicode[STIX]{x1D706}$
exactly equals the variation in the number of valleys with
 $\unicode[STIX]{x1D706}$
. This optimum condition for
 $\unicode[STIX]{x1D706}_{o}$
is shown explicitly in figure 9, which is a plot of the sound power level per valley measured at
 $U=60$
m s
 $^{-1}$
,
 $h/c_{0}=0.1$
versus
 $\unicode[STIX]{x1D706}$
. Also, shown is the line
 $-10\log _{10}(N_{r})+67.75$
showing the number of valleys per unit span in dB. Note that the constant 67.75 dB has been added to allow comparison of the two curves. At the optimum wavelength, the gradients of the two curves match, in agreement with (4.18).
Balance between number of valleys and source strength.

For serration wavelengths less than the optimum value the sound power per valley increases at a slower rate with increasing
 $\unicode[STIX]{x1D706}$
than the number of valleys increases. This is a result of the coherence effect discussed in detail in § 4.2.1, whereby coherent excitation of the valley sources causes the sound power radiation to vary at a faster rate than the number of valleys
 $N_{r}$
. For serration wavelengths greater than the optimum, the valleys continue to radiate incoherently but clearly, the source strength must be increasing at a faster rate than
 $N_{r}$
. The optimum serration wavelength, therefore, occurs when the rate of change of sound power with
 $\unicode[STIX]{x1D706}$
increases at precisely the same rate as
 $N_{r}$
itself.
4.3 Influence of self-noise on 3-D aerofoils
Work described in previous sections and in Narayanan et al. (Reference Narayanan, Joseph, Haeri, Kim, Chaitanya and Polacsek2014, Reference Narayanan, Chaitanya, Haeri, Joseph, Kim and Polacsek2015) and Chaitanya et al. (Reference Chaitanya, Narayanan, Joseph, Vanderwel, Turner, Kim and Ganapathisubramani2015b ) has characterized the behaviour and effectiveness of sinusoidal leading edge serrations on flat plates. The current section aims to verify whether the same behaviour, in particular, the similarity relationships observed for flat plates, also applies to leading edge serrations introduced into 3-D aerofoil geometries.
The important difference between the aerodynamic noise due to a flat plate in a turbulent stream and a 3-D aerofoil is a much greater contribution of trailing edge self-noise due to a more energetic boundary layer forming over the surface of the 3-D aerofoil driven by the adverse pressure gradient. Another important difference between the serration on an aerofoil and a flat plate is the effects of the aerofoil leading edge profile which has the effect of distorting the incoming turbulence due to mean flow gradients. This section aims to investigate the balance between the self-noise and leading edge noise, furthermore, to assess the effect of leading edge serrations on the aerofoil self-noise.
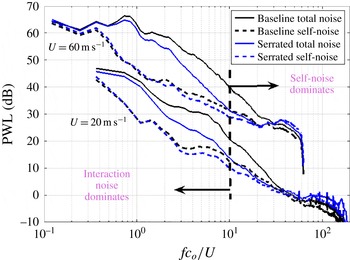
Figure 10(a) shows the total radiated sound power level spectra for the baseline aerofoil plotted against non-dimensionless frequencies at the jet velocities of 20 and 60 m s
 $^{-1}$
. Also shown is the spectrum of radiated noise due to self-noise alone obtained by removing the grid. Comparison between the two spectra confirms that interaction noise, even with serrations, is the dominant noise source at low frequencies whilst self-noise dominates at high frequencies. As also shown in Narayanan et al. (Reference Narayanan, Chaitanya, Haeri, Joseph, Kim and Polacsek2015) this figure makes clear that self-noise is the factor that limits noise reductions by the serrations at high frequencies. The frequencies at which maximum noise reductions occur appears to correspond to the frequency at which self-noise starts to become significant compared to interaction noise. This frequency of maximum noise reduction, as indicated by the vertical dashed line, appears to occur at approximately the same non-dimensional frequency
 $fc_{0}/U$
for both jet velocities of approximately
 $fc_{0}/U$
= 10 for this aerofoil geometry. Figure 10 also shows a reduction in self-noise for the serrated leading edge (dashed blue) compared to baseline self-noise (dashed black). This is further discussed below.
Power level spectra comparison between baseline NACA65 aerofoils with serrated aerofoil of amplitude (
 $h/c_{0}$
) 0.167 and wavelength (
 $\unicode[STIX]{x1D706}/\unicode[STIX]{x1D6EC}_{t}$
) 2.67 along with their self-noise.

4.4 Influence of leading edge serrations on aerofoil self-noise
The effect of leading edge serrations on interaction noise and trailing edge self-noise can be determined from separate measurements of the overall noise radiation (i.e. the sum of LE, TE and background noise), the sum of self-noise and background noise (obtained by removing the turbulent grid), and background noise spectra alone (without aerofoil).
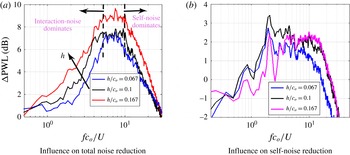
Figure 11(a) shows the variation of the reduction in total sound power versus non-dimensionless frequency (
 $fc_{0}/U$
) at a fixed serration wavelength (
 $\unicode[STIX]{x1D706}/\unicode[STIX]{x1D6EC}_{t}$
) of 2.67 for various serration amplitudes (
 $h/c_{0}$
) at a jet velocity of 60 m s
 $^{-1}$
and angle of attack of
 $0^{\circ }$
. Note that the serration wavelength for these cases are close to the optimum serrated wavelength identified in § 4.1. The noise reduction spectra follows very closely the behaviour observed for flat plates. A detailed comparison between flat plate and aerofoil measured noise reductions with numerical predictions are presented in Chaitanya et al. (Reference Chaitanya, Narayanan, Joseph, Vanderwel, Turner, Kim and Ganapathisubramani2015b
). As observed in figure 11, the noise reduction spectra increases with increasing frequency until some optimum frequency of approximately
 $fc_{0}/U=8$
, above which it then falls due to the dominance of self-noise at high frequencies. The introduction of trailing edge serration has been shown to reduce trailing edge noise, for example, (Gruber Reference Gruber2012; Gruber, Joseph & Azarpeyvand Reference Gruber, Joseph and Azarpeyvand2013), which if applied to the current aerofoil will therefore extend the frequency range over which leading edge serrations are effective. An important observation is that, in this high frequency range, the noise is sensitive to the amplitude of the leading edge serration thus clearly suggesting that leading edge serrations can reduce aerofoil self-noise.
Figure 11(b) demonstrates this effect explicitly by showing self-noise reduction spectra due to the introduction of leading edge serrations. Reductions in self-noise of up to 3 dB are observed, which are comparable to those obtained with trailing edge serrations (Gruber Reference Gruber2012; Gruber et al. Reference Gruber, Joseph and Azarpeyvand2013). This effect is undoubtedly due to modification to the boundary layer caused by the leading edge serration. This is investigated using PIV measurements in § 6.
Sound power reduction level (
 $\unicode[STIX]{x0394}\text{PWL}$
) for various serrated amplitude (
 $h$
) at jet velocity
 $60~\text{m}~\text{s}^{-1}$
and angle of attack
 $(AoA)=0^{\circ }$
for a serrated wavelength (
 $\unicode[STIX]{x1D706}/\unicode[STIX]{x1D6EC}_{t}$
) of 2.67.

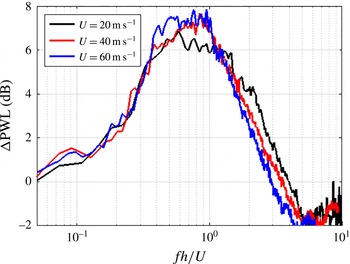
We now investigate the sensitivity of noise reductions to flow speed. Figure 12 shows the reduction in total noise versus dimensionless frequency (
 $fh/U$
) at speeds of 20, 40 and 60 m s
 $^{-1}$
for a serration amplitude and wavelength of (
 $h/c_{0}$
) of 0.1 and (
 $\unicode[STIX]{x1D706}/\unicode[STIX]{x1D6EC}_{t}$
) of 2.67. As also observed in the flat plate study in § 4.1, the noise reduction spectra follows a non-dimensional frequency dependence (
 $St_{h}$
) in the low frequency range where interaction noise is dominant. However, at higher frequency (
 $St_{h}>0.5$
), collapse of the spectra with non-dimensional frequency based on amplitude is relatively poorer. This finding is consistent with the dominance of self-noise in this frequency range, where a more appropriate non-dimensional frequency would be defined with respect to boundary layer thickness (Gruber Reference Gruber2012; Gruber et al.
Reference Gruber, Joseph and Azarpeyvand2013).
Overall sound power reduction level (
 $\unicode[STIX]{x0394}\text{PWL}$
) for serrated amplitude (
 $h/c_{0}$
) of 0.1 and serrated wavelength (
 $\unicode[STIX]{x1D706}/\unicode[STIX]{x1D6EC}_{t}$
) of 2.67 at various velocities at
 $AoA=0^{\circ }$
.

4.5 Validity of optimal serration wavelength for 3-D aerofoils
In the flat plate study in § 4.1, an optimum serration wavelength for maximum noise reductions was identified. At this optimum angle, the noise reduction spectra were shown to collapse on
 $fh/U$
and follow the linear frequency dependence
 $\unicode[STIX]{x0394}\text{PWL}=10\log _{10}(St_{h})+10$
. Figure 13 shows the noise reduction spectra for the NACA65 aerofoil at three serration angles close to the optimum angle, which can be seen to closely follow this relationship confirming that the essential noise reduction mechanisms on flat plates also apply to the aerofoil even though the flow behaviour in the vicinity of the valleys is much more complex.
The noise reduction spectra in figure 13 for the optimum serrations may be used to identify a frequency
 $f_{3\,\text{dB}}$
above which noise reductions become significant (
 ${>}3~\text{dB}$
). From this figure
 $f_{3\,\text{dB}}$
nearly corresponds to a Strouhal number of
 $(f_{3\,\text{dB}}h/U)=0.25$
. This value is consistent with the frequency identified by Narayanan et al. (Reference Narayanan, Chaitanya, Haeri, Joseph, Kim and Polacsek2015). However, it is only valid for serrations at the optimum serration wavelengths. For sub-optimal serration wavelengths the rate of increase in noise reduction with frequency, for example, as shown in figure 6, is slower than for the optimum case and hence the frequency
 $(f_{3\,\text{dB}})$
will be higher.
Sound power reduction level (
 $\unicode[STIX]{x0394}\text{PWL}$
) on NACA65 aerofoil for various inclination angle
 $\unicode[STIX]{x1D706}/\unicode[STIX]{x1D6EC}_{t}$
at jet velocity
 $U=60$
m s
 $^{-1}$
and
 $AoA=0^{\circ }$
for serrated amplitude (
 $h/c_{0}$
) of 0.167.

5 Aerodynamic measurement
Previous sections have highlighted the potential effectiveness of leading edge serrations on 3-D aerofoils. However, it is imperative that aerodynamic performance is not substantially degraded by their introduction. In this section, the effect of leading edge serrations on the steady aerodynamic performance of aerofoils is investigated experimentally. The lift and drag forces were measured on the NACA65 aerofoil with varying serration amplitudes (
 $h/c_{0}$
). The geometric angle of attack varies from
 $-2.5^{\circ }$
to
 $10^{\circ }$
but due to jet deflection in the open-jet wind tunnel the corresponding effective angle of attack is in the smaller range,
 $-1^{\circ }{-}2.8^{\circ }$
. Aerodynamics measurements were performed in the same open-jet wind tunnel as the PIV and acoustic measurements to ensure consistency.
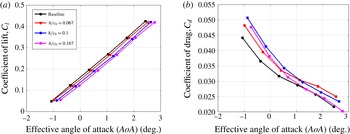
Figure 14(a) shows the lift coefficient for the baseline and serrated aerofoil of wavelength (
 $\unicode[STIX]{x1D706}/\unicode[STIX]{x1D6EC}_{t}$
) 2.67 for three different serration amplitudes
 $h/c_{0}$
of 0.066, 0.1 and 0.167. Whilst the gradient of lift coefficient versus angle of attack remains unchanged by the introduction of serrations (gradient
 ${\approx}$
6.2 rad
 $^{-1}$
), levels are consistently smaller by between 0.01 and 0.05 compared to the baseline case. Thus, whilst increasing the serration amplitude increases noise effectiveness, the corresponding lift performance degrades. The corresponding variation in drag coefficient is shown in figure 14(b) which is observed to increase by between 0.001 and 0.005 compared to the baseline case as serration amplitude is increased. Further examination of the aerodynamic performance of the serrated aerofoil is explored in § 6 using PIV measurements.
Aerodynamic evaluation of serrated aerofoils (
 $\unicode[STIX]{x1D706}/\unicode[STIX]{x1D6EC}_{t}=2.67$
) at the jet velocity
 $U=60$
m s
 $^{-1}$
.

6 Flow measurement
6.1 Mean flow
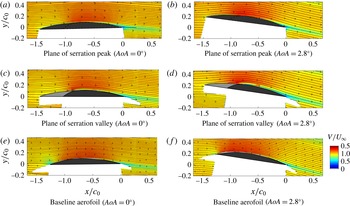
This section examines in greater detail the effect of leading edge serrations on the flow behaviour around the aerofoil by the use of PIV measurements. Mean velocity contour with streamlines superimposed are presented in figure 15(a–d) for a free-stream velocity of 20 m s
 $^{-1}$
. The inflow turbulence intensity is 2.5 % and the transverse length scale of incoming turbulence is 3.75 mm. The results reveal the flow across two transverse planes aligned with the serration peak and valley at the two geometric angles of attack of
 $0^{\circ }$
and
 $10^{\circ }$
(effective angles of attacks are
 $0^{\circ }$
and
 $2.8^{\circ }$
respectively). Also shown in figure 15(e,f) are the flow velocity contours for the baseline NACA65 aerofoil. Note that the white region corresponds to the locations where the laser was unable to illuminate. In both valley and peak planes the mean flow is attached at both angles of attacks even though there are large mean velocity gradients.
Mean velocity maps for serrated and baseline aerofoil for effective angle of attack of
 $0^{\circ }$
and
 $2.8^{\circ }$
. The aerofoil cross-sections are illustrated to scale and regions where the experimental geometry obscured the measurements are left blank.

Figure 15(e,f) shows the variation of axial flow velocity around the leading edge of the baseline aerofoil. They show the presence of a significant stagnation region at the leading edge for both angles of attack. The stagnation region around the peak of the serrated aerofoil is considerably weaker (figure 15 a–d) which is most likely because the flow streamlines can be diverted radially from the peak to the trough. In the plane of the serration valley, however, the streamlines clearly continue in the gap between the serrations. However, since the valley cannot be illuminated and therefore the extent of the stagnation region around the valley is not accessible.
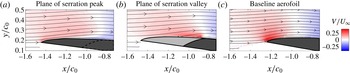
The mean flow component normal to the measurement axis exhibits similar behaviour to the axial flow, as in figure 16 which shows a zoomed-in view in the vicinity of the leading edge for the angle of attack of
 $2.8^{\circ }$
. Flow deviation around the peak can be seen to be substantially weaker than in the baseline case. However, streamlines emerging from the valley are observed to undergo stronger deviation than for the baseline case, suggesting strong mean velocity gradients. These large velocity gradients could be a source of turbulence generation and hence a source of additional noise. However, more work is needed through the use, for example, LES or PIV measurement in between the valley to quantify the importance of this phenomenon.
Maps of the vertical component of the mean velocity at the leading edge of the serrated and baseline aerofoils at an angle of attack of
 $2.8^{\circ }$
.

6.2 Effect of leading edge serrations on boundary layer development
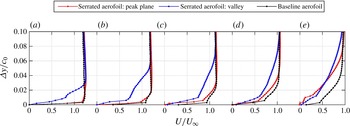
In § 4.3 it was observed that the introduction of leading edge serrations caused a significant reduction in trailing edge noise suggesting that boundary layer development was affected. This hypothesis is confirmed in figure 17 which compares the PIV measurements of streamwise boundary layer development over the suction surface in the two planes of the serrated aerofoil with the baseline case at
 $2.8^{\circ }$
angle of attack. In the plane of the valley the boundary layer is seen to be significantly thicker than in both the peak plane and baseline cases. This is due to delayed vertical deflection of the flow at the valley of the serrations causing a large input of momentum into the boundary layer, which initially causes a substantial thickening of the boundary layer in this plane. Close to the leading edge (figure 17
a,b) the profiles at the peak plane and baseline cases are similar. As the boundary layer develops towards the trailing edge their profiles in both planes become similar due to turbulent mixing resulting in a significantly thicker boundary layer at the trailing edge compared to the baseline case.
Development of the boundary layer over the suction side of the aerofoil at locations of distance of (a)
 $-$
0.8
 $c_{0}$
, (b)
 $-$
0.6
 $c_{0}$
, (c)
 $-$
0.4
 $c_{0}$
, (d)
 $-$
0.2
 $c_{0}$
and (e) 0 from the trailing edge of the aerofoil.

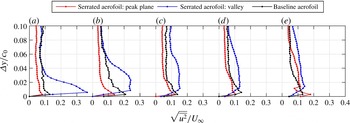
Figure 18 shows profiles of the root-mean-square (r.m.s.) velocity fluctuations along the upper surface of the aerofoil. Just downstream of the serration valley the velocity fluctuations are much higher in the plane of the valleys compared to the baseline case, while they are reduced in the plane of the peak. This is consistent with our earlier observation that velocity fluctuations are reduced at the leading edge peak and localized in the valleys of the serrations as a result of the stagnation region being spread across a wider region compared to the baseline aerofoil. These higher fluctuations in the plane of the valley are also consistent with the thicker boundary layer that develops in this plane.
Profiles of the r.m.s. streamwise velocity fluctuations along the suction side of the aerofoil at locations of distance of (a)
 $-$
0.8
 $c_{0}$
, (b)
 $-$
0.6
 $c_{0}$
, (c)
 $-$
0.4
 $c_{0}$
, (d)
 $-$
0.2
 $c_{0}$
and (e) 0 from the trailing edge of the aerofoil.

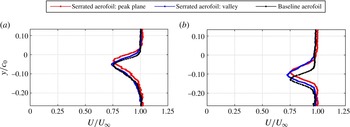
Streamwise velocity profiles of the wake measured 70 mm downstream of the trailing edge for effective angles of attack of (a)
 $0^{\circ }$
and (b)
 $2.8^{\circ }$
where the geometric angles of attacks are
 $0^{\circ }$
and
 $10^{\circ }$
respectively.

The mean velocity profiles at the trailing edge plotted in figure 17(e) and the r.m.s. velocity profile plotted in figure 18(e) are consistent with reduced self-noise radiation plotted in figure 11(b). The work of Blake (Reference Blake1970), and more recently by Stalnov, Chaitanya & Joseph (Reference Stalnov, Chaitanya and Joseph2015), has shown that the surface pressure spectrum close to the trailing edge, and hence the far-field radiation, is partly determined by the product of mean shear profile
 $(\text{d}U/\text{d}y)^{2}$
and the mean square velocity profile integrated through the boundary layer. Whilst the r.m.s. velocity profile is only slightly increased at the trailing edge compared to the baseline case, the mean shear gradients are significantly reduced, particularly close to the wall, which is responsible for self-noise generation at high frequencies (since high frequencies are generated by small eddies convecting close to the wall).
6.3 Wake characteristics
In § 6.2 it was observed that the serrated aerofoil has a thicker boundary layer compared with the baseline aerofoil. This implies that the velocity gradient near the wall is lower. The skin friction drag along the upper surface could therefore be decreased. However, a thicker boundary layer could also lead to a broader wake, thereby increasing the pressure drag. Figure 19 shows the streamwise velocity profile measured downstream of the trailing edge through the wake. Wider wake profiles are observed in the case of the serrated aerofoils compared to the baseline aerofoil suggesting an increase in drag. These findings are consistent with the drag measurements obtained directly and presented in § 5.
The lift force produced by the aerofoils may also be analysed by considering the downward displacement of the wake with respect to
 $y=0$
as an indicator of flow turning. Figure 19 indicates that the wake of the serrated aerofoil is displaced by roughly 20 % less than the baseline case indicating lower lift at both angles of attack. This is consistent with the reported decrease in lift observed by Hansen et al. (Reference Hansen, Kelso and Dally2011), Johari et al. (Reference Johari, Henoch, Custodio and Levshin2007) and lift measurements presented in figure 14.
7 Conclusions
Consistent with the results from previous work, single-wavelength leading edge serrations have been found to provide substantial noise reductions over a range of frequencies and flow speeds. Based on careful measurements of the sound power reduction for a range of serration amplitudes, wavelengths and two different turbulence length scales, this paper has derived simple scaling laws with which to understand and predict the noise reduction for arbitrary serration amplitude and wavelength. The most useful finding of this paper is the existence of an optimum serration wavelength
 $\unicode[STIX]{x1D706}_{o}$
at which maximum sound power reductions occur. The findings above allow the optimum single-wavelength serration to be designed for any arbitrary frequency range and integral length scale. This optimum wavelength has been shown to roughly equal four times the integral length scale
 $\unicode[STIX]{x1D6EC}_{t}$
. At the optimum wavelength:
-
(i) The compact sources at adjacent valleys are excited incoherently.
-
(ii) A geometric similarity condition is observed in which noise reductions are a function of the ratio of serration amplitude
$h$
to gust wavelength
$U/f$
at frequencies up until the frequency at which self-noise starts to dominate. This ratio corresponds to the Strouhal number
$St_{h}=fh/U$
. -
(iii) The ratio of the sound power produced by the serrated leading edge to the sharp edge (baseline) case is found to be inversely proportional to
$St_{h}$
for
$St_{h}\geqslant 0.2$
. This inverse Strouhal dependence observed at the optimum serration wavelength provides insight into the characteristics of the noise generation mechanism. Following the work of Kim et al. (Reference Kim, Haeri and Joseph2016), who show that the noise sources on a serrated leading edge are acoustically compact, concentrated at the valleys and are approximately the same level as on a straight edge. The inverse
$St_{h}$
dependence suggests that the ‘length’ of these sources along the leading edge must scale linearly with the hydrodynamic wavelength
$U/f$
. -
(iv) The rate of change of sound power per valley is precisely equal to the number of valleys
$N_{r}$
itself.


A very simple, idealized model is proposed to explain the precise variation in sound power reduction with
 $St_{h}$
. By assuming that noise reductions are due to variations in the phase of the serrated leading edge, and that these match the phase variation due to the gust along the leading edge, a simple function is derived whose minima match very well the measured variation in sound power reduction versus
 $St_{h}$
. We emphasize that we do not propose this model as a complete description of the noise reduction mechanism but merely to provide a simple theoretical framework in which to explain the general behaviour.
Introducing serrations onto the aerofoil leading edge has also been shown to produce a significant reduction in aerofoil self-noise of up to 3 dB. The serration valleys have been shown through PIV measurements to produce a local thickening of the boundary layer at the leading edge, resulting in an overall thicker boundary layer at the trailing edge which is reasonably uniform across the span. At this trailing edge region, mean shear gradients were found to diminish, particularly near the wall, and the r.m.s. velocity fluctuation remains similar to the levels for the sharp baseline case. The classical work of Blake (Reference Blake1970) predicts that a reduction in mean shear gradients will result in a reduction in surface pressure spectra and hence far-field noise.
The effect on aerodynamic performance of leading edge serrations has been investigated through direct measurement of the lift and drag and qualitatively through PIV measurements on the same wind tunnel used to perform the noise measurements. The introduction of leading edge serrations has been demonstrated to cause a reduction in lift coefficient by between 0.01 and 0.05 approximately and an increase in drag coefficient of 0.001 and 0.005.
Acknowledgements
This work was partly supported by the EPSRC (EP/J007633/1) and by InnovateUK, HARMONY Programme (GA no. 101367). Rolls-Royce Plc is also acknowledged for the financial and technical support given. All data supporting this study are openly available from the University of Southampton repository at http://doi.org/10.5258/SOTON/405263.