

PART 1: Introduction to predictive science
1 Introductory thoughts and comments
1.1 Comments on the title
The title of this article needs some elaboration. In particular, the adjective ‘predictive’ sets the entire exposition in a non-conventional direction, as it immediately brings into discussion the idea that some models, or some multiscale modelling, may not be truly predictive of realities at all. The terms predictive modelling or predictive science have come to mean the disciplines, philosophy, processes and mathematics underlying what is necessary to forecast realities, actual events and phenomena that occur in the physical universe. A central issue is that for scientific prediction, one must cope with a daunting list of uncertainties in every aspect of the prediction process or, equivalently, of the process of developing predictive models of physical events. We discuss the foundations of predictive computational science and methods for quantifying uncertainty in this article. Some of these ideas are surveyed in Oden, Babuška and Faghihi (Reference Oden, Babuška, Faghihi, Stein, de Borst and Hughes2018) and Oden (Reference Oden2017), and portions of Part 1 of this exposition are drawn from these works.
Another adjective in the title is multiscale, a term appearing frequently in contemporary literature, in reference to the fact that many physical phenomena (in fact, all physical phenomena we observe in our day-to-day existence), are manifested by events that occur at many different spatial and temporal scales. How to correctly model the complex events at one spatial scale and how they may influence events at other scales stands as one of the most elusive and challenging goals of modern computational science. Indeed, this question has stood at the centre of physical chemistry, thermodynamics and statistical mechanics for over a century.
Finally, the word adaptive also appears in our title, meaning to ‘change or adapt so as to control and improve’. A predictive model must be able to predict events or realities with a level of accuracy acceptable to the modeller, and this demands that the modeller provide a metric or norm measuring the distance of a (computer) prediction of a quantity of interest from a reality or from an exact solution of the model, plus an error tolerance defining the level of error acceptable to the modeller. If that level of accuracy is not met, one seeks to adapt the model to improve accuracy and meet the error tolerance or reject it in the favour of another model. Adaptive modelling is thus an exercise in control theory, in which a system is controlled to meet well-defined objectives. In contemporary predictive adaptive modelling, the control paradigms are severely complicated by the overpowering uncertainties in observational data, model parameters and, importantly, in the actual selection of the appropriate model itself. When one adds the complexities that occur when different model structures exist as different spatial and temporal scales, a new field emerges – and a brief journey into that field is one goal of this exposition.
1.2 The structure of this exposition
This work deals with several fundamental topics within the broad area of predictive modelling, all built around relatively new computational methods. Thus, while numerical algorithms are at the centre of all parts of this essay, the scope is a much larger one, not only covering the structure of key algorithms but also the broader philosophy of predictability in the presence of uncertainties. Because of the wide scope of this presentation, a tutorial style is employed in many places, so as to make the work accessible to a broad audience.
2 Predictive computational science
Summing up the points laid down in the opening comments, we define predictive computational science as the scientific discipline concerned with assessing the predictability of mathematical and computational models of events that occur in our physical universe in the presence of uncertainties in all of the factors that determine the reliability and scientific significance of the prediction. Prediction is a fundamental mission of basic science and the essence of engineering, which is concerned with the application of science in the prediction at the performance of engineered systems under design conditions: the overarching goal of engineering for centuries. It is also at the core of medical science, which seeks to predict the outcome of therapies and medical procedures.
What is a ‘science-based prediction’? Indeed, what is science? The word science is derived from the Latin, scientia, meaning knowledge. Thus, the Oxford English Dictionary defines science as the activity concerned with the systematic acquisition of knowledge: the enterprise that builds and organizes knowledge in forming testable explanations and predictions about events that take place, or can take place, in the universe. Engineering and medicine are the activities concerned with the application of scientific and practical knowledge for the benefit or needs of mankind.
Exactly how knowledge is acquired is a subject debated for millennia. To Socrates and Plato (c. 370 BCE), humankind is endowed with pre-existing knowledge, knowledge that is already present in our minds and is accessible to our intuitive powers. Aristotle had a quite different view: in his Organon describing his six works on logic, he asserts that the acquisition of knowledge comes through sensation and perception. Sensation is the use of one’s five senses to experience reality via empirical events and thus interpretation by the consciousness of the subject acquiring knowledge. To this he adds perception, the recognition that the event has a sensation. The term observation refers to the acquisition of information through one’s senses, or through aids to one’s senses made possible by using instruments, all to either observe natural events or events orchestrated in experimental set-ups. Aristotle was the father of logic – the science of reasoning – and he laid down the rules of deductive logic as the foundations of algebra and much of mathematics.
Deductive reasoning, or deductive logic, began with the two-sided logic advanced by Aristotle. It is embodied in a process of reasoning beginning with one or more general statements (axioms or principles) and following the rules of logic to reach logical conclusions. It thus provides the formalisms for mathematics and mathematical proof. It (deduction) is sometimes called ‘top-down’ logic. It is infallible and not influenced by empirical observations. On the other hand, scientific knowledge is based on inductive logic, the process of reasoning by generalizing or extrapolating from initial information or hypotheses. Inductive logic is ‘bottom-up’ logic, an open system including domains of epistemic uncertainty, thus allowing a conclusion to be false.
Thus, from antiquity there came the notions that knowledge can arise from observations of natural events or events manufactured in experiments, and through logical conceptualizations, usually mathematical in form, that model or characterize in some way the observations, with the hope of predicting events in the future. Thus, a scientific theory generally rests on a mathematical model. But not all philosophies accepted these ideas.
Philosopher David Hume (1711–1776) launched the scientific philosophy of scepticism whereby he asserted that knowledge can only be obtained through the study of empirical observations and data. He thus rejected inductive logic as a means to gain knowledge: if inductive logic can allow a possibly false conclusion, how can it be a source of knowledge? Fortunately, the great theoretical scientists of the eighteenth, nineteenth and twentieth centuries (Maxwell, Einstein, Dirac, Boltzmann, …) ignored this point of view and went on to vastly increase our knowledge of the universe through miraculous advances in theoretical science. The paradox between experimental evidence and scientific theory was more or less put to rest by the philosopher Karl Popper (1902–1994) who introduced the principle of falsification. According to this principle, any scientific claim, any hypothesis put forth as a possible scientific theory, cannot qualify as a scientific theory unless it is possible that it be falsified, that is, it can possibly be disproved when new conflicting information is acquired. Quite the opposite to Hume, famous astronomer Arthur Eddington (1882–1944) announced that ‘one should never accept any experimental data that has not been confirmed by theory’ – an affront to Hume’s philosophy and an acknowledgement of the great advances in theoretical physics made by his associate Paul Dirac, who discovered antimatter through purely theoretical arguments four years before it was observed experimentally. To the great probabilist and physicist E. T. Jaynes (1922–1998), all knowledge is inductive: inductive logic must precede the performance of meaningful experiments or the interpretation of observations of natural events. Coveney, Dougherty and Highfield (Reference Coveney, Dougherty and Highfield2016, p. 3) assert that ‘causality is not part of science’; and ‘science concerns the mathematical description of behaviour’: ‘reason guiding experiment’ (as emphasized by Jaynes Reference Jaynes2003), ‘new reason and then experiment’. It is exactly this strategy that we follow in model validation and selection in later sections.
Today it is generally recognized that knowledge is acquired through observation and theory, the two classical pillars of science. These are the foundations of the scientific method, the body of techniques for investigating phenomena and acquiring new knowledge based on observation (empirical or measurable evidence) and theory (the formulation, testing, and modification of mathematical models based on inductive logic laid down to explain observed or perceived events).
Throughout this work, theory is presumed to be characterized by mathematical models or models derived from surrogate models that arise from simplifying and subjective assumptions. When possible, such models are generally based on long-standing scientific principles complemented by empirical laws, all expressed in mathematical constructions.
A third pillar of science, computational science, is recognized as a new means of acquiring knowledge through computer simulations where experiments are impossible or inadequate for acquiring observational data. There are countless examples in which computer simulations based on models derived from accepted physical laws and empirical relationships provide a path to knowledge, assuming that the models are ‘reliable’ in some sense. One issue to be addressed in some depth here is model validity, taken up in Part 2.
These cornerstones of predictive science – the collection and interpretation of observational and experimental data, the creation and use of theory and models, and the use of computer simulations – are by no means independent: they are intrinsically intertwined and inseparably connected. Inductive reasoning precludes the design of experiments: theory and models underlie the design and construction of instruments and measuring devices, and data and mathematical abstractions of theoretical models form the foundation of computer simulations. All are fundamental to science-based prediction.
Efforts to expand and enrich the processes of prediction to take such uncertainties into account has gradually begun to reshape much of scientific and mathematical research over the last two decades, and particularly over the last decade, and a large and growing literature is devoted to the subject. As representative, see AIAA (1998), ASME (2006), Oden (Reference Oden2014), Roache (Reference Roache1998), Oberkampf and Roy (Reference Oberkampf and Roy2010), Babuška, Tempone and Nobile (Reference Babuška, Tempone and Nobile2008), Szabó and Babuška (Reference Szabó and Babuška2011), Babuška and Oden (Reference Babuška and Oden2004), Ainsworth and Oden (Reference Ainsworth and Oden2000), Oden et al. (Reference Oden, Babuška, Faghihi, Stein, de Borst and Hughes2018), Oden (Reference Oden2017) and Oden, Moser and Ghattas (Reference Oden, Moser and Ghattas2010). Predictive computational science concerns the development of methods for handling randomness in observational data, model selection, model calibration, model validation, and verification of computational models in the presence of uncertainties. It therefore embraces the development of methods for solving the forward prediction problem for target outputs, the quantities of interest, methods for solving statistical inverse problems for parameter identification, and quantifying the uncertainty in the predictions. In the jargon of early literature on coping with uncertainties, the field was given the acronym ‘VV & UQ’ (validation, verification and uncertainty quantification). More recently, this label has been truncated to simply ‘UQ’ – uncertainty quantification – a simplification that some say has unfortunately moved attention away from some of the most important issues of all: model selection and validation.
This exposition presents a broad overview of the field of adaptive multiscale predictive modelling in three parts. In Part 1, an introductory account of what we refer to as predictive computational science is given. This includes a summary of ideas underlying the theory of logical probability of Cox and Jaynes as interpreted by Van Horn and others, that leads logically to a Bayesian framework for dealing with uncertainties in predictive modelling. Bayesian approaches to model calibration, validation and model selection are then discussed, together with a brief look at frequentist approaches. Part 2 contains a review of fundamental principles and rules of model validation, an introduction to information entropy and the Maximum Entropy Principle, a very brief review of Monte Carlo methods, Markov chain Monte Carlo methods, and parameter sensitivity analysis. Part 3 covers methods of model selection, adaptive modelling, a posteriori estimates of modelling errors, and methods of adaptive multiscale modelling. Here OPAL, the Occam Plausibility Algorithm, is presented as a framework for systematically implementing many of the rules and principles of model selection, calibration and validation. Applications to the selection and validation of complex models of tumour growth are described as a canonical example of how various tools and theories covered can be implemented to identify predictive models of complex physical events.
2.1 Mathematical models
At the heart of predictive computational science is the idea of a mathematical model of a class of physical events of interest, a mathematical abstraction of reality generally based on a combination of scientific principles and empirical laws. Mathematical models stand as surrogates or as representatives of theories – the mathematical abstractions designed to approximate perceived realities – and to provide the essential component in prediction of future events.
It is convenient (indeed, essential for our purposes) to consider mathematical models as representing an abstract mathematical problem, such as the following. Given a vector
 $\boldsymbol{\unicode[STIX]{x1D703}}$
and a domain
 $S$
in which the problem is posed, find a function
 $u(\boldsymbol{\unicode[STIX]{x1D703}},S)\in U$
such that
 $$\begin{eqnarray}{\mathcal{A}}(\boldsymbol{\unicode[STIX]{x1D703}},S;u(\boldsymbol{\unicode[STIX]{x1D703}},S))=0,\end{eqnarray}$$
where
 ${\mathcal{A}}$
is a collection of operators (algebraic, differential, partial-differential, integral, …), including possibly constraints, boundary and initial conditions,
 $\boldsymbol{\unicode[STIX]{x1D703}}\in \unicode[STIX]{x0398}\subset \mathbb{R}^{k}$
is a vector of model parameters taken from a parameter space
 $\unicode[STIX]{x0398}$
,
 $S$
is the scenario in which the problem is posed, and
 $u(\boldsymbol{\unicode[STIX]{x1D703}},S)$
is the solution of equation (2.1) which belongs to a function space
 $U$
for specific
 $\boldsymbol{\unicode[STIX]{x1D703}}$
and
 $S$
.
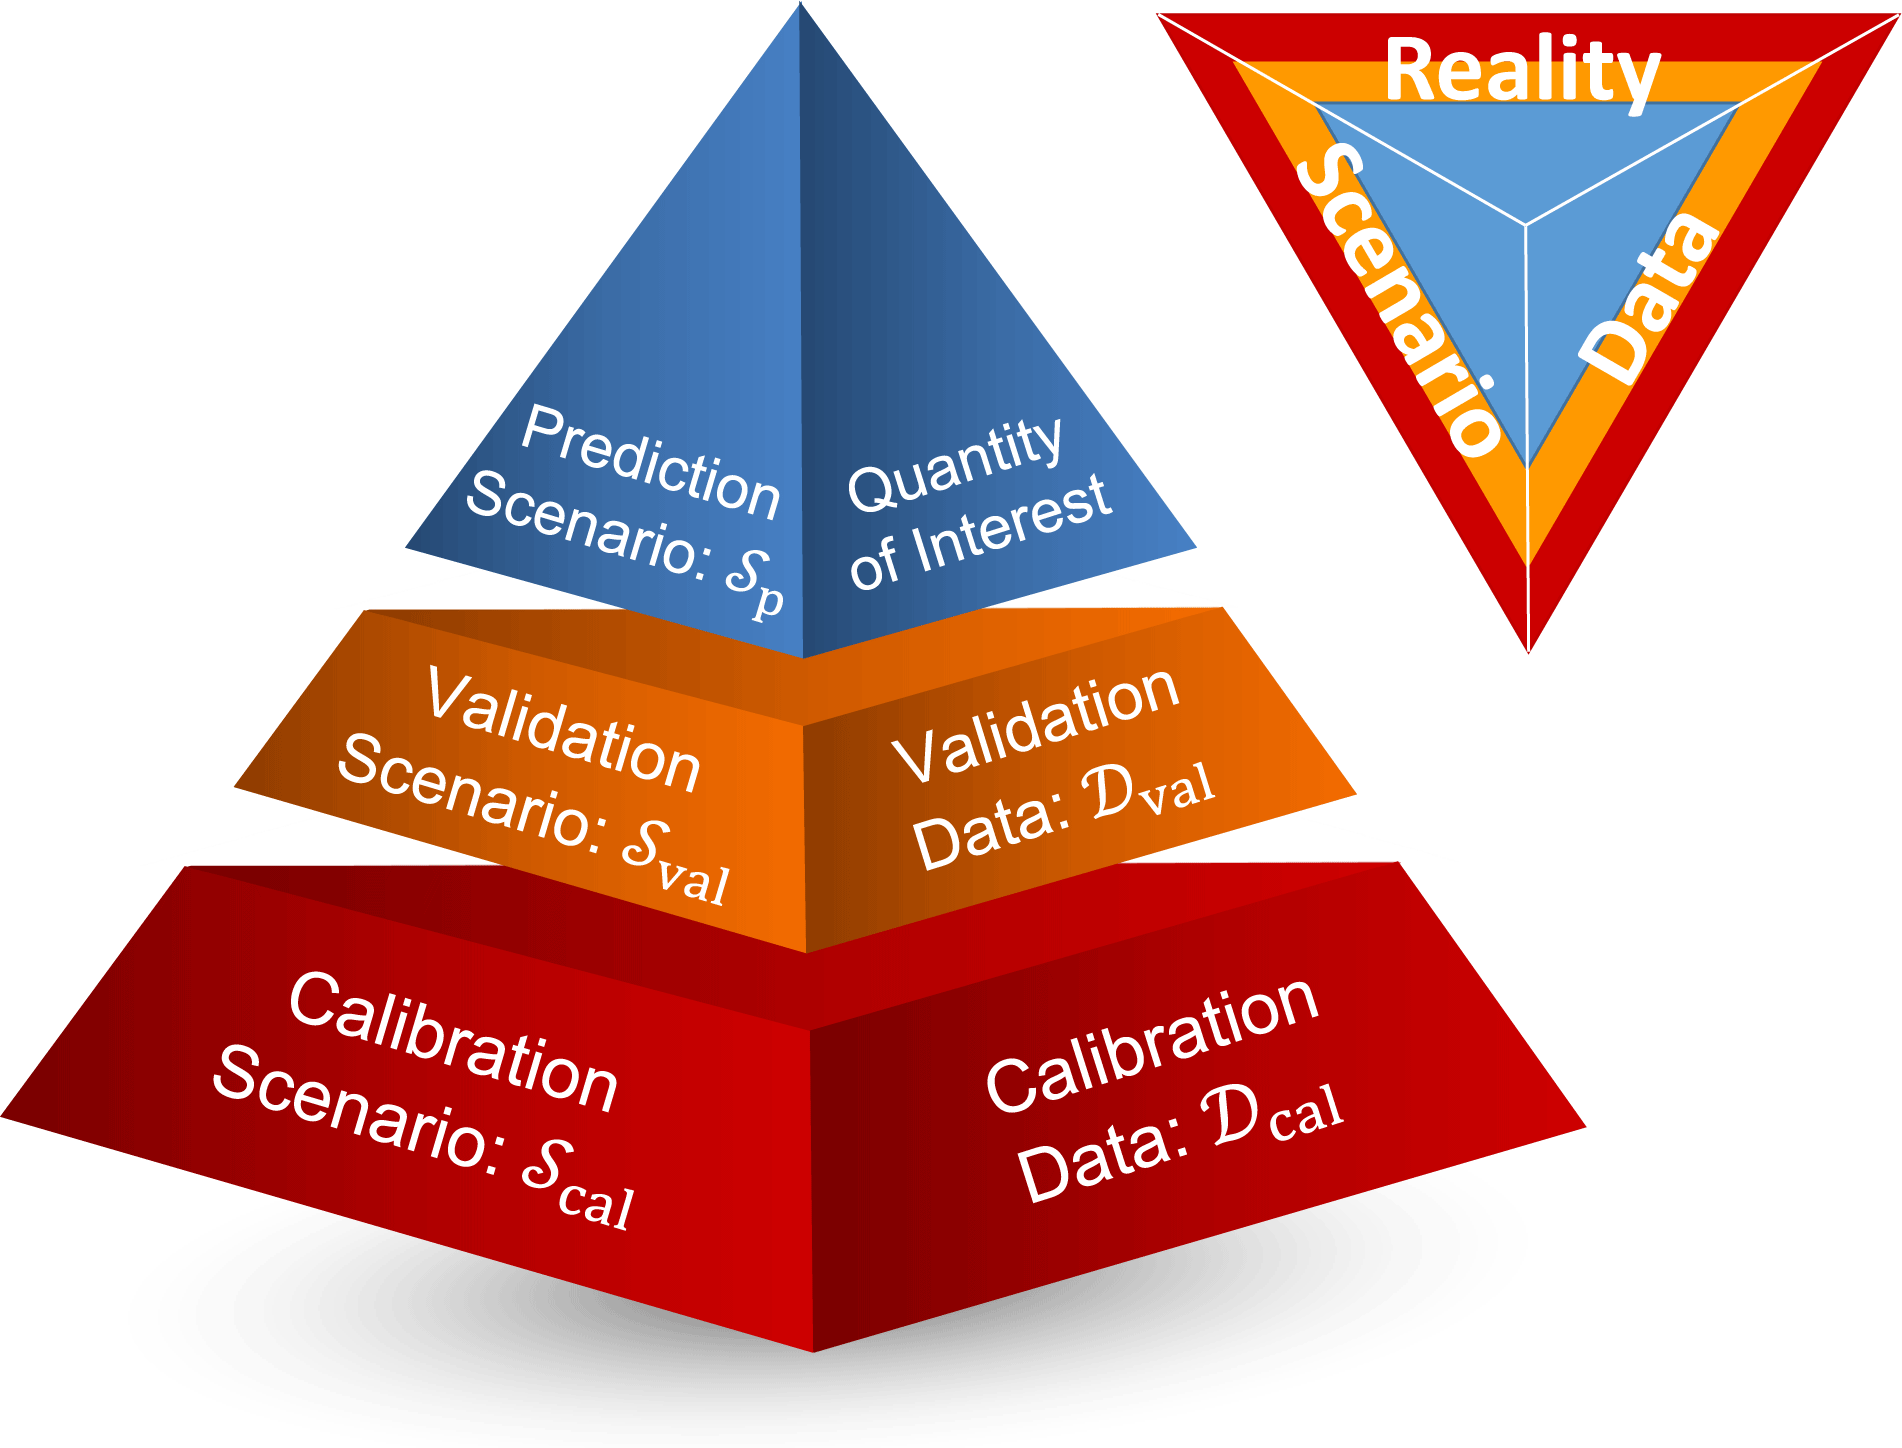
The notion of a scenario is intended to describe the features of the mathematical problem which can be exactly specified, independent of parameters, such as the domain of the solution and certain boundary and initial conditions, the idea being that the same model may be used in several different scenarios. We use the term scenario interchangeably to refer to both the domains in which the mathematical model (2.1) is solved and the actual physical environments in which experimental data are collected, or in which the target quantities to be predicted reside. Later we will argue that it makes sense to consider a hierarchy of scenarios, beginning with component or unit calibration tests in scenarios
 $S_{c}$
to initially adjust model parameters, then moving to more complex subsystem validation scenarios
 $S_{v}$
to test the accuracy with which the model can predict observables (to see if the model is ‘valid’), and then the prediction scenario
 $S_{p}$
, involving the full physical system and model, in which the forward problem (2.1) is solved to predict the quantities of interest (QoIs). A revealing example of various scenarios emerges in models of biomedical systems in which in vitro data are selected in laboratory experiments (e.g. cell proliferation in a Petri dish supplied with concentration of nutrients, or in vitro experiments with laboratory animals) and the models are there expected to be validated using in vivo data collected through biopsies or emerging imaging techniques. These are the calibration scenarios
 $S_{c}$
(the in vitro experiments) and the validation scenarios
 $S_{v}$
(the in vivo experiments). The model may then be called upon to make an out-of-data prediction in the prediction scenario
 $S_{p}$
. We discuss these ideas in more detail later.
To develop a framework for addressing uncertainties, we accept the idea that the model parameters
 $\boldsymbol{\unicode[STIX]{x1D703}}$
may generally be random vectors. Thus, the solutions
 $u(\boldsymbol{\unicode[STIX]{x1D703}},S)$
are random or stochastic functions. Problem (2.1), therefore, describes an infinite class of models parametrized by
 $\boldsymbol{\unicode[STIX]{x1D703}}$
. The mathematical problem characterized by (2.1) is called the forward problem. It describes a projection of data ‘forward’ into a prediction
 $u(\boldsymbol{\unicode[STIX]{x1D703}},S)$
. Thus,
 $u(\boldsymbol{\unicode[STIX]{x1D703}},S)$
is the solution of the forward problem. Given observational data, and a mathematical model, the problem of determining the model parameters that best fit the data, in some statistical sense, is the (Bayesian) inverse problems, which we take up in Part 2.
Two basic issues arise at this point.
(i) Solutions
 $u(\boldsymbol{\unicode[STIX]{x1D703}},S)$
to the forward problem must exist for every
$\boldsymbol{\unicode[STIX]{x1D703}}\in \unicode[STIX]{x0398}$
. This often-ignored fact leads to conditions on the space
$\unicode[STIX]{x0398}$
of parameters. Generally, the solution will be a member of an appropriate space
$U$
of random functions.
(ii) The fundamental goal of constructing and solving the model (2.1) is not only to determine the solution of the forward problem, but to use these solutions to compute specific QoIs, generally described as functionals
$Q$
on the space
$U$
containing the solution. This calculation is made in the full prediction scenario,
$S=S_{p}$
. Thus,
$S_{p}$
pertains to the full system in which the model extrapolates all relevant information to predict an outcome beyond those events available through the analysis of observational data: (2.2)Clearly,$$\begin{eqnarray}Q:U\rightarrow \mathbb{R}:Q(u(\boldsymbol{\unicode[STIX]{x1D703}},S_{p}))=\bar{Q}(\boldsymbol{\unicode[STIX]{x1D703}}).\end{eqnarray}$$
$\bar{Q}$
is, in general, a random function.


The determination of the validity of the model (2.1) as a means of predicting
 $\bar{Q}$
of (2.2) must, by definition, involve determining the accuracy with which model predictions agree with experimental data – the observations. These data are collected in a model validation scenario
 $S_{v}$
, which is characterized by an experimental set-up designed to, hopefully, represent how well the model can predict the QoI. As noted earlier, at a lower unit-test level, initial characterizations of model parameters are done in calibration scenario
 $S_{c}$
, wherein experimental data are used to adjust parameters so as to make model predictions agree with experimental measurements. The full calibration–validation–prediction process is symbolized in a ‘prediction pyramid’ described later (see Figure 5.1).
2.2 Sources of uncertainty in predictions
So what is the anatomy of scientific prediction within the context laid down thus far, and how do we cope with the multitude of uncertainties in each step of the prediction process? We wish to predict a specific reality in a possibly very complex scenario
 $S_{p}$
using a computational model which is based on a mathematical model of a real situation from which the target QoI can be specified. We must therefore select a model that we hope can deliver a sufficiently accurate estimate of the QoI and for which we have some confidence in its predictability. The predictability of our model rests on knowledge gained through observation – and our access to observational data – and our inductive reasoning embodied in our construction of a model. The model, in general, will be characterized by a set of parameters which themselves are generally unknown, and which at best involve uncertainties. Then we must discretize the mathematical model to produce a computational model, a corruption necessary to render the model into a form that can be processed by digital computers.
Collecting all these sources of uncertainty, and following, in part, the classification plan of Terenin and Draper (Reference Terenin and Draper2015), we list the following sources of uncertainty in predictive computational science and in making prediction of realities.
(1)
${\mathcal{P}}$
uncertainty.

This is so-called systemic uncertainty – uncertainty concerning the appropriate system of reasoning or the mathematical framework in which to study and quantify uncertainty in a logically consistent way. For example, do we frame our predictive process in the language of probability theory (if so, which one?), possibility theory, fuzzy sets, Dempster–Shafer theory or interval analysis? Which logical system produces a self-consistent way to deal with uncertainty in prediction?
(2)
${\mathcal{Y}}$
uncertainty.

This embodies uncertainty in observational data. All data recorded from physical experiments can be polluted by experimental noise. How do we cope with uncertainties in data?
(3)
${\mathcal{M}}$
uncertainty.

One of the most elusive and important sources of uncertainty is the selection of the mathematical model itself:
 ${\mathcal{M}}$
uncertainty. We agree with the famous quote of George E. P. Box (Box Reference Box1979, Box and Draper Reference Box and Draper1987): ‘Essentially, all models are wrong, but some are useful.’ One of the most important missions of model selection and validation processes is to identify such useful models.
(4)
$\unicode[STIX]{x1D703}$
uncertainty.

Model parameter
 $\boldsymbol{\unicode[STIX]{x1D703}}$
uncertainty: the uncertainty in parameter values or in parametric families of distributions – a key source of uncertainty in predictive models.
(5)
$h$
uncertainty.

This is uncertainty brought about by the discretization process that produces the computational model – ‘
 $h$
’ representing an appropriate discretization parameter. This uncertainty can sometimes be estimated a posteriori through error estimation or bounded through a priori estimates or at least studied in some quantitative sense through various verification processes.
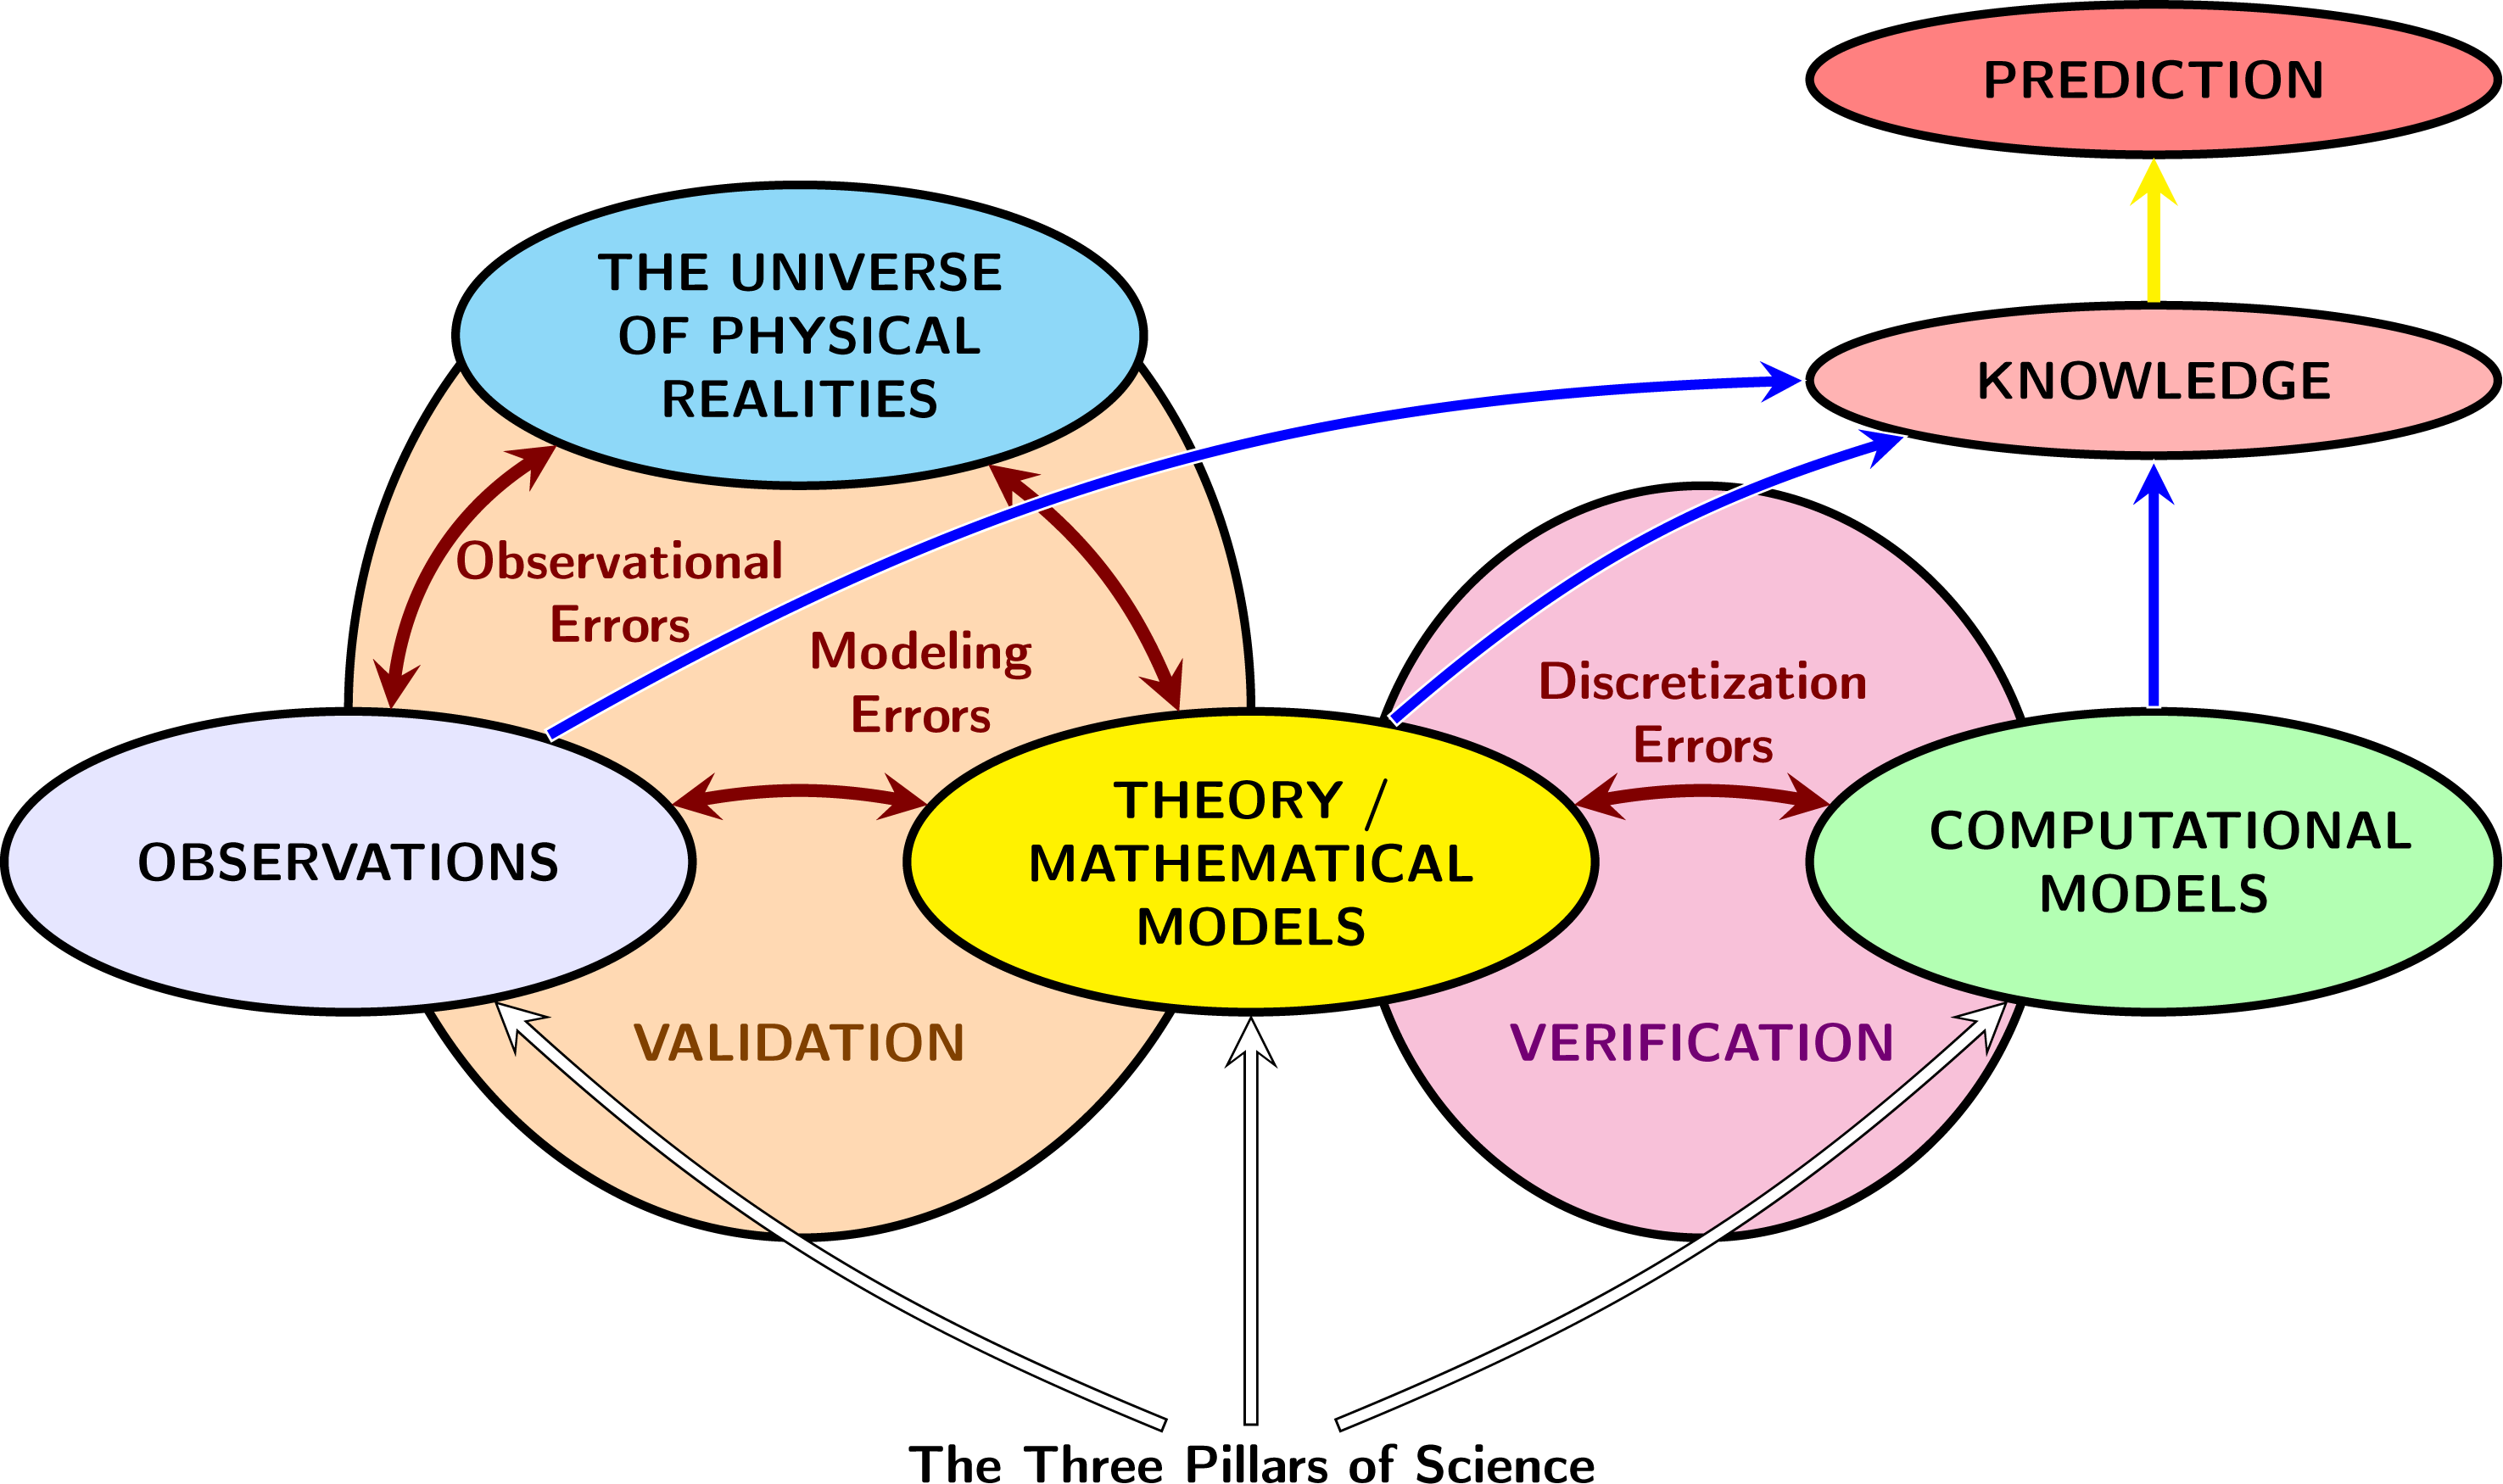
The various paths to knowledge, made imperfect by the uncertainties discussed, are represented symbolically in Figure 2.1.
The imperfect paths to knowledge and prediction. A schematic of the imperfect paths to knowledge that involve uncertainties in all phases of the process for gaining knowledge and making predictions. (From Oden et al. Reference Oden, Moser and Ghattas2010.)

To lay the philosophical foundations for our view of systemic (
 ${\mathcal{P}}$
) uncertainty, we provide a review of the logical theory of probability of Cox and Jaynes, which points to a Bayesian framework for studying most of the sources of uncertainty. Then we review briefly the Fisher/frequentist approach to problems in statistical analysis.
3 The logical theory of probability of R. T. Cox and E. T. Jaynes
We are familiar with the ‘classical’ (frequentist) theory of probability of Kolmogorov built on the notion of a triple representing a probability space
 $(\unicode[STIX]{x03A9},{\mathcal{F}},\mathbb{P})$
, consisting of the set
 $\unicode[STIX]{x03A9}$
of all possible outcomes of an action or experiment designed to characterize random events, the sigma algebra
 ${\mathcal{F}}$
embodying the set of all events, each containing possible outcomes
 $\unicode[STIX]{x1D714}\in \unicode[STIX]{x03A9}$
or no outcomes at all (
 $\emptyset \in {\mathcal{F}}$
), and a probability measure
 $\mathbb{P}$
to reflect the frequency with which an outcome will be observed over an infinite number of samples, thus inherently appealing to an infinite sequence of samples and to a limit process depending on certain topological properties.
An alternative and quite different mathematical framework to Kolmogorov’s for developing a theory of probability was begun by R. T. Cox (Reference Cox1946), expanded on in subsequent accounts (Cox Reference Cox1961, Cox Reference Cox, Levine and Tribus1979), and enriched and extended by E. T. Jaynes in his treatise Probability Theory: The Logic of Science, published posthumously (Jaynes Reference Jaynes2003). A significant literature has accumulated on this so-called subjective or logical theory of probability based on Bayesian inference, including works on the Bayesian approach to scientific reasoning by Howson and Urbach (Reference Howson and Urbach2006), counterexamples to Cox’s original examples by Halpern (Reference Halpern1999a ), ‘patches’ (corrections) to the theorem by Halpern (Reference Halpern1999b ) and alternative proofs and interpretations by Arnborg and Sjodin (Reference Arnborg and Sjodin2001), Knuth and Skilling (Reference Knuth and Skilling2012), Zimmermann and Cremers (Reference Zimmermann, Cremers and Calude2011) and Dupre and Tipler (Reference Dupre and Tipler2009). A ‘guide to Cox’s theorem’ was provided by a comprehensive account of Van Horn (Reference Van Horn2003), and a recent paper by Terenin and Draper (Reference Terenin and Draper2015) is devoted to ‘rigorizing and extending the Cox–Jaynes derivation of probability’. We briefly outline the essential features of Cox–Jaynes theory, drawing from Jaynes (Reference Jaynes2003), Van Horn (Reference Van Horn2003) and Terenin and Draper (Reference Terenin and Draper2015).
3.1 Plausible reasoning
The notion of logical or Cox–Jaynes probability begins with the concept of plausible reasoning. The idea is that in science, and indeed, in everyday life, we rarely have enough information to permit deductive reasoning. Instead, we make plausible conclusions based on past experience. Certain reasoning processes assess the plausibility of a proposition accepting that it may not be a certainty. Thus, we regard the logical approach to scientific reasoning as one way of assessing the plausibility of a proposition (as opposed to the frequency of an event) that can be true or false or that can be assigned a degree of plausibility.
The appropriate mathematical setting for such considerations is that furnished by a Boolean algebra.
Propositional Boolean algebra. A propositional Boolean algebra
 $C$
consists of the 6-tuple
 $$\begin{eqnarray}C\sim \{{\mathcal{A}},\wedge ,\vee ,\neg ,\mathbf{0},\mathbf{1}\},\end{eqnarray}$$
wherein
∙
${\mathcal{A}}=$
a set of true propositions, which might be finite, countable or uncountable;∙ two binary operations,
$\wedge$
and
$\vee$
, and a unitary operation
$\neg$
on the propositions in
${\mathcal{A}}$
, i.e.,–
$A\wedge B=$
the conjunction of
$A$
and
$B$
, meaning that both
$A$
and
$B$
are true,–
$A\vee B=$
the disjunction of
$A$
and
$B$
, meaning that at least one of
$A$
and
$B$
is true (‘
$A$
or
$B$
’),–
$\neg A=A\neg =$
the negation of
$A$
, meaning
$A$
is false;
∙ two identity elements
$\mathbf{0}$
and
$\mathbf{1}$
.


We also require the following.
(i)
$C$
is closed under countable applications of
$\wedge$
and
$\vee$
.(ii) For all propositions
$(A,B,C)\in {\mathcal{A}}$
, the following five Boolean axioms hold.Associative laws:
$$\begin{eqnarray}A\wedge (B\wedge C)=(A\wedge B)\wedge C,\quad A\vee (B\vee C)=(A\vee B)\vee C.\end{eqnarray}$$
Commutative laws:
$$\begin{eqnarray}A\wedge B=B\wedge A,\quad A\vee B=B\vee A.\end{eqnarray}$$
Identity elements:
$$\begin{eqnarray}A\wedge \mathbf{1}=A,\quad A\vee \mathbf{0}=A.\end{eqnarray}$$
Complementation or negation:
$$\begin{eqnarray}A\wedge (\neg A)=\mathbf{0},\quad A\vee (\neg A)=\mathbf{1}.\end{eqnarray}$$
Distributive laws:
$$\begin{eqnarray}\displaystyle A\wedge (B\vee C) & = & \displaystyle (A\wedge B)\vee (A\wedge C),\nonumber\\ \displaystyle A\vee (B\wedge C) & = & \displaystyle (A\vee B)\wedge (A\vee C).\nonumber\end{eqnarray}$$


The conjunction of two propositions
 $A\wedge B$
is also written
 $AB$
, i.e. as a ‘product’, and the disjunction
 $A\vee B$
is written as the sum
 $A+B$
, all in analogy with the (‘two-valued’) algebra of numbers. In this context, the Boolean algebra of propositions is said to follow the rules of Aristotelian logic.
The plausibility of a proposition
 $A$
, given that a proposition
 $B$
is true, is characterized by a real-valued function
 $pl(.|.)$
on pairs of propositions:
 $$\begin{eqnarray}pl:{\mathcal{A}}\times {\mathcal{A}}/\mathbf{0}\quad \rightarrow \mathbb{R}^{+}.\end{eqnarray}$$
Thus
 $pl(A|B)$
is the degree of plausibility of proposition
 $A$
given that
 $B$
is true. If
 $B$
is true,
 $A$
becomes plausible, while evidence does not guarantee that
 $A$
is true, but by observation of one or more of its consequences gives confidence that
 $A$
is plausible. Also, if, given
 $B$
,
 $A$
is more plausible than
 $C$
, we have
 $pl(A|B)>pl(C|B)$
. Other fundamental rules will follow.
Jaynes’ example (Jaynes Reference Jaynes2003). Suppose we state the proposition
 $A\sim$
‘it will start raining at 10.00 a.m. at the latest’, and
 $B\sim$
‘the sky will become cloudy before 10.00 a.m.’ Plausible reasoning not only establishes whether a proposition is more or less plausible, it evaluates the degree of plausibility in some way. For example the darkness of the clouds may suggest the degree of plausibility of rain.
3.2 Logic and philosophical theories of probability
Logic is the science of reasoning, an intellectual discipline with origins dating back millennia, that provides the cornerstones to mathematics, science and all forms of human knowledge.
As noted in Section 2, deductive logic or logical deduction is a form of reasoning from one or more premises or axioms so as to deduce a logically certain conclusion. Deductive logic is infallible and irrevocable when its conclusions are reached by following strict laws of reasoning. Mathematics is a discipline founded on deductive logic: one lays down axioms and definitions and then deduces their consequences following rules of logic. According to Jaynes (Reference Jaynes2003), however, all knowledge is inductive. In deductive reasoning, if
 $A$
and
 $B$
are elements or propositions, one writes
 $A\Rightarrow B$
to mean if
 $A$
is true,
 $B$
is logically deduced from
 $A$
. According to Jaynes (Reference Jaynes2003, p. 4), in almost all situations, ‘we do not have the right kind of information to allow this kind of reasoning’. In the formal logic of plausible reasoning
 $A\Rightarrow B$
means only that
 $A$
and
 $B$
have the same ‘truth value’.
If
 $A$
and
 $B$
are true propositions, a proposition
 $C$
which is a function
 $f$
of
 $A$
and
 $B$
, (
 $C=f(A,B)$
), can be either true or false. Since
 $A$
and
 $B$
take on values
 $[TT,TF,FT,FF]$
, there are 16 logical functions:
 $f(T,T)=T,f(T,T)=F,\ldots$
etc. Thus a logical function of
 $n$
propositions has
 $2^{n}$
function values. One can therefore construct truth tables analogous to the theory of elementary logic of operations on real numbers, to cover possible truth values of such logic functions.
Plausible reasoning not only establishes whether a proposition is more or less plausible, it evaluates the degree of plausibility in some way (e.g. the darkness of the clouds may suggest the plausibility of rain). Examples of the Boolean algebra of propositions are as follows.
∙
$A,B,C,\ldots =$
propositions = unambiguous, simple, definitive, statements that are either true or false (two-valued Aristotelian logic)∙ As noted earlier, conjunction ‘cojoins’ two propositions into a ‘logical product’:
$$\begin{eqnarray}A\wedge B=AB\quad (\text{both }A\text{ and }B\text{ are true}).\end{eqnarray}$$
∙ Disjunction, called the ‘logical sum’, ‘disjoins’ two propositions:
$$\begin{eqnarray}A\vee B=A+B\quad (\text{at least one of }A\text{ and }B\text{ are true}).\end{eqnarray}$$
∙ Negation describes ‘denial’:
$$\begin{eqnarray}\neg A\equiv A\quad \text{is false}.\end{eqnarray}$$
∙ We understand equality and identity of propositions as
$$\begin{eqnarray}\displaystyle A & = & \displaystyle B\quad (A\text{ and }B\text{ are equal in truth (or `truth value')}),\nonumber\\ \displaystyle A & \equiv & \displaystyle B\quad (A\text{ and }B\text{ are equal by definition}).\nonumber\end{eqnarray}$$


Some properties:
∙
$A\vee \neg A=$
a necessary (or logical) truth (
$A$
is either true or false),∙
$A\wedge \neg A=$
a necessary (or logical) falsehood (
$A$
is true and false),∙
$\neg A\wedge B=AB$
is false,∙
$\neg A\wedge \neg B=$
both
$A$
and
$B$
are false,∙ if
$C=A\wedge B$
, then
$\neg C=\neg A\vee \neg B$
,∙ if
$D=A\vee B$
, then
$\neg D=\neg A\wedge \neg B$
.





These properties are recognized as analogous to elementary set properties with
 $A,B,C,D$
sets,
 $AB=A\cup B$
,
 $A+B=A\cap B$
,
 $\bar{A}=A^{\prime }$
, etc.
 $A\Rightarrow B$
(
 $A$
implies
 $B$
) does not assert that either
 $A$
or
 $B$
is true, it means
 $A\wedge \bar{B}$
(
 $A$
and (
 $B$
is false)) is false or
 $\bar{A}\vee B$
(either
 $A$
is false or
 $B$
is true) is true.
3.3 Van Horn’s guide to Cox’s theorem
It is informative to follow a few arguments given by Van Horn in his guide to Cox’s theorem (Van Horn Reference Van Horn2003). There are two central notions.
(i) The state of information
$X$
summarizes the information one has on what is called the ‘atomic proposition
$\unicode[STIX]{x1D6EC}$
’: those that cannot be decomposed into other propositions. These atomic propositions form the basis for the state of information
$X$
.(ii) The plausibility of a proposition
$A\in {\mathcal{A}}$
, given the state of information
$X$
, is a number
$pl(A|X)$
: the state of information obtained from
$A$
by adding the additional information that
$X$
is true, thus written
$(AX)$
or
$(A|X)$
.


We may now lay down several assumptions. In the notation inspired by Van Horn, there are five ‘rules’,
 $\text{R1},\ldots ,\text{R5}$
.
R1.
The plausibility
 $pl(A|X)$
of
 $A$
given
 $X$
is a single non-negative real number. Moreover, there exists a number
 $T$
(the plausibility of some known true proposition) such that
 $pl(A|X)\leq T$
. We say that
 $X$
is consistent if there is no proposition
 $A$
for which both
 $pl(A|X)=T$
and
 $pl(\neg A|X)=T$
(are true).
R2.
Plausibilities are consistent with so-called propositional calculus, in the sense that the following hold.
(i) If
$A\Leftrightarrow A^{\prime }$
, meaning that ‘
$A\Leftrightarrow B$
’ is a tautology (meaning a fundamental truth in formal logic), then
$pl(A|X)=pl(A^{\prime }|X)$
.(ii) If
$A$
is a tautology, then
$pl(A|X)=T$
.(iii)
$pl(A|B,C,X)=pl(A|(B\wedge C),X)$
.(iv) If
$X$
is consistent and
$pl(\neg A|X)<T$
, then
$A$
,
$X$
is also consistent.





R3.
There is a non-increasing function
 $S$
such that
 $pl(\neg A|X)=S(pl(A|X))$
for all
 $A$
and consistent
 $X$
.
R4 (universality).
There exists a non-empty set
 $Y_{\circ }$
that is a dense subset of
 $(S(T),T)$
. Thus, for real numbers
 $a,b,c\in Y_{\circ }$
there is a consistent
 $X$
and three atomic propositions
 $A_{1},A_{2},A_{3}$
such that
 $a=pl(A_{1}|X)$
,
 $b=pl(A_{2}|A_{1},X)$
and
 $c=pl(A_{3}|A_{2},A_{1},X)$
.
Rules R1–R4 are set up to establish more or less commonsense properties of the plausibility of a proposition. R1 establishes the reasonable notion that real numbers can be used to represent degrees of plausibility, and that larger numbers
 $T$
represent higher degrees of plausibility, representing the plausibility of certain known true propositions. The idea that for a given state of information
 $X$
, two plausibilities
 $A$
and
 $B$
are equally plausible, or one is more plausible than the other, is an assumption of universal comparability. The idea is not without some controversy. Some (e.g. Shafer Reference Shafer1976) propose that a ‘two-dimensional’ logic may be called for, in which both the ‘degree of belief’ of a proposition as well as the belief in its negation is justified. Jaynes (Reference Jaynes2003) and Van Horn (Reference Van Horn2003), among others, provide strong arguments in favour of R1.
For R2, we simply demand that if two propositions are equivalent, we can use them interchangeably, and that the plausibility of any proposition known to be a tautology should be assigned a value reflecting this knowledge. Condition (iii) in R2 is obvious, and in (iv), if we cannot say with certainty that the negation
 $\neg A$
of
 $A$
is true, there remains the fact that
 $A$
may be true and, then, cannot contradict assertion on
 $\neg A$
.
In R3 (negation), we demand that
 $A$
and
 $\neg A$
are opposite answers to the same question: if
 $A$
is known to be true, then
 $\neg A$
is false:
 $pl(A|X)$
and
 $pl(\neg A|X)$
cannot vary independently in two-dimensional Aristotelian logic.
In R4, the goal is to lay down rules that enable plausible reasoning to fall under a universal system of logic applicable to any problem domain in which meaningful propositions can be formulated, allowing the range of the set of allowed plausibilities to be dense in
 $(S(T),T)$
). Van Horn (Reference Van Horn2003) comments that Halpern (Reference Halpern1999b
) argues that R4 is problematic as it cannot be satisfied on finite domains, an assertion Van Horn discounts. We return to this point later.
Conjunction (the product rule of plausibilities).
We now come to the centrepiece of Cox’s theorem, the conjunction or product rule for propositions. Given consistent
 $X$
and the conjunction
 $A\wedge B=AB$
of two propositions conditioned on
 $X$
, what can be said about the relationship of
 $pl(A\wedge B|X)$
with the plausibilities
 $pl(A|B,X)$
and
 $pl(B|X)$
? A systematic list of arguments leads to the following.
R5.
Given
 $S(T)$
and a tautology
 $T$
, there exists a continuous function
 $F:[S(T),T]^{2}\rightarrow [S(T),T]$
, strictly increasing on
 $(S(T),T]$
, such that
 $$\begin{eqnarray}pl(A\wedge B|X)=F[pl(A|B,X),pl(B|X)]\end{eqnarray}$$
for any
 $A$
,
 $B$
and consistent
 $X$
.
The establishment of (3.3) follows some surprisingly intuitive arguments. We begin by writing down all the combinations of
 $A$
,
 $B$
and
 $X$
that
 $pl(A\wedge B|X)$
could be a function of (omitting ‘
 $pl$
’ temporarily, for simplicity), they are
 $(A|X)$
,
 $(B|X)$
,
 $(A|B,X)$
and
 $(B|A,X)$
and all combinations of these numbers, 15 in all. Because
 $A\wedge B=B\wedge A$
, only nine of these survive. Van Horn (Reference Van Horn2003), following Tribus (Reference Tribus2016), rules out as many of these as possible:
(1)
$(A\wedge B|X)=F[(A|X)]$
,(2)
$(A\wedge B|X)=F[(A|BX)]$
,(3)
$(A\wedge B|X)=F[(A|X),(A|BX)]$
,(4)
$(A\wedge B|X)=F[(A|BX),(B|AX)]$
,(5)
$(A\wedge B|X)=F[(A|X),(B|X)]$
.





Remarkably, all five of these candidates lead to a contradiction and can, therefore, be discarded. For example, in (1), if
 $A$
is a tautology (a fundamental truth) and
 $B$
is a ‘atomic’ proposition, then
 $A\wedge B$
is equivalent to
 $B$
and
 $(A|X)=T$
, so
 $S(T)=(B|X)$
. But
 $X$
can always be chosen to make
 $(B|X)$
any value in
 $Y_{\circ }$
. So we have a contradiction. Therefore (1) cannot hold. Similarly, in (3), for instance, if
 $A$
is a tautology and
 $B$
is any atomic proposition, then
 $S(T)=(B|X)$
, a contradiction. Similar arguments can be made for all these candidates leaving only four possibilities out of the original 15:
(I)
$(A\wedge B|X)=F[(A|BX),(B|X)]$
,(II)
$(A\wedge B|X)=F[(A|B,X),(B|X),(A|X)]$
,(III)
$(A\wedge B|X)=F[(A|B,X),(B|X),(B|A,X)]$
,(IV)
$(A\wedge B|X)=F[(A|B,X),(B|X),(B|A,X),(A|X)]$
.




Van Horn refers to the arguments of Tribus (Reference Tribus2016) who claims that (III) and (IV) can be ruled out because ‘one cannot avoid dealing with plausibility expressions that involve some inconsistent state of information
 $Y$
, and hence there is unavoidable ambiguity’ (Van Horn Reference Van Horn2003, p. 16). Also, rule (II) is eliminated for certain similar reasons, leaving only (I). But Van Horn asserts that ‘there is no completely compelling reason for choosing any particular one of the four remaining candidates’. He leans toward (I) as the other candidates merely add additional conditions to those used in (I) and because Jaynes (Reference Jaynes2003) provides an intuitive argument in support of (I).
Assuming (I) holds, next consider the plausibility
 $A\wedge B\wedge C|X$
),
 $X$
being consistent. Applying rule (I), with ‘
 $B$
’ now replaced by
 $(B\wedge C)$
, gives
 $$\begin{eqnarray}\displaystyle (A\wedge (B\wedge C)|X) & = & \displaystyle F[(A|(B\wedge C),X),((B\wedge C)|X)]\nonumber\\ \displaystyle & = & \displaystyle F[(A|B,C,X),F[(B|C),X),(C|X)]].\end{eqnarray}$$
Now use the equivalent grouping of the propositions on the left-hand side:
 $$\begin{eqnarray}\displaystyle ((A\wedge B)\wedge C|X) & = & \displaystyle F[((A\wedge B)|C,X),(C|X)]\nonumber\\ \displaystyle & = & \displaystyle F[F[(A|B,CX),(B|C,X)](C|X)].\end{eqnarray}$$
But
 $A\wedge (B\wedge C)=(A\wedge B)\wedge C$
, so the functions derived in (3.4) and (3.5) must coincide. Setting
 $$\begin{eqnarray}\displaystyle x & = & \displaystyle (A|B,C,X),\nonumber\\ \displaystyle y & = & \displaystyle (B|C,X),\quad \text{and}\nonumber\\ \displaystyle z & = & \displaystyle (C|X),\nonumber\end{eqnarray}$$
where
 $x,y,z\in [0,T]$
, we are looking for a function
 $F$
that for numbers
 $x,y,z$
is such that
 $$\begin{eqnarray}F(x,F(y,z))=F(F(x,y),z).\end{eqnarray}$$
Since
 $F$
is continuous and dense, this relation holds for all
 $x,y,z\in [0,T]$
. This property of denseness is fundamental to Cox’s theorem. The fact that ‘
 $\wedge$
’ is associative ensures that
 $F$
is associative, which limits choices for
 $F$
to be ‘isomorphic to multiplication’. A little inventory: if we can find any function
 $F$
satisfying (3.6), then, by rule (I), we will have determined how the ‘product’
 $A\wedge B$
, conditional on
 $X$
, depends on
 $(A|BX)$
and
 $(B|X)$
. Thus, we establish (3.3).
Equation (3.6) is called the associativity equation; it is an example of a functional equation. Such equations are studied in Aczel (Reference Aczel1966), where the following theorem can be found.
Theorem 3.1 (Aczel’s theorem).
Let
 $f:(a,b]^{2}\rightarrow (a,b]$
be a continuous, strictly increasing function in both arguments
 $a$
and
 $b$
, with
 $a,b\in \mathbb{R}$
and
 $a<b$
, and suppose that for all
 $x,y,z\in (a,b]$
,
 $$\begin{eqnarray}f(x,f(y,z))=f(f(x,y),z).\end{eqnarray}$$
Then there exist a continuous, strictly increasing function
 $g$
such that
 $$\begin{eqnarray}g(f(x,y))=g(x)+g(y)\end{eqnarray}$$
for all
 $x,y\in (a,b]$
.
Now set
 $f=F$
,
 $a=S(T)$
,
 $b=T$
and define a real-valued, continuous, increasing, and non-negative function
 $w=w(x)$
on
 $(S(T),T]$
such that
 $$\begin{eqnarray}\ln w(x)=g(x),\quad x\in [S(T),T].\end{eqnarray}$$
with
 $w(S(T))$
the limit as
 $x\rightarrow S(T)$
. We then must have by continuity
 $$\begin{eqnarray}w(F(x,y))=w(x)w(y),\end{eqnarray}$$
for
 $x,y\in [S(T),T]$
. Thus, for every
 $A,B\in {\mathcal{A}}$
and consistent
 $X$
, we have
 $$\begin{eqnarray}w((A\wedge B|X))=w((A|B,X))w((B|X)).\end{eqnarray}$$
The function
 $w$
thus suggests that conditional probabilities obey a ‘product rule’ similar to probabilities (e.g.
 $\mathbb{P}(A\cup B)=\mathbb{P}(A|B)\mathbb{P}(B)$
, now conditioned on information
 $X$
).
A final step for the product rule calls upon the fact that
 $$\begin{eqnarray}w(S(T))=0,\quad w(T)=1,\quad \text{and }~0<w(x)<1\quad \text{for }S(T)<x<T.\end{eqnarray}$$
A proof of this assertion is given in Van Horn (Reference Van Horn2003). Briefly, it involves the observation that for any proposition
 $A$
, consistent
 $X$
and tautology
 $D$
,
 $$\begin{eqnarray}w((A|X))=w((D\wedge A|X))=w((D|A,X))w((A|X))=w(T)w((A|X)),\end{eqnarray}$$
so dividing by
 $w((A|X))$
gives
 $w(T)=1$
and, therefore,
 $w(x)<1$
for
 $x<T$
. The proof that
 $w(S(T))=0$
follows from contradiction: assume otherwise and consider
 $A_{1},A_{2}\in {\mathcal{A}}$
and
 $x\in Y_{\circ }$
. If
 $w(S(T))=y>0$
, then
 $0<z<1$
and
 $z<\sqrt{z}<1$
,
 $w^{-1}(z)<x<w^{-1}(\sqrt{z})$
. If
 $(A_{1}|X)=(A_{1},A_{2}|X)=x$
, then
 $w((A_{1}\wedge A_{2}|X))=w^{2}(x)<z=w(S(T))$
, so
 $(A_{1}\wedge A_{2}|X)<S(T)$
, a contradiction.
So we can add to (3.7) the condition that the monotone continuous function satisfying (3.7) must also satisfy
 $$\begin{eqnarray}0\leq w(x)\leq 1,\end{eqnarray}$$
with
 $w(x)=0$
when
 $x$
is impossible and
 $w(x)=1$
when
 $x$
is certain.
Disjunction (the sum rule for plausibilities).
The aim of the sum or disjunction rule for plausibilities defined on pairs of propositions is to establish a relationship involving the plausibility of a proposition
 $A$
conditioned on consistent
 $X$
and its negation
 $\neg A$
conditioned on
 $X$
. Full details can be found in Van Horn (Reference Van Horn2003) and Paris (Reference Paris1994). It suffices here to point out that a thread of logic similar to that in the conjunction relations leads again to a functional equation of the form
 $$\begin{eqnarray}yS\biggl(\displaystyle \frac{x}{y}\biggr)=S(x)S(S(y)/S(x))\end{eqnarray}$$
for all
 $0<x\leq y<1$
, where
 $$\begin{eqnarray}\displaystyle yS\biggl(\displaystyle \frac{x}{y}\biggr) & = & \displaystyle p(\neg A\wedge B|X),\nonumber\\ \displaystyle S(y) & = & \displaystyle p((A\vee \neg B)\wedge (\neg A\vee \neg B)|X),\nonumber\\ \displaystyle S(x) & = & \displaystyle p(\neg A\vee \neg B|X),\nonumber\end{eqnarray}$$
 $p(x)=w(x)^{m}$
,
 $m=-\log (2)/\log w(\unicode[STIX]{x1D6FC})$
, and
 $\unicode[STIX]{x1D6FC}$
is a fixed point of a map such that
 $S(A|X)=(\neg A|X)$
for all
 $A$
and consistent
 $X$
. From these relations, it possible to show that
 $$\begin{eqnarray}w^{m}(\neg A|X)+w^{m}(A|X)=1,\end{eqnarray}$$
for positive
 $m$
. This is known as the sum rule. We note that the product rule (3.7) can be equally well be written as
 $$\begin{eqnarray}w^{m}((A\wedge B|X))=w^{m}((A|BX))w^{m}((B|X)),\end{eqnarray}$$
for positive
 $m$
. For whatever
 $m$
we choose, we can set
 $$\begin{eqnarray}pl(x)=w^{m}(x).\end{eqnarray}$$
Collecting all of the results laid down thus far, we arrive at the following version of Cox’s theorem.
Theorem 3.2 (Cox’s theorem via Van Horn).
Given that rules R1–R5 hold, there exists a continuous, strictly increasing function
 $pl:{\mathcal{A}}\times {\mathcal{A}}\backslash \mathbf{0}\rightarrow \mathbb{R}^{+}$
such that for every
 $A$
and
 $B\in {\mathcal{A}}$
and consistent
 $X$
:
(i)
$pl(A|X)=0$
if and only if
$A$
is known to be false, given the information
$X$
;(ii)
$pl(A|X)=1$
if and only if
$A$
is known to be true given the information
$X$
;(iii)
$0\leq pl(A|X)\leq 1$
;(iv)
$pl(A\wedge B|X)=pl(A|X)~pl(B|A,X)$
;(v)
$pl(\neg A|X)=1-pl(A|X)$
.





Because of the commutative property,
 $A\wedge B=B\wedge A$
, assertion (iv) in Cox’s theorem implies that
 $$\begin{eqnarray}pl(A|X)pl(B|AX)=pl(B|X)pl(A|BX),\end{eqnarray}$$
which is recognized as Bayes’ rule, provided we interpret the plausibilities as probabilities.
The five properties laid dawn in Cox’s theorem are formally the rules of probability theory, stated in terms of plausibilities. As pointed out by Van Horn (Reference Van Horn2003, pp. 21–22), ‘any system of plausible reasoning that is not isomorphic to probability theory must necessarily violate one of the requirements’ (in the theorem). So ‘set-theoretical probability theory then becomes the model theory for our logic’. We may thus interpret states of information to be probability distributions, with
 $AX$
understood to be ‘the probability distribution obtained from
 $X$
by conditioning the set of values for which
 $A$
is true’. Henceforth, we refer to the Cox–Jaynes plausibilities as probabilities in the spirit of those covered in the previous section.
Property (iv) sets the Cox–Jaynes theory apart, in a sense, from frequentist theory, featuring conditional probability and Bayes’ rule as a central property of the theory. The existence of the Kolmogorov set-theoretic framework of probability, which involves the same rules, proves that these rules are not contradictory, the primary difference being that in Cox theory, conditional probability is now the fundamental measure. In the Kolmogorov theory described earlier, all probabilities are conditioned on the choice of the sample set
 $\unicode[STIX]{x03A9}$
.
3.4 The Terenin–Draper account of Cox’s theorem and Cox–Jaynes probability
Terenin and Draper (Reference Terenin and Draper2015) provide a detailed account of the structure and different philosophical issues underlying major probability theories, particularly Kolmogorov’s set-theoretic theory based on the frequentist definition of probability and the Cox–Jaynes theory based on the notions of plausible reasoning. Some key aspects of their arguments are summarized in the following paragraphs.
(1)
In his book Probability Theory: The Logic of Science, Jaynes (Reference Jaynes2003, p. 43) insists that the framework of his theory is established for only finite sets of propositions (generally meaning it can be applied to statistical models with only a finite number of parameters), with ‘extension to infinite sets … permitted only when this is the result of a well-defined and well-behaved limiting process from a finite set’. Terenin and Draper show this position is ‘overly cautious’. The Van Horn proof also does not assume the sets of propositions are necessarily finite.
(2)
Terenin and Draper claim that Van Horn’s notion of state of information is defined at a non-rigorous level, making it hard to evaluate. They go on to ‘rigorize’ the statement and proof of Cox’s theorem.
(3)
They invoke Stone’s Representation Theorem (Stone Reference Stone1936, p. 8), which they interpret to establish that ‘every Cox–Jaynes propositional Boolean algebra
 $({\mathcal{A}},\wedge ,\vee ,\neg ,\mathbf{0},\mathbf{1})$
is isomorphic to a Kolmogorov set-theoretic space
 $({\mathcal{F}},\cap ,\cup ,\cdot ^{c},\emptyset ,\unicode[STIX]{x03A9})$
’.
(4)
They invoke the conditions of sequential continuity for non-empty (or true)
 $B$
:
(a) if
$A_{1}\subseteq A_{2}\subseteq A_{3}\subseteq \ldots$
such that
$A_{i}{\nearrow}A$
, then
$\mathbb{P}(A_{i}|B){\nearrow}\mathbb{A|B}$
,(b) if
$A_{1}\supseteq A_{2}\supseteq A_{3}\supseteq \ldots$
such that
$A_{i}{\searrow}A$
, then
$\mathbb{P}(A_{i}|B){\searrow}\mathbb{A|B}$
.






(5)
They provide a extension of the
 $\unicode[STIX]{x1D70E}$
-algebra to resolve the requirement of denseness in the range of the probability function
 $\mathbb{P}$
; specifically, for any subset
 $M$
of
 $\mathbb{R}$
, they define
 $S=[\min M,\max M]$
and
 $\unicode[STIX]{x03A9}_{E}$
(
 $=$
the extension of the sample set
 $\unicode[STIX]{x03A9}$
)
 $=\unicode[STIX]{x03A9}\times S$
, and
 ${\mathcal{F}}_{E}$
(
 $=$
the extension of the
 $\unicode[STIX]{x1D70E}$
-algebra
 ${\mathcal{F}}$
)
 $={\mathcal{F}}\otimes {\mathcal{B}}(S)$
,
 ${\mathcal{B}}(S)$
being the Borel
 $\unicode[STIX]{x1D70E}$
-algebra on
 $S$
. One can then define the extended probability function
 $\mathbb{P}_{E}:{\mathcal{F}}_{E}\times {\mathcal{F}}_{E}~\emptyset \rightarrow S$
that satisfies all of the axioms for probabilities (plausibility) including the product rule and the sum rule. They justify that this density property ‘defeats’ the counterexample of Halpern (Reference Halpern1999a
). Further details can be found in Terenin and Draper (Reference Terenin and Draper2015).
3.5 Summary comments
Among conclusions that can be drawn from the developments outlined in this section are the following.
∙ The Cox–Jaynes theory of logical probability, based on the notions of plausible reasoning and on plausibilities defined on propositional Boolean algebras, is a self-consistent theory, equivalent to the Kolmogorov theory, but structured in a framework in which conditional probability is the primitive concept. In this sense, there is no
${\mathcal{P}}$
uncertainty if this theory of probability is employed to deal with uncertainties.∙ The natural extension of Aristotelian logic with uncertainties is Bayesian (see Jaynes Reference Jaynes2003).

We are thus on solid ground to study the major components of predictive science – at least many of them – within a Bayesian framework.
4 Bayesian framework for statistical calibration and validation of parametric models
4.1 Bayes’ rule for parametric models
Recall that in Section 2.2 we considered the predictability of models defining a forward problem with a solution
 $u=u(\boldsymbol{\unicode[STIX]{x1D703}},S)$
depending on parameters
 $\boldsymbol{\unicode[STIX]{x1D703}}\in \unicode[STIX]{x0398}$
and set in a scenario
 $S$
for a problem
 ${\mathcal{A}}(\boldsymbol{\unicode[STIX]{x1D703}},S;u(\boldsymbol{\unicode[STIX]{x1D703}},\boldsymbol{S}))=0$
, and we considered the question of predictability of such models in the presence of uncertainty, addressing the principal sources of uncertainty described:
 ${\mathcal{P}}$
,
 ${\mathcal{M}}$
,
 ${\mathcal{Y}}$
,
 $\boldsymbol{\unicode[STIX]{x1D703}}$
and
 $h$
uncertainty. We will now explore these uncertainties in a Bayesian formalism.
As noted in Sections 3.3 and 3.4, we can dispense with
 ${\mathcal{P}}$
uncertainty immediately. We argued that within the framework of Cox–Jaynes probability theory (and equivalently, Kolmogorov theory), there is no
 ${\mathcal{P}}$
uncertainty, and every natural extension of Aristotelian logic in the presence of uncertainties is Bayesian Terenin and Draper (Reference Terenin and Draper2015). We will therefore employ tools and also concepts from the equivalent Kolmogorov theory when convenient. This leaves us with
 ${\mathcal{M}}$
,
 ${\mathcal{Y}}$
,
 $\boldsymbol{\unicode[STIX]{x1D703}}$
and
 $h$
uncertainties.
Terenin and Draper (Reference Terenin and Draper2015, p. 18) state that ‘All uncertainty in probabilistic models is therefore the result of model specification: either via the parameters (
 $\unicode[STIX]{x1D703}$
-uncertainty), or via the structure of the model itself (
 ${\mathcal{M}}$
-uncertainty).’ We add to this uncertainty in the data (
 ${\mathcal{Y}}$
uncertainty) and, since we are interested in computational models obtained through discretization of mathematical models,
 $h$
uncertainty as well.
This latter area,
 $h$
uncertainties, is in the realm of model verification and is either an issue of code verification, requiring such things as documentation, version control, benchmarks, etc., or solution verification, which is a matter of mathematically based a posteriori error estimation.
We will ignore
 $h$
uncertainty in this article as it is dealt with in detail in other accounts (e.g. Ainsworth and Oden Reference Ainsworth and Oden2000). That leaves us with
 ${\mathcal{M}}$
,
 ${\mathcal{Y}}$
and
 $\boldsymbol{\unicode[STIX]{x1D703}}$
uncertainties.
 ${\mathcal{M}}$
uncertainty is a deep and challenging subject involving the study of model selection, model inadequacy, and the complicated interaction of uncertainties in the model with those in data and parameters. We take up this important subject after first looking at
 ${\mathcal{Y}}$
and
 $\boldsymbol{\unicode[STIX]{x1D703}}$
uncertainty in Section 8. First, we address
 ${\mathcal{Y}}$
and
 $\boldsymbol{\unicode[STIX]{x1D703}}$
, beginning with their appearance in Bayes’ rule, where one finds naturally the push and pull of the two classical pillars of science: observation, with uncertain data
 $\boldsymbol{y}\in Y$
, and theory, represented by unvalidated models with uncertain parameters
 $\boldsymbol{\unicode[STIX]{x1D703}}\in \unicode[STIX]{x0398}$
.
Thus, from Bayes’ rule, we covert to probability densities
 $\unicode[STIX]{x1D70B}$
, and from the rule
 $\mathbb{P}(A|B)=\mathbb{P}(B|A)\mathbb{P}(A)/\mathbb{P}(B)$
, we let
 $B$
represent the observational data
 $\boldsymbol{y}$
for scenario
 $S$
and
 $A$
represent the model parameters
 $\boldsymbol{\unicode[STIX]{x1D703}}$
, leading to
 $$\begin{eqnarray}\unicode[STIX]{x1D70B}(\boldsymbol{\unicode[STIX]{x1D703}}|\boldsymbol{y},S)=\displaystyle \frac{\unicode[STIX]{x1D70B}(\boldsymbol{y}|\boldsymbol{\unicode[STIX]{x1D703}},S)\unicode[STIX]{x1D70B}(\boldsymbol{\unicode[STIX]{x1D703}}|S)}{\unicode[STIX]{x1D70B}(\boldsymbol{y}|S)},\end{eqnarray}$$
where
 $\unicode[STIX]{x1D70B}(\boldsymbol{\unicode[STIX]{x1D703}}|S)$
is the prior density of parameters
 $\boldsymbol{\unicode[STIX]{x1D703}}\in \unicode[STIX]{x0398}$
for scenario
 $S$
,
 $\unicode[STIX]{x1D70B}(\boldsymbol{y}|\boldsymbol{\unicode[STIX]{x1D703}},S)$
is the likelihood,
 $\unicode[STIX]{x1D70B}(\boldsymbol{\unicode[STIX]{x1D703}}|\boldsymbol{y},S)$
is the posterior density, and
 $\unicode[STIX]{x1D70B}(\boldsymbol{y}|S)$
is the evidence. Since
 $\int _{\unicode[STIX]{x0398}}\unicode[STIX]{x1D70B}(\boldsymbol{\unicode[STIX]{x1D703}}|\boldsymbol{y},S)\text{d}\boldsymbol{\unicode[STIX]{x1D703}}=1$
for all
 $\boldsymbol{y}$
in the space
 ${\mathcal{Y}}$
of observational data and for all scenarios
 $S$
(
 $S_{c}$
, the calibration scenarios;
 $S_{v}$
, the validation scenarios;
 $S_{p}$
, the prediction scenario), the evidence must be the marginalization of the numerator,
 $$\begin{eqnarray}\unicode[STIX]{x1D70B}(\boldsymbol{y}|S)=\int _{\unicode[STIX]{x0398}}\unicode[STIX]{x1D70B}(\boldsymbol{y}|\boldsymbol{\unicode[STIX]{x1D703}},S)\unicode[STIX]{x1D70B}(\boldsymbol{\unicode[STIX]{x1D703}}|S)\text{d}\boldsymbol{\unicode[STIX]{x1D703}}.\end{eqnarray}$$
Here
 $\boldsymbol{y}=(\boldsymbol{y}_{1},\boldsymbol{y}_{2},\ldots ,\boldsymbol{y}_{n})\in {\mathcal{Y}}_{s}\subset \mathbb{R}^{n}$
, and it is understood that (4.2) holds for every scenario
 $S$
, the data
 $\boldsymbol{y}$
being different in each.
4.2 Data uncertainty: experimental noise
Bayes’ rule (4.1) embraces all of the pillars of science drawn upon to acquire (or increase) one’s knowledge: observations, characterized by observational data
 $\boldsymbol{y}\in {\mathcal{Y}}$
, theory, the mathematical modelling of hypotheses founded on inductive logic, put forth to explain observed events, and computations, needed to evaluate the resulting distributions. To the classical statistician, models are represented by the likelihood
 $\unicode[STIX]{x1D70B}(\boldsymbol{y}|\boldsymbol{\unicode[STIX]{x1D703}},S)$
,
 $\boldsymbol{\unicode[STIX]{x1D703}}$
representing specific features of the model and
 $\unicode[STIX]{x1D70B}(\boldsymbol{y}|\boldsymbol{\unicode[STIX]{x1D703}},S)$
the probability distribution for data given
 $\boldsymbol{\unicode[STIX]{x1D703}}$
, for any scenario
 $S$
; the outcome,
 $\unicode[STIX]{x1D70B}(\boldsymbol{\unicode[STIX]{x1D703}}|\boldsymbol{y},S)$
, is the result of the information in the data and the predictability of the model. To the scientist or engineer, this statistical model is reached after a process of using the solution of the forward problem to evaluate the observations available to the models. These predictions of
 $\boldsymbol{y}$
of the models are quantities
 $\boldsymbol{d}(\boldsymbol{\unicode[STIX]{x1D703}},S)$
which rarely coincide with the recorded observations
 $\boldsymbol{y}$
.
Let us consider the problem of using model (4.1) for a given scenario
 $S$
to predict the value of some physical entity. The target prediction could be, for example, the temperature at a point in a turbine engine, the volume fraction of cancer cells in a sample of human tissue, the maximum von Mises stress in a machine part, or the time-to-failure of a steel shaft in an aircraft engine. Such quantities are rarely deterministic. A fundamental assumption in classical mathematical statistics is that the physical entity we wish to predict with model (4.1) in any particular scenario
 $S$
is determined by a stochastic law (the ‘true’ structure of the entity) characterized by a probability distribution
 $\boldsymbol{G}$
with density
 $\boldsymbol{g}$
. The structure of
 $\boldsymbol{g}$
(or
 $\boldsymbol{G}$
) is available to us only through samples taken from a set of experiments, the experimental observations
 $\boldsymbol{y}$
, which are generally corrupted by experimental noise
 $\boldsymbol{\unicode[STIX]{x1D716}}$
(or experimental errors), since no measuring device is perfect. The observations
 $\boldsymbol{y}$
are realizations of a random variable
 $Y$
.
But the observational data we record is not the truth; rather it is some function
 $\boldsymbol{f}$
of the true density
 $\boldsymbol{g}$
and of unknown experimental errors
 $\boldsymbol{\unicode[STIX]{x1D716}}$
, often called the experimental noise:
 $$\begin{eqnarray}\boldsymbol{y}=\boldsymbol{f}(\boldsymbol{g},\boldsymbol{\unicode[STIX]{x1D716}})\end{eqnarray}$$
(or the so-called stochastic extension
 $Y=f(\boldsymbol{G},E)$
). To go further, we must assume (or construct) an appropriate form of
 $\boldsymbol{f}$
and propose a probability distribution
 $p_{noise}(\boldsymbol{\unicode[STIX]{x1D716}})$
for
 $\boldsymbol{\unicode[STIX]{x1D716}}$
. These constitute a noise model. The construction of an appropriate noise model for observational data is often a challenging endeavour requiring detailed information on the measurement processes and instrumentation. This may often mean we must construct a new parametric model of
 $\boldsymbol{g}$
, knowing very little about the ‘truth’. But there are approaches, some discussed later in this article, of constructing approximations of
 $\boldsymbol{g}$
that may improve in accuracy as new data are acquired. These approximations involve new parameters, not the parameters
 $\boldsymbol{\unicode[STIX]{x1D703}}$
of the model of the forward problem – sometimes called hyperparameters. Methods for estimating these parameters and enhancing our approximation of
 $\boldsymbol{g}$
are discussed later (e.g. Section 5.3).
In the majority of statistics applications, the most common noise model is the additive model
 $$\begin{eqnarray}\boldsymbol{g}+\boldsymbol{\unicode[STIX]{x1D716}}=\boldsymbol{y},\end{eqnarray}$$
showing an additive correction to the truth is what is observed; the noise distribution
 $p_{noise}(\boldsymbol{\unicode[STIX]{x1D716}})$
is often assumed to be Gaussian. The extra parameters in the definition of
 $p_{noise}(\cdot )$
may be added to the model parameters to produce the total parameter vector
 $\boldsymbol{\unicode[STIX]{x1D703}}$
. If we have
 $n$
samples of
 $\boldsymbol{g}$
, (4.4) is replaced by
 $$\begin{eqnarray}\boldsymbol{g}_{i}+\boldsymbol{\unicode[STIX]{x1D716}}_{i}=\boldsymbol{y}_{i},\quad 1\leq i\geq n.\end{eqnarray}$$
4.3 Model inadequacy
The experimental noise in general is a result of the methods and devices used to gather observational data and is independent of the model and of model parameters. Now let us consider how well the model predicts realities of various scenarios.
Having solved the forward problem for scenario
 $S$
, use the solution
 $u(\boldsymbol{\unicode[STIX]{x1D703}},S)$
to compute the model predictions of reality
 $\boldsymbol{g}_{i}$
for parameter
 $\boldsymbol{\unicode[STIX]{x1D703}}$
. We denote such predictions by a parameter-to-observation map
 $B:U\rightarrow {\mathcal{Y}}$
such that
 $B_{i}(u(\boldsymbol{\unicode[STIX]{x1D703}},S))=d_{i}(\boldsymbol{\unicode[STIX]{x1D703}},S)$
. Since the model is imperfect, a modelling error
 $\unicode[STIX]{x1D6FE}_{i}(\boldsymbol{\unicode[STIX]{x1D703}},S)$
occurs, assumed for simplicity to be additive:
 $$\begin{eqnarray}\boldsymbol{g}_{i}=\boldsymbol{d}_{i}(\boldsymbol{\unicode[STIX]{x1D703}},S)+\unicode[STIX]{x1D738}_{i}(\boldsymbol{\unicode[STIX]{x1D703}},S),\quad 1\leq i\geq n.\end{eqnarray}$$
where
 $\unicode[STIX]{x1D738}_{i}(\boldsymbol{\unicode[STIX]{x1D703}},S)$
is defined as the model inadequacy, or model form error, or model bias (AIAA 1998, ASME 2006, Oberkampf and Roy Reference Oberkampf and Roy2010, Oden et al.
Reference Oden, Babuška, Faghihi, Stein, de Borst and Hughes2018, Kennedy and O’Hagan Reference Kennedy and O’Hagan2001). This can be regarded as a component of model inadequacy, to be complemented by an assumed probability distribution
 $p_{model}(\boldsymbol{\unicode[STIX]{x1D703}},S)$
for
 $\unicode[STIX]{x1D738}_{i}(\boldsymbol{\unicode[STIX]{x1D703}},S)$
(see e.g. Bayarri et al. Reference Bayarri, Berger, Paulo, Sacks, Cafeo, Cavendish, Liu and Tu2007, Jeffreys Reference Jeffreys1998, Kennedy and O’Hagan Reference Kennedy and O’Hagan2001).
Substituting (4.5) into (4.6) and rearranging terms gives
 $$\begin{eqnarray}\boldsymbol{\unicode[STIX]{x1D716}}_{i}+\unicode[STIX]{x1D738}_{i}(\boldsymbol{\unicode[STIX]{x1D703}},S)=\boldsymbol{y}_{i}-\boldsymbol{d}_{i}(\boldsymbol{\unicode[STIX]{x1D703}},S),\quad 1\leq i\geq n,\quad \boldsymbol{y}_{i}\in {\mathcal{Y}}_{s},\quad \boldsymbol{\unicode[STIX]{x1D703}}\in \unicode[STIX]{x0398}.\end{eqnarray}$$
Thus, reality disappears from the equation! One can never compute the reality
 $\boldsymbol{g}_{i}$
. The closest we can arrive at the truth
 $\boldsymbol{g}_{i}$
is through imperfect observational data and through imperfect model predictions, as indicated in Figure 2.1 discussed earlier.
Given a noise model, such as (4.5), with a noise probability density
 $p_{noise}(\cdot )$
, and given a model inadequacy model such as (4.6) with density
 $p_{model}(\cdot )$
, one can conceive of a combined model
 $p_{com}\sim p_{noise+model}$
. Then, given (4.7), the probability that the data
 $\boldsymbol{y}_{i}$
are observed for given
 $\boldsymbol{\unicode[STIX]{x1D703}}$
is the likelihood probability density
 $$\begin{eqnarray}\displaystyle \unicode[STIX]{x1D70B}(\boldsymbol{y}_{i}|\boldsymbol{\unicode[STIX]{x1D703}},S)=p_{com}(\boldsymbol{y}_{i}-\boldsymbol{d}_{i}(\boldsymbol{\unicode[STIX]{x1D703}},S)),\quad \text{for }1\leq i\leq n. & & \displaystyle\end{eqnarray}$$
Until recently, in the great majority of statistical applications, model inadequacy was ignored:
 $p_{com}(\cdot )=p_{noise}(\cdot )$
, and
 $p_{noise}(\cdot )$
was assumed to be Gaussian.
4.4 Frequentist and Fisherian approaches
Statistics can be regarded as the study and interpretation of data in accordance with probability theory, and general approaches to statistical analysis in a broad sense, depend on the particular probability theory used. Two general approaches have emerged in this regard: (i) the frequentist approach, based primarily on the Kolmogorov theory of probability, and (ii) the Bayesian approach. There are several variants of these under each category.
To the frequentist, the probability of an event is considered to be one of an infinite number of possible repetitions of the same experiment, each producing independent results. The underlying model parameters remain constant during the repeatable experiments. In this setting, it makes sense to seek the parameters that best describe the statistics of the problem. This idea led to the fundamental frequentist approach, also referred to as the Fisherian approach in honour of statistician R. A. Fisher (Reference Fisher1922), or as the maximum likelihood approach, in which the parameters maximize the likelihood probability for fixed data, to best characterize the true (reality) distribution.
According to Fisher (Reference Fisher1922, p. 310), ‘The likelihood that any parameter … should have any assigned value … is proportional to the probability that if this were so, the totality of observations should be that observed.’ So if
 $\boldsymbol{\unicode[STIX]{x1D703}}$
is assigned a value, the probability that data
 $\boldsymbol{y}$
are observed is the conditional density (likelihood)
 $\unicode[STIX]{x1D70B}(\boldsymbol{y}|\boldsymbol{\unicode[STIX]{x1D703}},S)$
.
In the case of independent and identically distributed (i.i.d.) samples of observational data
 $\boldsymbol{y}_{i}$
, the joint distribution is
 $\prod _{i=1}^{n}\unicode[STIX]{x1D70B}(\boldsymbol{y}_{i}|\boldsymbol{\unicode[STIX]{x1D703}})$
and is viewed as a function of
 $\boldsymbol{\unicode[STIX]{x1D703}}$
only, which is the likelihood function. For ease in computation, one is often concerned with the log-likelihood
 $$\begin{eqnarray}\displaystyle \log \unicode[STIX]{x1D70B}(\boldsymbol{y}|\boldsymbol{\unicode[STIX]{x1D703}})=\mathop{\sum }_{i=1}^{n}\log \unicode[STIX]{x1D70B}(\boldsymbol{y}_{i}|\boldsymbol{\unicode[STIX]{x1D703}}), & & \displaystyle\end{eqnarray}$$
with the latter holding for independent samples and for each relevant scenario
 $S$
.
A common theme in classical statistics, particularly frequentist statistics, is that the ‘true’ distribution is contained in the probability distributions
 $p_{noise}(\boldsymbol{\unicode[STIX]{x1D716}})$
and
 $p_{model}(\boldsymbol{\unicode[STIX]{x1D703}},S)$
accessible by the parametric model that defines the prediction
 $\boldsymbol{d}(\boldsymbol{\unicode[STIX]{x1D703}},S)$
. This is equivalent to assuming that there exists a (magic) parameter
 $\boldsymbol{\unicode[STIX]{x1D703}}^{\ast }$
such that
 $\unicode[STIX]{x1D738}(\boldsymbol{\unicode[STIX]{x1D703}}^{\ast },S)=0,~1\leq i\leq n$
; that is, the exact prediction can be derived by the model. Such models are said to be ‘correct’ or ‘well-specified’; otherwise, they are misspecified. It is no surprise that most models are indeed misspecified: no parameters exist that produce the truth. As we point out in Oden et al. (Reference Oden, Babuška, Faghihi, Stein, de Borst and Hughes2018), ‘Many fundamental questions arise about such misspecified model such as how close they can approximate the truth and if, while inadequate and misspecified, are they still sufficiently accurate to be used to make important predictions.’ The famous statement of George E. P. Box (Box and Draper Reference Box and Draper1987, Box Reference Box1979) alluded to in Section 2.2 under model uncertainty – ‘Essentially, all models are wrong, but some are useful’ – comes to mind. The mission of model validation processes is to find such useful models given adequate observational data.
As noted earlier, the goal of the Fisherian approach is to find the parameter
 $\hat{\boldsymbol{\unicode[STIX]{x1D703}}}\in \unicode[STIX]{x0398}$
that maximizes the likelihood of a model. The maximum likelihood estimator, or MLE, is defined by
 $$\begin{eqnarray}\hat{\boldsymbol{\unicode[STIX]{x1D703}}}(\boldsymbol{y})=\underset{\boldsymbol{\unicode[STIX]{x1D703}}\in \unicode[STIX]{x0398}}{\operatorname{argmax}}\;[\log \unicode[STIX]{x1D70B}(\boldsymbol{y}|\boldsymbol{\unicode[STIX]{x1D703}})],\quad \boldsymbol{y}\in {\mathcal{Y}}.\end{eqnarray}$$
Under specific conditions on the smoothness of the likelihood function, sequences of MLEs obtained with increasing data samples
 $\boldsymbol{y}_{i}$
converge (in distribution) to a normal distribution with a covariance matrix equal to the inverse of the Fisher information matrix,
 $\boldsymbol{I}_{1}(\boldsymbol{\unicode[STIX]{x1D703}})$
,
 $$\begin{eqnarray}\displaystyle \boldsymbol{I}_{1}(\boldsymbol{\unicode[STIX]{x1D703}}) & = & \displaystyle \int _{{\mathcal{Y}}}\unicode[STIX]{x1D70B}(\boldsymbol{y}|\boldsymbol{\unicode[STIX]{x1D703}})\displaystyle \frac{\unicode[STIX]{x2202}\log \unicode[STIX]{x1D70B}(\boldsymbol{y}|\boldsymbol{\unicode[STIX]{x1D703}})}{\unicode[STIX]{x2202}\boldsymbol{\unicode[STIX]{x1D703}}}\displaystyle \frac{\unicode[STIX]{x2202}\log \unicode[STIX]{x1D70B}(\boldsymbol{y}|\boldsymbol{\unicode[STIX]{x1D703}})^{T}}{\unicode[STIX]{x2202}\boldsymbol{\unicode[STIX]{x1D703}}}\text{d}\boldsymbol{y}\nonumber\\ \displaystyle & = & \displaystyle \operatorname{Var}\mathbb{E}_{\boldsymbol{\unicode[STIX]{x1D703}}}\biggl[\displaystyle \frac{\unicode[STIX]{x2202}\log \unicode[STIX]{x1D70B}(\boldsymbol{y}|\boldsymbol{\unicode[STIX]{x1D703}})}{\unicode[STIX]{x2202}\boldsymbol{\unicode[STIX]{x1D703}}}\biggr]\nonumber\\ \displaystyle & = & \displaystyle -\mathbb{E}_{\boldsymbol{\unicode[STIX]{x1D703}}}\biggl[\displaystyle \frac{\unicode[STIX]{x2202}^{2}\log \unicode[STIX]{x1D70B}(\boldsymbol{y}|\boldsymbol{\unicode[STIX]{x1D703}})}{\unicode[STIX]{x2202}\boldsymbol{\unicode[STIX]{x1D703}}\unicode[STIX]{x2202}\boldsymbol{\unicode[STIX]{x1D703}}^{T}}\biggr],\end{eqnarray}$$
where
 $\operatorname{Var}(\cdot )$
is the variance and
 $\mathbb{E}_{\boldsymbol{\unicode[STIX]{x1D703}}}$
is the expected value with respect to
 $\unicode[STIX]{x1D70B}(\boldsymbol{y}|\boldsymbol{\unicode[STIX]{x1D703}})$
. This is conventionally written as
 $$\begin{eqnarray}\displaystyle \frac{1}{\sqrt{n}}(\hat{\boldsymbol{\unicode[STIX]{x1D703}}}^{n}-\boldsymbol{\unicode[STIX]{x1D703}})\rightarrow d\sim {\mathcal{N}}(\mathbf{0},\boldsymbol{I}_{1}^{-1}(\boldsymbol{\unicode[STIX]{x1D703}})),\end{eqnarray}$$
where
 $\hat{\boldsymbol{\unicode[STIX]{x1D703}}}^{n}$
is the MLE for
 $n$
i.i.d. observations. We write
 $\hat{\boldsymbol{\unicode[STIX]{x1D703}}}^{n}\rightarrow \hat{\boldsymbol{\unicode[STIX]{x1D703}}}$
, and
 ${\mathcal{N}}(\unicode[STIX]{x1D707},\unicode[STIX]{x03A3})$
denotes the normal distribution with mean
 $\unicode[STIX]{x1D707}$
and inverse of the covariance matrix
 $\unicode[STIX]{x03A3}$
.
Also of interest is the parameter
 $\boldsymbol{\unicode[STIX]{x1D703}}^{\ast }$
weighted by the truth
 $\boldsymbol{g}$
as the expected value, defined by
 $$\begin{eqnarray}\boldsymbol{\unicode[STIX]{x1D703}}^{\ast }(\boldsymbol{y})=\underset{\boldsymbol{\unicode[STIX]{x1D703}}\in \unicode[STIX]{x0398}}{\operatorname{argmax}}\;\mathbb{E}_{\boldsymbol{ g}}[\log \unicode[STIX]{x1D70B}(\boldsymbol{y}|\boldsymbol{\unicode[STIX]{x1D703}})].\end{eqnarray}$$
This is the parameter that for fixed data
 $\boldsymbol{y}$
maximizes the expected value with respect to the true distribution
 $\boldsymbol{g}$
of the log-likelihood. It has a special significance when viewed in a relative entropy setting. In particular, the Kullback–Leibler divergence between two probability distributions with densities
 $p$
and
 $q$
is defined by
 $$\begin{eqnarray}D_{KL}(p\Vert q)=\int p(\boldsymbol{x})\log \displaystyle \frac{p(\boldsymbol{x})}{q(\boldsymbol{x})}\text{d}\boldsymbol{x}.\end{eqnarray}$$
The
 $D_{KL}(\cdot \Vert \cdot )$
defines the relative entropy between the two distributions, as
 $$\begin{eqnarray}D_{KL}(p\Vert q)=-H(p)+H(p,q),\end{eqnarray}$$
where
 $H(p)$
is the Shannon information entropy (modulo a reference density
 $m(\boldsymbol{x})$
to be discussed in Section 6.3)
 $$\begin{eqnarray}H(p)=-\int p(\boldsymbol{x})\log p(\boldsymbol{x})\text{d}\boldsymbol{x},\end{eqnarray}$$
and
 $H(p,q)$
is the cross-entropy
 $$\begin{eqnarray}H(p,q)=-\int p(\boldsymbol{x})\log q(\boldsymbol{x})\text{d}\boldsymbol{x}.\end{eqnarray}$$
Suppose
 $\boldsymbol{g}$
is the ‘true’ distribution. Then,
 $D_{KL}(\boldsymbol{g}\Vert \unicode[STIX]{x1D70B}(\cdot ,\boldsymbol{\unicode[STIX]{x1D703}}))$
is a measure of the information lost by assuming the likelihood
 $\unicode[STIX]{x1D70B}(\cdot |\boldsymbol{\unicode[STIX]{x1D703}})$
is the truth. Returning to (4.13), we see that
 $$\begin{eqnarray}\displaystyle \boldsymbol{\unicode[STIX]{x1D703}}^{\ast } & = & \displaystyle \underset{\boldsymbol{\unicode[STIX]{x1D703}}\in \unicode[STIX]{x0398}}{\operatorname{argmax}}\;\mathbb{E}_{\boldsymbol{g}}[\log \unicode[STIX]{x1D70B}(\boldsymbol{y},\boldsymbol{\unicode[STIX]{x1D703}})]\nonumber\\ \displaystyle & = & \displaystyle \underset{\boldsymbol{\unicode[STIX]{x1D703}}\in \unicode[STIX]{x0398}}{\operatorname{argmin}}\;H(\boldsymbol{g},\unicode[STIX]{x1D70B}(\boldsymbol{y},\boldsymbol{\unicode[STIX]{x1D703}}))\nonumber\\ \displaystyle & = & \displaystyle \underset{\boldsymbol{\unicode[STIX]{x1D703}}\in \unicode[STIX]{x0398}}{\operatorname{argmin}}\;D_{KL}(\boldsymbol{g}\Vert \unicode[STIX]{x1D70B}(\boldsymbol{y},\boldsymbol{\unicode[STIX]{x1D703}})).\end{eqnarray}$$
If there does not exist a parameter
 $\boldsymbol{\unicode[STIX]{x1D703}}$
such that
 $\boldsymbol{g}(\boldsymbol{y})=\unicode[STIX]{x1D70B}(\boldsymbol{y}|\boldsymbol{\unicode[STIX]{x1D703}})$
, then the model is misspecified and the choice of
 $\boldsymbol{\unicode[STIX]{x1D703}}$
producing a likelihood closest to the truth is
 $\boldsymbol{\unicode[STIX]{x1D703}}=\boldsymbol{\unicode[STIX]{x1D703}}^{\ast }$
, with
 $\boldsymbol{\unicode[STIX]{x1D703}}^{\ast }$
given by (4.18), that is, the parameters defining the closest
 $D_{KL}$
‘distance’ from the model
 $\unicode[STIX]{x1D70B}(\boldsymbol{y}|\boldsymbol{\unicode[STIX]{x1D703}})$
to the truth
 $\boldsymbol{g}$
.
A basic question often considered is the asymptotic behaviour of the MLE parameters
 $\hat{\boldsymbol{\unicode[STIX]{x1D703}}}(\boldsymbol{y})=\hat{\boldsymbol{\unicode[STIX]{x1D703}}}^{n}$
given by (4.11) when
 $\boldsymbol{y}\in \mathbb{R}^{n}$
and
 $n\rightarrow \infty$
. Under special conditions on the likelihood functions, it can be shown (see Kleijn and van der Vaart Reference Kleijn, van der Vaart, Mikosch and Janžura2002, Reference Kleijn and van der Vaart2012) that the
 $\hat{\boldsymbol{\unicode[STIX]{x1D703}}}^{n}$
converge to
 $\hat{\boldsymbol{\unicode[STIX]{x1D703}}}$
in the sense of distributions and
 $n^{-1/2}(\hat{\boldsymbol{\unicode[STIX]{x1D703}}}^{n}-\hat{\boldsymbol{\unicode[STIX]{x1D703}}})\rightarrow {\mathcal{N}}(0,V(\boldsymbol{\unicode[STIX]{x1D703}}^{\ast }))$
, where
 $V$
is called the sandwich matrix (Kleijn and van der Vaart Reference Kleijn, van der Vaart, Mikosch and Janžura2002, Geyer Reference Geyer2003, Kleijn and van der Vaart Reference Kleijn and van der Vaart2012) depending on the
 $L_{n}(\boldsymbol{\unicode[STIX]{x1D703}})$
and, approximately,
 $V(\hat{\boldsymbol{\unicode[STIX]{x1D703}}})=V(\boldsymbol{\unicode[STIX]{x1D703}}^{\ast })$
. For the well-behaved well-specified model,
 $V(\hat{\boldsymbol{\unicode[STIX]{x1D703}}})=I_{1}^{-1}(\hat{\boldsymbol{\unicode[STIX]{x1D703}}})$
, with
 $I_{1}(\boldsymbol{\unicode[STIX]{x1D703}})$
given by (4.11).
PART 2: Principles of Bayesian model calibration and validation
5 The prediction pyramid: Bayesian statistical calibration and validation parametric models
The basic steps in implementing Bayesian inference of model parameters are clear. Beginning with a recognition of prior knowledge of the probability distribution of model parameters (the prior), developing the probability of observational data for given model parameters (the likelihood), we compute (by sampling methods) the parameter distribution to upgrade our knowledge of the key parameters of the system. We then use the best information at hand, the upgraded parameters, to solve the forward problem (e.g. (2.1)), and we then use the solution
 $u(\boldsymbol{\unicode[STIX]{x1D703}},S)$
to compute the quantities of interest – the prediction desired features of a physical reality. The central problem of predictive modelling is to determine the validity of a given model as a means for predicting an event, defined by one or more quantities of interest, given certain (possibly noisy) observational data and incomplete prior information on model parameters. If a model is deemed invalid according to some criterion for acceptability, it must be discarded or modified to better fit validation data. Model selection and adaptivity are taken up in Part 3.
5.1 Rules and principles of model validation
The following rules and principles are put in play to produce a model validation process.
(1) Quantities of interest.
A fundamental (but often ignored) principle is that it is necessary to specify precisely the intended purpose of the model prediction by specifying clearly the targeted outputs, that is, the quantities of interest (QoIs). A mathematical model may be acceptable as a means for predicting one QoI but not another. A model is very rarely useful in predicting all features of the behaviour of a physical system, but may be acceptable for predicting specific features. The target prediction will generally be a probability distribution delivered by the forward solution of a stochastic model, and it will be an event in the often complex scenario
 $S_{p}$
, the prediction scenario.
The prediction scenario will only rarely pertain to observable events (a fact often misunderstood), since (i) once observed, it is no longer a prediction but is validation data, and (ii)
 $S_{p}$
may involve predictions of systems that do not yet exist, as is the case in the design of engineered systems.
(2) The prediction pyramid.
Symbolically, the hierarchy of scenarios and observational data can be represented in a ‘prediction pyramid’ in which the peak represents the full prediction scenario
 $S_{p}$
, and the QoI is predicted (Figure 5.1). The ‘pyramid’ is actually a tetrahedron with a base and three faces, representing modelling scenarios,
 $S_{c},S_{v},S_{p}$
, the corresponding data,
 $\boldsymbol{y}_{c},\boldsymbol{y}_{v}$
, and out-of-data predictions, the QoI, and the unseen and inaccessible face representing reality. The beginning lower levels of experimental observation define calibration scenario
 $S_{c}$
and calibration data
 $\boldsymbol{y}_{c}$
, and then, moving toward the peak, the validation scenario
 $S_{v}$
and validation data
 $\boldsymbol{y}_{v}$
appear.
The prediction ‘pyramid’. A symbolic representation of the hierarchy of scenarios and observational data, beginning with unit calibration scenario
 $S_{c}$
delivering data
 $\boldsymbol{y}_{c}$
, then validation scenario
 $S_{v}$
with data
 $\boldsymbol{y}_{v}$
, and finally the full prediction scenario
 $S_{p}$
with the target QoI. The ‘pyramid’ is actually a tetrahedron with the hidden face representing the never-seen reality we attempt to predict.

The notion of a sequence of observations and model parameter calibrations of increasing complexity, moving toward those with properties expected to indicate the model’s ability to predict QoIs, is a richer and more focused version of what is called cross-validation in statistics, in which ‘training points’ are identified at which initial data are retrieved to fit parameters, and then data at points outside the training set are sampled to update parameters.
(3) Calibration.
The ‘tuning’ of model parameters so that the model predictions agree with experimental data on simple component tests is the purpose of the calibration process and is performed in scenario
 $S_{c}$
. In Oden et al. (Reference Oden, Babuška, Faghihi, Stein, de Borst and Hughes2018), we recommend subscribing to the philosophy of E. T. Jaynes (Reference Jaynes2003, p. 86), who said ‘The essence of “honesty” or “objectivity” demands that we take into account all the evidence we have, not just some arbitrarily chosen subset of it.’ The implementation of this philosophy, which we call ‘Jaynes’ principle’ is a challenge in designing appropriate calibration scenarios.
(4) Validation.
Model validation is defined as the process of estimating the accuracy with which a model can predict QoIs based on the accuracy with which it predicts actual experimental observations. These observations produce validation data
 $\boldsymbol{y}_{v}$
accessed in validation experiments performed in validation scenarios
 $S_{v}$
. The major challenge in model validation is to design validation experiments that depict the influence of the QoIs on subsystems or surrogates of the full prediction scenario
 $S_{p}$
. The word ‘accuracy’ here is of fundamental importance: one must choose a validation metric to measure the error in model predictions and experimental observations in
 $S_{v}$
, and one must specify a tolerance that this measure of modelling error must meet if the model prediction is deemed sufficiently close to the experimental data. This is clearly a subjective process and depends on the choices of the models and on choices of the modeller. If the error tolerances are met, it is customary to declare that the model is ‘valid’, but technically one can only say that with this metric and with this tolerance, the model is ‘not invalid’, since additional information could always falsify a model. It is clear that the design of the validation experiments that adequately inform the model of the QoIs, the selection of a validation metric, and the selection of error tolerances are fundamentally important aspects of any validation process.
In summary, we follow these principles and rules.
(1)
Identify QoIs,
 $Q$
, in the full model scenario
 $S_{p}$
and construct a parametric model
 ${\mathcal{M}}\sim A(\boldsymbol{\unicode[STIX]{x1D703}},S_{p};u(\boldsymbol{\unicode[STIX]{x1D703}},S_{p}))=0$
of a forward problem on
 $S_{p}$
with the goal of computing measure of distributions or densities
 $\unicode[STIX]{x1D70B}(Q)$
and evaluating in some sense their uncertainty content (see Section 7). Of course, the density
 $\unicode[STIX]{x1D70B}(Q)$
representing our approximation of the QoI must technically be conditional on many things: the model
 ${\mathcal{M}}$
, the data, the parameter
 $\boldsymbol{\unicode[STIX]{x1D703}}$
used in the prediction scenario, etc.:
 $$\begin{eqnarray}QoI\sim \unicode[STIX]{x1D70B}(Q|{\mathcal{M}},\boldsymbol{\unicode[STIX]{x1D703}},S_{p},S_{v},\boldsymbol{y}_{c},\ldots ).\end{eqnarray}$$
(2)
Construct calibration scenarios
 $S_{c}$
to calculate initial probability density functions for model parameters. This involves choosing a prior
 $\unicode[STIX]{x1D70B}(\boldsymbol{\unicode[STIX]{x1D703}})$
for calibration scenario
 $S_{c}$
.
(3)
Collect calibration data
 $\boldsymbol{y}_{c}$
and update (or ‘initialize’) the parameters through Bayesian inversion:
 $$\begin{eqnarray}\unicode[STIX]{x1D70B}(\boldsymbol{\unicode[STIX]{x1D703}}|\boldsymbol{y}_{c},S_{c})=\displaystyle \frac{\unicode[STIX]{x1D70B}(\boldsymbol{y}_{c}|\boldsymbol{\unicode[STIX]{x1D703}},S_{c})\unicode[STIX]{x1D70B}(\boldsymbol{\unicode[STIX]{x1D703}})}{\unicode[STIX]{x1D70B}(\boldsymbol{y}_{c}|S_{c})}.\end{eqnarray}$$
(4)
Construct validation scenarios
 $S_{v}$
, collect validation data
 $\boldsymbol{y}_{v}$
, and use the calibration posterior as a prior for the validation update:
 $$\begin{eqnarray}\unicode[STIX]{x1D70B}(\boldsymbol{\unicode[STIX]{x1D703}}|\boldsymbol{y}_{v},\boldsymbol{y}_{c},S_{v},S_{c})=\displaystyle \frac{\unicode[STIX]{x1D70B}(\boldsymbol{y}_{v}|\boldsymbol{\unicode[STIX]{x1D703}},\boldsymbol{y}_{c},S_{c},S_{v})\unicode[STIX]{x1D70B}(\boldsymbol{\unicode[STIX]{x1D703}}|\boldsymbol{y}_{c},S_{c})}{\unicode[STIX]{x1D70B}(\boldsymbol{y}_{v}|\boldsymbol{y}_{c},S_{v})}.\end{eqnarray}$$
(5)
Use the parameters determined in the validation update (5.3) to solve the validation forward problem:
 $$\begin{eqnarray}A(\boldsymbol{\unicode[STIX]{x1D703}},S_{v};u(\boldsymbol{\unicode[STIX]{x1D703}},S_{v}))=0.\end{eqnarray}$$
(6)
Compute the prediction
 $\boldsymbol{d}(\boldsymbol{\unicode[STIX]{x1D703}},S_{v})$
of
 $\boldsymbol{y}_{v}$
delivered by the solution
 $u(\boldsymbol{\unicode[STIX]{x1D703}},S_{v})$
and determine the accuracy with which the model predicts the validation observable using an appropriate metric
 $d(\cdot ,\cdot )$
. Given a tolerance
 $\unicode[STIX]{x1D6FE}_{tol}$
, if
 $$\begin{eqnarray}d(\boldsymbol{d}(\boldsymbol{\unicode[STIX]{x1D703}},S_{v}),\boldsymbol{y}_{v})\leq \unicode[STIX]{x1D6FE}_{tol},\end{eqnarray}$$
the model is deemed acceptable (not invalid).
(7)
Using the parameter
 $\boldsymbol{\unicode[STIX]{x1D703}}$
in the validation model, solve the forward problem
 $A(\boldsymbol{\unicode[STIX]{x1D703}},S_{p};u(\boldsymbol{\unicode[STIX]{x1D703}},S_{p}))=0$
on
 $S_{p}$
and use the solution
 $u(\boldsymbol{\unicode[STIX]{x1D703}},S_{p})$
to compute the QoI and the probability density
 $\unicode[STIX]{x1D70B}(Q)$
of (5.1). We may also quantify the uncertainty in the prediction
 $\unicode[STIX]{x1D70B}(Q)$
by computing the mean and variances or higher moments of
 $\unicode[STIX]{x1D70B}(Q)$
or measures of uncertainty content such as its information entropy,
 $$\begin{eqnarray}H(\unicode[STIX]{x1D70B}(Q))=-\int \unicode[STIX]{x1D70B}(Q(\boldsymbol{\unicode[STIX]{x1D703}}))\log \unicode[STIX]{x1D70B}(Q(\boldsymbol{\unicode[STIX]{x1D703}}))\text{d}\boldsymbol{\unicode[STIX]{x1D703}}.\end{eqnarray}$$
5.2 Example: optimization and the MAP
A standard example that permits a comparison of certain aspects of the frequentist and Bayesian approaches involves the case in which the likelihood is given by
 $$\begin{eqnarray}\unicode[STIX]{x1D70B}(\boldsymbol{y}_{s}|\boldsymbol{\unicode[STIX]{x1D703}},S)\propto \exp \biggl\{-\displaystyle \frac{1}{2}\Vert \boldsymbol{y}_{s}-\boldsymbol{d}(\boldsymbol{\unicode[STIX]{x1D703}},S)\Vert _{\boldsymbol{\unicode[STIX]{x03A3}}}^{2}\biggr\},\end{eqnarray}$$
where
 $\Vert \cdot \Vert _{\boldsymbol{\unicode[STIX]{x03A3}}}^{2}=(\cdot )^{T}\boldsymbol{\unicode[STIX]{x03A3}}^{-1}(\cdot )$
,
 $\boldsymbol{\unicode[STIX]{x03A3}}=[\unicode[STIX]{x03A3}_{ij}]$
being the
 $n\times n$
covariance matrix. In some cases,
 $\boldsymbol{\unicode[STIX]{x03A3}}$
is simply
 $\unicode[STIX]{x1D70E}^{2}\boldsymbol{I}$
(
 $\unicode[STIX]{x03A3}_{ij}=\unicode[STIX]{x1D70E}^{2}\unicode[STIX]{x1D6FF}_{ij}$
),
 $\unicode[STIX]{x1D70E}^{2}$
being the variance, which can be added to
 $\boldsymbol{\unicode[STIX]{x1D703}}$
as an additional parameter. If
 $\boldsymbol{d}(\boldsymbol{\unicode[STIX]{x1D703}},S)$
is linear in
 $\boldsymbol{\unicode[STIX]{x1D703}}$
, the likelihood in (5.6) is Gaussian; otherwise, it is non-Gaussian.
Let
 $\boldsymbol{d}(\boldsymbol{\unicode[STIX]{x1D703}},S)$
be linear:
 $\boldsymbol{d}(\boldsymbol{\unicode[STIX]{x1D703}},S)=\boldsymbol{G}\boldsymbol{\unicode[STIX]{x1D703}}$
,
 $\boldsymbol{G}$
being a
 $p\times p$
matrix. Then the MLE is
 $$\begin{eqnarray}\boldsymbol{\unicode[STIX]{x1D703}}^{\ast }=(\boldsymbol{G}^{T}\unicode[STIX]{x1D70E}^{-1}\boldsymbol{G})^{-1}\boldsymbol{G}^{T}\unicode[STIX]{x1D70E}^{-1}\boldsymbol{y}.\end{eqnarray}$$
If the prior
 $\unicode[STIX]{x1D70B}(\boldsymbol{\unicode[STIX]{x1D703}})$
is also Gaussian, the posterior becomes
 $$\begin{eqnarray}\unicode[STIX]{x1D70B}(\boldsymbol{\unicode[STIX]{x1D703}}|\boldsymbol{y},S)\propto \exp \biggl\{-\displaystyle \frac{1}{2}{\mathcal{S}}(\boldsymbol{\unicode[STIX]{x1D703}})\biggr\},\end{eqnarray}$$
where
 ${\mathcal{S}}(\boldsymbol{\unicode[STIX]{x1D703}})$
is the misfit function,
 $$\begin{eqnarray}{\mathcal{S}}(\boldsymbol{\unicode[STIX]{x1D703}})=\Vert \boldsymbol{y}_{i}-\boldsymbol{d}_{i}(\boldsymbol{\unicode[STIX]{x1D703}},S)\Vert _{\boldsymbol{\unicode[STIX]{x03A3}}}^{2}+\Vert \boldsymbol{\unicode[STIX]{x1D703}}-\boldsymbol{\unicode[STIX]{x1D703}}_{0}\Vert _{\boldsymbol{\unicode[STIX]{x03A3}}_{prior}}^{2},\end{eqnarray}$$
 $\boldsymbol{\unicode[STIX]{x03A3}}_{prior}$
being the covariance matrix of the prior density, and
 $$\begin{eqnarray}\Vert \boldsymbol{\unicode[STIX]{x1D703}}-\boldsymbol{\unicode[STIX]{x1D703}}_{0}\Vert _{\boldsymbol{\unicode[STIX]{x03A3}}_{prior}}^{2}=(\boldsymbol{\unicode[STIX]{x1D703}}-\boldsymbol{\unicode[STIX]{x1D703}}_{0})^{T}\boldsymbol{\unicode[STIX]{x03A3}}_{prior}^{-1}(\boldsymbol{\unicode[STIX]{x1D703}}-\boldsymbol{\unicode[STIX]{x1D703}}_{0}),\end{eqnarray}$$
 $\boldsymbol{\unicode[STIX]{x1D703}}_{0}$
being a reference parameter vector. The prior is seen to provide a Tikhonov-type regularization of the misfit
 ${\mathcal{S}}(\boldsymbol{\unicode[STIX]{x1D703}})$
. The vector
 $$\begin{eqnarray}\boldsymbol{\unicode[STIX]{x1D703}}^{\ast \ast }=\underset{\unicode[STIX]{x0398}}{\operatorname{argmax}}\;\unicode[STIX]{x1D70B}(\boldsymbol{\unicode[STIX]{x1D703}}|\boldsymbol{y},S)\end{eqnarray}$$
is called the maximum a posteriori estimate (MAP) for scenario
 $S$
. We note that for uniform priors, MAP = MLE. We finally have
 $$\begin{eqnarray}\displaystyle \unicode[STIX]{x1D70B}(\boldsymbol{\unicode[STIX]{x1D703}}^{\ast \ast }|\boldsymbol{y},S) & = & \displaystyle \unicode[STIX]{x1D70B}_{posterior}(\boldsymbol{\unicode[STIX]{x1D703}}^{\ast \ast }|\boldsymbol{y},S)\nonumber\\ \displaystyle & = & \displaystyle {\mathcal{N}}(\boldsymbol{\unicode[STIX]{x1D703}}^{\ast \ast }|\boldsymbol{\unicode[STIX]{x1D6E4}}_{post}^{-1}),\end{eqnarray}$$
where
 $$\begin{eqnarray}\boldsymbol{\unicode[STIX]{x1D6E4}}_{post}=(\boldsymbol{G}^{T}\boldsymbol{\unicode[STIX]{x03A3}}^{-1}\boldsymbol{G}+\boldsymbol{\unicode[STIX]{x03A3}}_{prior}^{-1})^{-1}.\end{eqnarray}$$
5.3 Gaussian processes: tools to build models of noise and model inadequacies
At some steps in the processes of formulating the Bayesian inference problem we encountered the need to contemplate new parametric models, outside of models relevant to the principal forward problem, to approximate such entities as experimental noise or model inadequacy. The idea of Gaussian processes provides a popular and often powerful approach for constructing such models if sufficient data are available. In this section we present a brief introduction to this subject. A detailed account can be found in the popular monograph of Rasmussen and Williams (Reference Rasmussen and Williams2006).
5.3.1 Stochastic or random process
A stochastic or random process is a collection of random variables
 $X=\{X(t);t\in I\}$
defined on an underlying probability space
 $(\unicode[STIX]{x03A9},{\mathcal{F}},\mathbb{P})$
,
 $I$
being an index set and the values of
 $X$
lying in some ‘state space’
 $Y$
. In general, one selects a finite number
 $n$
of trial or training points
 $\{\boldsymbol{x}_{1},\boldsymbol{x}_{2},\ldots ,\boldsymbol{x}_{n}\}\in I^{n}$
and the process generates a probability distribution
 $$\begin{eqnarray}\{X(\boldsymbol{x}_{1}),X(\boldsymbol{x}_{2}),\ldots ,X(\boldsymbol{x}_{n})\},\end{eqnarray}$$
for which we compute probabilities
 $\mathbb{P}[X(\boldsymbol{x}_{1}),X(\boldsymbol{x}_{2}),\ldots ,X(\boldsymbol{x}_{n})]$
. Thus, a stochastic process can be characterized by a function
 $f(X)$
of a random variable
 $X$
and, for any set of sample or trial points
 $\{\boldsymbol{x}_{i}\}_{i=1}^{n}$
, a corresponding set of probabilities
 $$\begin{eqnarray}\{\mathbb{P}(X(\boldsymbol{x}_{1})),\mathbb{P}(X(\boldsymbol{x}_{2})),\ldots ,\mathbb{P}(X(\boldsymbol{x}_{n}))\}.\end{eqnarray}$$
5.3.2 Gaussian processes
A Gaussian process (GP) is a random process in which any finite number of random variables have a joint probability distribution that is Gaussian.
So here we think of a real Gaussian process as being defined by random variables represented by the value of a function
 $\boldsymbol{f}(\boldsymbol{x})$
at the location of a point
 $\boldsymbol{x}$
(e.g.
 $\boldsymbol{x}\in \mathbb{R}^{m}$
, or
 $\boldsymbol{x}=t$
, a particular time value). Since every Gaussian distribution is completely specified by its mean and covariance, a Gaussian process
 $\boldsymbol{f}(\boldsymbol{x})$
is defined by its mean function
 $\boldsymbol{m}(\boldsymbol{x})$
and its covariance function
 $\boldsymbol{k}(\boldsymbol{x},\boldsymbol{x}^{\prime })$
:
 $$\begin{eqnarray}\displaystyle \boldsymbol{m}(x) & = & \displaystyle \mathbb{E}[\boldsymbol{f}(\boldsymbol{x})],\nonumber\\ \displaystyle \boldsymbol{k}(\boldsymbol{x},\boldsymbol{x}^{\prime }) & = & \displaystyle \mathbb{E}[(\boldsymbol{f}(\boldsymbol{x})-\boldsymbol{m}(\boldsymbol{x}))(\boldsymbol{f}(\boldsymbol{x}^{\prime })-\boldsymbol{m}(\boldsymbol{x}^{\prime }))^{T}].\end{eqnarray}$$
It is customary to use the following notation for such a process Rasmussen and Williams (Reference Rasmussen and Williams2006):
 $$\begin{eqnarray}\boldsymbol{f}(\boldsymbol{x})\sim GP(\boldsymbol{m}(\boldsymbol{x}),\boldsymbol{k}(\boldsymbol{x},\boldsymbol{x}^{\prime })).\end{eqnarray}$$
The great utility of Gaussian processes resides in their so-called marginalization property: since all distributions at any sample point are, by definition, Gaussian, any enlargement of sample points taking the process outside the initial sample must also be Gaussian, and any such larger sample will not change the distribution of the smaller sample set. This subtle property, also called the consistency property, becomes clear in the basic Gaussian extension described below.
5.3.3 The consistency or marginalization property of GPs
The fundamental consistency or marginalization property of GPs is embodied in the following theorem.
Theorem 5.1 (Rasmussen and Williams Reference Rasmussen and Williams2006).
Let
 $\boldsymbol{y}_{1}$
and
 $\boldsymbol{y}_{2}$
be two random variables with joint Gaussian probability distribution
 $$\begin{eqnarray}(\boldsymbol{y}_{1},\boldsymbol{ y}_{2})\sim {\mathcal{N}}\left(\left[\begin{array}{@{}c@{}}\boldsymbol{a}\\ \boldsymbol{ b}\end{array}\right],\left[\begin{array}{@{}cc@{}}\boldsymbol{A} & \boldsymbol{B}\\ \boldsymbol{B}^{T} & \boldsymbol{C}\end{array}\right]\right).\end{eqnarray}$$
Then
 $$\begin{eqnarray}\boldsymbol{y}_{1}\sim {\mathcal{N}}(\boldsymbol{a},\boldsymbol{A})\end{eqnarray}$$
and
 $$\begin{eqnarray}(\boldsymbol{y}_{1}|\boldsymbol{y}_{2})\sim {\mathcal{N}}(\boldsymbol{a}-\boldsymbol{B}\boldsymbol{C}^{-1}(\boldsymbol{y}_{2}-\boldsymbol{b}),\boldsymbol{A}-\boldsymbol{B}\boldsymbol{C}^{-1}\boldsymbol{B}^{T}).\end{eqnarray}$$
Proof. It is understood that
 $\boldsymbol{y}_{1}$
is associated with a density
 $\unicode[STIX]{x1D70B}(\boldsymbol{y}_{1})$
equal to the marginalization
 $\int \unicode[STIX]{x1D70B}(\boldsymbol{y}_{1},\boldsymbol{y}_{2})\text{d}\boldsymbol{y}_{2}$
. The conditional probability (5.17) follows the evaluation of
 $$\begin{eqnarray}\unicode[STIX]{x1D70B}(\boldsymbol{y}_{1}|\boldsymbol{y}_{2})=\displaystyle \frac{\unicode[STIX]{x1D70B}(\boldsymbol{y}_{1},\boldsymbol{y}_{2})}{\unicode[STIX]{x1D70B}(\boldsymbol{y}_{2})}\end{eqnarray}$$
being Gaussian, making use of the Gaussian distribution equation: if
 $\boldsymbol{f}=\{f_{1},f_{2},\ldots ,f_{n}\}^{T}$
, and
 $\boldsymbol{f}\sim {\mathcal{N}}(\boldsymbol{m},\boldsymbol{\unicode[STIX]{x03A3}})$
, then
 $$\begin{eqnarray}\unicode[STIX]{x1D70B}(\boldsymbol{f})=(2\unicode[STIX]{x1D70B})^{-n/2}|\boldsymbol{\unicode[STIX]{x03A3}}|^{-1/2}\exp \biggl\{-\displaystyle \frac{1}{2}(\boldsymbol{f}-\boldsymbol{m})^{T}\boldsymbol{\unicode[STIX]{x03A3}}^{-1}(\boldsymbol{f}-\boldsymbol{m})\biggr\}.\end{eqnarray}$$
◻
The joint density is
 $$\begin{eqnarray}\unicode[STIX]{x1D70B}(\boldsymbol{y}_{1},\boldsymbol{y}_{2})=\displaystyle \frac{1}{\sqrt{2\unicode[STIX]{x1D70B}|\boldsymbol{\unicode[STIX]{x03A3}}|}}\exp \biggl(-\displaystyle \frac{1}{2}\unicode[STIX]{x0393}(y_{1},y_{2})\biggr),\end{eqnarray}$$
where
 $$\begin{eqnarray}\displaystyle \unicode[STIX]{x0393}(y_{1},y_{2}) & = & \displaystyle \{(y_{1}-a)^{T}(y_{2}-b)^{T}\}\left[\begin{array}{@{}cc@{}}\boldsymbol{A} & \boldsymbol{B}\\ \boldsymbol{B}^{T} & \boldsymbol{C}\end{array}\right]^{-1}\left[\begin{array}{@{}c@{}}y_{1}-a\\ y_{2}-b\end{array}\right]\nonumber\\ \displaystyle & = & \displaystyle (y_{1}-a)^{T}\boldsymbol{A}^{\prime }(y_{1}-a)+2(y_{1}-a)^{T}\boldsymbol{B}^{\prime }(y_{2}-b)\nonumber\\ \displaystyle & & \displaystyle +\,(y_{2}-b)^{T}\boldsymbol{C}^{\prime }(y_{2}-b)\nonumber\end{eqnarray}$$
and
 $$\begin{eqnarray}\displaystyle \boldsymbol{A}^{\prime } & = & \displaystyle (\boldsymbol{A}-\boldsymbol{B}\boldsymbol{C}^{-1}\boldsymbol{B}^{T})^{-1},\nonumber\\ \displaystyle \boldsymbol{B}^{\prime } & = & \displaystyle -\boldsymbol{A}^{-1}\boldsymbol{B}(\boldsymbol{C}-\boldsymbol{B}^{T}\boldsymbol{A}^{-1}\boldsymbol{B})^{-1}=\overset{{\sim}}{\boldsymbol{B}}^{T},\nonumber\\ \displaystyle \boldsymbol{C}^{\prime } & = & \displaystyle (\boldsymbol{C}-\boldsymbol{B}^{T}\boldsymbol{A}^{-1}\boldsymbol{B})^{-1}.\nonumber\end{eqnarray}$$
Thus, with some algebra, one has
 $$\begin{eqnarray}\displaystyle \unicode[STIX]{x0393}(y_{1},y_{2})={\mathcal{N}}(b,\boldsymbol{C}){\mathcal{N}}(\unicode[STIX]{x1D707},\boldsymbol{\unicode[STIX]{x03A3}}^{\prime }), & & \displaystyle \nonumber\end{eqnarray}$$
where
 $$\begin{eqnarray}\displaystyle \unicode[STIX]{x1D707} & = & \displaystyle a-\boldsymbol{B}\boldsymbol{C}^{-1}(y_{2}-b),\nonumber\\ \displaystyle \boldsymbol{\unicode[STIX]{x03A3}}^{\prime } & = & \displaystyle \boldsymbol{A}-\boldsymbol{B}\boldsymbol{C}^{-1}\boldsymbol{B}^{T}.\nonumber\end{eqnarray}$$
Then
 $$\begin{eqnarray}\displaystyle \unicode[STIX]{x1D70B}(y_{1}|y_{2}) & = & \displaystyle \unicode[STIX]{x1D70B}(y_{1},y_{2})/\unicode[STIX]{x1D70B}(y_{2})\nonumber\\ \displaystyle & = & \displaystyle {\mathcal{N}}(b,\boldsymbol{C}){\mathcal{N}}(\unicode[STIX]{x1D707},\boldsymbol{\unicode[STIX]{x03A3}}^{\prime })/{\mathcal{N}}(b,\boldsymbol{C})\nonumber\\ \displaystyle & = & \displaystyle {\mathcal{N}}(\unicode[STIX]{x1D707},\boldsymbol{\unicode[STIX]{x03A3}}^{\prime })\nonumber\\ \displaystyle & = & \displaystyle {\mathcal{N}}(a-\boldsymbol{B}\boldsymbol{C}^{-1}(y_{2}-b),\boldsymbol{A}-\boldsymbol{B}\boldsymbol{C}^{-1}\boldsymbol{B}^{T}),\nonumber\end{eqnarray}$$
which was asserted. ◻
5.3.4 The Gaussian process response surface
We use the GP framework to construct response surfaces. The idea is as follows. Let
 $\boldsymbol{Y}(\boldsymbol{x})$
denote a random field for which realizations
 $$\begin{eqnarray}\{\boldsymbol{y}(x_{1}),\boldsymbol{y}(x_{2}),\ldots ,\boldsymbol{y}(x_{m})\}\end{eqnarray}$$
are given, and let
 $\{\boldsymbol{x}_{1},\boldsymbol{x}_{2},\ldots ,\boldsymbol{x}_{m}\}$
be training points (
 $\boldsymbol{x}_{i}\in {\mathcal{R}}^{n}$
) (or ‘input points’ or ‘control points’). Then the training set is
 $$\begin{eqnarray}{\mathcal{D}}=\{(\boldsymbol{x}_{i},\boldsymbol{y}(\boldsymbol{x}_{i}),i=1,2,\ldots ,m\}.\end{eqnarray}$$
We represent
 $\boldsymbol{y}$
by a GP
 $$\begin{eqnarray}\boldsymbol{y}\sim GP(\boldsymbol{\unicode[STIX]{x1D713}}^{T}(\boldsymbol{x})\boldsymbol{\unicode[STIX]{x1D6FD}},\boldsymbol{\unicode[STIX]{x03A3}}),\end{eqnarray}$$
where
 $$\begin{eqnarray}\boldsymbol{\unicode[STIX]{x1D713}}^{T}(\boldsymbol{x})\boldsymbol{\unicode[STIX]{x1D6FD}}=\mathop{\sum }_{i=1}^{q}\boldsymbol{\unicode[STIX]{x1D713}}_{i}(\boldsymbol{x})\unicode[STIX]{x1D6FD}_{i}=\boldsymbol{m}(\boldsymbol{x})=\text{the mean function}\end{eqnarray}$$
(also called the ‘trend’),
 $\unicode[STIX]{x1D713}_{i}(\boldsymbol{x})$
are appropriate basis functions,
 $\boldsymbol{\unicode[STIX]{x1D6FD}}$
is a vector of coefficients, and
 $\boldsymbol{\unicode[STIX]{x03A3}}$
is the covariance matrix, which is any symmetric, positive semidefinite matrix. Commonly, we take
 $$\begin{eqnarray}\displaystyle \unicode[STIX]{x03A3}_{ij} & = & \displaystyle k(x_{i},x_{j})\nonumber\\ \displaystyle & = & \displaystyle \unicode[STIX]{x1D706}_{0}\exp \biggl\{-\displaystyle \frac{1}{2}\mathop{\sum }_{k=1}^{d}\displaystyle \frac{(x_{i}^{k}-x_{j}^{k})^{2}}{l_{k}}\biggr\}+\unicode[STIX]{x1D706}_{1}+\unicode[STIX]{x1D706}_{2}\unicode[STIX]{x1D6FF}_{ij}.\end{eqnarray}$$
Here
 $\unicode[STIX]{x1D706}_{0}$
,
 $l_{k}$
,
 $\unicode[STIX]{x1D706}_{1}$
and
 $\unicode[STIX]{x1D706}_{2}$
are parameters, with
∙
$\unicode[STIX]{x1D706}_{0}=$
a measure of precision of variance (an amplitude of a covariance envelope),∙
$l_{k}=$
characterization of flatness of covariance,∙
$\unicode[STIX]{x1D706}_{1}=$
a bias ‘latent value’, and∙
$\unicode[STIX]{x1D706}_{2}=$
a regularization.


By adjusting values of the parameters, we can conceivably manipulate the shape and flatness of the covariance between sample points in
 ${\mathcal{D}}$
.
Given the GP (5.21), the predicted output
 $\boldsymbol{y}^{\ast }=\boldsymbol{y}(\boldsymbol{x}^{\ast })$
at a point outside the training set
 ${\mathcal{D}}$
,
 $(\boldsymbol{x}^{\ast },\boldsymbol{y}^{\ast })\notin {\mathcal{D}}$
, is, according to (5.17),
 $$\begin{eqnarray}(\boldsymbol{y}^{\ast }|\boldsymbol{y})=GP(\mathbb{E}((\boldsymbol{y}^{\ast }|\boldsymbol{y})),\boldsymbol{\unicode[STIX]{x03A3}}^{\ast }),\end{eqnarray}$$
where
 $$\begin{eqnarray}\displaystyle \mathbb{E}(\boldsymbol{y}^{\ast }|\boldsymbol{y}) & = & \displaystyle \boldsymbol{\unicode[STIX]{x1D713}}^{T}(\boldsymbol{x})\boldsymbol{\unicode[STIX]{x1D6FD}}-\boldsymbol{k}(\boldsymbol{x}^{\ast },\boldsymbol{x})\boldsymbol{K}^{-1}(\boldsymbol{y}-\boldsymbol{m}),\nonumber\\ \displaystyle \boldsymbol{\unicode[STIX]{x03A3}}^{\ast } & = & \displaystyle \boldsymbol{k}(\boldsymbol{x}^{\ast },\boldsymbol{x}^{\ast })-\boldsymbol{k}(\boldsymbol{x}^{\ast },\boldsymbol{x})\boldsymbol{K}^{-1}\boldsymbol{k}(\boldsymbol{x},\boldsymbol{x}^{\ast }),\end{eqnarray}$$
and
 $$\begin{eqnarray}\boldsymbol{K}=\boldsymbol{k}(\boldsymbol{x},\boldsymbol{x}).\end{eqnarray}$$
Clearly,
 $\boldsymbol{m}(\boldsymbol{x})=\boldsymbol{\unicode[STIX]{x1D713}}^{T}(\boldsymbol{x})\boldsymbol{\unicode[STIX]{x1D6FD}}$
. The new parameters
 $\unicode[STIX]{x1D714}$
defining the GP are called hyperparameters, for example,
 $$\begin{eqnarray}\unicode[STIX]{x1D74E}=(\boldsymbol{\unicode[STIX]{x1D6FD}},\unicode[STIX]{x1D706}_{0},\{l_{k}\}_{k=1}^{d},\unicode[STIX]{x1D706}_{1},\unicode[STIX]{x1D706}_{2}).\end{eqnarray}$$
Figure 5.2 shows a conceptualization of a GP representation over a one-dimensional input set. On the left, we see a collection of prior probability density functions. The use of five input or training points anchor the output function
 $\boldsymbol{y}(\boldsymbol{x})$
at points
 $\boldsymbol{y}(\boldsymbol{x}_{i})$
on the mean curve,
 $\boldsymbol{m}(\boldsymbol{x})$
, as shown. The shape of the covariance between these points is fashioned by adjusting the covariance parameters. The factorization rule can be used to update function values
 $$\begin{eqnarray}\unicode[STIX]{x1D70B}(\boldsymbol{y}(\boldsymbol{x}_{1}),\boldsymbol{y}(\boldsymbol{x}_{2}),\ldots ,\boldsymbol{y}(\boldsymbol{x}_{m}))=\mathop{\prod }_{i}^{m}\unicode[STIX]{x1D70B}(\boldsymbol{y}(\boldsymbol{x}_{1}))\unicode[STIX]{x1D70B}(\boldsymbol{y}(\boldsymbol{x}_{2})),\ldots ,\unicode[STIX]{x1D70B}(\boldsymbol{y}(\boldsymbol{x}_{m})).\end{eqnarray}$$
Illustration of a dataset fit by a GP with noise-free data point: (a) three functions drawn at random from a GP prior, and (b) three functions drawn from the posterior, the shaded area representing twice the standard deviation. This illustration is a ‘pictorial introduction to Bayesian modelling’ inspired by a similar figure in Rasmussen and Williams (Reference Rasmussen and Williams2006, p. 3).

5.3.5 Model inadequacy and validation using Gaussian processes
We close this section with an example of the use of GPs to represent model inadequacy and also to take account of experimental noise, following Bayarri et al. (Reference Bayarri, Berger, Paulo, Sacks, Cafeo, Cavendish, Liu and Tu2007).
Let
 $\boldsymbol{g}(\boldsymbol{x})$
denote the truth or reality of a physical entity at point
 $\boldsymbol{x}\in \mathbb{R}^{n}$
(denoted
 $\boldsymbol{g}$
earlier), and let
 $\boldsymbol{d}(\boldsymbol{x},\boldsymbol{\unicode[STIX]{x1D703}})$
denote the model prediction of this field at
 $\boldsymbol{x}$
(denoted
 $d(\boldsymbol{\unicode[STIX]{x1D703}})$
earlier). Then the model inadequacy
 $\unicode[STIX]{x1D738}$
(
 $=\unicode[STIX]{x1D6FE}_{i}(\boldsymbol{\unicode[STIX]{x1D703}},S)$
is
 $$\begin{eqnarray}\unicode[STIX]{x1D738}(\boldsymbol{\unicode[STIX]{x1D703}},\boldsymbol{x})=\boldsymbol{g}(\boldsymbol{x})-\boldsymbol{d}(\boldsymbol{x},\boldsymbol{\unicode[STIX]{x1D703}}).\end{eqnarray}$$
Here
 $\boldsymbol{\unicode[STIX]{x1D703}}$
is the parameter vector of the forward prediction problem. Let
 $\boldsymbol{g}(\boldsymbol{x}_{i})$
denote the ‘field data’ at
 $\boldsymbol{x}_{i}$
in a set of test points
 $\{\boldsymbol{x}_{1},\boldsymbol{x}_{2},\ldots ,\boldsymbol{x}_{m}\}$
(denoted
 $\boldsymbol{y}_{i}$
earlier). Thus, for a additive model,
 $$\begin{eqnarray}\boldsymbol{g}(\boldsymbol{x}_{i})=\boldsymbol{g}(\boldsymbol{x}_{i})+\unicode[STIX]{x1D716}_{i},\end{eqnarray}$$
where
 $\unicode[STIX]{x1D716}_{i}$
is experimental noise. To complete the noise model, we assume
 $\unicode[STIX]{x1D716}_{i}$
is i.i.d. and
 $$\begin{eqnarray}\unicode[STIX]{x1D716}_{i}\sim {\mathcal{N}}(0,1/\unicode[STIX]{x1D706}).\end{eqnarray}$$
Thus
 $$\begin{eqnarray}\boldsymbol{g}(\boldsymbol{x}_{i})-\boldsymbol{d}(\boldsymbol{x}_{i},\boldsymbol{\unicode[STIX]{x1D703}})=\unicode[STIX]{x1D6FE}(\boldsymbol{\unicode[STIX]{x1D703}},\boldsymbol{x}_{i})+\unicode[STIX]{x1D716}_{i}.\end{eqnarray}$$
We next introduce priors for the key probability density functions:
 $$\begin{eqnarray}\unicode[STIX]{x1D70B}(\boldsymbol{\unicode[STIX]{x1D703}}),\quad \unicode[STIX]{x1D70B}(\unicode[STIX]{x1D706})\quad \text{and}\quad \unicode[STIX]{x1D70B}(\unicode[STIX]{x1D6FE})\sim GP(\boldsymbol{\unicode[STIX]{x1D713}}^{T}(\boldsymbol{x})\boldsymbol{\unicode[STIX]{x1D6FD}},\boldsymbol{\unicode[STIX]{x03A3}}_{\unicode[STIX]{x1D6FE}}),\end{eqnarray}$$
with hyperparameters
 $\unicode[STIX]{x1D74E}_{j}=(\unicode[STIX]{x1D6FD}_{\unicode[STIX]{x1D6FE}},\unicode[STIX]{x1D706}_{0}^{\unicode[STIX]{x1D6FE}},\{l_{k}^{\unicode[STIX]{x1D6FE}}\}_{k=1}^{d_{\unicode[STIX]{x1D6FE}}},\unicode[STIX]{x1D706}_{1}^{\unicode[STIX]{x1D6FE}},\unicode[STIX]{x1D706}_{2}^{\unicode[STIX]{x1D6FE}})$
. The posterior update is
 $$\begin{eqnarray}\unicode[STIX]{x1D70B}(\boldsymbol{\unicode[STIX]{x1D703}},\unicode[STIX]{x1D706},\unicode[STIX]{x1D6FE}|\boldsymbol{y})\propto \boldsymbol{f}(\boldsymbol{y}^{F}|\boldsymbol{\unicode[STIX]{x1D703}},\unicode[STIX]{x1D706},\unicode[STIX]{x1D6FE})\unicode[STIX]{x1D70B}(\unicode[STIX]{x1D703},\unicode[STIX]{x1D706},\unicode[STIX]{x1D6FE}),\end{eqnarray}$$
with
 $\boldsymbol{f}$
being a multivariate normal distribution. The model output is
 $$\begin{eqnarray}\boldsymbol{d}\sim GP(\boldsymbol{\unicode[STIX]{x1D713}}^{T}(\boldsymbol{x})\boldsymbol{\unicode[STIX]{x1D6FD}},\boldsymbol{\unicode[STIX]{x03A3}}_{\unicode[STIX]{x1D6FE}}).\end{eqnarray}$$
5.3.6 Computing the hyperparameters
One popular method to estimate the hyperparameters
 $\unicode[STIX]{x1D74E}$
is to use the MLE
 $$\begin{eqnarray}\unicode[STIX]{x1D74E}_{MLE}=\underset{\unicode[STIX]{x1D74E}}{\operatorname{argmax}}\unicode[STIX]{x1D70B}(\boldsymbol{y}|\boldsymbol{x},\unicode[STIX]{x1D74E}),\end{eqnarray}$$
where
 $$\begin{eqnarray}\unicode[STIX]{x1D70B}(\boldsymbol{y}|\boldsymbol{x},\unicode[STIX]{x1D74E})\propto \mathop{\prod }_{k}\exp \biggl\{-\displaystyle \frac{1}{2}(\boldsymbol{y}-\boldsymbol{d}^{m}(\unicode[STIX]{x1D74E},\boldsymbol{x}))^{2}/\unicode[STIX]{x1D70E}^{2}\biggr\},\end{eqnarray}$$
with
 $\boldsymbol{y}=\boldsymbol{d}^{m}+\boldsymbol{\unicode[STIX]{x1D716}}$
,
 $\boldsymbol{\unicode[STIX]{x1D716}}\sim {\mathcal{N}}(0,\unicode[STIX]{x1D70E}^{2}\boldsymbol{I})$
. A common approach is to use the marginal likelihood
 $$\begin{eqnarray}\displaystyle \displaystyle \frac{\unicode[STIX]{x2202}}{\unicode[STIX]{x2202}\unicode[STIX]{x1D714}_{j}}\log \unicode[STIX]{x1D70B}(\boldsymbol{y}|\boldsymbol{x},\unicode[STIX]{x1D74E})=0 & =\displaystyle \frac{1}{2}\boldsymbol{y}^{T}\boldsymbol{\unicode[STIX]{x03A3}}^{-1}\displaystyle \frac{\unicode[STIX]{x2202}\boldsymbol{\unicode[STIX]{x03A3}}}{\unicode[STIX]{x2202}\unicode[STIX]{x1D74E}_{j}}\boldsymbol{\unicode[STIX]{x03A3}}^{-1}\boldsymbol{y}-\displaystyle \frac{1}{2}\text{ trace }\biggl(\unicode[STIX]{x03A3}^{-1}\displaystyle \frac{\unicode[STIX]{x2202}\boldsymbol{K}}{\unicode[STIX]{x2202}\unicode[STIX]{x1D74E}_{j}}\biggr). & \displaystyle\end{eqnarray}$$
The full Bayesian uses the posterior
 $$\begin{eqnarray}\unicode[STIX]{x1D70B}(\boldsymbol{\unicode[STIX]{x1D703}},\unicode[STIX]{x1D74E}|\boldsymbol{y})\propto \unicode[STIX]{x1D70B}(\boldsymbol{y}|\boldsymbol{\unicode[STIX]{x1D703}},\unicode[STIX]{x1D74E})\unicode[STIX]{x1D70B}(\boldsymbol{\unicode[STIX]{x1D703}},\unicode[STIX]{x1D74E}).\end{eqnarray}$$
In implementing this GP update, Bayarri et al. (Reference Bayarri, Berger, Paulo, Sacks, Cafeo, Cavendish, Liu and Tu2007) describe a Markov chain Monte Carlo process starting with the posterior
 $$\begin{eqnarray}\displaystyle \unicode[STIX]{x1D70B}(\boldsymbol{\unicode[STIX]{x1D703}},\unicode[STIX]{x1D706},\unicode[STIX]{x1D738}(\unicode[STIX]{x1D74E}_{\unicode[STIX]{x1D6FE}})|\boldsymbol{y}) & \propto & \displaystyle f(\boldsymbol{y}|\boldsymbol{\unicode[STIX]{x1D703}},\unicode[STIX]{x1D706},\unicode[STIX]{x1D738}(\unicode[STIX]{x1D74E}))\unicode[STIX]{x1D70B}(\boldsymbol{\unicode[STIX]{x1D703}},\unicode[STIX]{x1D706},\unicode[STIX]{x1D738})\nonumber\\ \displaystyle & {\approx} & \displaystyle \boldsymbol{y}-\boldsymbol{d}(\boldsymbol{x}_{i},\boldsymbol{\unicode[STIX]{x1D703}})-\unicode[STIX]{x1D716}_{i},\end{eqnarray}$$
where the outputs
 $\{\boldsymbol{\unicode[STIX]{x1D703}}^{(i)},\unicode[STIX]{x1D706},\boldsymbol{d}(\boldsymbol{x},\boldsymbol{\unicode[STIX]{x1D703}}^{(i)}),\unicode[STIX]{x1D738}^{(i)}(\boldsymbol{x})\}$
are sampled and all quantities of interest can be estimated from these samples.
The prediction of reality
 $\boldsymbol{y}(\boldsymbol{x})$
at a new set of training points
 ${\mathcal{D}}_{new}$
is drawn from the predictive posterior distribution
 $\unicode[STIX]{x1D70B}(\boldsymbol{g}_{new}|\boldsymbol{y},\boldsymbol{d})$
, where
 $\boldsymbol{g}=\boldsymbol{d}+\unicode[STIX]{x1D738}$
, determined from
 $$\begin{eqnarray}\boldsymbol{g}_{new}\sim \displaystyle \frac{1}{N}\mathop{\sum }_{k=1}^{N}(\boldsymbol{y}_{new}^{M(k)}+\unicode[STIX]{x1D738}_{new}^{(k)}),\end{eqnarray}$$
where
 $\boldsymbol{d}_{new}^{(k)}$
and
 $\unicode[STIX]{x1D738}_{new}^{(k)}$
are drawn from the joint posterior. Then,
 $\boldsymbol{g}_{new}$
is the ‘new’ prediction of the reality. Variance and tolerance bounds (credible intervals) can be computed approximately from these calculations.
6 Information theory and the principle of maximum entropy
6.1 Introduction
Apart from Bayesian approaches, but very much complementary to them, are the methods and concepts underlying information theory and the concept of information entropy. Introduced in the landmark paper of Claude Shannon (Reference Shannon1948), information theory provides a rational approach to quantifying and understanding the information content in a probability distribution (or a digital signal). When enriched by the observations and works of E. T. Jaynes (Reference Jaynes2003), well-defined measures of uncertainty in information or in probability emerge that are fundamentally important in many applications, including the rational construction of priors and in Bayesian approaches to inverse problems, such as image reconstruction and pattern recognition. We take a brief journey into the subject in the present section. More detailed accounts can be found in the original paper of Shannon (Reference Shannon1948) and the books of Jaynes (Reference Jaynes2003), Gregory (Reference Gregory2005), Klir (Reference Klir2005) and Cover and Thomas (Reference Cover and Thomas2006), and the notes of Carter (Reference Carter2007).
6.2 An elementary look at information
Let us first address the problem of defining a meaningful measure of the information content in a probability density
 $p$
. We begin by considering a random experiment with
 $n$
sampled outputs, with probabilities
 $p_{1},p_{2},\ldots ,p_{n}$
, respectively, and with each
 $p_{i}>0$
. We wish to construct a measure of the information obtained by observing a particular
 $p_{i}$
. Such an information measure should also be related to the uncertainty in
 $p_{i}$
which we also want to quantify. We propose that the information
 $I$
has the following commonsense properties.
∙
$I:(0,1]\rightarrow [0,\infty )$
(
$I(p)\geq 0$
).∙
$I(p_{i}=1)=0$
(there is no information in a certain probability).∙
$I(p)$
should behave properly for joint, independent outcomes. In particular, if the outcomes of
$n$
experiments are denoted by
$p_{i}$
(
$\in \mathbb{N}^{n}$
) and the outcomes of another
$m$
independent experiments by
$q_{i}$
(
$\in \mathbb{N}^{m}$
), then the joint outcome should be
$p_{i}\cdot q_{j}$
for all
$i\in \mathbb{N}^{n}$
and
$j\in \mathbb{N}^{m}$
. The ‘anticipatory’ information (Klir Reference Klir2005, Carter Reference Carter2007) of the joint outcome will therefore be the sum of the individual outcomes: (6.1)$$\begin{eqnarray}I(p_{i}\cdot q_{j})=I(p_{i})+I(q_{j}).\end{eqnarray}$$



Equation (6.1) is referred to by some authors (e.g. Klir Reference Klir2005) as a Cauchy equation, the solution of which is a class of functions
 $I$
defined for all
 $\unicode[STIX]{x1D6FC}\in (0,1]$
by
 $$\begin{eqnarray}I(a)=c\log _{b}a,\end{eqnarray}$$
where
 $c$
is an arbitrary constant and
 $b$
is a distinct constant
 $\neq 1$
. Since
 $I(\cdot )$
must be decreasing on
 $(0,1]$
and
 $\log (\cdot )$
is increasing,
 $c$
must be negative. By scaling so that
 $I(1/2)=1$
and choosing
 $c=-1$
, we get
 $$\begin{eqnarray}I(a)=-\log _{b}a,\end{eqnarray}$$
or, for probability
 $p_{i}$
of outcome
 $i$
,
 $$\begin{eqnarray}I(p_{i})=-\log _{b}p_{i}=\log _{b}\biggl(\displaystyle \frac{1}{p_{i}}\biggr).\end{eqnarray}$$
We remark that the property (6.2), and hence (6.3), follows from (6.1), or more generally from properties of continuous real-valued functions
 $g:(0,\infty )\rightarrow \mathbb{R}$
with the property that
 $g(x_{1}x_{2})=g(x_{1})+g(x_{2})$
. Indeed, from this one shows that
 $g(x^{n})=ng(x)$
and, by continuity,
 $g(x^{\unicode[STIX]{x1D6FC}})=\unicode[STIX]{x1D6FC}g(x)$
,
 $\unicode[STIX]{x1D6FC}>0$
. Setting
 $x=a$
reveals that
 $g(a^{\unicode[STIX]{x1D6FC}})=\unicode[STIX]{x1D6FC}g(a)$
or
 $g(a)^{-1}g(a^{\unicode[STIX]{x1D6FC}})=\unicode[STIX]{x1D6FC}$
. This shows that
 $g(a)^{-1}g(x)$
is a left inverse of
 $a^{x}$
. A straightforward argument shows that
 $g(0)$
is also injective and, therefore, that
 $g(a)^{-1}g(x)=$
the inverse of
 $a^{x}=\log _{a}x$
, so that
 $$\begin{eqnarray}g(x)=g(a)\log _{a}x.\end{eqnarray}$$
Setting
 $I(\cdot )=g(\cdot )$
,
 $a$
,
 $g(a)=1$
and
 $a=b$
yields (6.2).
Example.
If we take
 $b=2$
, the units of information are called bits. Carter (Reference Carter2007) notes the example of flipping a fair coin to give heads
 $H$
or tails
 $T$
with probability
 $p=1/2$
. The information is
 $I(p)=-\log _{2}(1/2)=1$
bit. For
 $n$
flips
 $I(p^{n})=-\log ((1/2)^{n})=n\log (2)=n$
bits.
6.3 A first look at information entropy
These properties will prove useful in determining the connection between information content in a probability density function and its ‘entropy’. For a discrete probability distribution
 $p=\{p_{1},p_{2},\ldots ,p_{n}\}$
, we will define the information entropy
 $H(p)$
as the real number,
 $$\begin{eqnarray}H(p)=-\mathop{\sum }_{i=1}^{n}p_{i}\log p_{i},\end{eqnarray}$$
where the logarithm can be selected for any base
 $b$
. We generally take
 $b=2$
. Exactly why (6.4) is a meaningful definition of information entropy will be taken up in Section 6.5, where we present Shannon’s theorem and arguments as to why this property is a fundamental measure of uncertainty content in a probability distribution.
Consider a situation in which we are given
 $n$
quantities
 $\{a_{1},a_{2},\ldots ,a_{n}\}$
with corresponding probabilities
 $\{p_{1},p_{2},\ldots ,p_{n}\}$
, each
 $a_{i}$
sampled independently of the others. It is natural to ask: What is the average amount of information we get from each
 $a_{i}$
?
From entity
 $a_{i}$
, we obtain the information
 $$\begin{eqnarray}I(p_{i})=-\log (p_{i})=\log (1/p_{i}).\end{eqnarray}$$
In a run of
 $N$
observations, we see around
 $Np_{i}$
occurrences of
 $a_{i}$
. Thus, in the
 $N$
independent observations, we find the total information
 $$\begin{eqnarray}I=\mathop{\sum }_{i=1}^{n}Np_{i}\log \biggl(\displaystyle \frac{1}{p_{i}}\biggr).\end{eqnarray}$$
Then, the expectation (mean) value of the information is
 $I/N$
, or
 $$\begin{eqnarray}\mathbb{E}[I(p)]=\langle I(p)\rangle =-\mathop{\sum }_{i=1}^{n}p_{i}\log (p_{i})=H(p).\end{eqnarray}$$
We have shown that the entropy of a probability distribution is the expectation value of the information of the distribution:
 $$\begin{eqnarray}\mathbb{E}[I(p)]=\langle I(p)\rangle =H(p).\end{eqnarray}$$
6.4 The Maximum Entropy Principle
A simple inequality attributed to J. Willard Gibbs provides an upper bound on
 $\ln (x)$
.
Gibbs’ inequality.
We have
 $$\begin{eqnarray}\ln (x)\leq x-1,\quad \text{for }x>0,\end{eqnarray}$$
with equality if and only if
 $x=1$
.
Proof. Since
 $(\ln x)^{\prime }=1/x$
, the log function is tangent to
 $y(x)=x-1$
at
 $x=1$
. Since
 $\ln x$
is concave for
 $x>0$
, it lies below each of its tangents, and, in particular, it lies below the tangent to
 $x=1$
. Hence
 $$\begin{eqnarray}\ln x\leq x-1,\end{eqnarray}$$
with equality if and only if
 $x=1$
.◻
A classical application of Gibbs’ inequality arises when we consider the relative entropy of two probability distributions, say
 $p=\{p_{1},p_{2},\ldots ,p_{n}\}$
and
 $p=\{q_{1},q_{2},\ldots ,q_{n}\}$
, where
 $p_{i},q_{i}\geq 0$
, and
 $\sum _{i}p_{i}=\sum _{i}q_{i}=1$
. Their Kullback–Leibler divergence (or relative entropy) is
 $$\begin{eqnarray}D_{KL}(p||q)=\mathop{\sum }_{i=1}^{n}p_{i}\log \displaystyle \frac{p_{i}}{q_{i}}.\end{eqnarray}$$
Thus
 $$\begin{eqnarray}\displaystyle -D_{KL}(p||q) & = & \displaystyle -\mathop{\sum }_{i=1}^{n}p_{i}\log \displaystyle \frac{p_{i}}{q_{i}}\nonumber\\ \displaystyle & \leq & \displaystyle \mathop{\sum }_{i=1}^{n}p_{i}\biggl(1-\displaystyle \frac{q_{i}}{p_{i}}\biggr)\nonumber\\ \displaystyle & = & \displaystyle \mathop{\sum }_{i=1}^{n}(q_{i}-p_{i})\nonumber\\ \displaystyle & = & \displaystyle 0,\end{eqnarray}$$
from Gibbs’ inequality. Therefore,
 $$\begin{eqnarray}D_{KL}(p||q)=-H(p)+H(p,q)\geq 0.\end{eqnarray}$$
where
 $H(p,q)$
is the cross-entropy
 $$\begin{eqnarray}H(p,q)=-\mathop{\sum }_{i=1}^{n}p_{i}\log q_{i}.\end{eqnarray}$$
Next, given a probability distribution
 $\{p_{1},p_{2},\ldots ,p_{n}\}$
, we compute the difference
 $$\begin{eqnarray}\displaystyle H(p)-\log (n) & = & \displaystyle -\mathop{\sum }_{i=1}^{n}p_{i}\log p_{i}-\log (n)\nonumber\\ \displaystyle & = & \displaystyle \mathop{\sum }_{i=1}^{n}p_{i}\log \biggl(\displaystyle \frac{1}{p_{i}}\biggr)-\log (n)\mathop{\sum }_{i=1}^{n}p_{i}\nonumber\\ \displaystyle & = & \displaystyle \mathop{\sum }_{i=1}^{n}p_{i}\biggl(\log \biggl(\displaystyle \frac{1}{p_{i}}\biggr)+\log \biggl(\displaystyle \frac{1}{n}\biggr)\biggr)\nonumber\\ \displaystyle & = & \displaystyle \mathop{\sum }_{i=1}^{n}p_{i}\log \biggl(\displaystyle \frac{1/n}{p_{i}}\biggr).\end{eqnarray}$$
But, from Gibbs’ inequality (6.6), this latter sum is less than or equal to zero, the equality holding only when
 $p_{i}=1/n$
. Thus,
 $$\begin{eqnarray}0\leq H(p)\leq \log (n).\end{eqnarray}$$
The entropy
 $H(p)$
is zero only when one of the
 $p_{i}$
is one and all others are zero (then the average information
 $\langle I(p)\rangle =0$
) and
 $H(p)=\log (n)$
; it is maximum only when all of the probabilities have the same value,
 $1/n$
, that is, all events are equally likely.
We are thus led to a fundamental property of the entropy of a probability.
Maximum Entropy Principle.
Let
 $X=\{\boldsymbol{x}_{1},\boldsymbol{x}_{2},\ldots ,\boldsymbol{x}_{n}\}$
be a set of points in
 $\mathbb{R}^{m}$
and let
 $p_{i}=p(\boldsymbol{x}_{i})$
denote the probability of an event at
 $\boldsymbol{x}_{i}$
. Let
 $$\begin{eqnarray}{\mathcal{P}}_{n}=\biggl\{(p_{1},p_{2},\ldots ,p_{n})|p_{i}\in [0,1],~\mathop{\sum }_{i}p_{i}=1\biggr\}\end{eqnarray}$$
be the set of all probability distributions on
 $X$
with
 $n$
components. Then of all
 $p\in {\mathcal{P}}_{n}$
, the one that maximizes the entropy defines the information content
 $\mathbb{E}[I(p)]$
and quantifies the uncertainty in the information. A more general treatment is given in the next subsection.
6.5 Shannon’s theorem
It is often asserted that the information entropy
 $H(p)$
is the only meaningful measure of uncertainty and information in probability theory. More rigorous developments that support this assertion can be found in the original paper of Shannon (Reference Shannon1948), in the treatise of Jaynes (Reference Jaynes2003), the descriptive exposition of Klir (Reference Klir2005), and other works. Without providing full details, we summarize the basic axioms underlying the theorem, following Klir (Reference Klir2005).
Our goal is to develop a more rigorous justification of (6.4) as an example of uncertainty content in a probability distribution and to provide a more general basis for the Maximum Entropy Principle. Given again
 ${\mathcal{P}}_{n}$
, we seek a function
 $H(p_{1},\ldots ,p_{n})$
satisfying the following conditions.
Axiom 1.
When a zero component is added to a probability distribution, the quantity of uncertainty should not change:
 $H(p_{1},p_{2},\ldots ,p_{n})=H(p_{1},p_{2},\ldots ,p_{n},0)$
.
Axiom 2.
 $H(\cdot )$
is a continuous function of all of its arguments,
 $H(p)=H(p_{1},p_{2},\ldots ,p_{n})$
.
Axiom 3.
Uncertainty is invariant under permutation
 $\unicode[STIX]{x1D70B}$
of the probability components:
 $H(p_{1},p_{2},\ldots ,p_{n})=H(\unicode[STIX]{x1D70B}(p_{1},p_{2},\ldots ,p_{n}))$
,
 $\unicode[STIX]{x1D70B}(p)$
being a permutation of
 $p$
.
Axiom 4.
The maximum uncertainty is obtained when all probability components are equal to
 $1/n$
:
 $$\begin{eqnarray}H(p_{1},p_{2},\ldots ,p_{n})\leq H\biggl(\displaystyle \frac{1}{n},\displaystyle \frac{1}{n},\ldots ,\displaystyle \frac{1}{n}\biggr).\end{eqnarray}$$
Axiom 5.
The uncertainty of any joint probability must not exceed the sum of the uncertainties of the corresponding marginal distributions (Klir Reference Klir2005, p. 73): that is, given a joint probability distribution
 $p_{ij}$
,
 $1\leq i\leq n$
,
 $1\leq j\leq m$
,
 $$\begin{eqnarray}\displaystyle & & \displaystyle H(p_{11},p_{12},\ldots ,p_{1m},p_{21},p_{22},\ldots ,p_{2m},\ldots ,p_{n1},p_{n2},\ldots ,p_{nm})\nonumber\\ \displaystyle & & \displaystyle \qquad \leq H\biggl(\mathop{\sum }_{j=1}^{m}p_{1j},\mathop{\sum }_{j=1}^{m}p_{2j},\ldots ,\mathop{\sum }_{j=1}^{m}p_{mj}\biggr)+H\biggl(\mathop{\sum }_{i=1}^{n}p_{i1},\mathop{\sum }_{i=1}^{n}p_{i2},\ldots ,\mathop{\sum }_{i=1}^{n}p_{im}\biggr).\nonumber\end{eqnarray}$$
Axiom 6.
We have for joint probability
 $p_{i}q_{j}$
,
 $1\leq i\leq n$
,
 $1\leq j\leq m$
,
 $$\begin{eqnarray}\displaystyle & & \displaystyle H(p_{1}q_{1},p_{1}q_{2},\ldots ,p_{1}q_{m},p_{2}q_{1},p_{2}q_{2},\ldots ,p_{2}q_{m},\ldots ,p_{n}q_{1},p_{n}q_{2},\ldots ,p_{n}q_{m})\nonumber\\ \displaystyle & & \displaystyle \qquad =H(p_{1},p_{2},\ldots ,p_{n})+H(q_{1},q_{2},\ldots ,q_{m}).\nonumber\end{eqnarray}$$
Thus, the uncertainty of a joint probability should equal the sum of uncertainties of the corresponding marginal distributions.
Axiom 7.
The uncertainties of probabilities with components equal to
 $1/n$
(as in Axiom 4) should increase with increasing
 $n$
.
Axiom 8.
A probability distribution must have the branching property. Given
 $A=\{x_{1},x_{2},\ldots ,x_{s}\}$
and
 $B=\{x_{s+1},x_{s+2},\ldots ,x_{n}\}$
, then
 $$\begin{eqnarray}\displaystyle H(p_{1},p_{2},\ldots ,p_{n}) & = & \displaystyle H(p_{A},p_{B})+p_{A}H\biggl(\displaystyle \frac{p_{1}}{p_{A}},\displaystyle \frac{p_{2}}{p_{A}},\ldots ,\displaystyle \frac{p_{s}}{p_{A}}\biggr)\nonumber\\ \displaystyle & & \displaystyle +p_{B}H\biggl(\displaystyle \frac{p_{s+1}}{p_{B}},\displaystyle \frac{p_{s+2}}{p_{B}},\ldots ,\displaystyle \frac{p_{n}}{p_{B}}\biggr).\nonumber\end{eqnarray}$$
Axiom 9.
 $H(1/2,1/2)=1$
if the units of
 $H$
are to be bits.
Shannon’s theorem is then as follows.
Theorem 6.1. The only functional
 $H$
on
 ${\mathcal{P}}^{n}$
that satisfies the axioms listed above is the Shannon entropy
 $H(p)=-\sum _{i=1}^{n}p_{i}\log p_{i}$
.
Details of the proof can be found in Klir (Reference Klir2005) or, in slightly different forms of the axioms, in Jaynes (Reference Jaynes2003) and of course Shannon (Reference Shannon1948). As noted in (4.16), for the continuous densities
 $p=p(\boldsymbol{x})$
, we write
 $$\begin{eqnarray}H(p)=-\int p(\boldsymbol{x})\log p(\boldsymbol{x})\text{d}\boldsymbol{x}.\end{eqnarray}$$
While in much of the literature on information entropy, (6.11) is given as the definition of entropy for the case of continuous
 $p=p(\boldsymbol{x})$
, it is not technically correct as it is not invariant under a change of variables, e.g. under a translation. It can be corrected by the introduction of a function
 $m(x)$
, so that
 $$\begin{eqnarray}H(p)=-\int p\log \displaystyle \frac{p}{m}\text{d}\boldsymbol{x},\end{eqnarray}$$
where
 $m$
is an invariant measure proportional to a limiting density of a discrete set of sample points
 $\boldsymbol{x}_{1},\ldots ,\boldsymbol{x}_{n}$
(see e.g. Jaynes Reference Jaynes2003, p. 375).
6.6 Example: entropy of the uniform distribution
An
 $m$
-dimensional example of uniform distribution over a domain
 $D$
.

Let
 $U$
be a uniform random variable, that is,
 $U$
takes on some constant value in a bounded domain
 $D\subset \mathbb{R}^{n}$
, with volume (or measure)
 $|D|<\infty$
(see Figure 6.1). In one dimension, the corresponding density would be
 $$\begin{eqnarray}\unicode[STIX]{x1D70B}(x)=\displaystyle \frac{1}{|D|},\quad a\leq x\leq b,\end{eqnarray}$$
meaning that for any
 $x$
in
 $[a,b]$
, the same probability
 $1/(b-a)$
occurs. The entropy of
 $U$
is
 $$\begin{eqnarray}H(U)=\log (|D|).\end{eqnarray}$$
The question arises, how uncertain is the random variable
 $U$
? The answer is that the entropy of any other random variable
 $X$
(call it
 $H(X)$
for now) will always be smaller than
 $H(U)$
:
 $$\begin{eqnarray}H(X)\leq H(U).\end{eqnarray}$$
The uniform distribution (or, for instance, the uniform prior
 $\unicode[STIX]{x1D70B}_{prior}(x)=\text{const.}$
) is thus the distribution of maximum uncertainty (or, as some say, maximum ignorance).
Considerably more information is contained in the case in which the mean
 $\unicode[STIX]{x1D707}$
and the variance
 $\unicode[STIX]{x1D70E}^{2}$
of a distribution are known. Then, the correct distribution
 $\unicode[STIX]{x1D70B}(x)$
must maximize the entropy subject to appropriate constraints, that is,
 $$\begin{eqnarray}\displaystyle \unicode[STIX]{x1D70B}(x) & = & \displaystyle \underset{\unicode[STIX]{x1D70B}}{\operatorname{argmax}}H(x)\nonumber\\ \displaystyle & = & \displaystyle \underset{\unicode[STIX]{x1D70B}}{\operatorname{argmax}}\biggl\{\int _{\mathbb{R}}\unicode[STIX]{x1D70B}(x)\log \unicode[STIX]{x1D70B}(x)\text{d}x\biggr\},\nonumber\end{eqnarray}$$
subject to the constraints
 $$\begin{eqnarray}\displaystyle \int _{\mathbb{R}}\unicode[STIX]{x1D70B}(x)\text{d}x & = & \displaystyle 1,\nonumber\\ \displaystyle \int _{\mathbb{R}}x\unicode[STIX]{x1D70B}(x)\text{d}x & = & \displaystyle \unicode[STIX]{x1D707},\nonumber\\ \displaystyle \int _{\mathbb{R}}(x-\unicode[STIX]{x1D707})^{2}\unicode[STIX]{x1D70B}(x)\text{d}x & = & \displaystyle \unicode[STIX]{x1D70E}^{2}.\nonumber\end{eqnarray}$$
Constructing a Lagrangian functional
 $\unicode[STIX]{x1D6F6}$
defined by the entropy and Lagrange multipliers for these constraints, we easily solve the constrained maximization problem and establish that the solution is
 $$\begin{eqnarray}\unicode[STIX]{x1D70B}(x)=\exp \biggl\{-\displaystyle \frac{1}{2}\biggl(\displaystyle \frac{x-\unicode[STIX]{x1D707}}{\unicode[STIX]{x1D70E}}\biggr)^{2}\biggr\},\end{eqnarray}$$
a Gaussian, as was probably expected.
This process of computing prior distributions by maximizing the entropy subject to constraints was introduced by Jaynes (Reference Jaynes1968) and used by him to generate priors for very general situations in which some a priori information is known about the variable
 $x$
(generally, in our applications
 $x=\unicode[STIX]{x1D703}$
, the parameters). We examine Jaynes’ approach more thoroughly in the next section.
6.7 Maximum entropy priors: the general solution for maximum entropy with linear constraints
An important application of the Maximum Entropy Principle for constructing prior distributions when some statistical information is known, was developed by Jaynes (Reference Jaynes1968) and described later in his book Probability Theory: The Logic of Science (Jaynes Reference Jaynes2003). This section reviews the basic ideas.
Consider a real-valued variable
 $x$
about which we have
 $n$
propositions
 $\{A_{1},A_{2},\ldots ,A_{n}\}$
. We have prior information
 $I$
about
 $x$
that takes on values
 $\{x_{1},x_{2},\ldots ,x_{n}\}$
corresponding to the respective propositions. The probabilities
 $p_{i}$
that we assign to the possibilities
 $x_{i}$
form the set
 $\{p_{1},p_{2},\ldots ,p_{n}\}$
.
Next, suppose we have a set of
 $m$
functions of
 $x$
,
 $f_{k}(x)$
,
 $1\leq k\leq m<n$
. We want to prescribe the expectations of the
 $f_{k}$
relative to the probability distribution
 $\{p_{1},p_{2},\ldots ,p_{n}\}$
:
 $$\begin{eqnarray}\langle f_{k}(x)\rangle =\mathop{\sum }_{i=1}^{n}p_{i}f_{k}(x_{i})=F_{k},\end{eqnarray}$$
where
 $F_{k}$
are given numbers. Thus, given the
 $F_{k}$
and given the
 $x_{i}$
, we wish to find the probabilities
 $p_{i}$
which yield maximum entropy, subject to the relevant constraints, including
 $\sum _{i}p_{i}=1$
. This leads to the problem of finding critical points of the functional
 $$\begin{eqnarray}\unicode[STIX]{x1D6F6}(p,\unicode[STIX]{x1D706}_{0},\unicode[STIX]{x1D706}_{1},\ldots ,\unicode[STIX]{x1D706}_{m})=H(p)-\unicode[STIX]{x1D706}_{0}^{\prime }\biggl(1-\mathop{\sum }_{i=1}^{n}p_{i}\biggr)-\mathop{\sum }_{k=1}^{m}\unicode[STIX]{x1D706}_{k}\biggl(F_{k}-\mathop{\sum }_{i}^{n}p_{i}f_{k}\biggr),\end{eqnarray}$$
where
 $\unicode[STIX]{x1D706}_{0}^{\prime },\unicode[STIX]{x1D706}_{1},\ldots ,\unicode[STIX]{x1D706}_{m}$
are Lagrange multipliers and
 $f_{k}=f_{k}(x_{i})$
. We have
 $$\begin{eqnarray}\mathop{\sum }_{i=1}^{n}\biggl[\displaystyle \frac{\unicode[STIX]{x2202}H(p)}{\unicode[STIX]{x2202}p_{i}}\unicode[STIX]{x1D6FF}p_{i}-\unicode[STIX]{x1D706}_{0}^{\prime }\unicode[STIX]{x1D6FF}p_{i}+\mathop{\sum }_{k=1}^{m}\unicode[STIX]{x1D706}_{k}f_{k}\unicode[STIX]{x1D6FF}p_{i}\biggr]=0,\quad \text{for all }\unicode[STIX]{x1D6FF}p_{i}.\end{eqnarray}$$
From this one can show that
 $$\begin{eqnarray}p_{i}^{\max }=p_{i}=\exp \biggl(\unicode[STIX]{x1D706}_{0}-\mathop{\sum }_{k=1}^{m}\unicode[STIX]{x1D706}_{k}f_{k}\biggr),\end{eqnarray}$$
where
 $\unicode[STIX]{x1D706}_{0}=\unicode[STIX]{x1D706}_{0}^{\prime }+1$
. Returning to the constraints, we have
 $$\begin{eqnarray}1=\mathop{\sum }_{i=1}^{n}p_{i}=\exp \biggl[-\unicode[STIX]{x1D706}_{0}\mathop{\sum }_{i}^{n}\exp \biggl(-\mathop{\sum }_{k=1}^{m}\unicode[STIX]{x1D706}_{k}f_{k}\biggr)\biggr].\end{eqnarray}$$
At this point, we introduce the partition function
 $$\begin{eqnarray}Z(\unicode[STIX]{x1D706}_{1},\unicode[STIX]{x1D706}_{2},\ldots ,\unicode[STIX]{x1D706}_{m})=\mathop{\sum }_{i}^{n}\exp \biggl(-\mathop{\sum }_{k=1}^{m}\unicode[STIX]{x1D706}_{k}f_{k}\biggr),\end{eqnarray}$$
so
 $$\begin{eqnarray}\unicode[STIX]{x1D706}_{0}=\log Z.\end{eqnarray}$$
Thus, we have
 $$\begin{eqnarray}F_{k}=\mathop{\sum }_{i}^{n}\exp \biggl[\log Z-\mathop{\sum }_{k=1}^{m}\unicode[STIX]{x1D706}_{k}f_{k}(x_{i})\biggr],\end{eqnarray}$$
which we recognize as
 $$\begin{eqnarray}F_{k}=-\displaystyle \frac{\unicode[STIX]{x2202}}{\unicode[STIX]{x2202}\unicode[STIX]{x1D706}_{k}}(\log Z(\unicode[STIX]{x1D706}_{1},\unicode[STIX]{x1D706}_{2},\ldots ,\unicode[STIX]{x1D706}_{m})),\end{eqnarray}$$
which determines the
 $\unicode[STIX]{x1D706}_{k}$
as functions of the given
 $F_{k}$
. The maximum entropy is
 $$\begin{eqnarray}H_{\max }=-\mathop{\sum }_{i=1}^{n}p_{i}^{\max }\log p_{i}^{\max },\end{eqnarray}$$
where
 $p_{i}^{\max }$
is given by (6.14). Thus,
 $$\begin{eqnarray}H_{\max }=\unicode[STIX]{x1D706}_{0}+\mathop{\sum }_{k=1}^{m}\unicode[STIX]{x1D706}_{k}F_{k}.\end{eqnarray}$$
We can now assert that
 $H$
attains its maximum if and only if
 $p_{i}=p_{i}^{\max }$
, that is,
 $$\begin{eqnarray}p_{i}=\displaystyle \frac{1}{Z}\exp \biggl[-\mathop{\sum }_{k=1}^{m}\unicode[STIX]{x1D706}_{k}f_{k}(x_{i})\biggr].\end{eqnarray}$$
One significance of problem (6.12) is this: if we know certain properties of a distribution, such as its mean, moments, or other features
 $F_{k}$
, then we construct the prior which fits these constraints and which maximizes the entropy. Further details can be found in Jaynes (Reference Jaynes2003).
7 Monte Carlo methods: MCMC and sensitivity analysis
7.1 Introduction
Some basic issues are, as yet, unaddressed in our introduction to Bayesian inference and statistical calibration and validation. First and foremost, how do we numerically evaluate the influence of the posterior distributions arising from Bayes’ rule on key quantities of interest? This issue of numerically evaluating Bayes’ rule was a principal contributing factor to the long-dormant period in which the importance of Bayesian approaches was largely ignored by the statistics community. Secondly, there is the question of what model parameters appreciably affect the quantities of interest in a computer simulation. Specifically, in almost every application of interest, the quantities of interest (QoIs) which are the target centrepiece of the prediction are not influenced by the choice of some, often many, values of the model parameters. This raises the question: Of all the parameters in a given model, and given a QoI, which parameters can be eliminated, because variations in them have negligible effect on the values of the QoIs?
Remarkably, both of these questions can be addressed with great efficiency using Monte Carlo (MC) methodologies. Monte Carlo methods represent a broad class of computational algorithms that rely on repeated random samples of a function to obtain numerical representations of values of the function over its domain. In recent years, there have been many hundreds, perhaps thousands of papers on various versions of MC methods applied to problems in UQ (uncertainty quantification). A comprehensive review of the mathematical structures of many of these methods can be found in the notes of Johansen and Evers (Reference Johansen and Evers2007). Our goal here is to give a very brief review of the classical ideas for reference in later sections.
The term ‘Monte Carlo’ was used by the earlier inventors and users of the idea, in analogy with gambling with random bets at the Monte Carlo Casino in Monaco. It was introduced by Manhattan Project scientists Nicholas Metropolis and Stanislaw Ulam (see Metropolis et al. Reference Metropolis, Rosenbluth, Rosenbluth, Teller and Teller1953), and with further improvements by Wilfred Hastings (Reference Hastings1970). The basic idea involves solving deterministic problems using a probabilistic analogy.
The most common Monte Carlo algorithm is that associated with integration of a function
 $f(x)$
over a domain
 $\unicode[STIX]{x03A9}$
,
 $\int _{\unicode[STIX]{x03A9}}f(x)\text{d}x$
. There the idea is to introduce a set
 $X$
of randomly selected points
 $X=\{x_{1},x_{2},\ldots ,x_{n}\}$
in
 $\unicode[STIX]{x03A9}$
and approximate the integral by the sum
 $$\begin{eqnarray}\int _{\unicode[STIX]{x03A9}}f(x)\text{d}x\approx |\unicode[STIX]{x03A9}|\displaystyle \frac{1}{n}\mathop{\sum }_{i=1}^{n}f(x_{i}),\end{eqnarray}$$
 $|\unicode[STIX]{x03A9}|$
being the volume of
 $\unicode[STIX]{x03A9}$
. In actual applications, it is sufficient to employ a pseudorandom set of sample points. The error is
 $O(1/\sqrt{n})$
:
 $$\begin{eqnarray}\operatorname{Var}\biggl(\int _{\unicode[STIX]{x03A9}}f(x)\text{d}x-|\unicode[STIX]{x03A9}|\displaystyle \frac{1}{n}\mathop{\sum }_{i=1}^{n}f(x_{i})\biggr)=\displaystyle \frac{1}{n}\biggl\{\mathop{\sum }_{i=1}^{n}f^{2}(x_{i})-\biggl[\displaystyle \frac{1}{n}\mathop{\sum }_{i=1}^{n}f(x_{i})\biggr]^{2}\biggr\}.\end{eqnarray}$$
In the applications of Bayes’ rule of interest here, the goal is to use Monte Carlo sampling of a distribution to trace out its variation over its domain, as opposed to integrating a posterior over that domain. Thus, we have, for example, the posterior probability density
 $\unicode[STIX]{x1D70B}_{post}(\boldsymbol{\unicode[STIX]{x1D703}}|\boldsymbol{y},S)$
– denoted
 $\unicode[STIX]{x1D70B}_{post}(\boldsymbol{\unicode[STIX]{x1D703}})$
for simplicity – and we generate a sequence of samples from
 $\unicode[STIX]{x1D70B}_{post}(\boldsymbol{\unicode[STIX]{x1D703}})$
by randomly selecting parameter value
 $\boldsymbol{\unicode[STIX]{x1D703}}_{i}$
in the domain
 $\operatorname{dom}\unicode[STIX]{x1D70B}_{post}$
. The challenge is to develop a systematic strategy to sample all (or a sufficient number) of values to fully represent the structure of
 $\unicode[STIX]{x1D70B}_{post}$
. This we accomplish by following a random walk over the contours of the surface which is defined by a Markov chain, described in Section 6.2. An example of such an approximation of the surface is given in Figure 7.1.
The structure of a posterior distribution
 $\unicode[STIX]{x1D70B}_{post}(\boldsymbol{\unicode[STIX]{x1D703}})$
depending on the parameters
 $\boldsymbol{\unicode[STIX]{x1D703}}=(x,y)$
constructed by computing samples along a random walk, starting at
 $\boldsymbol{\unicode[STIX]{x1D703}}=(-9,-9)$
.

As to sensitivity analysis, the idea is to find out how the QoI, or an appropriate surrogate value
 $Y$
, varies when specific parameters of a model take on random incremental variations. To quote the famous Bayesian proponent Sir Harold Jeffreys (Reference Jeffreys1998, p. 414), ‘Parameters in a law that make no contribution to the results of any observation can be eliminated mathematically, leaving the observations to be described only in terms of the relevant parameters.’ Our only reservation concerning Jeffreys’ suggestion is that setting a parameter
 $\unicode[STIX]{x1D703}$
to zero must be consistent with the definition of its parameter space, that is, we must have
 $0\in \unicode[STIX]{x0398}$
.
Ideally, we want to know how large are the variations in the QoI due to variations in the parameters. The parameter sensitivities are thus related to the numbers
 $$\begin{eqnarray}\biggl|\displaystyle \frac{\unicode[STIX]{x2202}Q(u(\boldsymbol{\unicode[STIX]{x1D703}},S))}{\unicode[STIX]{x2202}\boldsymbol{\unicode[STIX]{x1D703}}_{i}}\biggr|,\quad 1\leq i\leq n,~\boldsymbol{\unicode[STIX]{x1D703}}_{i}\in \unicode[STIX]{x1D703}\in \unicode[STIX]{x0398}.\end{eqnarray}$$
Unfortunately, such sensitivity calculations are often very computationally intensive and do not provide a useful measure of parameter sensitivity. Instead, we are led to surrogate measures of output dependency on parameters. Thus if
 $Y=Y(\boldsymbol{\unicode[STIX]{x1D703}})$
is an output functional (say
 $Y$
is a QoI), then we seek numerical methods which compute the sensitivity of
 $Y(\boldsymbol{\unicode[STIX]{x1D703}})$
to perturbations in model parameter
 $\boldsymbol{\unicode[STIX]{x1D703}}$
. We describe such sensitivity measures and calculations advocated by Saltelli, Chan and Scott (Reference Saltelli, Chan and Scott2000) below. As mentioned earlier, these sensitivity calculations employ Monte Carlo type methodologies.
7.2 Markov chains
In this section we write out for future reference a very brief introduction to Monte Carlo sampling methods underlying the famous and powerful Markov chain Monte Carlo methods and later variance-based Monte Carlo sampling methods of sensitivity analysis for model sensitivities. We must build a representation of the structure of the surface of probability density such as
 $\unicode[STIX]{x1D70B}_{post}(\boldsymbol{\unicode[STIX]{x1D703}})$
by using a Monte Carlo sampling of a process that traces out a path connecting the random sample points
 $\boldsymbol{x}$
in a way that can cover the domain of the function as the number of samples is increased. Such a sampling can be performed by a Markov chain, which is a sequence of random variables generated by sampling along paths in the function domain called a chain. A Markov chain is a random process that traverses from one ‘state’ to another in such a way that it creates a ‘chain’ through a state space in which the predicted distribution on the next state in a chain of probabilities depends only on the current state and not on the events or the probabilities that produced them. Such a ‘memoryless-ness’ property is called a Markov property. In applications of interest here, we pick an initial point in, say,
 $\mathbb{R}^{n}$
, and create a random walk, a path through the space, guided by a set of decision rules.
In a more formal setting, a Markov chain can be considered to be a sequence of random variables
 $X,Y,Z$
accessed by a process in a certain order,
 $X\rightarrow Y\rightarrow Z$
, such that the conditional probability of
 $Z$
depends only on
 $Y$
and is independent of
 $X$
. The joint probability (or mass) can thus be written as
 $$\begin{eqnarray}\displaystyle \unicode[STIX]{x1D70B}(x,y,z) & = & \displaystyle \unicode[STIX]{x1D70B}(z|y,x)\unicode[STIX]{x1D70B}(y|x)\unicode[STIX]{x1D70B}(x)\nonumber\\ \displaystyle & = & \displaystyle \unicode[STIX]{x1D70B}(z|y)\unicode[STIX]{x1D70B}(y|x)\unicode[STIX]{x1D70B}(x)\nonumber\\ \displaystyle & = & \displaystyle \unicode[STIX]{x1D70B}(z|x,y)\unicode[STIX]{x1D70B}(x|y)\nonumber\\ \displaystyle \Rightarrow \unicode[STIX]{x1D70B}(x,z|y) & = & \displaystyle \unicode[STIX]{x1D70B}(x|y)\unicode[STIX]{x1D70B}(z|y).\end{eqnarray}$$
The memoryless property shows that no processing of information about step
 $Y$
can increase the information at
 $Y$
about information at
 $X$
(written in terms of mutual information as
 $I(X,Y)\geq I(X,Z)$
). See Cover and Thomas (Reference Cover and Thomas2006).
7.3 Markov chain Monte Carlo
The challenge in applying Monte Carlo sampling is to limit the number of samples in regions of the domain of the integrand where the integrand is very small. A process for tracing out the random walk along a chain that selects directions in which the highest probability of capturing meaningful values of the integrand is the goal of the Markov chain Monte Carlo (MCMC) strategy.
Suppose that we want to map out and explore the structure of a posterior density
 $\unicode[STIX]{x1D70B}_{post}(\boldsymbol{\unicode[STIX]{x1D703}})$
(
 $=\unicode[STIX]{x1D70B}(\boldsymbol{\unicode[STIX]{x1D703}}|\boldsymbol{y},S)$
), through a series of trial points
 $\boldsymbol{\unicode[STIX]{x1D703}}^{k}$
on a Markov chain starting at an initial value
 $\boldsymbol{\unicode[STIX]{x1D703}}^{0}$
of the parameters
 $\boldsymbol{\unicode[STIX]{x1D703}}$
, and designed to have the Markovian property: that each new sample
 $\boldsymbol{\unicode[STIX]{x1D703}}^{(k+1)}$
does not depend on the earlier samples, beyond
 $\boldsymbol{\unicode[STIX]{x1D703}}^{(k-1)}$
. The new value
 $\boldsymbol{\unicode[STIX]{x1D703}}^{(k+1)}$
depends on the previous sample
 $\boldsymbol{\unicode[STIX]{x1D703}}^{k}$
through a transition probability
 $p(\boldsymbol{\unicode[STIX]{x1D703}}^{(k+1)},\boldsymbol{\unicode[STIX]{x1D703}}^{(k)})$
that is designed to make the path and samples generate all of the posterior.
A first step is to pick a proposal (conditional) distribution
 $q(\boldsymbol{\unicode[STIX]{x1D703}}^{\ast }|\boldsymbol{\unicode[STIX]{x1D703}}^{(k)})$
that gives the value
 $\boldsymbol{\unicode[STIX]{x1D703}}^{\ast }$
of the
 $k+1$
step, given the
 $k$
th value
 $\boldsymbol{\unicode[STIX]{x1D703}}^{(k)}$
. The density
 $q$
can be of any form, such as multivariate Gaussian with mean equal to the current sample
 $\boldsymbol{\unicode[STIX]{x1D703}}^{(k)}$
. The density then decreases with distance away from
 $\boldsymbol{\unicode[STIX]{x1D703}}^{(k)}$
, the current sample.
Secondly, we must decide if we accept the candidate sample
 $\boldsymbol{\unicode[STIX]{x1D703}}^{\ast }$
. We do this on the basis of the Metropolis ratio
 $$\begin{eqnarray}r=\displaystyle \frac{\unicode[STIX]{x1D70B}_{post}(\boldsymbol{\unicode[STIX]{x1D703}}^{\ast })}{\unicode[STIX]{x1D70B}(\boldsymbol{\unicode[STIX]{x1D703}}^{(k)})}\times \displaystyle \frac{q(\boldsymbol{\unicode[STIX]{x1D703}}^{k}|\boldsymbol{\unicode[STIX]{x1D703}}^{(\ast )})}{q(\boldsymbol{\unicode[STIX]{x1D703}}^{\ast }|\boldsymbol{\unicode[STIX]{x1D703}}^{(k)})}.\end{eqnarray}$$
If the proposal distribution is symmetric, then the second factor is
 $1$
. If not, and
 $r\geq 1$
, we set
 $\boldsymbol{\unicode[STIX]{x1D703}}^{(k+1)}=\boldsymbol{\unicode[STIX]{x1D703}}^{\ast }$
. If
 $r<1$
, we accept
 $\boldsymbol{\unicode[STIX]{x1D703}}^{\ast }$
with probability
 $r$
. This latter step is done by sampling a random variable
 $U$
from the uniform distribution
 $U(0,1)$
. If
 $U\leq r$
, we set
 $\boldsymbol{\unicode[STIX]{x1D703}}^{(k+1)}=\boldsymbol{\unicode[STIX]{x1D703}}^{\ast }$
; otherwise,
 $\boldsymbol{\unicode[STIX]{x1D703}}^{(k+1)}=\boldsymbol{\unicode[STIX]{x1D703}}^{(k)}$
.
This second step is captured by the acceptance probability
 $\unicode[STIX]{x1D6FC}(\boldsymbol{\unicode[STIX]{x1D703}}^{\ast },\boldsymbol{\unicode[STIX]{x1D703}}^{(k)})$
, defined by
 $$\begin{eqnarray}\unicode[STIX]{x1D6FC}(\boldsymbol{\unicode[STIX]{x1D703}}^{\ast },\boldsymbol{\unicode[STIX]{x1D703}}^{(k)})=\min (1,r)=\min \biggl(1,\displaystyle \frac{\unicode[STIX]{x1D70B}_{post}(\boldsymbol{\unicode[STIX]{x1D703}}^{\ast })q(\boldsymbol{\unicode[STIX]{x1D703}}^{(k)}|\boldsymbol{\unicode[STIX]{x1D703}}^{\ast })}{\unicode[STIX]{x1D70B}_{post}(\boldsymbol{\unicode[STIX]{x1D703}}^{k})q(\boldsymbol{\unicode[STIX]{x1D703}}^{\ast }|\boldsymbol{\unicode[STIX]{x1D703}}^{(k)})}\biggr).\end{eqnarray}$$
Thus,
 $$\begin{eqnarray}\boldsymbol{\unicode[STIX]{x1D703}}^{(k+1)}=\left\{\begin{array}{@{}ll@{}}\boldsymbol{\unicode[STIX]{x1D703}}^{\ast }\quad & \text{with probability }\min \{1,\unicode[STIX]{x1D6FC}(\boldsymbol{\unicode[STIX]{x1D703}}^{\ast },\boldsymbol{\unicode[STIX]{x1D703}}^{(k)})\},\\ \boldsymbol{\unicode[STIX]{x1D703}}^{(k)}\quad & \text{with probability }1-\min \{1,\unicode[STIX]{x1D6FC}(\boldsymbol{\unicode[STIX]{x1D703}}^{\ast },\boldsymbol{\unicode[STIX]{x1D703}}^{(k)})\}.\end{array}\right.\end{eqnarray}$$
This version of MCMC is called the Metropolis–Hastings algorithm. It is used as the basis for many popular statistical sampling programs, and, in particular, the code QUESO Prudencio and Schulz (Reference Prudencio, Schulz and Alexander2011) is employed in calculations in later sections.
7.4 Parameter sensitivity analysis
As noted earlier, it is frequently the case that QoIs or experimental observations are not sensitive to changes in certain model parameters. Since computational cost and complexity may strongly depend on the number of parameters appearing in a model, any rational process that leads to a reduction in the number of relevant parameters is regarded as very valuable. This fact has led to the development of several effective methods for parameter sensitivity analysis, represented in Sobol’ (Reference Sobol’1990, Reference Sobol’1993, Reference Sobol’2007), Homma and Saltelli (Reference Homma and Saltelli1996) and Saltelli (Reference Saltelli2002), as well as Saltelli et al. (Reference Saltelli, Chan and Scott2000, Reference Saltelli, Ratto, Andres, Campolongo, Cariboni, Gatelli, Saisana and Tarantola2008, Reference Saltelli, Chan and Scott2009, Reference Saltelli, Annoni, Azzini, Campolongo, Ratto and Tarantola2010) and Saltelli and Sobol’ (Reference Saltelli and Sobol’1995). It must be appreciated that parameter sensitivity depends on the particular QoI; parameter changes may strongly affect some QoI values but not affect other choices of QoIs at all.
The setting for parameter sensitivity analysis is as follows. For a given parametric model involving a set of parameters
 $\boldsymbol{\unicode[STIX]{x1D703}}=\{\unicode[STIX]{x1D703}_{1},\unicode[STIX]{x1D703}_{2},\ldots ,\unicode[STIX]{x1D703}_{m}\}$
, select an output function
 $Y(\boldsymbol{\unicode[STIX]{x1D703}})$
that represent a principal output of interest. The output function is thus a surrogate for the QoI, and indeed, when feasible, one can select
 $Y(\boldsymbol{\unicode[STIX]{x1D703}})$
to be the QoI:
 $Y(\boldsymbol{\unicode[STIX]{x1D703}})=\tilde{Q}(\unicode[STIX]{x1D703})=Q(u(\boldsymbol{\unicode[STIX]{x1D703}},S_{p}))$
,
 $S_{p}$
being the prediction scenario. The goal is to measure the sensitivity of
 $Y(\boldsymbol{\unicode[STIX]{x1D703}})$
to changes in components of
 $\boldsymbol{\unicode[STIX]{x1D703}}$
.
7.4.1 Morris’s method of elementary effects
A popular method of parameter sensitivity analysis is that of Morris (Reference Morris1991) as the method of elementary effects. The principal ideas behind the method are listed as follows.
(1)
We identify an output function
 $Y(\boldsymbol{\unicode[STIX]{x1D703}})=Y([\unicode[STIX]{x1D703}_{1},\unicode[STIX]{x1D703}_{2},\ldots ,\unicode[STIX]{x1D703}_{n}])$
which is an output model of the QoI and is a function of the
 $n$
-dimensional vector of parameters
 $\boldsymbol{\unicode[STIX]{x1D703}}$
.
(2)
We rescale each parameter
 $\unicode[STIX]{x1D703}_{i}$
to the unit interval
 $[0,1]$
.
(3)
We consider an
 $n$
-dimensional hypercube,
 $\unicode[STIX]{x03A9}^{n}=[0,1]^{n}$
, which we partition into
 $p^{n}$
cells,
 $p$
being an integer number
 ${>}2$
, such that each parameter domain
 $[0,1]$
is partitioned into bins
 $$\begin{eqnarray}\unicode[STIX]{x1D703}_{i}\sim [0,1]\sim \biggl[0,\displaystyle \frac{1}{p-1},\displaystyle \frac{1}{p-2},\ldots ,1\biggr].\end{eqnarray}$$
These bins
 $[1/(p-i),1/(p-i-1)]$
contain sample points from which Monte Carlo samples of
 $\unicode[STIX]{x1D703}_{i}$
will be selected. The bins are called the levels of the cube.
(4)
We introduce a sampling distribution
 $\unicode[STIX]{x1D70B}_{i}$
for each
 $\unicode[STIX]{x1D703}_{i}$
,
 $\unicode[STIX]{x1D70B}_{i}$
possibly denoting a prior density, or simply a uniform distribution assigned to all
 $\unicode[STIX]{x1D703}_{i}$
,
 $i=1,2,\ldots ,n$
.
(5)
We next choose a small number
 $\unicode[STIX]{x1D6FF}$
, for instance
 $\unicode[STIX]{x1D6FF}=p/(2(p-1))$
,
 $p\geq 2$
, and compute the elementary effect
 $EE_{i}$
by the difference approximations
 $$\begin{eqnarray}EE_{i}=\displaystyle \frac{Y(\unicode[STIX]{x1D703}_{1},\ldots ,\unicode[STIX]{x1D703}_{i-1,}\unicode[STIX]{x1D703}_{i}+\unicode[STIX]{x1D6FF},\unicode[STIX]{x1D703}_{i+1},\ldots ,\unicode[STIX]{x1D703}_{n})-Y(\boldsymbol{\unicode[STIX]{x1D703}})}{\unicode[STIX]{x1D6FF}},\quad 1\leq i\leq n.\end{eqnarray}$$
The
 $EE_{i}$
thus represent the change in the output due to a
 $\unicode[STIX]{x1D6FF}$
-perturbation in each parameter
 $\unicode[STIX]{x1D703}_{i}$
.
(6)
We now compute
 $EE_{i}^{j}$
of the output for random (Monte Carlo) samples taken from each bin. If the parameter distribution is not uniform, we sample quantiles in
 $[0,1]$
deriving input values from the inverse of the cumulative distribution function.
(7)
Now we must traverse through the hypercube doing sample paths, called trajectories, consisting of paths of
 $n+1$
orthogonal steps through
 $\unicode[STIX]{x03A9}^{n}$
defined as follows.
(a) Select a random starting point
$\boldsymbol{\unicode[STIX]{x1D703}}^{(1)}$
.(b) If
$\boldsymbol{\unicode[STIX]{x1D703}}_{i}$
denotes a set of unit coordinate vectors on the axes of the hypercube, select a new vector
$\boldsymbol{\unicode[STIX]{x1D703}}^{(2)}$
differing from
$\boldsymbol{\unicode[STIX]{x1D703}}^{(1)}$
in its
$i$
th component by
$\unicode[STIX]{x1D6FF}$
, with$$\begin{eqnarray}\boldsymbol{\unicode[STIX]{x1D703}}^{(2)}=\boldsymbol{\unicode[STIX]{x1D703}}^{(1)}\pm \boldsymbol{e}_{i}\unicode[STIX]{x1D6FF},\end{eqnarray}$$
$+$
or
$-$
taken such that
$\boldsymbol{\unicode[STIX]{x1D703}}^{(2)}\in \unicode[STIX]{x03A9}$
.(c) Continuing in this manner,
we finally get$$\begin{eqnarray}\boldsymbol{\unicode[STIX]{x1D703}}^{(3)}=\boldsymbol{\unicode[STIX]{x1D703}}^{(2)}\pm \boldsymbol{e}_{j}\unicode[STIX]{x1D6FF},\end{eqnarray}$$
This defines a trajectory$$\begin{eqnarray}\boldsymbol{\unicode[STIX]{x1D703}}^{(n+1)}=\boldsymbol{\unicode[STIX]{x1D703}}^{(n)}\pm \boldsymbol{e}_{k}\unicode[STIX]{x1D6FF}.\end{eqnarray}$$
$r$
through
$\unicode[STIX]{x03A9}^{n}$
. An example is provided in Figure 7.2.


An illustration of a two-dimensional hypercube (
 $n=2$
) with
 $p=6$
levels,
 $\unicode[STIX]{x1D6FF}=3/5$
, and a trajectory
 $r$
along
 $n+1=3$
sampling points:
 $\boldsymbol{\unicode[STIX]{x1D703}}^{(1)}$
,
 $\boldsymbol{\unicode[STIX]{x1D703}}^{(2)}$
,
 $\boldsymbol{\unicode[STIX]{x1D703}}^{(3)}$
.

(8)
Next, we compute the mean and variance of the elementary effects over
 $r$
trajectories, that is,
 $$\begin{eqnarray}\displaystyle \unicode[STIX]{x1D707}_{i} & = & \displaystyle \displaystyle \frac{1}{r}\mathop{\sum }_{j=1}^{r}EE_{i}^{j},\end{eqnarray}$$
 $$\begin{eqnarray}\displaystyle \unicode[STIX]{x1D70E}_{i}^{2} & = & \displaystyle \displaystyle \frac{1}{r-1}\mathop{\sum }_{j=1}^{r}(EE_{i}^{j}-\unicode[STIX]{x1D707}_{i})^{2}.\end{eqnarray}$$
Thus
 $\unicode[STIX]{x1D707}_{i}$
is the mean sensitivity and
 $\unicode[STIX]{x1D70E}_{i}^{2}$
is the variance of the
 $i$
th parameter sensitivity over
 $r$
trajectories. A common measure of the sensitivity assigned to parameter
 $i$
is
 $$\begin{eqnarray}\unicode[STIX]{x1D707}_{i}^{\ast }=\displaystyle \frac{1}{r}\mathop{\sum }_{j=1}^{r}|EE_{i}^{j}|.\end{eqnarray}$$
By laying out the numbers
 $\unicode[STIX]{x1D707}_{1}^{\ast },\unicode[STIX]{x1D707}_{2}^{\ast },\ldots ,\unicode[STIX]{x1D707}_{n}^{\ast }$
, we are able to estimate the relative sensitivity of the output to changes in the parameters. When a measure
 $\unicode[STIX]{x1D707}_{k}^{\ast }$
is regarded as very ‘small’ according to some preset tolerance, that parameter can be eliminated or set equal to a deterministic constant, this latter choice sometimes being made when sensitivities of other parameters are correlated with those of
 $\unicode[STIX]{x1D703}_{i}$
. We note that the sensitivity measures
 $\unicode[STIX]{x1D707}_{i}$
,
 $\unicode[STIX]{x1D70E}_{i}^{2}$
and
 $\unicode[STIX]{x1D707}_{i}^{\ast }$
depend on the number
 $r$
of trajectories. Presumably, these measures should converge to constants as
 $r\rightarrow \infty$
.
7.4.2 Variance-based sensitivities
The so-called variance-based sensitivity measure is advocated in several papers and books (e.g. Cukier et al. Reference Cukier, Fortuin, Shuler, Petschek and Schaibly1973, Sobol’ Reference Sobol’1993, Saltelli et al. Reference Saltelli, Chan and Scott2000). As in the case of the elementary effects measures, we construct an
 $n$
-dimensional unit hypercube
 $\unicode[STIX]{x03A9}^{n}=\{\unicode[STIX]{x1D703},~0\leq x_{i}\leq 1,~i=1,2,\ldots ,n\}$
and generate random (Monte Carlo) samples of the uncertain inputs
 $\unicode[STIX]{x1D703}_{1},\unicode[STIX]{x1D703}_{2},\ldots ,\unicode[STIX]{x1D703}_{n}$
from some prescribed distribution (generally uniform or Gaussian). Let
 $\boldsymbol{\unicode[STIX]{x1D703}}_{{\sim}i}$
denote the parameter vector which excludes the
 $i$
th component of
 $\boldsymbol{\unicode[STIX]{x1D703}}$
,
 $$\begin{eqnarray}\boldsymbol{\unicode[STIX]{x1D703}}_{{\sim}i}=(\unicode[STIX]{x1D703}_{1},\unicode[STIX]{x1D703}_{2},\ldots ,\unicode[STIX]{x1D703}_{i-1},\unicode[STIX]{x1D703}_{i+1},\ldots ,\unicode[STIX]{x1D703}_{n})^{T}\end{eqnarray}$$
We let
 $V_{i}(y|\boldsymbol{\unicode[STIX]{x1D703}}_{{\sim}i})$
denote the variance of the Monte Carlo sample of
 $Y$
evaluated at
 $\boldsymbol{\unicode[STIX]{x1D703}}_{{\sim}i}$
and let
 $\mathbb{E}_{\boldsymbol{\unicode[STIX]{x1D703}}_{{\sim}i}}[V_{i}(y|\boldsymbol{\unicode[STIX]{x1D703}}_{{\sim}i})]$
be the average over all such variances. Then the variance-based sensitivity of
 $\unicode[STIX]{x1D703}_{i}$
is defined by
 $$\begin{eqnarray}S_{Ti}=\displaystyle \frac{\mathbb{E}_{\boldsymbol{\unicode[STIX]{x1D703}}_{{\sim}i}}[V_{i}(y|\boldsymbol{\unicode[STIX]{x1D703}}_{{\sim}i})]}{V(Y)},\end{eqnarray}$$
where
 $V(Y)$
is the variance of the output function.
Generally, it is convenient to regard the output as being defined by a square-integrable function
 $f(\unicode[STIX]{x1D703})$
defined on the
 $n$
-dimensional hypercube
 $\unicode[STIX]{x03A9}^{n}$
. Then, to derive (7.12) we introduce the so-called Hoeffding decomposition of
 $f$
(Sobol’ Reference Sobol’1990, Reference Sobol’1993) and the conditional expectations
 $\mathbb{E}(Y|\unicode[STIX]{x1D703}_{i})$
to arrive at the following decomposition of the output variance:
 $$\begin{eqnarray}V(Y)=\mathop{\sum }_{i}V_{i}+\mathop{\sum }_{j}\mathop{\sum }_{j>i}V_{ij}+\cdots +V_{12\cdots m},\end{eqnarray}$$
where
 $$\begin{eqnarray}\displaystyle V_{i} & = & \displaystyle V(f_{i}(\unicode[STIX]{x1D703}_{i}))=V_{\unicode[STIX]{x1D703}_{i}}(\mathbb{E}_{\boldsymbol{\unicode[STIX]{x1D703}}_{{\sim}i}}(Y|\unicode[STIX]{x1D703}_{i})),\nonumber\\ \displaystyle V_{ij} & = & \displaystyle V(f_{ij}(\unicode[STIX]{x1D703}_{i},\unicode[STIX]{x1D703}_{j}))\nonumber\\ \displaystyle & = & \displaystyle V_{\unicode[STIX]{x1D703}_{i}\unicode[STIX]{x1D703}_{j}}(\mathbb{E}_{\boldsymbol{\unicode[STIX]{x1D703}}_{{\sim}i}}(Y|\unicode[STIX]{x1D703}_{i},\unicode[STIX]{x1D703}_{j}))-V_{\unicode[STIX]{x1D703}_{i}}(\mathbb{E}_{\boldsymbol{\unicode[STIX]{x1D703}}_{{\sim}i}}(Y|\unicode[STIX]{x1D703}_{i}))-V_{\unicode[STIX]{x1D703}_{j}}(\mathbb{E}_{\boldsymbol{\unicode[STIX]{x1D703}}_{{\sim}j}}(Y|\unicode[STIX]{x1D703}_{j})).\end{eqnarray}$$
Hence
 $V_{\unicode[STIX]{x1D703}_{i}}(\mathbb{E}_{\boldsymbol{\unicode[STIX]{x1D703}}_{{\sim}i}}(Y|\unicode[STIX]{x1D703}_{i}))$
and
 $\mathbb{E}_{\boldsymbol{\unicode[STIX]{x1D703}}_{{\sim}i}}(Y|\unicode[STIX]{x1D703}_{i},\unicode[STIX]{x1D703}_{j})$
are called first-order effects, and
 $V_{\unicode[STIX]{x1D703}_{i}\unicode[STIX]{x1D703}_{j}}(\mathbb{E}_{\boldsymbol{\unicode[STIX]{x1D703}}_{{\sim}i}}(Y|\unicode[STIX]{x1D703}_{i},\unicode[STIX]{x1D703}_{j}))$
are the effects of the pair
 $(\unicode[STIX]{x1D703}_{i},\unicode[STIX]{x1D703}_{j})$
on
 $V$
, etc. Details can be found in Homma and Saltelli (Reference Homma and Saltelli1996); see also the appendix of Farrell, Oden and Faghihi (Reference Farrell, Oden and Faghihi2015).
For certain cases,
 $Y$
depends on the interaction between different parameters
 $\unicode[STIX]{x1D703}_{i}$
and
 $\unicode[STIX]{x1D703}_{j}$
(
 $i\neq j$
). These are non-additive models. Then we divide (7.14) by
 $V(Y)$
to obtain sensitivity indices
 $S_{i},S_{ij},\ldots ,S_{1,2,\ldots ,m}$
, yielding
 $$\begin{eqnarray}\mathop{\sum }_{i}S_{i}+\mathop{\sum }_{i}\mathop{\sum }_{j>i}S_{ij}+\cdots +S_{1,2,\ldots ,m}=1.\end{eqnarray}$$
The total effective index can be derived from this property and (7.12), that is,
 $$\begin{eqnarray}\displaystyle S_{T_{i}} & = & \displaystyle \displaystyle \frac{\mathbb{E}_{\unicode[STIX]{x1D703}_{{\sim}i}}(V_{\unicode[STIX]{x1D703}_{i}}(Y|\unicode[STIX]{x1D703}_{i}))}{V(Y)}\nonumber\\ \displaystyle & = & \displaystyle 1-\displaystyle \frac{V_{\unicode[STIX]{x1D703}_{i}}(\mathbb{E}_{\unicode[STIX]{x1D703}_{{\sim}i}}(Y|\unicode[STIX]{x1D703}_{i}))}{V(Y)}.\end{eqnarray}$$
 $S_{T_{i}}$
measures the total contributions to the output variation in parameter
 $\unicode[STIX]{x1D703}_{i}$
. Algorithms based on Monte Carlo sampling for computing such indices are discussed in Saltelli (Reference Saltelli2002), Saltelli et al. (Reference Saltelli, Ratto, Andres, Campolongo, Cariboni, Gatelli, Saisana and Tarantola2008), Saltelli, Chan and Scott (Reference Saltelli, Chan and Scott2009) and Saltelli et al. (Reference Saltelli, Annoni, Azzini, Campolongo, Ratto and Tarantola2010); a slightly amended version is given in Farrell et al. (Reference Farrell, Oden and Faghihi2015).
7.4.3 Scatter plots
A generally convenient and often inexpensive qualitative way to visualize the sensitivity of outputs to parameter variations is through scatter plots, which involve clouds of points showing an output
 $Y(\boldsymbol{\unicode[STIX]{x1D703}})$
plotted against randomly chosen values of each parameter in a model. Examples are shown in Figure 7.3. The idea is to take random (Monte Carlo) samples of a uniform distribution of a parameter
 $\boldsymbol{\unicode[STIX]{x1D703}}_{i}$
and plot the corresponding
 $Y(\unicode[STIX]{x1D703}_{i})$
values over a two-dimensional domain. A parameter is considered to have a possibly important influence on
 $Y(\unicode[STIX]{x1D703})$
if the cloud exhibits a distinct pattern. A uniform cloud, or a cloud close to zero, suggests that the sensitivity of the output to changes in that particular parameter is small.
Parameters may have a significant influence on the output. The uniform distribution in (b) suggests an insensitivity of the outputs to the parameters. (Reprinted from Farrell et al. Reference Farrell, Oden and Faghihi2015 with permission from Elsevier.)

7.5 Design of validation experiments
The calculation of parameter sensitivities can provide an important tool in assessing the effectiveness of the design of the validation experimental scenario
 $S_{v}$
. When feasible, one computes parameter sensitivities for the output functions
 $Y(\boldsymbol{\unicode[STIX]{x1D703}})$
set equal to the QoI,
 $Q(\boldsymbol{\unicode[STIX]{x1D703}})$
, in the full prediction scenario
 $S_{p}$
. One then recomputes the sensitivity for a proposed validation scenario with
 $Y(\boldsymbol{\unicode[STIX]{x1D703}})$
set equal to the validation observables. If the validation sensitivities are not in good agreement with those for the full prediction scenario, then the validation experiments are ineffective and cannot determine parameters that inform the prediction of the QoI. Such comparisons of
 $S_{p}$
and
 $S_{v}$
sensitivities provide a useful indication of the effectiveness of the design of the validation experiments. In the same vein, comparing
 $S_{c}$
and
 $S_{p}$
sensitivities can also provide insight in designing calibration experiments.
7.6 An algorithm for sensitivity indices
Returning to (7.12), a Monte Carlo scheme to compute the indices with a reduced computational cost of evaluating multi-dimensional integrals is presented here, due to Faghihi in Farrell et al. (Reference Farrell, Oden and Faghihi2015) and inspired by Saltelli et al. (Reference Saltelli, Chan and Scott2000). The principal steps are as follows.
(1)
Generate two
 $N\times k$
independent sampling matrices,
 $\boldsymbol{A}$
and
 $\boldsymbol{B}$
, where each row is a sample point in the hyperspace of
 $k$
dimensions.
 $N$
is called a base sample with respect to the probability distributions of the input variables.
(2)
Define a matrix
 $\boldsymbol{D}_{i}$
formed by all columns of
 $\boldsymbol{A}$
except the
 $i$
th column, which is from
 $\boldsymbol{B}$
.
(3)
Compute the model outputs for all the matrices (i.e.
 $N\times 1$
vectors of model output):
 $$\begin{eqnarray}{\mathcal{Y}}_{A}=f(\boldsymbol{A}),\quad {\mathcal{Y}}_{B}=f(\boldsymbol{B}),\quad {\mathcal{Y}}_{D_{i}}=f(\boldsymbol{D}_{i})\end{eqnarray}$$
(4)
The total effect of indices can be estimated by
 $$\begin{eqnarray}S_{T_{i}}\approx 1-\displaystyle \frac{{\textstyle \frac{1}{N}}\mathop{\sum }_{j=1}^{N}{\mathcal{Y}}_{A}^{(j)}{\mathcal{Y}}_{D_{i}}^{(j)}-({\textstyle \frac{1}{N}}\mathop{\sum }_{j=1}^{N}{\mathcal{Y}}_{A}^{(j)})^{2}}{{\textstyle \frac{1}{N}}\mathop{\sum }_{j=1}^{N}{\mathcal{Y}}_{A}^{(j)}{\mathcal{Y}}_{A}^{(j)}-({\textstyle \frac{1}{N}}\mathop{\sum }_{j=1}^{N}{\mathcal{Y}}_{A}^{(j)})^{2}}.\end{eqnarray}$$
Relation (7.17) can be obtained by substituting the Monte Carlo estimators
 $$\begin{eqnarray}V_{\boldsymbol{\unicode[STIX]{x1D703}}_{{\sim}i}}[\mathbb{E}_{\unicode[STIX]{x1D703}_{i}}(Y|\unicode[STIX]{x1D703}_{{\sim}i})]\approx \displaystyle \frac{1}{N}\mathop{\sum }_{j=1}^{N}{\mathcal{Y}}_{A}^{(j)}{\mathcal{Y}}_{D_{i}}^{(j)}-\mathbb{E}^{2}(Y),\end{eqnarray}$$
along with
 $$\begin{eqnarray}V_{Y}=\mathbb{E}(Y^{2})-\mathbb{E}^{2}(Y)=\displaystyle \frac{1}{N}\mathop{\sum }_{j=1}^{N}{\mathcal{Y}}_{A}^{(j)}{\mathcal{Y}}_{A}^{(j)}-\biggl(\displaystyle \frac{1}{N}\mathop{\sum }_{j=1}^{N}{\mathcal{Y}}_{A}^{(j)}\biggr)^{2},\end{eqnarray}$$
into (7.12).
7.7 An example: coarse-grained models of atomistic systems
An example of the use of variance-based sensitivity analyses is found in comparison of parameter sensitivities for coarse-grained molecular models of atomistic systems in thermodynamic equilibrium. We know that all matter in our universe is made up of atoms. Atoms are characterized according to their number of electrons, atomic mass, number of neutrons, etc., and are tabulated in the well-known Periodic Table of modern chemistry and physics, there being some 118 distinct atomic structures currently known. In classical models of atomic systems, atoms are considered to be point masses in motion due to the action of forces, and their locations with respect to a fixed origin are given by the generalized coordinate vectors
 $\boldsymbol{r}$
,
 $i=1,2,\ldots ,n$
, with
 $n$
being the number of atoms. We let
 $\boldsymbol{p}_{i}$
denote the momentum vector associated with the
 $i$
th atom. The motion of such an atomistic system is governed by Hamilton’s equations,
 $$\begin{eqnarray}\dot{\boldsymbol{r}}_{i}=+\displaystyle \frac{\unicode[STIX]{x2202}H}{\unicode[STIX]{x2202}\boldsymbol{p}_{i}},\quad \dot{\boldsymbol{p}}_{i}=-\displaystyle \frac{\unicode[STIX]{x2202}H}{\unicode[STIX]{x2202}\boldsymbol{r}_{i}},\end{eqnarray}$$
with
 $1\leq i\leq n$
, and the Hamiltonian
 $H$
is given by
 $$\begin{eqnarray}H(\boldsymbol{r},\boldsymbol{p})=\mathop{\sum }_{i}\displaystyle \frac{\boldsymbol{p}_{i}\cdot \boldsymbol{p}_{i}}{2m_{i}}+V(\boldsymbol{r}),\end{eqnarray}$$
where
 $m_{i}$
is the mass of particle
 $i$
and
 $V(\boldsymbol{r})=V(\boldsymbol{r}_{1},\boldsymbol{r}_{1},\ldots ,\boldsymbol{r}_{n})$
is the force potential. A typical model for the potential
 $V(\cdot )$
(employed, for example, in the molecular dynamics code LAMMPS: Plimpton Reference Plimpton1995) is of the form
 $$\begin{eqnarray}V(\boldsymbol{r})=V_{bond}(\boldsymbol{r})+V_{angle}(\boldsymbol{r})+V_{dihedral}(\boldsymbol{r})+V_{non-local}(\boldsymbol{r})+V_{coulomb}(\boldsymbol{r}),\end{eqnarray}$$
where
 $$\begin{eqnarray}\displaystyle V_{bond}(\boldsymbol{r}) & = & \displaystyle \mathop{\sum }_{i=1}^{N_{b}}\displaystyle \frac{1}{2}k_{ri}(\boldsymbol{r}_{i}-\boldsymbol{r}_{0i})^{2},\end{eqnarray}$$
 $$\begin{eqnarray}\displaystyle V_{angle}(\boldsymbol{r}) & = & \displaystyle \mathop{\sum }_{i=1}^{N_{a}}\displaystyle \frac{1}{2}k_{\unicode[STIX]{x1D703}_{i}}(\unicode[STIX]{x1D703}_{i}-\unicode[STIX]{x1D703}_{0i})^{2},\end{eqnarray}$$
 $$\begin{eqnarray}\displaystyle V_{dihedral}(\boldsymbol{r}) & = & \displaystyle \mathop{\sum }_{i=1}^{N_{d}}\mathop{\sum }_{n=1}^{4}\displaystyle \frac{V_{n}i}{2}[1+(-1)^{n-1}\cos (n\unicode[STIX]{x1D719}_{i})],\end{eqnarray}$$
 $$\begin{eqnarray}\displaystyle V_{non\text{-}local}(\boldsymbol{r}) & = & \displaystyle \mathop{\sum }_{i=1}^{N_{nl}}\mathop{\sum }_{j>i}4\unicode[STIX]{x1D716}_{ij}\biggl[\biggl(\displaystyle \frac{\unicode[STIX]{x1D70E}_{ij}}{r_{ij}}\biggr)^{\unicode[STIX]{x1D6FC}}-\biggl(\displaystyle \frac{\unicode[STIX]{x1D70E}_{ij}}{r_{ij}}\biggr)^{\unicode[STIX]{x1D6FD}}\biggr],\quad r_{ij}\leq r_{c},\end{eqnarray}$$
 $$\begin{eqnarray}\displaystyle V_{coulomb}(\boldsymbol{r}) & = & \displaystyle \mathop{\sum }_{i=1}^{N_{q}-1}\mathop{\sum }_{j>i}^{N_{q}}4\unicode[STIX]{x1D716}_{0}\biggl[\displaystyle \frac{q_{i}q_{j}}{r_{ij}}\biggr].\end{eqnarray}$$
Here
 $V_{bond}$
represents, in general, covalent bonds between atoms with bonding constants
 $k_{ri}$
,
 $V_{angle}$
is the potential energy due to change in angles between successive bonding lengths between atoms, the dihedral angle
 $\unicode[STIX]{x1D719}_{i}$
between consecutive links,
 $V_{non-local}$
denotes Lennard-Jones-type potentials, generally with
 $\unicode[STIX]{x1D6FC}=6$
,
 $\unicode[STIX]{x1D6FD}=12$
or perhaps
 $\unicode[STIX]{x1D6FC}=6$
,
 $\unicode[STIX]{x1D6FD}=9$
, and
 $V_{coulomb}$
is the coulomb potential for discrete charges
 $q_{i}$
and
 $q_{j}$
at coordinates
 $\boldsymbol{r}_{i}$
and
 $\boldsymbol{r}_{j}$
, respectively, with
 $r_{ij}=\Vert \boldsymbol{r}_{j}-\boldsymbol{r}_{i}\Vert$
. Here in (7.23) and (7.24),
 $\boldsymbol{r}_{0i}$
and
 $\unicode[STIX]{x1D703}_{0i}$
are the original coordinate parameters assumed to be given in the initial configuration of the system,
 $\unicode[STIX]{x1D719}_{i}$
in (7.25) is a torsional degree of freedom, and
 $\Vert \cdot \Vert$
is the Euclidean norm.
(a) Coarse-graining of an all-atom system. (b) Different choices of AA-to-CG map
 $G$
. (c) Different choices of intermolecular force fields
 $V$
, for each map
 $G$
. (Reprinted from Farrell et al. Reference Farrell, Oden and Faghihi2015 with permission from Elsevier.)

In most molecular dynamics applications, the momentum vectors are equated to the Newtonian momentum,
 $\boldsymbol{p}_{i}=m_{i}\dot{\boldsymbol{r}}_{i}$
, and (7.20) reduces to (generally huge) systems of nonlinear second-order differential equations describing a Newtonian model for the all-atom (AA) system. Because of the enormous size and complexity of such systems, it is standard practice to construct coarse-grained (CG) approximations of the system, obtained by aggregating groups of atoms into
 $N$
super atoms or molecules, thereby dramatically reducing the size of the model. This results in a large class
 ${\mathcal{M}}$
of models with the atom coordinates replaced by molecular coordinates
 $\boldsymbol{R}_{I}$
,
 $I=1,2,\ldots ,N\ll n$
, and with a force potential of the same form, but with parameters
 $$\begin{eqnarray}\boldsymbol{\unicode[STIX]{x1D703}}=\{K_{Ri},R_{0i},K_{\unicode[STIX]{x1D703}i},V_{Ni},\unicode[STIX]{x1D716}_{ii},\unicode[STIX]{x1D70E}_{ij}\},\quad 1\leq i\leq N,\end{eqnarray}$$
wherein we ignore coulomb-charge effects. A major problem with this very classical and often used process of coarse-graining is that a given AA configuration, which we assume is the truth to simplify the analysis, can be segregated into many possible CG configurations, as indicated in the map
 $G:AA\rightarrow CG$
illustrated in Figure 7.4, and for each choice of a CG model, then are numerous choices of force potential, each choice with different sets of parameters.
In Farrell et al. (Reference Farrell, Oden and Faghihi2015), this problem was taken up for specific applications involving modelling the stretching of a polyethylene chain, in constant volume and temperature (
 $T=100~\text{K}$
), consisting of 12 ‘beads’ (molecules) with two carbon atoms per bead. The model involved 12 parameters, each assigned a uniform distribution:
 $$\begin{eqnarray}\displaystyle R_{0}\sim {\mathcal{U}}(0.1,5),\quad K_{R}\sim {\mathcal{U}}(0.1,90), & & \displaystyle \nonumber\\ \displaystyle \unicode[STIX]{x1D703}_{0}\sim {\mathcal{U}}(80,100),\quad K_{\unicode[STIX]{x1D703}}\sim {\mathcal{U}}(0,15), & & \displaystyle \nonumber\\ \displaystyle V_{1}\sim {\mathcal{U}}(-1,1),\quad V_{2}\sim {\mathcal{U}}(-1,1), & & \displaystyle \nonumber\\ \displaystyle V_{1}\sim {\mathcal{U}}(-1,1),\quad V_{2}\sim {\mathcal{U}}(-1,1), & & \displaystyle \nonumber\\ \displaystyle \unicode[STIX]{x1D70E}\sim {\mathcal{U}}(0.05,7),\quad \unicode[STIX]{x1D716}\sim {\mathcal{U}}(0.01,5). & & \displaystyle \nonumber\end{eqnarray}$$
The goal is to estimate the total sensitivity indices for each parameter with respect to the output function
 $$\begin{eqnarray}Y(\boldsymbol{\unicode[STIX]{x1D703}})=\langle V(\boldsymbol{\unicode[STIX]{x1D703}},G_{1})\rangle -\langle V(\boldsymbol{\unicode[STIX]{x1D703}},G_{2})\rangle ,\end{eqnarray}$$
where
 $G_{0}$
denotes the initial configuration of the chain and
 $G$
is the map defining the configurations attained by applying a force to one end of the chain while keeping the other end constrained.
Bar charts illustrating the results of the sensitivity analysis using total sensitivity indices for the deformation of the polyethylene chain using
 $20\,000$
Monte Carlo samples of the parameter space. (Reprinted from Farrell et al. Reference Farrell, Oden and Faghihi2015 with permission from Elsevier.)

Scatter plots illustrating a quantitative sensitivity analysis for the polyethylene chain using
 $40\,000$
Monte Carlo samples of the parameter space. The observable is the change in potential energy as the chain is deformed. (Reprinted from Farrell et al. Reference Farrell, Oden and Faghihi2015 with permission from Elsevier.)

Comparison between the kernel density estimates of the change in potential energy resulting from the deformation of a polyethylene chain for the cases when dihedral and angle parameters are excluded from calculations. Results show 500 Monte Carlo samples of the parameter space. (Reprinted from Farrell et al. Reference Farrell, Oden and Faghihi2015 with permission from Elsevier.)

We use (7.12) to compute the total sensitivities of each of these 12 parameters. Results are presented in Figure 7.5, which is reproduced from that in Farrell et al. (Reference Farrell, Oden and Faghihi2015). Scatter plots of some parameters are given in Figure 7.6. From these results we observe that the sensitivities of the dihedral parameters are much smaller than those of other parameters, and we conjecture that by omitting them altogether, the values of the output
 $Y(\boldsymbol{\unicode[STIX]{x1D703}})$
will not change appreciably. To confirm the conjecture, we compute the same output functions except that the dihedral parameters are omitted. Figure 7.7 shows the results of these different models: (i) the full model with covalent bonds, angles, dihedrals and Lennard-Jones terms, (ii) the model without dihedrals (i.e. only with bonds, angles and Lennard-Jones terms), and (iii) the model with bonds, dihedral and Lennard-Jones terms. We observe that by eliminating the parameters with lowest sensitivities (the dihedrals), the distributions of the output is essentially unchanged. Hence, we have confirmed that Jeffreys’ advice pays off excellently.
PART 3: Adaptive modelling: model selection, OPAL and adaptive control of multiscale models
8
${\mathcal{M}}$
uncertainty

8.1 Model selection
There are several Bayesian motivated procedures in the literature for comparing the suitability of models (e.g. Bayes factors, Occam factors, BIC = Bayesian Information Criterion), but the ‘gold standard’ approach focuses on the posterior model evidence or, equivalently, weighted evidence called posterior model plausibilities. Chow (Reference Chow1981) attributes the ideas to the works of Jeffreys (Reference Jeffreys1939, Reference Jeffreys1961, Reference Jeffreys1998). The idea of computing model plausibilities appears to have been abandoned for many years owing to the complexity of computing integrals of the distributions in marginalization of the product of the likelihood and prior, but these concerns appear to have been set aside with the advent of modern parallel computers and efficient sampling algorithms. The notion of plausibilities (or the building blocks, model evidences) has been revived in the work by Beck and co-workers (Beck and Yuen Reference Beck and Yuen2004, Beck Reference Beck2010, Beck and Taflanidis Reference Beck and Taflanidis2013) and others (Farrell et al. Reference Farrell, Oden and Faghihi2015, Prudencio and Schulz Reference Prudencio, Schulz and Alexander2011).
The frequentist work in this area follows the work of Akaike (Reference Akaike1974, Reference Akaike, Mehra and Lainiotis1976, Reference Akaike and Krishnaiah1977, Reference Akaike, Parzen, Tanabe and Kitagawa1998) and its various generalizations (Hurvich and Tsai Reference Hurvich and Tsai1989, Lebreton, Burnham, Clobert and Anderson Reference Lebreton, Burnham, Clobert and Anderson1992, Schwarz Reference Schwarz1978). A readable account of these latter approaches is found in Burnham and Anderson (Reference Burnham and Anderson2002) and in Konishi and Kitagawa (Reference Konishi and Kitagawa2008).
In the sections that follow, we introduce the theory of posterior model plausibilities and we outline an introduction to the information-theoretic and frequentist methods of Akaike and others. We then describe a general framework for model selection and model validation embodied in OPAL – the Occam Plausibility Algorithm – introduced and implemented in Farrell et al. (Reference Farrell, Oden and Faghihi2015) and Oden et al. (Reference Oden, Babuška, Faghihi, Stein, de Borst and Hughes2018), which brings together most of the tools and concepts presented thus far: model calibration, validation, parameter sensitivity, model plausibility, model inadequacy and prediction of the QoIs.
At this point, we have considered Bayesian and entropy-information theoretic approaches to address several of the major sources of uncertainty, including
 ${\mathcal{P}}$
uncertainty and
 ${\mathcal{Y}}$
and
 $\unicode[STIX]{x1D703}$
uncertainties. What remains is one of the most important problems in predictive science:
 ${\mathcal{M}}$
uncertainty, uncertainty in the selection of the centrepiece of prediction, the model used to make the prediction.
For many years, the community of scientists and engineers were taught that model selection was the province of experienced practitioners who had earned the privilege of selecting mathematical models based on divine-given judgement, discounting that the models selected often delivered poor predictions of the observed events. Or more commonly, very classical models of mechanics and physics were morphed and distorted and ultimately used to model events far outside the original domains of the textbook applications. In the meantime, the statistics world was concerned about model selection and methods to guide selection, but most of the time only in a limited sense of calculating likelihoods for regression calculations or low-dimensional approximations.
In more recent times, the theory and methodology of model selection has taken strides forward with the advent of modern computing capabilities and modern algorithms for implementing methods based on Bayesian inference and information theory. In this section, two classes of methods for model selection are discussed, one based on Bayesian ideas involving the notion of posterior model plausibilities, and the other based on frequentist notions, information theory and relative entropy.
8.2 Bayesian model plausibilities
The idea of Bayesian a posteriori model plausibilities embodies a rigorous and systematic basis for model selection, given fixed observational data. The setting is as follows: for a given scenario
 $S\in \{S_{c},S_{v},S_{p}\}$
and given data
 $\boldsymbol{y}\in {\mathcal{Y}}_{S}$
, we have a collection of
 $m$
possible models that are proposed to predict
 $\boldsymbol{y}$
, each characterized by a forward problem
 $A_{j}(\boldsymbol{\unicode[STIX]{x1D703}}_{j},S_{;}u(\boldsymbol{\unicode[STIX]{x1D703}}_{j},S))=0$
,
 $j=1,2,\ldots ,m$
, each model having its own parameters and parameter space,
 $\boldsymbol{\unicode[STIX]{x1D703}}_{j}\in \unicode[STIX]{x0398}_{j}$
. We simplify notation by writing simply
 ${\mathcal{P}}_{j}$
or
 ${\mathcal{P}}_{j}(\boldsymbol{\unicode[STIX]{x1D703}}_{j})$
for model
 $j$
, and we denote by
 ${\mathcal{M}}$
the set of
 $m$
such models:
 ${\mathcal{M}}=\{{\mathcal{P}}_{1}(\boldsymbol{\unicode[STIX]{x1D703}}_{1}),\ldots ,{\mathcal{P}}_{m}(\boldsymbol{\unicode[STIX]{x1D703}}_{m})\}$
. For each model
 ${\mathcal{P}}_{j}$
a prior
 $\unicode[STIX]{x1D70B}(\boldsymbol{\unicode[STIX]{x1D703}}_{j}|S)$
is assumed to be specified.
Next, we simply write down Bayes’ rule, now acknowledging that we have additional information, namely that the models
 ${\mathcal{P}}_{j}(\boldsymbol{\unicode[STIX]{x1D703}}_{j})$
are known and that they belong to the set
 ${\mathcal{M}}$
. Thus, invoking Jaynes’ principle, that to be honest we must use ‘all of the evidence we have, not just some arbitrarily chosen subset of it’, we rewrite Bayes’ rule as
 $$\begin{eqnarray}\unicode[STIX]{x1D70B}(\boldsymbol{\unicode[STIX]{x1D703}}_{j}|\boldsymbol{y},{\mathcal{P}}_{j},{\mathcal{M}},S)=\displaystyle \frac{\unicode[STIX]{x1D70B}(\boldsymbol{y}|\boldsymbol{\unicode[STIX]{x1D703}}_{j},{\mathcal{P}}_{j},{\mathcal{M}},S)}{\unicode[STIX]{x1D70B}(\boldsymbol{y}|{\mathcal{P}}_{j},{\mathcal{M}},S)}\unicode[STIX]{x1D70B}(\boldsymbol{\unicode[STIX]{x1D703}}_{j}|{\mathcal{P}}_{j},{\mathcal{M}},S),\quad 1\leq j\leq m.\end{eqnarray}$$
The denominator is the model evidence, and it is now much more than just a normalization term, playing a key role in the analyses. It must be the marginalization of the numerator,
 $$\begin{eqnarray}\unicode[STIX]{x1D70B}(\boldsymbol{y}|{\mathcal{P}}_{j},{\mathcal{M}},S)=\int _{\unicode[STIX]{x0398}_{j}}\unicode[STIX]{x1D70B}(\boldsymbol{y}|\boldsymbol{\unicode[STIX]{x1D703}}_{j},{\mathcal{P}}_{j},{\mathcal{M}},S)\unicode[STIX]{x1D70B}(\boldsymbol{\unicode[STIX]{x1D703}}_{j}|{\mathcal{P}}_{j},{\mathcal{M}},S)\text{d}\boldsymbol{\unicode[STIX]{x1D703}}_{j},\quad 1\leq j\leq m.\end{eqnarray}$$
A key observation at this point is that the evidence in (8.2) has the form of a likelihood for a second-level Bayesian inference for the finite-dimensional problems of selection models from the set
 ${\mathcal{M}}$
. In particular, we write
 $$\begin{eqnarray}\unicode[STIX]{x1D70C}_{j}=\unicode[STIX]{x1D70B}(\boldsymbol{y}|{\mathcal{P}}_{j},{\mathcal{M}},S)=\displaystyle \frac{\unicode[STIX]{x1D70B}(\boldsymbol{y}|\boldsymbol{\unicode[STIX]{x1D703}}_{j},{\mathcal{P}}_{j},{\mathcal{M}},S)\unicode[STIX]{x1D70B}(\boldsymbol{\unicode[STIX]{x1D703}}_{j}|{\mathcal{P}}_{j},{\mathcal{M}},S)}{\unicode[STIX]{x1D70B}(\boldsymbol{y}|{\mathcal{M}},S)},\end{eqnarray}$$
where
 $\unicode[STIX]{x1D70B}(\boldsymbol{y}|{\mathcal{M}},S)$
is a normalizing factor chosen so that
 $$\begin{eqnarray}\mathop{\sum }_{j=1}^{m}\unicode[STIX]{x1D70C}_{j}=1.\end{eqnarray}$$
The model (or models) in
 ${\mathcal{M}}$
with plausibilities closest to unity are regarded as the most plausible in
 ${\mathcal{M}}$
for given
 $\boldsymbol{y}$
and
 $S$
.
The plausibilities are seen to be weighted model evidences, with weights equal to the prior
 $\unicode[STIX]{x1D70B}(P_{j}|{\mathcal{M}},S)$
. In the case of
 $m$
models thought to be equally plausible prior to the calculation of evidence, they may simply be set equal to
 $1/m$
.
We remark that a model
 ${\mathcal{P}}_{j}$
may be the most plausible in a set
 ${\mathcal{M}}$
given
 $\boldsymbol{y}$
, but it may be invalid according to specific validation metric and tolerances: model validity and model plausibility are thus two different characteristics of parametric models.
8.3 Frequentist approaches: the Akaike Information Criterion and others
Methods for model selection based on frequentist arguments or more appropriately, on information theories, are often derived on the notion of information lost when a model
 ${\mathcal{P}}_{j}(\boldsymbol{\unicode[STIX]{x1D703}}_{j})\in {\mathcal{M}}$
deviates from the ‘true’ distribution (
 $\boldsymbol{G}$
or
 $g$
): the best models deliver parameters that define likelihoods closest to the truth. The Akaike methods or their generalizations, introduced in Akaike (Reference Akaike1974) and expanded in Akaike (Reference Akaike, Mehra and Lainiotis1976, Reference Akaike and Krishnaiah1977, Reference Akaike, Parzen, Tanabe and Kitagawa1998), are based on this concept.
Once again, given a set
 ${\mathcal{M}}$
of models
 ${\mathcal{P}}_{1}(\boldsymbol{\unicode[STIX]{x1D703}}_{1}),\ldots ,{\mathcal{P}}_{m}(\boldsymbol{\unicode[STIX]{x1D703}}_{m})$
and likelihood densities
 $\unicode[STIX]{x1D70B}(\boldsymbol{y}|\boldsymbol{\unicode[STIX]{x1D703}}_{j},S)$
,
 $1\leq j\leq m$
, the information lost,
 $I_{j}(g,\unicode[STIX]{x1D70B})$
, when model
 ${\mathcal{P}}_{j}$
is used to approximate the truth
 $\boldsymbol{g}$
is given by the
 $D_{KL}$
-divergence,
 $$\begin{eqnarray}\displaystyle I_{j}(g,\unicode[STIX]{x1D70B}) & = & \displaystyle D_{KL}(g\Vert \unicode[STIX]{x1D70B}(\cdot |\boldsymbol{\unicode[STIX]{x1D703}}_{j},S))\nonumber\\ \displaystyle & = & \displaystyle \left\{\begin{array}{@{}ll@{}}\displaystyle \int _{{\mathcal{Y}}_{S}}g(\boldsymbol{y})\log \displaystyle \frac{g(\boldsymbol{y})}{\unicode[STIX]{x1D70B}(\boldsymbol{y}|\boldsymbol{\unicode[STIX]{x1D703}}_{j},S)}\text{d}\boldsymbol{y}\quad & \text{for the continuous case,}\\ \displaystyle \mathop{\sum }_{i=1}^{n}g_{i}\log g_{i}/\unicode[STIX]{x1D70B}_{i}\quad & \text{for the discrete case,}\end{array}\right.\end{eqnarray}$$
for
 $1\leq j\leq m$
.
The loss is minimized for each model
 ${\mathcal{P}}_{j}$
by choosing parameters
 $\boldsymbol{\unicode[STIX]{x1D703}}_{j}$
to be the MLE:
 $\hat{\boldsymbol{\unicode[STIX]{x1D703}}}(\boldsymbol{y})=\operatorname{argmax}_{\boldsymbol{\unicode[STIX]{x1D703}}\in \unicode[STIX]{x0398}}\;\log \unicode[STIX]{x1D70B}(\boldsymbol{y}|\boldsymbol{\unicode[STIX]{x1D703}},S)$
. The number
 $A_{j}$
representing the information lost when model
 ${\mathcal{P}}_{j}$
is averaged over samples
 $\boldsymbol{x}$
and
 $\boldsymbol{y}$
is given by
 $$\begin{eqnarray}\displaystyle A_{j} & = & \displaystyle \mathbb{E}_{\boldsymbol{x}}\mathbb{E}_{\boldsymbol{y}}[\log (\unicode[STIX]{x1D70B}(\boldsymbol{x}|\hat{\boldsymbol{\unicode[STIX]{x1D703}}}_{j}(\boldsymbol{y}),S))]\nonumber\\ \displaystyle & = & \displaystyle \int _{{\mathcal{Y}}_{S}}\int _{{\mathcal{Y}}_{S}}g(\boldsymbol{x})g(\boldsymbol{y})\log \unicode[STIX]{x1D70B}(\boldsymbol{x}|\hat{\boldsymbol{\unicode[STIX]{x1D703}}}_{j}(\boldsymbol{y}),S)\text{d}\boldsymbol{x}\text{d}\boldsymbol{y},\quad 1\leq j\leq m.\end{eqnarray}$$
Akaike (Reference Akaike1974) derived approximations of
 $A_{j}$
to reduce the complexity of computations, in which it is assumed that the log-likelihood is twice differentiable with respect to the parameters, that the sample
 $\boldsymbol{y}=\{\boldsymbol{y}_{1},\ldots ,\boldsymbol{y}_{n}\}$
is large enough that asymptotic properties valid as
 $n\rightarrow \infty$
hold, and that the sequence of MLEs
 $\hat{\boldsymbol{\unicode[STIX]{x1D703}}_{j}}(\boldsymbol{n})$
taken for sample size
 $n$
converge to the
 $D_{KL}$
-minimizer
 $\boldsymbol{\unicode[STIX]{x1D703}}_{j}^{\ast }$
. Under such assumptions, the number
 $A_{j}$
can be replaced by the computable Akaike Information Criterion
 $$\begin{eqnarray}AIC_{j}(\boldsymbol{y})=-2\log (\unicode[STIX]{x1D70B}(\boldsymbol{y}|\hat{\boldsymbol{\unicode[STIX]{x1D703}}_{j}},S))+2k_{j},\quad 1\leq j\leq m,\quad \boldsymbol{y}\in {\mathcal{Y}}_{S},\end{eqnarray}$$
where
 $k_{j}$
is the number of parameters in model
 ${\mathcal{P}}_{j}$
, the best model in
 ${\mathcal{M}}$
being that with the smallest
 $AIC_{j}(\boldsymbol{y})$
.
8.4 Akaike weights
In applications of the AIC, the actual
 $AIC_{j}$
values are of little use: what one wishes to determine are the relative merits of various models as measured by the relative criteria
 $$\begin{eqnarray}\unicode[STIX]{x1D6E5}_{j}=AIC_{j}-AIC_{\min },\quad 1\leq j\leq m.\end{eqnarray}$$
The best model among the set of all models has a relative value
 $\unicode[STIX]{x1D6E5}^{\ast }=\unicode[STIX]{x1D6E5}_{\min }=\min \{\unicode[STIX]{x1D6E5}_{j}\}_{j=1}^{m}$
. It is useful to transform the AIC relative values
 $\unicode[STIX]{x1D6E5}_{j}$
into a model probability by setting them proportional to (minus one-half of) a log-likelihood:
 $\log \unicode[STIX]{x1D70B}_{\text{like}_{j}}\propto (-\unicode[STIX]{x1D6E5}_{j}/2)$
. Then we can define the model probabilities by the Akaike weights:
 $$\begin{eqnarray}W_{j}=\displaystyle \frac{\exp (-{\textstyle \frac{1}{2}}\unicode[STIX]{x1D6E5}_{j})}{\mathop{\sum }_{k=1}^{m}\exp (-{\textstyle \frac{1}{2}}\unicode[STIX]{x1D6E5}_{k})}.\end{eqnarray}$$
Clearly,
 $$\begin{eqnarray}\mathop{\sum }_{k=1}^{m}W_{k}=1.\end{eqnarray}$$
The weight
 $W_{j}$
is clearly the weight of evidence in favour of
 ${\mathcal{P}}_{j}$
, and the highest corresponds to the best model.
Several investigators have proposed generalizations of the AIC. For example, the ‘second-order’ AIC for small sample size has been proposed by Hurvich and Tsai (Reference Hurvich and Tsai1989):
 $$\begin{eqnarray}\displaystyle AIC_{cj}(\boldsymbol{y}) & = & \displaystyle -2\log (\unicode[STIX]{x1D70B}(\boldsymbol{y}|\boldsymbol{\unicode[STIX]{x1D703}}_{j},S))\nonumber\\ \displaystyle & & \displaystyle +\,2k_{j}+\displaystyle \frac{2k_{j}(1+k_{j})}{n-k_{j}-1}\nonumber\\ \displaystyle & = & \displaystyle AIC_{j}(\boldsymbol{y})+\displaystyle \frac{2k_{j}(1+k_{j})}{n-k_{j}+1},\end{eqnarray}$$
 $n$
being the sample size. Another measure has been proposed in Lebreton et al. (Reference Lebreton, Burnham, Clobert and Anderson1992) when data are ‘overdispersed’. Then, instead of
 $AIC_{j}(\boldsymbol{y})$
, one uses
 $$\begin{eqnarray}QAIC_{j}(\boldsymbol{y})=-2\log [\unicode[STIX]{x1D70B}(\boldsymbol{y}|\hat{\boldsymbol{\unicode[STIX]{x1D703}}},S)/{\hat{C}}]+2k_{j}\end{eqnarray}$$
where
 ${\hat{C}}$
is the ratio of the chi-squared statistic
 $\unicode[STIX]{x1D712}^{2}$
and its number of degrees of freedom. A small-sample version of this estimator,
 $QAIC_{cj}(\boldsymbol{y})$
, analogous to (8.11), can be obtained by replacing
 $AIC_{j}(\boldsymbol{y})$
in (8.11) with
 $QAIC_{j}(\boldsymbol{y})$
. See Burnham and Anderson (Reference Burnham and Anderson2002) for additional details.
8.5 OPAL: the Occam Plausibility Algorithm
The various procedures and principles for model selection, calibration and validation presented up to this point can be implemented sequentially in a systematic process we refer to as OPAL, the Occam Plausibility Algorithm. It was introduced in Farrell et al. (Reference Farrell, Oden and Faghihi2015) and has been discussed and implemented in, for example, Oden et al. (Reference Oden, Babuška, Faghihi, Stein, de Borst and Hughes2018). The label ‘Occam’ derives from Occam’s razor, the ‘principle’ that one should use the ‘simplest’ theory or model among competing models that lead to essentially the same prediction. Since ‘simplest’ is a rather subjective label, various measures of simplicity could be conceived. Influenced by model selection criteria such as AIC, we chose as starting point the number
 $k_{j}$
of parameters of a model
 ${\mathcal{P}}_{j}$
as a rough measure of its simplicity.
Let us assume that we wish to predict a target QoI representing a specific physical reality, and that we have access to experimental facilities that could provide calibration data. Among many possible computational models we might consider for the prediction, which are valid and most plausible given data are unknown. The steps underlying OPAL are as follows.
(1) Initialization.
As discussed in the preceding sections, a set
 ${\mathcal{M}}$
of
 $m$
possible models is selected for predicting the QoI:
 $$\begin{eqnarray}{\mathcal{M}}=\{{\mathcal{P}}_{1}(\boldsymbol{\unicode[STIX]{x1D703}}_{1}),{\mathcal{P}}_{2}(\boldsymbol{\unicode[STIX]{x1D703}}_{2}),\ldots ,{\mathcal{P}}_{m}(\boldsymbol{\unicode[STIX]{x1D703}}_{m})\},\end{eqnarray}$$
each model having its own parameter space (
 $\boldsymbol{\unicode[STIX]{x1D703}}_{k}\in \unicode[STIX]{x0398}_{k}$
). The models in
 ${\mathcal{M}}$
may be diverse or closely related, some sharing the same types of parameter.
(2) Sensitivity analysis.
For each model class
 ${\mathcal{P}}(\boldsymbol{\unicode[STIX]{x1D703}}_{j})$
we compute parameter sensitivities using techniques described in Section 6.3 for the prediction scenario
 $S_{p}$
. We follow the advice of Jeffreys (Reference Jeffreys1998, p. 414): ‘Parameters in a law that make no contribution to the results of any observation can be eliminated mathematically, leaving the observations to be described only in terms of the relevant parameters.’ We make a small amendment to this idea: if
 $\boldsymbol{\unicode[STIX]{x1D703}}_{k}$
is the vector of insensitive parameters, we set it equal to zero only if
 $\mathbf{0}\in \unicode[STIX]{x0398}_{k}$
. Otherwise it is assigned a constant (deterministic) value.
Using an appropriate tolerance, only those model classes are retained that contain parameters to which the output is sensitive, as indicated by the relative value of the sensitivity measures deduced in Section 6.3 (and those eliminated for which
 $\mathbf{0}\not \in \unicode[STIX]{x0398}_{k}$
). This results in a reduced set
 $\bar{{\mathcal{M}}}$
of model classes:
 $$\begin{eqnarray}\bar{{\mathcal{M}}}=\{\bar{{\mathcal{P}}_{1}}(\boldsymbol{\unicode[STIX]{x1D703}}_{1}),\bar{{\mathcal{P}}_{2}}(\boldsymbol{\unicode[STIX]{x1D703}}_{2}),\ldots ,\bar{{\mathcal{P}}_{l}}(\boldsymbol{\unicode[STIX]{x1D703}}_{l})\},\quad l\leq m.\end{eqnarray}$$
It is noted that the choice of the number of parameters as the basis for identifying model categories implicitly assumed that the parameters are uncorrelated and independent, which may not always be the case. Furthermore, the implementation of a parameter sensitivity analysis, with scatter plots, can often reveal such dependencies. Also, parameter correlations can be exposed through calculation of auto-correlation functions for distributions of parameter values (Lima et al. Reference Lima, Oden, Wohlmuth, Shahmoradi, Hormuth, Yankeelov, Scarabosio and Horger2017).
(3) Occam categories.
The reduced set
 $\bar{{\mathcal{M}}}$
is partitioned according to the number of parameters in each. These partitions are called Occam categories, with the models containing the smallest number of parameters designated category 1, those in the next higher number category 2, and so forth. This produces a collection of subsets,
 $\bar{{\mathcal{M}}_{1}},\bar{{\mathcal{M}}_{2}},\ldots ,\bar{{\mathcal{M}}_{N}}$
, with models in set
 $\bar{{\mathcal{M}}_{k}}$
,
 $1\leq k\leq N$
. By our interpretation of Occam’s razor, models of category
 $k$
are simpler or less complex than those of category
 $l>k$
.
(4) Calibration.
Beginning with models in the category 1 set
 $\bar{{\mathcal{M}}_{1}}$
, all models in
 $\bar{{\mathcal{M}}_{1}}$
are calibrated statistically for a specified calibration scenario
 $S_{c}$
. The calibrated category 1 models for a new set are then given by
 $$\begin{eqnarray}\bar{{\mathcal{M}}_{1}^{\ast }}\sim \{{\mathcal{P}}_{1}^{\ast }(\boldsymbol{\unicode[STIX]{x1D703}}_{1}^{\ast }),{\mathcal{P}}_{2}^{\ast }(\boldsymbol{\unicode[STIX]{x1D703}}_{2}^{\ast }),\ldots ,{\mathcal{P}}_{k}^{\ast }(\boldsymbol{\unicode[STIX]{x1D703}}_{k}^{\ast })\},\quad k<l.\end{eqnarray}$$
It remains to be determined which of these models is most plausible, given calibration data
 $\boldsymbol{y}_{c}$
, and which among them will prove to be valid, given data
 $\boldsymbol{y}_{v}$
.
(5) Plausibility.
Using (8.15) we next calculate the Bayesian posterior plausibilities
 $\unicode[STIX]{x1D70C}_{j}^{\ast },1\leq j\leq k$
, of the category 1 model. The most plausible model (or models), say
 ${\mathcal{P}}_{i}^{\ast }(\boldsymbol{\unicode[STIX]{x1D703}}_{i}^{\ast })$
, is that with plausibility
 $\unicode[STIX]{x1D70C}_{i}^{\ast }$
such that
 $$\begin{eqnarray}\unicode[STIX]{x1D70C}_{i}^{\ast }\geq \unicode[STIX]{x1D70C}_{i}^{\ast },\quad 1\leq j\leq k.\end{eqnarray}$$
(6) Validation.
At this point we have identified the most plausible and simplest model in category 1. Is it valid? We now move to the validation scenario
 $S_{v}$
, update the calibrated parameters of the most plausible category 1 model using Bayesian statistical inversion as discussed earlier, and solve the forward problem in
 $S_{v}$
to establish model predictions on the
 $S_{v}$
experimental observational data
 $\boldsymbol{y}_{v}$
. We must now determine whether the accuracy with which the model prediction agrees with data is sufficient to declare the model ‘valid’ (i.e. not invalid).
Again this step requires that we have selected a suitable metric for measuring error and a suitable tolerance for measuring validity. This step also underscores the fundamental importance of designing validation scenarios that reflect the ability of the model to predict the QoI.
For specificity, let
 $q_{v}(\boldsymbol{y})$
denote the probability density of the validation observational data
 $\boldsymbol{y}=\boldsymbol{y}_{v}$
and let
 $\unicode[STIX]{x1D70B}_{v}(\boldsymbol{y},\boldsymbol{\unicode[STIX]{x1D703}}^{\ast \ast })$
denote the model-generated density approximating
 $q_{v}$
obtained using the updated posterior distributions of
 $S_{v}$
. Let
 $d(\cdot ,\cdot )$
be an appropriate metric, and let
 $\unicode[STIX]{x1D6FE}_{tol}$
be our validation tolerance. Then, for the model to be valid, we must have
 $$\begin{eqnarray}d(q_{v},\unicode[STIX]{x1D70B}_{v}(\boldsymbol{y},\boldsymbol{\unicode[STIX]{x1D703}}^{\ast \ast }))\leq \unicode[STIX]{x1D6FE}_{tol},\end{eqnarray}$$
One example of such a metric, employed in Farrell et al. (Reference Farrell, Oden and Faghihi2015), is
 $$\begin{eqnarray}D_{KL}(q_{v}\Vert \unicode[STIX]{x1D70B}_{v}(\boldsymbol{y},\boldsymbol{\unicode[STIX]{x1D703}}^{\ast \ast }))=\int _{S_{v}}q_{v}(\boldsymbol{y})\log \displaystyle \frac{q_{v}(\boldsymbol{y})}{\unicode[STIX]{x1D70B}(\boldsymbol{y},\boldsymbol{\unicode[STIX]{x1D703}}^{\ast \ast })}\text{d}\boldsymbol{y}.\end{eqnarray}$$
Flowchart for OPAL, the Occam Plausibility Algorithm (Farrell et al. Reference Farrell, Oden and Faghihi2015, Oden et al. Reference Oden, Babuška, Faghihi, Stein, de Borst and Hughes2018).

(7) Iteration or solution.
If the model is deemed valid, for example, if (8.17) holds, then we use the parameters
 $\boldsymbol{\unicode[STIX]{x1D703}}^{\ast \ast }$
of the validated model in the forward problem for the prediction scenario
 $S_{p}$
to obtain the forward solution (
 $u(\boldsymbol{\unicode[STIX]{x1D703}}^{\ast \ast },S)$
) and then compute the prediction of the QoI. If no model in category 1 is valid, we return to step (3) and set
 ${\mathcal{M}}=\bar{{\mathcal{M}}_{2}}$
, the models of category 2, and repeat the steps outlined above until a valid model is established.
(8)
The process is terminated when one model is identified that passes the validation criterion, even though other untested models may lead to a smaller error. If no models in the original set
 ${\mathcal{M}}$
are valid, the set of candidate models must be enlarged until (if possible) a set containing a valid model is obtained.
A flowchart presenting the steps in implementing OPAL is given in Figure 8.1.
Several remarks are in order. First, instead of the number of parameters, we could use other measures of ‘simplicity’ as a basic for establishing Occam categories, such as estimated computational complexity, operation counts, number of dependent variables, etc. Second, as a matter of computational efficiency, the calculation of plausibilities could be done for more complex validation scenarios when computationally feasible. Finally, criteria for model selection other than Bayesian plausibility could be used, such as the Akaike Information Criterion in a frequentist version of OPAL. Such alternatives are discussed in Farrell-Maupin and Oden (Reference Farrell-Maupin and Oden2017).
9 Adaptive control of multiscale models
9.1 Adaptive control of multiscale models
Multiscale modelling – the use of mathematical and computational models to simulate physical events that occur over several spatial and temporal scales – has been among topics of central importance in computational science for nearly two decades. There are many reasons for the emergence of this field. Among them are the remarkable advances in high-performance computing and parallel algorithms, making the use of complex multiscale models a possible undertaking. But equally important are the manifold applications in recent years that demanded the study and analysis of events at many scales. These include nanomanufacturing, semiconductor design and fabrication, analysis of numerous biomedical systems, drug design, geophysical systems, climate modelling, and many other areas. More recently the study of multiscale phenomena in the presence of uncertainties has emerged as a challenging area of research. Some approaches to stochastic multiscale models are taken up in the present article.
There is a large body of literature on multiscale methods. We have mentioned the survey article of Liu, Karpov, Zhang and Park (Reference Liu, Karpov, Zhang and Park2004), Ming and Zhang (Reference Ming and Zhang2007), Curtin and Miller (Reference Curtin and Miller2003), and the monograph of E (Reference E2011). A verity of different approaches to capture multiscale events has been proposed. Many fell into the category of hierarchical methods, in which the results of a finer-scale simulation are used as data for solving a coarser-scale model. The so-called concurrent methods may simultaneously solve a finer-scale model in some local region of the solution domain containing features of interest, and resolve coarser-scale models in complementary regions of the domain. Among methods in these category, we mention the heterogeneous multiscale method (HMM: E and Engquist Reference E and Engquist2003), the bridging-scale methods (BSM: Wagner and Liu Reference Wagner and Liu2003, Park, Karpov, Klein and Liu Reference Park, Karpov, Klein and Liu2005), the quasi-continuum method (QCM: Tadmor, Ortiz and Phillips Reference Tadmor, Ortiz and Phillips1996), the coupled atomistic and discrete dislocation method (CADD: Shilkrot, Miller and Curtin Reference Shilkrot, Miller and Curtin2004) and the goal-oriented adaptive control methods (Oden, Prudhomme, Romkes and Bauman Reference Oden, Prudhomme, Romkes and Bauman2006, Oden and Prudhomme Reference Oden and Prudhomme2001, Reference Oden and Prudhomme2002, Oden, Prudhomme and Bauman Reference Oden, Prudhomme and Bauman2005, Oden and Vemaganti Reference Oden and Vemaganti2000, Oden, Vemaganti and Moës Reference Oden, Vemaganti and Moës1999, Vemaganti and Oden Reference Vemaganti and Oden2001), which belong to the general category of concurrent methods. Still other work on these subjects can be found in the articles mentioned here.
In this part of the exposition, we describe a general approach to the adaptive control of multiscale models built around a posteriori estimates of modelling error in key quantities of interest. The account builds on the developments given in Vemaganti and Oden (Reference Vemaganti and Oden2001) and Oden and Vemaganti (Reference Oden and Vemaganti2000) but extends them to highly complex stochastic systems.
9.2 A posteriori estimation of modelling error
One approach to multiscale modelling is to estimate and control modelling error in key quantities of interest – the error being a measure of the difference between QoIs at coarser scales and those delivered at the finer scale. The presumption is that a general mathematical model of a physical system can be defined, representing events at the finest (smallest) spatial and temporal scales, and that the model can serve as a datum with respect to which other models of events at coarser (larger) scales can be compared. The fine-scale or base model can be highly complex, intractable or very expensive to resolve, and even involve incomplete data, and it is never (or rarely) ‘solved’. Contemporary literature refers to such reference models as ‘high-fidelity’ models.
Two aspects of this approach should be noted. First, it is clear that for the high-fidelity base model to be regarded a valid model for the QoIs, its parameters must be known, at least statistically. At first glance, this is paradoxical, as the forward problem for the base model cannot be solved. We confront this problem via the analysis of high-dimensional inverse problems, assuming observational data are available, and we reduce many complications through the use of common assumptions and approximations in use for such analyses (e.g. Gaussian likelihood, etc.). This follows almost exactly the example of Bayesian inversion described in Section 5.2. Second, the theory for treating multiple scales when QoIs at one scale are correlated with those of another, is, we believe, incomplete and its development remains a challenging area of research. We discuss one such modelling paradigm involving multiscale models of cancer growth in Section 10.5.
While the idea of estimating modelling error and adaptive modelling appeared in the late 1990s in the papers of Oden et al. (Reference Oden, Vemaganti and Moës1999) and Oden and Vemaganti (Reference Oden and Vemaganti2000), a more general approach to estimation of modelling error for nonlinear problems in mechanics was presented by Oden and Prudhomme (Reference Oden and Prudhomme2002) employing a framework similar to that of Becker and Rannacher (Reference Becker and Rannacher2001) in their study of optimal control to a posteriori error estimation in finite element methods. Generalizations of these methods were discussed in Oden et al. (Reference Oden, Prudhomme, Romkes and Bauman2006) and applied to broad classes of problems in molecular dynamics and composite materials. Braack and Ern (Reference Braack and Ern2003) presented methods for estimation and control of both modelling and discretization errors. In more recent work, Maier and Rannacher (Reference Maier and Rannacher2016, Reference Maier and Rannacher2018) described a post-processing procedure for selecting optimal models for estimating error in quantities of interest. Extensions of the adaptive modelling approaches in Oden and Vemaganti (Reference Oden and Vemaganti2000) and Vemaganti and Oden (Reference Vemaganti and Oden2001) to stochastic systems encountered in the modelling of random heterogeneous materials are discussed in Section 9.5.
Returning to the original abstract problem (2.1), we drop references to the scenario
 $S$
and reframe it in a function-space setting. Beginning with a high level of abstraction and generality, we consider the forward problem, now written compactly as follows:
 $$\begin{eqnarray}\displaystyle & & \displaystyle \text{Find }u\in U\text{ such that}\nonumber\\ \displaystyle & & \displaystyle {\mathcal{A}}(\boldsymbol{\unicode[STIX]{x1D703}})u=F\quad \text{in }V^{\prime },\end{eqnarray}$$
where
 ${\mathcal{A}}(\boldsymbol{\unicode[STIX]{x1D703}})$
is a parametric family of maps from a topological vector space (TVS)
 $U$
into the dual space
 $V^{\prime }$
of a TVS
 $V$
, and
 $F$
is given in
 $V^{\prime }$
;
 $\boldsymbol{\unicode[STIX]{x1D703}}\in \unicode[STIX]{x0398}$
is a finite vector of parameters. Let
 $\langle \cdot ,\cdot \rangle$
 $\equiv \langle \cdot ,\cdot \rangle _{V^{\prime }\times V}$
denote duality pairing on
 $V^{\prime }\times V$
and let
 ${\mathcal{B}}(\cdot ;\cdot )$
denote the semilinear form
 $$\begin{eqnarray}{\mathcal{B}}(\boldsymbol{\unicode[STIX]{x1D703}},u;v)=\langle {\mathcal{A}}(\boldsymbol{\unicode[STIX]{x1D703}})u,v\rangle ,\end{eqnarray}$$
the semicolon indicating that
 ${\mathcal{B}}(\boldsymbol{\unicode[STIX]{x1D703}};\cdot ;\cdot )$
may be nonlinear in arguments
 $u$
to the left of the semicolon, but linear in
 $v$
, and the linear form
 $F$
is given by
 $$\begin{eqnarray}F(v)=\langle F,v\rangle ,\quad \text{for }v\in V.\end{eqnarray}$$
Then problem (9.1) assumes the following variational form:
 $$\begin{eqnarray}\displaystyle & & \displaystyle \text{For any }\boldsymbol{\unicode[STIX]{x1D703}}\in \unicode[STIX]{x0398},\text{ find }u=u(\boldsymbol{\unicode[STIX]{x1D703}})\in U\text{ such that}\nonumber\\ \displaystyle & & \displaystyle {\mathcal{B}}(\boldsymbol{\unicode[STIX]{x1D703}},u;v)=F(v)\quad \text{for all }v\in V.\end{eqnarray}$$
The goal of the model problem is to use the solution
 $u$
of the forward problem to compute the target QoIs, defined by functionals
 $Q$
on
 $U$
:
 $$\begin{eqnarray}Q:U\rightarrow \mathbb{R},\quad \text{QoI}=Q(u(\boldsymbol{\unicode[STIX]{x1D703}})).\end{eqnarray}$$
If (9.1) defines an intractable high-fidelity model, so must (9.5) be intractable. Thus, we must seek a computable approximation to
 $Q(u)$
.
Before introducing such an approximation, we list a few fundamental points derived in Oden and Prudhomme (Reference Oden and Prudhomme2002) and Oden et al. (Reference Oden, Prudhomme, Romkes and Bauman2006).
(1) Optimal control of models to deliver a given QoI.
Given
 $Q:U\rightarrow \mathbb{R}$
,
 $\boldsymbol{\unicode[STIX]{x1D703}}\in \unicode[STIX]{x0398}$
and the general problem (9.4),
 $$\begin{eqnarray}Q(u)=\inf _{v\in M}Q(v);M=\{z\in V:{\mathcal{B}}(\boldsymbol{\unicode[STIX]{x1D703}},z;q)=F(q)~\text{for all }q\in V\}.\end{eqnarray}$$
This is the optimal control problem for goal-oriented estimation described in Oden and Prudhomme (Reference Oden and Prudhomme2002) and Becker and Rannacher (Reference Becker and Rannacher2001).
(2) Solution.
Using standard Lagrangian multipliers for the constant
 $v\in M$
, we arrive at the following pair of problems:
 $$\begin{eqnarray}\displaystyle & \text{Find }(u,w)\in U\times U\text{ such that} & \displaystyle \nonumber\\ \displaystyle & \begin{array}{@{}cl@{}}{\mathcal{B}}(\boldsymbol{\unicode[STIX]{x1D703}},u;v)=F(v) & \text{for all }v\in V\quad \text{(the primal problem)},\\ {\mathcal{B}}^{\prime }(\boldsymbol{\unicode[STIX]{x1D703}},u;w,v)=Q^{\prime }(u;v) & \text{for all }v\in V\quad \text{(the adjoint problem)},\end{array} & \displaystyle\end{eqnarray}$$
where primes (
 $^{\prime }$
) indicate Gâteaux derivatives, that is,
 $$\begin{eqnarray}\displaystyle {\mathcal{B}}^{\prime }(\boldsymbol{\unicode[STIX]{x1D703}},u;w,v) & = & \displaystyle \lim _{\unicode[STIX]{x1D716}\rightarrow 0}\quad \unicode[STIX]{x1D700}^{-1}[{\mathcal{B}}(\boldsymbol{\unicode[STIX]{x1D703}},u+\unicode[STIX]{x1D700}w,v)-{\mathcal{B}}(\boldsymbol{\unicode[STIX]{x1D703}},u;v)],\end{eqnarray}$$
 $$\begin{eqnarray}\displaystyle Q^{\prime }(u;v) & = & \displaystyle \lim _{\unicode[STIX]{x1D716}\rightarrow 0}\quad \unicode[STIX]{x1D700}^{-1}[Q(u+\unicode[STIX]{x1D700}v)-Q(u)].\end{eqnarray}$$
(3) General form of the error in
$Q$
.

The following is proved in Oden and Prudhomme (Reference Oden and Prudhomme2002).
Theorem 9.1. Let the semilinear form
 ${\mathcal{B}}(\boldsymbol{\unicode[STIX]{x1D703}},\cdot ,\cdot )$
of (9.2) and the QoI
 $Q(\cdot )$
have functional (Gâteaux) derivatives of order three. Let
 $(u,w)\in U\times U$
be a solution of (9.7). Let
 $(\bar{u},\bar{w})$
be an arbitrary pair in
 $U\times U$
. Then the error produced by
 $\bar{u}$
in the QoI is given by
 $$\begin{eqnarray}Q(u)-Q(\bar{u})=R(\bar{u};\bar{w})+R(\bar{u},e_{0})+\unicode[STIX]{x1D6E5}(\bar{u},\bar{w},e_{0},\unicode[STIX]{x1D700}_{0}),\end{eqnarray}$$
where
 $R(\bar{u},v)$
is the residual functional
 $$\begin{eqnarray}R(\bar{u},v)=F(v)-{\mathcal{B}}(\boldsymbol{\unicode[STIX]{x1D703}},\bar{u};v),\quad v\in V,\end{eqnarray}$$
 $e_{0}$
and
 $\unicode[STIX]{x1D700}_{0}$
are the errors
 $$\begin{eqnarray}e_{0}=u-\bar{u},\quad \unicode[STIX]{x1D700}_{0}=w-\bar{w},\end{eqnarray}$$
and
 $\unicode[STIX]{x1D6E5}(\bar{u},\bar{w},e_{0},\unicode[STIX]{x1D700}_{0})$
is a remainder depending on second and third Gâteaux derivatives of
 ${\mathcal{B}}(\boldsymbol{\unicode[STIX]{x1D703}},\cdot ;\cdot )$
and
 $Q(\cdot )$
:
 $$\begin{eqnarray}\displaystyle \unicode[STIX]{x1D6E5} & = & \displaystyle \displaystyle \frac{1}{2}\int _{0}^{1} [{\mathcal{B}}^{\prime \prime }(\boldsymbol{\unicode[STIX]{x1D703}},\bar{u}+se_{0};e_{0},e_{0},\bar{w}+S\unicode[STIX]{x1D700}_{0})\nonumber\\ \displaystyle & & \displaystyle -Q^{\prime \prime }(\bar{u}+se_{0};e_{0},e_{0})+\{Q^{\prime \prime \prime }(\bar{u}+se_{0};e_{0},e_{0})\nonumber\\ \displaystyle & & \displaystyle -3{\mathcal{B}}^{\prime \prime }(\boldsymbol{\unicode[STIX]{x1D703}},\bar{u}+se_{0};e_{0},e_{0},\unicode[STIX]{x1D700}_{0})\nonumber\\ \displaystyle & & \displaystyle -{\mathcal{B}}^{\prime \prime \prime }(\boldsymbol{\unicode[STIX]{x1D703}},\bar{u}+se_{0};e_{0},e_{0},e_{0},\bar{w}+s\unicode[STIX]{x1D700}_{0})\}(1-s)]\text{d}s,\end{eqnarray}$$
the primes (
 $^{\prime \prime },^{\prime \prime \prime }$
) denoting second and third Gâteaux derivatives. See Oden and Prudhomme (Reference Oden and Prudhomme2002) and Oden et al. (Reference Oden, Prudhomme, Romkes and Bauman2006) for details, and the related work by Becker and Rannacher (Reference Becker and Rannacher2001).
Remarkably,
 $(\bar{u},\bar{w})$
is an arbitrary pair in
 $U\times U$
. Thus
 $\unicode[STIX]{x1D6E5}$
can conceivably be very large. If
 ${\mathcal{B}}(\boldsymbol{\unicode[STIX]{x1D703}},\cdot ;\cdot )$
is bilinear for all
 $\boldsymbol{\unicode[STIX]{x1D703}}$
, and
 $Q(\cdot )$
is linear,
 $\unicode[STIX]{x1D6E5}$
is zero and (9.11) collapses to
 $$\begin{eqnarray}Q(u)-Q(\bar{u})=R(\bar{u};\bar{p})+{\mathcal{B}}(\boldsymbol{\unicode[STIX]{x1D703}},e_{0};\unicode[STIX]{x1D700}_{0}).\end{eqnarray}$$
(4) Surrogate problem.
Since
 $(\bar{u},\bar{w})$
in (9.10)–(9.14) are completely arbitrary vector pair in
 $V\times V$
, a natural choice is to structure approximations to
 ${\mathcal{B}}(\boldsymbol{\unicode[STIX]{x1D703}},\cdot ;\cdot )$
,
 $F(\cdot )$
, and
 $Q(\cdot )$
to minimize the remainder
 $\unicode[STIX]{x1D6E5}$
and to replace (9.2) (and (9.7
 $_{2}$
)) by tractable problems. If
 ${\mathcal{B}}_{0}(\boldsymbol{\unicode[STIX]{x1D703}},\cdot ;\cdot )$
,
 $F_{0}(\cdot )$
and
 $Q_{0}(\cdot )$
denote their respective approximations, then the surrogate problem takes the following form:
 $$\begin{eqnarray}\displaystyle & & \displaystyle \text{Find }(u_{0},w_{0})\in U\times U\text{ such that}\nonumber\\ \displaystyle & & \displaystyle \begin{array}{@{}cl@{}}{\mathcal{B}}_{0}(\boldsymbol{\unicode[STIX]{x1D703}},u_{0};v)=F_{0}(v) & \text{for all }v\in V,\\ {\mathcal{B}}_{0}^{\prime }(\boldsymbol{\unicode[STIX]{x1D703}},u;w,v)=Q_{0}(u;v) & \text{for all }v\in V.\end{array}\end{eqnarray}$$
Clearly the surrogate forms in (9.15) are expected to be drawn from a coarser-scale problem than (9.7) (or (9.1)), and are generally constructed through homogenization or averaging processes. If (9.15) is ‘close’ to (9.7) or if
 ${\mathcal{B}}(\boldsymbol{\unicode[STIX]{x1D703}},\cdot ,\cdot )$
is bilinear and
 $Q(\cdot )$
is linear, the remainder
 $\unicode[STIX]{x1D6E5}$
can be neglected (or is zero), and the error in the QoI is
 $$\begin{eqnarray}Q(u)-Q(\bar{u})=R(u_{0};w_{0})+R(u_{0};\unicode[STIX]{x1D700}_{0})=R(u_{0};w).\end{eqnarray}$$
The Goals algorithm, described in, for example, Vemaganti and Oden (Reference Vemaganti and Oden2001) or Oden et al. (Reference Oden, Prudhomme, Romkes and Bauman2006), naturally involves a sequence of surrogate models of the form (9.15) designed to reduce the error to acceptable tolerance sequentially as more information from the high-fidelity model is accessed.
9.3 Adaptive control of models: the Goals algorithm
Once an estimate of error in QoI inherent in each member of a sequence of surrogate models is in hand, several algorithms can be implemented to systematically reduce modelling error until a predefined error tolerance is reached. One such algorithm is the straightforward scheme embedded in the Goals algorithm, introduced in Oden and Vemaganti (Reference Oden and Vemaganti2000) and described in more detail in Oden et al. (Reference Oden, Prudhomme, Romkes and Bauman2006). Basic steps are listed as follows.
(1)
For specificity, let
 $D\subset \mathbb{R}^{d}$
be an open bounded regime which is the domain of the high-fidelity solution
 $(u,w)\in U\times U$
, and let
 $\{G_{j}\}_{j=1}^{K}$
be a partition of
 $$\begin{eqnarray}D:\bar{D}=\mathop{\bigcup }_{j}^{K}G_{j},\quad G_{i}\cap G_{j}=\emptyset ,i\neq j,\quad 1\leq i,j\leq K.\end{eqnarray}$$
The semilinear and linear forms in (9.15) can be broken into components over the partition so that
 $$\begin{eqnarray}{\mathcal{B}}(\boldsymbol{\unicode[STIX]{x1D703}},u;v)=\mathop{\sum }_{j=1}^{K}{\mathcal{B}}_{G_{j}}(\boldsymbol{\unicode[STIX]{x1D703}},u;v),\quad {\mathcal{F}}(v)=\mathop{\sum }_{j=1}^{K}F_{G_{j}}(v)\end{eqnarray}$$
for
 $u,v\in V$
,
 ${\mathcal{B}}_{G_{j}}(\boldsymbol{\unicode[STIX]{x1D703}},\cdot ;\cdot )$
and
 $F_{G_{j}}(\cdot )$
being restrictions to subdomain
 $G_{j}$
.
We suppose that the QoI is confined to a subdomain
 $D_{Q}\subset D$
, which is to be called the domain of influence. Generally
 $D_{Q}$
can be the subdomains
 $G_{1}$
of the partitions or a union of subdomains entering the QoI.
(2)
Through an averaging or homogenization process, we construct the surrogate problem (9.15) and solve it for the surrogate solution
 $(u_{0}^{(1)},w_{0}^{(1)})\in V\times V$
defined over all
 $D$
.
(3)
The modelling error in the surrogate is estimated using (9.16):
 $$\begin{eqnarray}e_{0}^{(1)}\approx Q(u)-Q(u_{0}^{(1)})\approx R(u_{0}^{(1)};w_{0}^{(1)})+R(u_{0}^{(1)};w-w_{0}).\end{eqnarray}$$
The first term in (9.18) is computable, the second is not because
 $w$
is unknown and must be approximated. Such approximations are usually problem-dependent; examples are given in a wide range of applications in Oden and Vemaganti (Reference Oden and Vemaganti2000), Oden et al. (Reference Oden, Prudhomme and Bauman2005) and Oden et al. (Reference Oden, Prudhomme, Romkes and Bauman2006). Alternatively, for bilinear
 ${\mathcal{B}}(\boldsymbol{\unicode[STIX]{x1D703}},\cdot ;\cdot )$
and linear
 $Q(\cdot )$
, rigorous two-sided bounds of a posteriori estimates of error in QoIs can be established. These are reviewed in Section 9.4.
(4)
An error tolerance
 $\unicode[STIX]{x1D6FE}_{tol}$
is introduced to define the maximum error admitted in the adaptive process. Obviously, if
 $\Vert e_{0}^{(1)}\Vert \leq \unicode[STIX]{x1D6FE}_{tol}$
, the procedure is terminated and the QoI is predicted with accepted accuracy. If
 $\Vert e_{0}^{(1)}\Vert >\unicode[STIX]{x1D6FE}_{tol}$
, the accuracy of the surrogate model must be improved. The corrected surrogate (
 $k=2$
) involves the form
 $$\begin{eqnarray}\displaystyle {\mathcal{B}}_{0}^{(2)}(\boldsymbol{\unicode[STIX]{x1D703}},u_{0}^{(2)},v) & = & \displaystyle {\mathcal{B}}_{0}^{(2)}(\boldsymbol{\unicode[STIX]{x1D703}},u_{0,D_{Q}}^{(2)};v_{D_{Q}})+{\mathcal{B}}_{D\setminus D_{Q}}(\boldsymbol{\unicode[STIX]{x1D703}},u_{0,D\setminus D_{Q}}^{(2)};v_{D\setminus D_{Q}})\nonumber\\ \displaystyle & = & \displaystyle F(v)\quad \text{for all }v\in V,\nonumber\\ \displaystyle {\mathcal{B}}_{0}^{(2)^{\prime }}(\boldsymbol{\unicode[STIX]{x1D703}},u_{0}^{(2)};w_{0}^{(2)},v) & = & \displaystyle Q^{\prime }(u_{0}^{(2)};v),\end{eqnarray}$$
where
 $u_{0,D_{Q}}^{(2)}$
is the restriction of the second iterate solution
 $u_{0}^{(2)}$
to the domain of influence, and
 ${\mathcal{B}}_{D\setminus D_{Q}}(\boldsymbol{\unicode[STIX]{x1D703}},\cdot ;\cdot )$
is the semilinear form defined on restrictions of functions in
 $V$
to
 $D\setminus D_{Q}$
. In other words, fine-scale features of the high-fidelity model are included in
 $D_{Q}$
while coarse-scale (homogenized) features exist over
 $D\setminus D_{Q}$
.
(5)
Compute
 $\Vert e_{0}^{(2)}\Vert \approx \Vert Q(u)-Q(u_{0}^{(2)})\Vert$
. If
 $\Vert e_{0}^{(2)}\Vert \leq \unicode[STIX]{x1D6FE}_{tol}$
, stop; if not, redo (9.19) to compute
 $(u_{0}^{(3)},w_{0}^{(3)})$
and continue adding fine-scale features until the tolerance is met.
One algorithm for the sequential addition of subdomains
 $G_{j}$
containing fine-scale information is the ‘greedy algorithm’ described in Vemaganti and Oden (Reference Vemaganti and Oden2001). Given an approximation of the adjoint solution
 $w$
, the residual
 $R^{(k)}$
at iterate
 $k$
is given by (9.18) as
 $R^{(k)}=R(u_{0}^{(k)},w)$
. The contribution to
 $R^{(k)}$
from subdomain
 $G_{j}$
is denoted
 $R_{j}^{(k)}$
, that is,
 $$\begin{eqnarray}R^{(k)}=\mathop{\sum }_{j=1}^{(k)}R_{j}^{(k)}.\end{eqnarray}$$
Let
 $R_{\max }^{(k)}=\max _{1\leq j\leq K}R_{j}^{(k)}$
. Then if
 $R_{j}^{(k)}\geq \unicode[STIX]{x1D6FC}R_{\max }^{(k)}$
,
 $\unicode[STIX]{x1D6FC}\in (0,1)$
, we add fine-scale features of
 $G_{j}$
to the fine-scale subdomain and compute
 $R^{(k+1}$
. This process is continued until the tolerance
 $\unicode[STIX]{x1D6FE}_{tol}$
is reached.
9.4 Two-sided bounds of errors in QoIs
The two-sided (upper and lower) bounds on estimated error in quantities of interest described in Oden and Vemaganti (Reference Oden and Vemaganti2000) can be extended to linear stochastic elliptic boundary-value problems modelling diffusion-type phenomena in random heterogeneous media. There the problem is as follows:
 $$\begin{eqnarray}\displaystyle & & \displaystyle \text{Find }u\in H=L_{\mathbb{P}}^{2}(\unicode[STIX]{x03A9})\otimes H_{\unicode[STIX]{x0393}_{D}}^{1}\text{ such that}\nonumber\\ \displaystyle & & \displaystyle \mathbb{E}\biggl[\int _{D}\boldsymbol{A}\unicode[STIX]{x1D735}u\cdot \unicode[STIX]{x1D735}v\text{d}\boldsymbol{x}\biggr]=\mathbb{E}\biggl[\int _{D}fv\text{d}\boldsymbol{x}+\int _{\unicode[STIX]{x0393}_{N}}\unicode[STIX]{x1D70E}v\text{d}s\biggr],\end{eqnarray}$$
for all
 $v\in H$
, where
 $\unicode[STIX]{x03A9}$
is the sample set of outcomes in a complete probability space
 $(\unicode[STIX]{x03A9},{\mathcal{F}},\mathbb{P})$
,
 ${\mathcal{F}}$
being a
 $\unicode[STIX]{x1D70E}$
-algebra of subsets of
 $\unicode[STIX]{x03A9}$
and
 $\mathbb{P}$
the probability measure,
 $H_{\unicode[STIX]{x0393}_{D}}$
is the Hilbert space
 $$\begin{eqnarray}H_{\unicode[STIX]{x0393}_{D}}=\{v\in H^{1}(D):\text{trace(v)}|_{\unicode[STIX]{x0393}_{D}}=0\},\end{eqnarray}$$
 $\boldsymbol{A}$
is a
 $d\times d$
symmetric positive-definite matrix
 $$\begin{eqnarray}\boldsymbol{A}\in (L^{\infty }(D))^{d\times d},\quad f^{D}\in L^{2}(\unicode[STIX]{x03A9},0),\quad \unicode[STIX]{x1D70E}\in H^{-1/2}(\unicode[STIX]{x03A9},\unicode[STIX]{x0393}_{N}),\end{eqnarray}$$
and
 $\mathbb{E}[\cdot ]$
is the expected value
 $$\begin{eqnarray}\mathbb{E}[Y]=\int _{\unicode[STIX]{x03A9}}Y(\unicode[STIX]{x1D714})\text{d}\mathbb{P}(\unicode[STIX]{x1D714})=\int _{\mathbb{R}^{N}}y\unicode[STIX]{x1D70B}(y)\text{d}y,\end{eqnarray}$$
 $\unicode[STIX]{x1D70B}(y)$
being the probability density associated with
 $\mathbb{P}$
. Denoting the left-hand side of (9.20) by
 ${\mathcal{B}}(u,v)$
and the right-hand side by
 $F(v)$
, the problem assumes the following classical form:
 $$\begin{eqnarray}\displaystyle & & \displaystyle \text{Find }u\in H\text{ such that}\nonumber\\ \displaystyle & & \displaystyle {\mathcal{B}}(u,v)=F(v)\quad \text{for all }v\in H.\end{eqnarray}$$
For each QoI
 $Q\in {\mathcal{L}}(H,\mathbb{R})$
we also have the following adjoint problem:
 $$\begin{eqnarray}\displaystyle & & \displaystyle \text{Given }Q:H\rightarrow \mathbb{R},\text{ find }w\in H\text{ such that}\nonumber\\ \displaystyle & & \displaystyle {\mathcal{B}}(u,w)=Q(v)\quad \text{for all }v\in H.\end{eqnarray}$$
Problems (9.20) and (9.21) are equivalent to the stochastic boundary-value problem of finding a scalar field
 $u:\unicode[STIX]{x03A9}\times D\rightarrow \mathbb{R}$
such that, almost surely for all
 $\unicode[STIX]{x1D714}\in \unicode[STIX]{x03A9}$
,
 $$\begin{eqnarray}\displaystyle \unicode[STIX]{x1D735}\cdot \boldsymbol{A}\unicode[STIX]{x1D735}u(\unicode[STIX]{x1D714},\boldsymbol{x}) & = & \displaystyle f(\unicode[STIX]{x1D714},\boldsymbol{x}),\quad \boldsymbol{x}\in D,\nonumber\\ \displaystyle \boldsymbol{A}\unicode[STIX]{x1D735}u(\unicode[STIX]{x1D714},\boldsymbol{x}) & = & \displaystyle \unicode[STIX]{x1D70E}(\unicode[STIX]{x1D714},\boldsymbol{x}),\quad \boldsymbol{x}\in \unicode[STIX]{x0393}_{N},\nonumber\\ \displaystyle u(\unicode[STIX]{x1D714},\boldsymbol{x}) & = & \displaystyle 0,\quad \boldsymbol{x}\in \unicode[STIX]{x0393}_{D},\end{eqnarray}$$
where
 $\unicode[STIX]{x1D735}$
is the spatial gradient,
 $f$
and
 $\unicode[STIX]{x1D70E}$
are prescribed data, and
 $\unicode[STIX]{x2202}D=\unicode[STIX]{x0393}_{N}\cup \unicode[STIX]{x0393}_{D}$
, Neumann data
 $\unicode[STIX]{x1D70E}$
being prescribed on
 $\unicode[STIX]{x2202}D\setminus \unicode[STIX]{x0393}_{D}$
. Assuming there exist positive constants
 $\unicode[STIX]{x1D6FC}_{\min }$
,
 $\unicode[STIX]{x1D6FC}_{\max }$
such that
 $$\begin{eqnarray}\mathbb{P}\{\unicode[STIX]{x1D714}\in \unicode[STIX]{x03A9}:\unicode[STIX]{x1D6FC}_{\min }\boldsymbol{a}^{T}\boldsymbol{a}\leq \boldsymbol{a}^{T}\boldsymbol{A}(\unicode[STIX]{x1D714},\boldsymbol{x})\boldsymbol{a}\leq \unicode[STIX]{x1D6FC}_{ max}\boldsymbol{a}^{T}\boldsymbol{a},~\text{for all }\boldsymbol{a}\in \boldsymbol{R}^{d}\}=1,\end{eqnarray}$$
problem (9.20) has a unique solution
 $u\in H$
by the Lax–Milgram theorem.
Following the arguments laid down earlier for models such as (9.21), the high-fidelity problem (9.20) (and (9.21)) is generally intractable, and a tractable sequence of surrogates is needed. We thus follow the plan described earlier and introduce a sequence of hybrid models in which subdomain
 $G_{j}$
of
 $D$
contains fine-scale features while homogenized (possibly deterministic) properties exist in the complementary domain in
 $D$
. For the
 $k$
th surrogate, we have
 $$\begin{eqnarray}\boldsymbol{A}_{0}^{(k)}(\unicode[STIX]{x1D714},\boldsymbol{x})=\left\{\begin{array}{@{}ll@{}}\boldsymbol{A}(\unicode[STIX]{x1D714},\boldsymbol{x}),\quad & \boldsymbol{x}\in D_{k},\\ \boldsymbol{A}_{00}(\boldsymbol{x}),\quad & \boldsymbol{x}\in D\setminus D_{k},\;k=1,2,\ldots ,K,\end{array}\right.\end{eqnarray}$$
 $D_{k}$
being the union of fine-scale subdomains. The sequence of surrogate forward and adjoint problems is then characterized as follows:
 $$\begin{eqnarray}\displaystyle & & \displaystyle \text{Find }(u_{0}^{(k)},w_{0}^{(k)})\in H\times H\text{ such that}\nonumber\\ \displaystyle & & \displaystyle \begin{array}{@{}cl@{}}{\mathcal{B}}_{0}(u_{0}^{(k)};v)=F_{0}(v) & \text{for all }v\in H,\\ {\mathcal{B}}_{0}^{\prime }(v,w_{0}^{(k)})=Q_{0}(v) & \text{for all }v\in H,\end{array}\end{eqnarray}$$
 $k=1,2,\ldots ,K$
, where
 $$\begin{eqnarray}{\mathcal{B}}_{0}(u_{0}^{(k)};v)=\mathbb{E}\biggl[\int _{D}\boldsymbol{A}_{0}^{k}\unicode[STIX]{x1D735}u_{o}^{(k)}\cdot \unicode[STIX]{x1D735}v\text{d}\boldsymbol{x}\biggr].\end{eqnarray}$$
A posteriori estimates of errors in
 $Q(u_{0}^{(k)})$
are given in the following theorem.
Theorem 9.2. Let
 $u_{0}$
and
 $w_{0}$
be solutions of the surrogate problem (9.15) (suppressing index (
 $k$
)). Then the modelling error in the QoI is bounded above and below according to
 $$\begin{eqnarray}\unicode[STIX]{x1D702}_{low}\leq Q(u)-Q(u_{0})\leq \unicode[STIX]{x1D702}_{upp},\end{eqnarray}$$
where
 $u$
is the solution of the forward problem (9.21),
 $$\begin{eqnarray}\displaystyle \unicode[STIX]{x1D702}_{low} & = & \displaystyle \displaystyle \frac{1}{4}(\unicode[STIX]{x1D702}_{low}^{+})^{2}-\displaystyle \frac{1}{4}(\unicode[STIX]{x1D702}_{upp}^{-})^{2}+R_{u_{0}}(w_{0}),\nonumber\\ \displaystyle \unicode[STIX]{x1D702}_{upp} & = & \displaystyle \displaystyle \frac{1}{4}(\unicode[STIX]{x1D702}_{upp}^{+})^{2}-\displaystyle \frac{1}{4}(\unicode[STIX]{x1D702}_{low}^{-})^{2}+R_{u_{0}}(w_{0}),\end{eqnarray}$$
with
 $$\begin{eqnarray}\displaystyle (\unicode[STIX]{x1D702}_{upp}^{\pm })^{2} & = & \displaystyle s^{2}\Vert u_{0}\Vert _{\boldsymbol{I}_{0}{\mathcal{B}}}^{2}+s^{-2}\Vert w_{0}\Vert _{\boldsymbol{I}_{0}{\mathcal{B}}}^{2}\pm \mathbb{E}[2(u_{0},w_{0})_{\boldsymbol{I}_{0}{\mathcal{B}}}],\end{eqnarray}$$
 $$\begin{eqnarray}\displaystyle (\unicode[STIX]{x1D702}_{low}^{\pm })^{2} & = & \displaystyle \displaystyle \frac{|R_{su_{0}\pm s^{-1}w_{0}}(u_{0}+\unicode[STIX]{x1D6FE}^{\pm }w_{0})|}{\Vert u_{0}+\unicode[STIX]{x1D6FE}^{\pm }w_{0}\Vert _{{\mathcal{B}}}},\end{eqnarray}$$
 $$\begin{eqnarray}\displaystyle R_{g}(v) & = & \displaystyle -\mathbb{E}\biggl[\int _{D}\boldsymbol{A}\boldsymbol{I}_{0}\unicode[STIX]{x1D735}g\cdot \unicode[STIX]{x1D735}v\text{d}\boldsymbol{x}\biggr],\end{eqnarray}$$
and the inner product and norms are given for
 $h,g\in H$
, by
 $$\begin{eqnarray}\displaystyle (h,g)_{\boldsymbol{I}_{0}{\mathcal{B}}} & = & \displaystyle \int _{D}\boldsymbol{A}\boldsymbol{I}_{0}\unicode[STIX]{x1D735}h\cdot \unicode[STIX]{x1D735}g\text{d}\boldsymbol{x},\end{eqnarray}$$
 $$\begin{eqnarray}\displaystyle \Vert h\Vert _{\boldsymbol{I}_{0}{\mathcal{B}}}^{2} & = & \displaystyle (h,h)_{\boldsymbol{I}_{0}{\mathcal{B}}},\end{eqnarray}$$
 $\unicode[STIX]{x1D6FE}^{\pm }$
are real numbers and
 $\boldsymbol{I}_{0}$
is the deviation matrix
 $$\begin{eqnarray}\boldsymbol{I}_{0}=\boldsymbol{I}_{0}(\unicode[STIX]{x1D714},\boldsymbol{x})=\boldsymbol{I}-\boldsymbol{A}^{-1}(\unicode[STIX]{x1D714},\boldsymbol{x})\boldsymbol{A}(\unicode[STIX]{x1D714},\boldsymbol{x}),\end{eqnarray}$$
 $\boldsymbol{I}$
being the
 $d\times d$
identity matrix, and
 $s\in \mathbb{R}^{+}$
is a scaling factor (optimal if
 $s^{2}=\Vert e_{0}\Vert _{{\mathcal{B}}}/\Vert \unicode[STIX]{x1D700}_{0}\Vert _{{\mathcal{B}}}$
).
9.5 Example: adaptive modelling of diffusion in a random heterogeneous medium
An example of adaptive modelling of a stochastic boundary-value problem using a version of the Goals algorithm described earlier is outlined below. It concerns heat conduction in a random two-phase media described by (9.21) for the case
 $$\begin{eqnarray}\boldsymbol{A}(\unicode[STIX]{x1D714},\boldsymbol{x})=\unicode[STIX]{x1D705}(\unicode[STIX]{x1D714},\boldsymbol{x})\boldsymbol{I},\quad \text{for }\unicode[STIX]{x1D714}\in \unicode[STIX]{x03A9},\;\boldsymbol{x}\in D,\end{eqnarray}$$
where
 $\unicode[STIX]{x1D705}$
is the heat conduction,
 $\unicode[STIX]{x03A9}$
is the set of two-phase material realizations. Generally,
 $\unicode[STIX]{x1D705}$
is of the form
 $$\begin{eqnarray}\unicode[STIX]{x1D705}(\unicode[STIX]{x1D714},\boldsymbol{x})=\unicode[STIX]{x1D705}_{I}{\mathcal{X}}_{I}(\unicode[STIX]{x1D714},\boldsymbol{x})+\unicode[STIX]{x1D705}_{M}{\mathcal{X}}_{M}(\unicode[STIX]{x1D714},\boldsymbol{x}),\end{eqnarray}$$
where
 $\unicode[STIX]{x1D705}_{I}$
and
 $\unicode[STIX]{x1D705}_{M}$
are conductivities of inclusions and matrix materials and
 ${\mathcal{X}}_{I}$
,
 ${\mathcal{X}}_{M}$
are characteristic functions for subsets of the domain of volume
 ${\mathcal{V}}_{I}$
and
 ${\mathcal{V}}_{M}$
(
 ${\mathcal{V}}=|D|;{\mathcal{X}}_{i}(\unicode[STIX]{x1D714},\boldsymbol{x})=1$
if
 $\boldsymbol{x}\in {\mathcal{V}}_{i},0$
if otherwise,
 $i=I,M$
). The volume fractions are
 $\unicode[STIX]{x1D719}_{I}={\mathcal{V}}_{I}/{\mathcal{V}}$
,
 $\unicode[STIX]{x1D719}_{M}={\mathcal{V}}_{M}/{\mathcal{V}}$
.
For the homogenized material, we take for the effective conductivity
 $\unicode[STIX]{x1D705}_{0}$
given by
 $$\begin{eqnarray}\unicode[STIX]{x1D705}_{0}=\displaystyle \frac{1}{2}(\unicode[STIX]{x1D705}_{+}^{e}+\unicode[STIX]{x1D705}_{-}^{e}),\end{eqnarray}$$
where
 $\unicode[STIX]{x1D705}_{\pm }^{e}$
are the Hashin–Shtrikman bounds Hashin and Shtrikman (Reference Hashin and Shtrikman1963)
 $$\begin{eqnarray}\displaystyle \unicode[STIX]{x1D705}_{e}^{-} & = & \displaystyle \unicode[STIX]{x1D705}_{2}\unicode[STIX]{x1D719}_{2}+\unicode[STIX]{x1D705}_{1}\unicode[STIX]{x1D719}_{1}-\displaystyle \frac{(\unicode[STIX]{x1D705}_{2}-\unicode[STIX]{x1D705}_{1})^{2}\unicode[STIX]{x1D719}_{2}\unicode[STIX]{x1D719}_{1}}{\unicode[STIX]{x1D705}_{2}+\unicode[STIX]{x1D705}_{2}\unicode[STIX]{x1D719}_{1}+\unicode[STIX]{x1D705}_{1}\unicode[STIX]{x1D719}_{2}},\nonumber\\ \displaystyle \unicode[STIX]{x1D705}_{e}^{+} & = & \displaystyle \unicode[STIX]{x1D705}_{1}\unicode[STIX]{x1D719}_{1}+\unicode[STIX]{x1D705}_{2}\unicode[STIX]{x1D719}_{2}-\displaystyle \frac{(\unicode[STIX]{x1D705}_{1}-\unicode[STIX]{x1D705}_{2})^{2}\unicode[STIX]{x1D719}_{1}\unicode[STIX]{x1D719}_{2}}{\unicode[STIX]{x1D705}_{1}+\unicode[STIX]{x1D705}_{1}\unicode[STIX]{x1D719}_{2}+\unicode[STIX]{x1D705}_{2}\unicode[STIX]{x1D719}_{1}},\end{eqnarray}$$
and the effective conductivity
 $\unicode[STIX]{x1D705}_{e}$
satisfies
 $$\begin{eqnarray}\unicode[STIX]{x1D705}_{-}^{e}\leq \unicode[STIX]{x1D705}^{e}\leq \unicode[STIX]{x1D705}_{+}^{e}.\end{eqnarray}$$
An example (deterministic) representing a single realization
 $\unicode[STIX]{x1D714}\in \unicode[STIX]{x03A9}$
concerns a 1 m
 $\,\times \,$
1 m square domain
 $D$
with
 $u=0$
on boundaries
 $x_{1}=0,x_{1}=1.0$
and heat flux
 $\unicode[STIX]{x1D70E}=100~\text{W}~\text{m}^{-2}$
applied on
 $x_{2}=1.0$
and
 $\unicode[STIX]{x1D70E}=0$
on
 $x_{2}=0$
. The QoI is taken to be the average temperature over a circular domain
 $D_{q}$
of radius 0.05 m centred at point
 $(0.9,0.9)$
:
 $$\begin{eqnarray}Q(v)=|D_{q}|^{-1}\int _{D_{q}}v\text{d}x,\quad v\in H^{1}(D).\end{eqnarray}$$
The conductivities of the phases are
 $\unicode[STIX]{x1D705}_{I}=600~\text{W}~\text{(mK)}^{-1}$
and
 $\unicode[STIX]{x1D705}_{M}=100~\text{W}~\text{(mK)}^{-1}$
. The domain
 $D$
is partitioned with 25 regular square subdomains. One realization of the model is shown in Figure 9.1(a) with randomly distributed circular inclusions. The full problem is solved on a fine element mesh of over
 $33\,000$
elements, giving a good approximation of the ‘exact’ QoI of
 $Q_{exact}(u)\approx 0.0778$
.
Seven steps in the Goals algorithm are used to reduce the modelling error to below a tolerance of
 $\unicode[STIX]{x1D6FE}_{tol}=0.02Q_{exact}$
. Results are collected in Table 9.1. In this table,
 $\unicode[STIX]{x1D702}_{exact}^{(k)}=0.0778-Q(u_{0}^{(k)})$
, and
 ${\mathcal{E}}_{\unicode[STIX]{x1D702}}$
is the effectivity index,
 $$\begin{eqnarray}{\mathcal{E}}_{\unicode[STIX]{x1D702}}=\displaystyle \frac{{\textstyle \frac{1}{2}}(\unicode[STIX]{x1D702}_{upp}^{(k)}+\unicode[STIX]{x1D702}_{low}^{(k)})}{\unicode[STIX]{x1D702}_{exact}^{(k)}}.\end{eqnarray}$$
The sequence of adaptive error indicators is shown in Figure 9.2.
One realization of the randomly distributed circular inclusions in matrix form: (a) conductivity, (b) mesh.

Patterns of error indicators over a 25-block partition of
 $D$
and the finite element meshes employed in computing the surrogate solutions for levels
 $k=0,1,\ldots ,6$
: (a)
 $\unicode[STIX]{x1D702}_{est}^{up(k)}$
at each block, (b)
 $\unicode[STIX]{x1D702}_{est}^{low(k)}$
at each block.

Results of error estimation in each adaptive steps in constructing the surrogate models. In all the levels,
 $\unicode[STIX]{x1D719}_{I}=0.1020$
for the volume fraction of the inclusions.

10 Selection, calibration, and validation of families of stochastic parametric models: prediction of tumour growth
10.1 Selection versus adaptation
While the notion of adaptive modelling, particularly as described in the preceding sections, generally means the adaptation of the structure of a model to meet certain goals (such as accuracy in QoIs), it could also be interpreted as the adaptation of one’s choice of a model to be consistent with observational data. While not a common idea in works on adaptive modelling, the selection and validation of models are perhaps the most important components in all of computational science. Both adaptivity and model selection and validation share two traits – the subjective choice of criteria and tolerances for accepting one model over another – and they both aim at defining acceptable mathematical models for scientific predictions.
The algorithm OPAL, described in Section 8.5, is designed to provide one framework for selecting, calibrating and validating sets of parametric model classes. We describe an implementation of OPAL in this section drawn from work on modelling tumour growth in living tissue (e.g. Lima, Oden and Almeida Reference Lima, Oden and Almeida2014, Lima et al. Reference Lima, Oden, Hormuth, Yankeelov and Almeida2016, Lima et al. Reference Lima, Oden, Wohlmuth, Shahmoradi, Hormuth, Yankeelov, Scarabosio and Horger2017).
10.2 A canonical example: classes of phenomenological models of tumour growth
One of the most challenging areas in contemporary predictive computational science is the modelling and prediction of the growth of tumours in living organisms. It is field in which there is no general agreement on which models of this complex biophysical phenomena are adequate for prediction, in which reliable observational data are sparse and incomplete, and in which little data are available on the reliability of proposed models. Beyond these obstacles, the numerical solution and analysis of most tumour models is formidable and in early stages of development. We will, nevertheless, summarize an application of OPAL and the methods of model selection to one class of tumour growth models, following, in particular, Lima et al. (Reference Lima, Oden, Hormuth, Yankeelov and Almeida2016, Reference Lima, Oden, Wohlmuth, Shahmoradi, Hormuth, Yankeelov, Scarabosio and Horger2017).
10.2.1 The heterogeneous micro-cellular environment of tumours
A schematic figure of tumour environment and different involved in modelling tumour growth. (From Oden Reference Oden2017.)

An abstraction of the complex microenvironment of tumour cells is depicted in Figure 10.1, where we observe a colony of tumour cells in various stages of growth or decline, healthy cells, and other relevant constituents. The structural framework supporting this micro-cellular environment is called the stroma, and it is made up of collagen together with a collection of extra-cellular molecules called the extra-cellular matrix (ECM). Cells called fibroblasts synthesize the collagen and ECM and make up the main connective tissue cells present in the organism. Also present are macrophages, large white blood cells that engulf and digest cellular debris. Endothelial cells form the lining of blood vessels and lymphatic vessels.
We recall that cancer manifests itself in a series of stages in which genetic mutations of cells causes over-expression of oncogenes, the genes causing proliferation of tumour cells, or under-expression of mechanisms that control or suppress cell growth. Thereby, these genes alter homeostasis (the processes that preserve the architecture of the body) and lead to the creation of colony of aberrant cells. This mutation process may take years to progress, or can be accelerated by other factors in the microenvironment. Oncogenes are activated by subcell growth signals that promote cell proliferation or halt the cell cycle.
At the tissue scale, tumour cells that depend on oxygen and other nutrients to survive may enter the so-called hypoxic state between a state of proliferation, in which the possibility of mitosis occurs, and a state of unplanned cell death, called necrosis. In the necrotic state, water enters the cell, increasing pressure until it bursts, and the cell undergoes calcification going into a dormant state of micro-calcification. This cell death is different from apoptosis, programmed cell death, that occurs when the cells are no longer needed to preserve the latent architecture of the tissue or when they pose a threat to the organism. Thus, a colony of tumour cells can contain proliferative cells which can grow in number due to mitosis, hypoxic cells which are in essentially a suspended state that depends on the local nutrient and oxygen supply, and the necrotic cells.
The general tumour growth scenario is as follows. A mass of tumour cells establishes itself in its host tissue surrounded by its microenvironment, beginning with no vascular structure of its own. The survival of this collection of cells depends on its neighbouring cell structure, the stroma, for a supply of nutrient and growth factors to stimulate its growth. Without sufficient nutrients, an inner core of hypoxic cells forms and eventually some die, creating a necrotic core of dead cells. The outer cells, those with sufficient nutrients and growth factor concentrations, proliferate and cause an outward flux of cells that expands the tumour, causing mechanical compression of surrounding tissue and the base membrane that supports the tumour mass. The proliferating cells also absorb interstitial fluid to promote mitosis and growth of the mass of the tumour. The growing tumour interacts with the ECM, the surrounding environment, which is degraded and modified by the secretion of special enzymes. The ECM, in turn, releases growth factors that refuel tumour growth.
If insufficient nutrients are available to promote proliferation, hypoxia occurs which, remarkably, results in the release of proteins collectively called vascular endothelial growth factors (VEGF), which are among a group of proteins labelled tumour angiogenesis factors (TAFs). These TAFs diffuse outward from the nutrient-deprived hypoxic cells and invade regions outside the tumour, eventually reaching nearby blood vessels, coming into contact with endothelial cells that form the walls of the blood vessels. When these endothelial cells detect a gradient in the TAF they secrete special enzymes such as matrix metalloproteinases (MMPs) that degrade the ECM and the base membrane allowing the endothelial cells to migrate away from the parent blood vessel toward the TAF source through sprouts – fingers of blood vessels that gradually grow toward the hypoxic cell mass in microvascular tubes that, on contact with the hypoxic cells, supply the needed nutrients for cell proliferation. The hypoxic cells that are supplied with these nutrients are thus transformed into proliferative cells. This remarkable and complex process is called angiogenesis.
There are many accounts of these biological processes affecting cancer in the literature. The summary here follows Reynolds and Schecker (Reference Reynolds and Schecker1995) and Macklin, Cristini and Lowengrub (Reference Macklin, Cristini, Lowengrub, Cristini and Lowengrub2010).
10.3 A general class of tumour models
The following system of nonlinear evaluation equations is derived (Lima et al.
Reference Lima, Oden, Hormuth, Yankeelov and Almeida2016, Reference Lima, Oden and Almeida2014, Oden et al.
Reference Oden, Lima, Almeida, Feng, Rylander, Fuentes, Faghihi, Rahman, DeWitt and Gadde2016) using a combination of continuum mixture theory, under the assumption that the balance laws of physics must hold (balance of mass, momentum, energy, and the second law of thermodynamic) and that the basic ‘hallmarks of cancer’ (Hanahan and Weinberg Reference Hanahan and Weinberg2011, Reference Hanahan and Weinberg2000) serve as guidance for modelling the cancer-cell biology described above. The principal dependent variables in the model classes are scalar-valued functions
 $\unicode[STIX]{x1D719}_{\unicode[STIX]{x1D6FC}}:\bar{D}\times [0,T_{end}]$
 $\unicode[STIX]{x1D719}_{\unicode[STIX]{x1D6FC}}=\unicode[STIX]{x1D719}_{\unicode[STIX]{x1D6FC}}(\boldsymbol{x},t)$
, defined over a spatial domain
 $D\subset \mathbb{R}^{3}$
,
 $\unicode[STIX]{x1D6FC}=1,2,\ldots ,6$
, and
 $\unicode[STIX]{x1D707}$
. We have
 $$\begin{eqnarray}\displaystyle & & \displaystyle \unicode[STIX]{x1D719}_{1}=\unicode[STIX]{x1D719}_{T}=\text{VF (volume fraction) of tumour cells},\nonumber\\ \displaystyle & & \displaystyle \unicode[STIX]{x1D719}_{2}=\unicode[STIX]{x1D719}_{H}=\text{VF of hypoxic tumour cells},\nonumber\\ \displaystyle & & \displaystyle \unicode[STIX]{x1D719}_{3}=\unicode[STIX]{x1D719}_{N}=\text{VF of necrotic tumour cells},\nonumber\\ \displaystyle & & \displaystyle \unicode[STIX]{x1D719}_{4}=\unicode[STIX]{x1D719}_{\unicode[STIX]{x1D70E}}=\text{VF of nutrient},\nonumber\\ \displaystyle & & \displaystyle \unicode[STIX]{x1D719}_{5}=\unicode[STIX]{x1D719}_{TAF}=\text{VF of tumour angiogenesis factors},\nonumber\\ \displaystyle & & \displaystyle \unicode[STIX]{x1D719}_{6}=\unicode[STIX]{x1D719}_{e}=\text{VF of non-activated endothelial cells},\nonumber\\ \displaystyle & & \displaystyle \unicode[STIX]{x1D707},\unicode[STIX]{x1D707}_{e}=\text{chemical potentials}.\nonumber\end{eqnarray}$$
In general,
 $$\begin{eqnarray}\unicode[STIX]{x1D719}_{T}=\unicode[STIX]{x1D719}_{P}+\unicode[STIX]{x1D719}_{T}+\unicode[STIX]{x1D719}_{N},\end{eqnarray}$$
where
 $\unicode[STIX]{x1D719}_{P}$
is the volume fraction of proliferative cells. The general model is characterized by the system of partial differential equations
 $$\begin{eqnarray}\displaystyle \displaystyle \frac{\unicode[STIX]{x2202}\unicode[STIX]{x1D719}_{T}}{\unicode[STIX]{x2202}t} & = & \displaystyle \unicode[STIX]{x1D735}\cdot {\mathcal{M}}(\unicode[STIX]{x1D719}_{T},\unicode[STIX]{x1D719}_{H},\unicode[STIX]{x1D719}_{N})\unicode[STIX]{x1D735}\unicode[STIX]{x1D707}+S_{T},\nonumber\\ \displaystyle \unicode[STIX]{x1D707} & = & \displaystyle \unicode[STIX]{x1D6F9}^{\prime }(\unicode[STIX]{x1D719}_{T})-\unicode[STIX]{x1D716}_{T}^{2}\unicode[STIX]{x1D6E5}\unicode[STIX]{x1D719}_{T}-\unicode[STIX]{x1D712}_{0}\unicode[STIX]{x1D719}_{\unicode[STIX]{x1D70E}},\nonumber\\ \displaystyle \displaystyle \frac{\unicode[STIX]{x2202}\unicode[STIX]{x1D719}_{H}}{\unicode[STIX]{x2202}t} & = & \displaystyle \unicode[STIX]{x1D735}\cdot \bar{M}_{H}\unicode[STIX]{x1D719}_{H}^{2}\unicode[STIX]{x1D735}\unicode[STIX]{x1D707}+S_{H},\nonumber\\ \displaystyle \displaystyle \frac{\unicode[STIX]{x2202}\unicode[STIX]{x1D719}_{N}}{\unicode[STIX]{x2202}t} & = & \displaystyle \unicode[STIX]{x1D735}\cdot \bar{M}_{N}\unicode[STIX]{x1D719}_{N}^{2}\unicode[STIX]{x1D735}\unicode[STIX]{x1D707}+S_{N},\nonumber\\ \displaystyle \displaystyle \frac{\unicode[STIX]{x2202}\unicode[STIX]{x1D719}_{\unicode[STIX]{x1D70E}}}{\unicode[STIX]{x2202}t} & = & \displaystyle \unicode[STIX]{x1D735}\cdot M_{\unicode[STIX]{x1D70E}}\unicode[STIX]{x1D6FF}_{\unicode[STIX]{x1D70E}}^{-1}\unicode[STIX]{x1D735}\unicode[STIX]{x1D719}_{\unicode[STIX]{x1D70E}}-\unicode[STIX]{x1D735}\cdot M_{\unicode[STIX]{x1D70E}}\unicode[STIX]{x1D712}_{0}\unicode[STIX]{x1D735}\unicode[STIX]{x1D719}_{T}+S_{\unicode[STIX]{x1D70E}},\nonumber\\ \displaystyle \displaystyle \frac{\unicode[STIX]{x2202}\unicode[STIX]{x1D719}_{TAF}}{\unicode[STIX]{x2202}t} & = & \displaystyle \unicode[STIX]{x1D735}\cdot M_{TAF}\unicode[STIX]{x1D6FF}_{TAF}^{-1}\unicode[STIX]{x1D735}\unicode[STIX]{x1D719}_{TAF}+S_{TAF},\nonumber\\ \displaystyle \displaystyle \frac{\unicode[STIX]{x2202}\unicode[STIX]{x1D719}_{e}}{\unicode[STIX]{x2202}t} & = & \displaystyle \unicode[STIX]{x1D735}\cdot \bar{M}_{e}\unicode[STIX]{x1D719}_{e}^{2}\unicode[STIX]{x1D735}\unicode[STIX]{x1D707}_{e}+S_{e},\nonumber\\ \displaystyle \unicode[STIX]{x1D707}_{e} & = & \displaystyle \unicode[STIX]{x1D6F9}^{\prime }(\unicode[STIX]{x1D719}_{e})-\unicode[STIX]{x1D716}_{e}^{2}\unicode[STIX]{x1D6E5}\unicode[STIX]{x1D719}_{e},\end{eqnarray}$$
in
 $\unicode[STIX]{x03A9}\times (0,T)$
, where
 $S_{T}=\unicode[STIX]{x1D706}_{P}\unicode[STIX]{x1D719}_{\unicode[STIX]{x1D70E}}(\unicode[STIX]{x1D719}_{T}-\unicode[STIX]{x1D719}_{H}-\unicode[STIX]{x1D719}_{N})-\unicode[STIX]{x1D706}_{A}(\unicode[STIX]{x1D719}_{T}-\unicode[STIX]{x1D719}_{N})$
, and
 $$\begin{eqnarray}\displaystyle S_{P} & = & \displaystyle \unicode[STIX]{x1D706}_{P}\unicode[STIX]{x1D719}_{\unicode[STIX]{x1D70E}}\unicode[STIX]{x1D719}_{P}-\unicode[STIX]{x1D706}_{A}\unicode[STIX]{x1D719}_{P}-\unicode[STIX]{x1D706}_{PH}{\mathcal{H}}(\unicode[STIX]{x1D70E}_{PH}-\unicode[STIX]{x1D719}_{\unicode[STIX]{x1D70E}})\unicode[STIX]{x1D719}_{P}\nonumber\\ \displaystyle & & \displaystyle \quad +\unicode[STIX]{x1D706}_{HP}{\mathcal{H}}(\unicode[STIX]{x1D719}_{\unicode[STIX]{x1D70E}}-\unicode[STIX]{x1D70E}_{HP})\unicode[STIX]{x1D719}_{H},\nonumber\\ \displaystyle S_{H} & = & \displaystyle -\unicode[STIX]{x1D706}_{A}\unicode[STIX]{x1D719}_{H}+\unicode[STIX]{x1D706}_{PH}{\mathcal{H}}(\unicode[STIX]{x1D70E}_{PH}-\unicode[STIX]{x1D719}_{\unicode[STIX]{x1D70E}})\unicode[STIX]{x1D719}_{P}-\unicode[STIX]{x1D706}_{HP}{\mathcal{H}}(\unicode[STIX]{x1D719}_{\unicode[STIX]{x1D70E}}-\unicode[STIX]{x1D70E}_{HP})\unicode[STIX]{x1D719}_{H}\nonumber\\ \displaystyle & & \displaystyle \quad -\unicode[STIX]{x1D706}_{HN}{\mathcal{H}}(\unicode[STIX]{x1D70E}_{HN}-\unicode[STIX]{x1D719}_{\unicode[STIX]{x1D70E}})\unicode[STIX]{x1D719}_{H},\nonumber\\ \displaystyle S_{N} & = & \displaystyle \unicode[STIX]{x1D706}_{HN}{\mathcal{H}}(\unicode[STIX]{x1D70E}_{HN}-\unicode[STIX]{x1D719}_{\unicode[STIX]{x1D70E}})\unicode[STIX]{x1D719}_{H},\nonumber\\ \displaystyle S_{\unicode[STIX]{x1D70E}} & = & \displaystyle -\unicode[STIX]{x1D706}_{P}\unicode[STIX]{x1D719}_{\unicode[STIX]{x1D70E}}\unicode[STIX]{x1D719}_{P}-\unicode[STIX]{x1D706}_{P_{h}}\unicode[STIX]{x1D719}_{\unicode[STIX]{x1D70E}}\unicode[STIX]{x1D719}_{H}+\unicode[STIX]{x1D706}_{A}(\unicode[STIX]{x1D719}_{P}+\unicode[STIX]{x1D719}_{H})+\unicode[STIX]{x1D6FC}_{R}(1-\unicode[STIX]{x1D719}_{\unicode[STIX]{x1D70E}})\unicode[STIX]{x1D719}_{e},\nonumber\\ \displaystyle S_{TAF} & = & \displaystyle \unicode[STIX]{x1D706}_{TAF}(1-\unicode[STIX]{x1D719}_{TAF})\unicode[STIX]{x1D719}_{H}-\unicode[STIX]{x1D6FC}_{TAF}\unicode[STIX]{x1D719}_{TAF}\unicode[STIX]{x1D719}_{e}{\mathcal{H}}(\unicode[STIX]{x1D719}_{TAF}-\unicode[STIX]{x1D719}_{TAF_{c}}),\nonumber\\ \displaystyle S_{e} & = & \displaystyle \unicode[STIX]{x1D6FC}_{P}(\unicode[STIX]{x1D719}_{TAF})\unicode[STIX]{x1D719}_{e}{\mathcal{H}}(\unicode[STIX]{x1D719}_{TAF}-\unicode[STIX]{x1D719}_{TAF_{c}}),\end{eqnarray}$$
Here
 ${\mathcal{H}}$
denotes the Heaviside step function, defining switches from proliferative to hypoxic, back to proliferative cells, apoptosis, etc. depending on the nutrient content
 $\unicode[STIX]{x1D719}_{\unicode[STIX]{x1D70E}}$
and cell concentration
 $\unicode[STIX]{x1D719}_{T}$
. The
 $\unicode[STIX]{x1D706}$
and
 $\unicode[STIX]{x1D6FC}$
are material parameters and
 $M$
’s cell mobility functions. Here we take
 $$\begin{eqnarray}\displaystyle {\mathcal{M}}(\unicode[STIX]{x1D719}_{T},\unicode[STIX]{x1D719}_{H},\unicode[STIX]{x1D719}_{N}) & = & \displaystyle \bar{M}_{P}(\unicode[STIX]{x1D719}_{T}-\unicode[STIX]{x1D719}_{H}-\unicode[STIX]{x1D719}_{N})^{2}+\bar{M}_{H}\unicode[STIX]{x1D719}_{H}^{2}+\bar{M}_{N}\unicode[STIX]{x1D719}_{N}^{2},\nonumber\\ \displaystyle \text{for }M_{H} & = & \displaystyle \bar{M}_{T}\unicode[STIX]{x1D719}_{H}^{2},~M_{N}=\bar{M}_{N}\unicode[STIX]{x1D719}_{N}^{2},~M_{e}=\bar{M}_{e}\unicode[STIX]{x1D719}_{e}^{2},\end{eqnarray}$$
where
 $\bar{M}_{P}$
,
 $\bar{M}_{H}$
,
 $\bar{M}_{N}$
and
 $\bar{M}_{e}$
are positive constants (or time-independent densities). Among typical boundary conditions on the boundary
 $\unicode[STIX]{x2202}\unicode[STIX]{x03A9}$
over a time interval
 $(0,\unicode[STIX]{x1D70F})$
, we list the following:
 $$\begin{eqnarray}\displaystyle \unicode[STIX]{x1D735}\unicode[STIX]{x1D719}_{T}\cdot \boldsymbol{n}=\unicode[STIX]{x1D735}\unicode[STIX]{x1D707}_{T}\cdot \boldsymbol{n}=\unicode[STIX]{x1D735}\unicode[STIX]{x1D719}_{H}\cdot \boldsymbol{n}=\unicode[STIX]{x1D735}\unicode[STIX]{x1D719}_{N}\cdot \boldsymbol{n}=\unicode[STIX]{x1D735}\unicode[STIX]{x1D707}_{\unicode[STIX]{x1D70E}}\cdot \boldsymbol{n} & =0, & \displaystyle \nonumber\\ \displaystyle \unicode[STIX]{x1D735}\unicode[STIX]{x1D719}_{TAF}\cdot \boldsymbol{n}=\unicode[STIX]{x1D735}\unicode[STIX]{x1D719}_{e}\cdot \boldsymbol{n}=\unicode[STIX]{x1D735}\unicode[STIX]{x1D707}_{e}\cdot \boldsymbol{n}=\unicode[STIX]{x1D735}\unicode[STIX]{x1D719}_{\unicode[STIX]{x1D70E}}\cdot \boldsymbol{n}=0, & & \displaystyle\end{eqnarray}$$
on
 $\unicode[STIX]{x2202}\unicode[STIX]{x03A9}\times (0,\unicode[STIX]{x1D70F})$
,
 $\boldsymbol{n}$
being a unit exterior normal to
 $\unicode[STIX]{x2202}\unicode[STIX]{x03A9}$
.
10.4 OPAL: predicting glioma growth in murine subjects
As emphasized in earlier sections of the article, the predictability of computational models brings on the ability and use of relevant observational data to calibrate and validate the models, a fact frequently overlooked by modellers. Here we describe an application of OPAL of Section 8.5 in which sparse data on the progression of brain cancer, glioma, in murine subjects (laboratory rats) are provided over a 20-day period through MRI images.
These subclasses of the models in (10.2) and (10.3) are considered.
(i) Reaction–diffusion models (
$\unicode[STIX]{x1D707}$
=constant
$\times \unicode[STIX]{x1D719}_{T}$
): (10.6)$$\begin{eqnarray}\displaystyle \frac{\unicode[STIX]{x2202}\unicode[STIX]{x1D719}_{T}}{\unicode[STIX]{x2202}t}=\unicode[STIX]{x1D735}\cdot M_{T}^{\ast }+\unicode[STIX]{x1D706}_{T}^{grow}\unicode[STIX]{x1D719}_{T}(1-\unicode[STIX]{x1D719}_{T}).\end{eqnarray}$$
(ii) Reaction–diffusion models with mechanical coupling:
(10.7)$$\begin{eqnarray}\displaystyle \displaystyle \frac{\unicode[STIX]{x2202}\unicode[STIX]{x1D719}_{T}}{\unicode[STIX]{x2202}t} & = & \displaystyle \unicode[STIX]{x1D735}\cdot M_{T}^{\ast }+\unicode[STIX]{x1D706}_{T}^{grow}\unicode[STIX]{x1D719}_{T}(1-\unicode[STIX]{x1D719}_{T}),\nonumber\\ \displaystyle \unicode[STIX]{x1D707} & = & \displaystyle c\unicode[STIX]{x1D719}_{T}-\unicode[STIX]{x1D706}\unicode[STIX]{x1D735}\cdot \boldsymbol{u}.\end{eqnarray}$$
(iii) Phase-field models:
(10.8)$$\begin{eqnarray}\displaystyle \displaystyle \frac{\unicode[STIX]{x2202}\unicode[STIX]{x1D719}_{T}}{\unicode[STIX]{x2202}t} & = & \displaystyle \unicode[STIX]{x1D735}\cdot M_{PF}(\unicode[STIX]{x1D719}_{T})\unicode[STIX]{x1D735}\unicode[STIX]{x1D707}+\unicode[STIX]{x1D706}_{T}^{grow}\unicode[STIX]{x1D719}_{T}(1-\unicode[STIX]{x1D719}_{T}),\nonumber\\ \displaystyle \unicode[STIX]{x1D707} & = & \displaystyle 2\bar{E}\unicode[STIX]{x1D719}_{T}(1-3\unicode[STIX]{x1D719}_{T}+2\unicode[STIX]{x1D719}_{T}^{2})-\unicode[STIX]{x1D716}_{T}^{2}\unicode[STIX]{x1D6FF}\unicode[STIX]{x1D719}_{T}-\unicode[STIX]{x1D706}\unicode[STIX]{x1D735}\cdot \boldsymbol{u}.\end{eqnarray}$$


Here
 $M_{T},\unicode[STIX]{x1D706}_{T}^{grow},c,\unicode[STIX]{x1D706},\bar{E},\unicode[STIX]{x1D700}_{T}$
are possibly random material parameters,
 $\boldsymbol{u}$
is a global displacement field over
 $\unicode[STIX]{x03A9}$
determined by a model of isotropic linear elasticity with mechanical parameter
 $E$
and
 $\unicode[STIX]{x1D708}$
. Mechanical coupling with cell mobility is modelled by setting
 $M_{T}=\bar{M_{T}}\exp (\unicode[STIX]{x1D6FE}\unicode[STIX]{x03A3})$
and
 $M_{T}^{\ast }=\bar{M_{T}}^{\ast }\exp (\unicode[STIX]{x1D6FE}\unicode[STIX]{x03A3})$
and
 $\unicode[STIX]{x1D706}_{T}^{grow}=\bar{\unicode[STIX]{x1D706}}_{T}^{grow}\exp (\unicode[STIX]{x1D6FE}\unicode[STIX]{x03A3})$
,
 $\unicode[STIX]{x03A3}$
being the von Mises stress in the tumour mass.
A set of 13 possible models can be derived from (10.6)–(10.8) for different combination of parameters, leading to four reaction–diffusion models (RD01–RD04), four reaction–diffusion models with mechanical effect (MD01–MD04), and four phase field models (PH01–PH05). The models, parameters and Occam categories are indicated in Table 10.1.
Initial set of possible models (from Lima et al. Reference Lima, Oden, Hormuth, Yankeelov and Almeida2016).

Sensitivity analysis of all parameters was conducted using the elementary effect method (Morris method) described in Section 7.4.1 and uniform priors were employed for all parameters for the calibration phase, but the calibration posteriors used as priors in the validation scenario proved to be multi-modal and non-Gaussian. Monte Carlo methods were used to solve the forward problems and MCMC-parallel tempering algorithms were employed for the Bayesian inversion. Full details are given in Lima et al. (Reference Lima, Oden, Hormuth, Yankeelov and Almeida2016). Results of the OPAL calculations are collected in Table 10.2.
Results and plausibilities (from Lima et al. Reference Lima, Oden, Hormuth, Yankeelov and Almeida2016).

The first model, RD01, a reaction–diffusion model with only two parameters,
 $M_{T}^{\ast }$
and
 $\unicode[STIX]{x1D706}_{T}^{grow}$
, is in Occam category 1. The Kullback–Leibler divergence divided by the variance in data (
 $\unicode[STIX]{x1D70E}_{t}^{z}$
) at
 $t=16$
and
 $t=18$
days is used as a validation metric with validation tolerance
 $\unicode[STIX]{x1D6FE}_{tol}=0.7$
corresponding to a threshold of around
 $10\%$
of the tumour mass (or the tumour area). The computed validation prior (calibration posterior) and validation posterior are illustrated in Figure 10.2.
Prior (
 $\unicode[STIX]{x1D70B}_{prior}^{V}(\boldsymbol{\unicode[STIX]{x1D703}}_{1}|{\mathcal{P}}_{1},{\mathcal{M}})$
) and posterior (
 $\unicode[STIX]{x1D70B}_{post}^{V}(\boldsymbol{\unicode[STIX]{x1D703}}_{1}|\boldsymbol{y}_{V},{\mathcal{P}}_{1},{\mathcal{M}})$
) for model RD01 at the validation step. (Reproduced from Lima et al. Reference Lima, Oden, Hormuth, Yankeelov and Almeida2016 with permission from World Scientific.)

Using the stated criteria, RD01 is declared invalid. Through similar calculations in the OPAL framework, PF01 (category 2) was also invalid. Model PF04 from category 5 satisfies the prescribed tolerance (
 $D_{KL}(\unicode[STIX]{x1D70E}_{16}^{2})=0.070$
,
 $D_{KL}(\unicode[STIX]{x1D70E}_{18}^{2})=0.66$
), and is declared not invalid (or ‘valid’). Thus, it is not necessary to consider more complex models such as PF05.
Extensions of such model selection and validation have been represented for experiments involving radiation therapy for glioma Lima et al. (Reference Lima, Oden, Wohlmuth, Shahmoradi, Hormuth, Yankeelov, Scarabosio and Horger2017), and calculation of highly heterogeneous multispecies models such as (10.7) is based on in vitro laboratory data on cell cultures, is a topic currently under study. A comparison of predicted and measured tumour areas is given in Figure 10.3.
Comparison of measured and predicted tumour area evolution for a slice at
 $t=16$
(a, b) and
 $t=18$
(c, d). (Reproduced from Lima et al. Reference Lima, Oden, Hormuth, Yankeelov and Almeida2016 with permission from World Scientific.)

10.5 Multiscale models of tumour growth
We close this section with a discussion of a truly multiscale model of tumour growth that transcends spatial and temporal scales.
(i) Tissue scale: phenomenological models involving stochastic partial differential equation (centimetres, days, years).
(ii) Cell models: agent-based or rule-based models of cell proliferation, mobility and apoptosis (microns, minutes).
(iii) Transduction: subcell network models of signalling pathways involving large systems of nonlinear ordinary differential equations (nanometres, microseconds).
One could also add to this hierarchy genome models that use genetic sequencing to regulate and inform events (protein structures) in the cell nucleus.
As a representative of the tissue scale class, we recall the model of mass balance of tumour cells in (10.7)
 $_{1}$
:
 $$\begin{eqnarray}\displaystyle \frac{\unicode[STIX]{x2202}\unicode[STIX]{x1D719}_{T}}{\unicode[STIX]{x2202}t}=\unicode[STIX]{x1D735}\cdot M(\unicode[STIX]{x1D719}_{T})\unicode[STIX]{x1D735}\unicode[STIX]{x1D719}_{T}+\unicode[STIX]{x1D706}^{grow}\unicode[STIX]{x1D719}_{\unicode[STIX]{x1D70E}}(\unicode[STIX]{x1D719}_{P})-\unicode[STIX]{x1D706}^{apop}(\unicode[STIX]{x1D719}_{T}-\unicode[STIX]{x1D719}_{N})\end{eqnarray}$$
plus initial and boundary conditions,
 $\unicode[STIX]{x1D719}_{T}$
being the tumour cell volume fraction,
 $\unicode[STIX]{x1D719}_{\unicode[STIX]{x1D70E}}$
the nutrient VF,
 $\unicode[STIX]{x1D719}_{P}=\unicode[STIX]{x1D719}_{T}-\unicode[STIX]{x1D719}_{H}-\unicode[STIX]{x1D719}_{N}$
, the VF of proliferative cells, and
 $\unicode[STIX]{x1D719}_{H}$
and
 $\unicode[STIX]{x1D719}_{N}$
the VFs of hypoxic and necrotic cells. As
 $\unicode[STIX]{x1D719}_{P}$
and
 $\unicode[STIX]{x1D719}_{\unicode[STIX]{x1D70E}}$
increase,
 $\unicode[STIX]{x1D719}_{T}$
grows at a rate governed by the proliferative rate parameter
 $\unicode[STIX]{x1D706}^{grow}$
. As the difference in viable tumour cells and necrotic cells increases, cells die through apoptosis at a rate influenced by parameter
 $\unicode[STIX]{x1D706}^{apop}$
.
At the cellular scale, a point
 $\boldsymbol{x}$
in
 $D$
at time
 $t$
with a tumour cell VF
 $\unicode[STIX]{x1D719}_{T}$
becomes a domain
 $D_{T}^{(t)}(\boldsymbol{x})$
occupied by many thousands of tumour cells bathing in a uniform nutrient bath of intensity
 $\unicode[STIX]{x1D719}_{\unicode[STIX]{x1D70E}},\unicode[STIX]{x03A9}_{T}^{(t)}(\boldsymbol{x})$
. There, depending on the level of a protein epidermal growth factor (EGF), the individual cells may or may not traverse the cell cycle, going from quiescent states (
 $G_{0}$
) to synthesis (
 $S$
) to proliferative states (
 $G_{1}$
) at which mitosis can occur, usually in cell splitting and, therefore, proliferation. Or the cells may die, either by apoptosis, natural death (homeostasis), or becoming necrotic due to lack of nutrients. Clusters of cells may separate and move in
 $\unicode[STIX]{x03A9}_{T}^{(t)}(\boldsymbol{x})$
, coming into contact with other cells, and adhesion of cells may affect proliferation rates. These cell-level events are orchestrated by rules depending on the nutrient concentration and the concentration of a protein EGF, manipulated in the cell nucleus and by cell densities.
The cells themselves are suspended in an extra-cellular medium in which molecules react with receptor proteins on the surface membrane of the cell. This initiates a biochemical chain of events, called a signalling cascade or signal transduction, that leads to cell response, such as signalling cell differentiation, apoptosis, proliferation through mitosis, gene expression, etc. The rates of reactions of proteins along these subcell pathways are generally believed to be governed by the laws of chemical kinetics, formally stoichiometry, and for this reason, chemical kinetics provides a natural framework for developing discrete network models of signal transduction – generally characterized by systems of ordinary differential equations connecting protein concentrations through enzymatic reactions.
One of the principal threads connecting the models of different scales (there are several) is the production of a protein EGF, in the cell nucleus as a product of cell transduction. This is the subcellular QoI: the target output that determines, in part, the cell sequencing at the cell-level model. Depending on the EGF concentrations (and nutrient levels), apoptosis rates rise and fall. A cell-level QoI is the average cell apoptosis and proliferation rates which, on average, determine the rate parameters
 $\unicode[STIX]{x1D706}^{grow}$
and
 $\unicode[STIX]{x1D706}^{apop}$
in the tissue scale model (10.9). A suitable QoI at the tissue scale is the ensemble average of the tumour mass of volume (e.g.
 $\mathbb{E}[\int _{\unicode[STIX]{x03A9}}\unicode[STIX]{x1D719}_{T}(\cdot ,T_{end})\text{d}\boldsymbol{x}]$
. A systematic analysis, calibration and validation of such multiscale models remains an open problem. Aside from formidable conceptual, mathematical and computational issues, the acquisition of relevant observational data at all scales stands as a major challenge.
Comments and acknowledgements
Portions of this article are based on lecture notes Oden (Reference Oden2017) that can be accessed from https://www.ices.utexas.edu and on portions of a chapter in Oden et al. (Reference Oden, Babuška, Faghihi, Stein, de Borst and Hughes2018). The calculations given in Section 9.5 are derived from the work of Laura Scarabosio, Barbara Wohlmuth and Danial Faghihi. The author thanks Danial Faghihi, Ernesto Lima and Amir Shahmoradi for their help in typing and proofing an earlier draft of the work. Extensions of the model selection paradigm and implementation of OPAL discussed in Section 10 have been made in the recent article by Lima et al. (Reference Lima, Oden, Wohlmuth, Shahmoradi, Hormuth, Yankeelov, Scarabosio and Horger2017). The support of the US Department of Energy, Office of Science, Office of Advanced Scientific Computing Research and Applied Mathematics Program during the writing of much of this work is gratefully acknowledged.