Introduction
Evidence from community-based surveys suggests that symptoms of depression and anxiety are common in older people. The prevalence of depressive symptoms in people aged 60 years or over in community settings ranges from 8% to 20% (Gallo & Lebowitz, Reference Gallo and Lebowitz1999), while the prevalence of anxiety symptoms is even higher, at between 15% and 52% (Bryant et al. Reference Bryant, Jackson and Ames2008). A substantial proportion of older people with depressive symptoms also experiences symptoms of anxiety – 43% in one survey (Mehta et al. Reference Mehta, Simonsick, Penninx, Schulz, Rubin, Satterfield and Yaffe2003). Such symptoms cause considerable distress, and may have implications for later health: individuals with severe forms of anxiety or depression have increased mortality (Wulsin et al. Reference Wulsin, Vaillant and Wells1999; Brenes et al. Reference Brenes, Kritchevsky, Mehta, Yaffe, Simonsick, Ayonayon, Rosano, Rubin, Satterfield and Penninx2007).
Susceptibility to anxiety and depression at older ages may be influenced by environmental exposures early in life. Several studies suggest that people whose fetal growth was impaired have an increased risk of anxiety and depression in adolescence and early adulthood (Gale & Martyn, Reference Gale and Martyn2004; Alati et al. Reference Alati, Lawlor, Mamun, Williams, Najman, O'Callaghan and Bor2007; Bohnert & Breslau, Reference Bohnert and Breslau2008), though this is not a consistent finding (Osler et al. Reference Osler, Nordentoft and Andersen2005; Inskip et al. Reference Inskip, Dunn, Godfrey, Cooper and Kendrick2008). Poor fetal growth may have a lasting influence on susceptibility to distress into middle age (Colman et al. Reference Colman, Ploubidis, Wadsworth, Jones and Croudace2007), but few studies have examined its relationship with anxiety and depression in later life (Thompson et al. Reference Thompson, Syddall, Rodin, Osmond and Barker2001). Being brought up in a household that is socio-economically disadvantaged has also been linked with a higher risk of psychological distress in adult life (Schoon et al. Reference Schoon, Sacker and Bartley2003), though here too the evidence is inconsistent. Findings in young adults suggest that the proximal experience of low socio-economic status may exert a more important influence on risk of depression than socio-economic disadvantage in childhood (Poulton et al. Reference Poulton, Caspi, Milne, Thomson, Taylor, Sears and Moffitt2002).
Among exposures later in the life course, the presence of chronic somatic disease (Beekman et al. Reference Beekman, Penninx, Deeg, Ormel, Braam and van Tilburg1997), disability (Braam et al. Reference Braam, Prince, Beekman, Delespaul, Dewey, Geerlings, Kivela, Lawlor, Magnusson, Meller, Peres, Reischies, Roelands, Schoevers, Saz, Skoog, Turrina, Versporten and Copeland2005), poorer physical function (Penninx et al. Reference Penninx, Guralnik, Ferrucci, Simonsick, Deeg and Wallace1998), cognitive impairment (Dufouil et al. Reference Dufouil, Fuhrer, Dartigues and Alperovitch1996) and obesity (Rivenes et al. Reference Rivenes, Harvey and Mykletun2009) have all been associated with increased depression in older people in cross-sectional analyses, though the links between cognitive impairment or obesity and depressive symptoms are not always consistent between the sexes (Kennedy et al. Reference Kennedy, Kelman, Wisniewsky, Metz and Bijur1989; Mather et al. Reference Mather, Cox, Enns and Sareen2009). Fewer studies have examined factors linked with anxiety in later life (Vink et al. Reference Vink, Aartsen and Schoevers2008), but there is some indication that there may be considerable overlap between concurrent risk factors for anxiety and depression (Schoevers et al. Reference Schoevers, Beekman, Deeg, Jonker and van Tilburg2003).
One factor that may increase resilience to both anxiety and depression at older ages is higher cognitive ability earlier in life. People who score higher on tests of cognition in childhood or early adulthood have a lower risk of anxiety or depression (Martin et al. Reference Martin, Kubzansky, Lewinn, Lipsitt, Satz and Buka2007; Gale et al. Reference Gale, Deary, Boyle, Barefoot, Mortensen and Batty2008, Reference Gale, Hatch, Batty and Deary2009).
The relative importance of these early- and later-life factors as potential determinants of anxiety or depression in older people is uncertain. Although there has been one systematic review and meta-analysis of data on risk factors for depression among community-dwelling older people (Cole & Dendukuri, Reference Cole and Dendukuri2003), it contained no data on neuroticism, physical function, obesity, social class, peak prior cognition, or factors from early life. To our knowledge, there has been no meta-analysis of risk factors for symptoms of anxiety in older people, largely due to the lack of relevant studies (Vink et al. Reference Vink, Aartsen and Schoevers2008).
The aim of this study is to examine the associations between factors from early (birth weight and childhood social class) and later life [current social class, neuroticism, peak cognitive ability, fluid intelligence, physical function, disability, body mass index (BMI) and chronic illness] and depression and anxiety in five cohorts of community-dwelling older people. We obtain overall effect estimates for each risk factor and examine the consistency of the associations using meta-analysis.
Method
Studies included
The Healthy Ageing across the Life Course (HALCyon) Programme is a collaborative research programme using data from nine UK cohorts to examine how factors across the life course influence psychological well-being and other aspects of healthy ageing in older people. This study uses data from five of these cohorts (n=5570).
The Aberdeen Birth Cohort 1936 (ABC)
In 1947, as part of the Scottish Mental Survey, 70 805 children born in 1936 who attended school in Scotland sat a test of mental ability. In 1999–2001, 567 of these people who were living in the Aberdeen area were invited to participate in a study of cognitive ageing (Deary et al. Reference Deary, Whiteman, Starr, Whalley and Fox2004). Of the 423 (75%) participants, 418 completed the Hospital Anxiety and Depression Scale (HADS; Zigmond & Snaith, Reference Zigmond and Snaith1983).
The Caerphilly Prospective Study (CaPS)
This study was originally set up to study the aetiology of heart disease in men (Anon, 1984). In 2002–2004, 1225 men (75% of those invited) took part in the fifth follow-up of the cohort; 1028 completed the HADS.
The Hertfordshire Ageing Study (HAS)
From 1911 until 1948 the birth weight of each baby born in Hertfordshire was recorded. Those born between 1920 and 1930 and who were still living in the county were invited to participate in a study on influences on ageing (Syddall et al. Reference Syddall, Simmonds, Martin, Watson, Dennison, Cooper and Sayer2009). In 2003–2005, 359 people (60% of those surviving) took part in a follow-up study; 357 completed the HADS.
The Hertfordshire Cohort Study (HCS)
In 1998–2004, men and women born in Hertfordshire between 1931 and 1939 and still living in the county were recruited to a new study of influences on chronic disorders in later life (Syddall et al. Reference Syddall, Sayer, Dennison, Martin, Barker and Cooper2005). A total of 3225 people (53% of those invited) took part and 3221 completed the HADS.
The Lothian Birth Cohort 1921 (LBC)
In 1932, as part of the Scottish Mental Survey, 87 498 children born in 1921 who attended school in Scotland sat a test of mental ability. In 1999–2001, those of them living in the Edinburgh area were invited (through letters and adverts) to participate in a study of influences on cognitive ageing (Deary et al. Reference Deary, Whiteman, Starr, Whalley and Fox2004). Of the 549 people who participated, 547 completed the HADS.
Depression and anxiety
Symptoms of depression and anxiety were assessed using the HADS. This scale was designed to identify cases of anxiety (HADS-A) and depression (HADS-D) using two subscales, each of seven items. Exploration of the psychometric properties of the scale in four of the cohorts studied here has confirmed its bi-dimensional structure in community-dwelling older people (Gale et al. Reference Gale, Allerhand, Sayer, Cooper, Dennison, Starr, Ben-Shlomo, Gallacher, Kuh and Deary2010). Scores range from 0 to 21, with higher scores indicating more severe symptoms. The authors of the HADS suggest cut-points for scores according to possible (8–10) or probable (>11) depression or anxiety. As numbers with probable depression were very small in some cohorts (see Table 1), we defined the presence or absence of depression or anxiety according to whether scores on the relevant subscale were ⩾8.
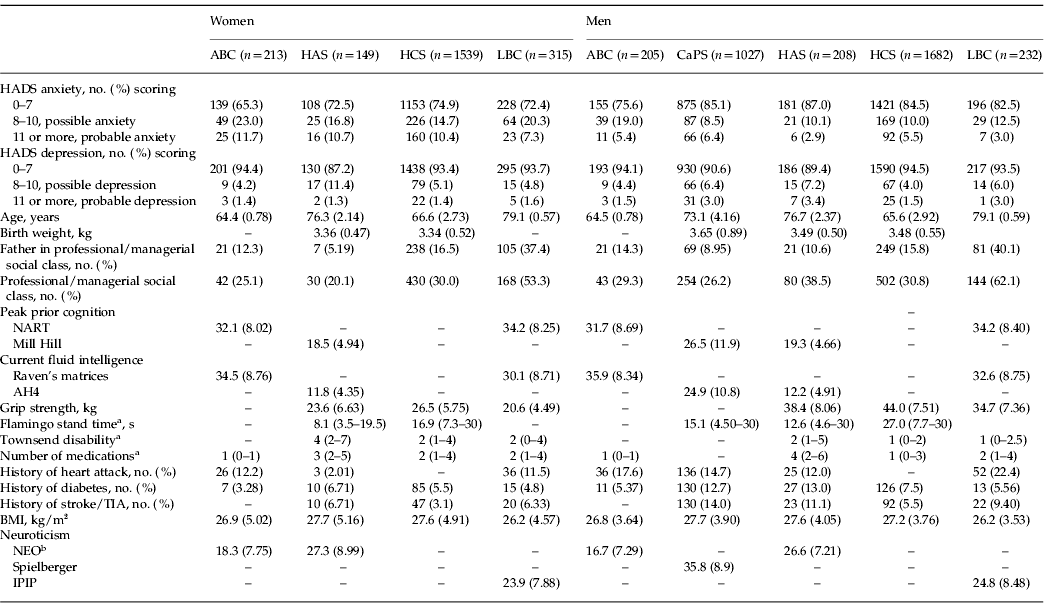
Characteristics of women and men from the ABC, HAS, HCS, LBC and the CaPS

ABC, Aberdeen Birth Cohort 1936; HAS, Hertfordshire Ageing Study; HCS, Hertfordshire Cohort Study; LBC, Lothian Birth Cohort 1921; CaPS, Caerphilly Prospective Study; HADS, Hospital Anxiety and Depression Scale; NART, National Adult Reading Test; TIA, transient ischaemic attack; BMI, body mass index; NEO, Neuroticism-Extroversion-Openness; IPIP, International Personality Item Pool.
Data are given as mean (standard deviation) or as number (percentage).
a Median (interquartile range).
b The two cohorts that used the NEO employed different scoring, hence the variation in mean scores.
Birth weight
Information on birth weight, from health visitor records, was available for all participants in the HCS and HAS. Information on maternal recollection of birth weight was available for a subset of men in the CaPS (n=465) who had been recruited at the start of the study.
Social class in childhood or currently
Participants provided information on father's occupation at birth (HAS, HCS) or at age 11 years (ABC, CaPS, LBC) and on their own (or for married women, their husband's) current or most recent occupation. In CaPS, information on father's occupation was collected during the initial phase of the study only, so is unavailable for participants recruited subsequently. In the CaPS, HAS and HCS, occupations were classified into six groups according to the Registrar General's social class categories (CaPS) or the Office of Population Censuses and Surveys occupational classification scheme (OPCS, 1990) (HAS, HCS). In the LBC, occupations were classified into five groups according to the Registrar General's social class categories. In the ABC, occupations were classified into nine groups according to the standard occupational classification.
Cognitive function
Participants in all cohorts, except the HCS, had their cognitive function assessed when they completed the HADS. Peak prior cognitive ability – or crystallized intelligence – was estimated using the National Adult Reading Test (Nelson & Willison, Reference Nelson and Willison1991) (in ABC, LBC and CaPS) or the Mill Hill Vocabulary Test (in HAS) (Raven, Reference Raven1965). Performance on such tests is highly correlated with cognitive ability in childhood (Crawford et al. Reference Crawford, Deary, Starr and Whalley2001). Current (fluid) intelligence was assessed with Raven's Standard Progressive Matrices (Raven et al. Reference Raven, Court and Raven1977) (in ABC and LBC) or part 1 of the AH4 test (in CaPS and HAS) (Heim, Reference Heim1968).
Physical function
Participants in four of the cohorts had their physical function measured when they completed the HADS. With the exception of those whose balance difficulties or need for a walking aid made standing on one leg impossible, all participants in the CaPS, HAS and HCS were asked to do a timed flamingo stand for a maximum of 30 s (Briggs et al. Reference Briggs, Gossman, Birch, Drews and Shaddeau1989). Participants in the HAS, HCS and LBC had their hand grip strength measured. Three measurements were made of both hands, using a Jamar dynamometer, and the maximum overall grip strength was used in the analysis.
Self-reported disability
Participants in the HAS, HCS and LBC completed the Townsend Disability Scale when they completed the HADS. This scale enquires about level of difficulty experienced in carrying out activities of daily living (Townsend, Reference Townsend1979). Scores range from 0 to 18, with higher scores indicating greater disability. In the HCS, this scale, along with the HADS, was administered to a subset only (n=640).
Neuroticism
Information on neuroticism was available for four cohorts. In the ABC, HAS and LBC, neuroticism was assessed when the HADS was completed; in the CaPS, it was assessed around 14 years prior to the HADS measurement. Neuroticism was measured using the relevant items from the Neuroticism-Extroversion-Openness (NEO) Five Factor Inventory (Costa & McCrae, Reference Costa and McCrae1992) (ABC and HAS), the International Personality Item Pool (IPIP) Big-Five Factor Inventory (LBC), or with the Spielberger State-Trait Anxiety Inventory (CaPS; Spielberger et al. Reference Spielberger, Gorsuch, Lushene, Vagg and Jacobs1983).
BMI
Participants had their height and weight measured when they completed the HADS. BMI was calculated as weight divided by height (kg/m2).
Medical history and current medications
When they completed the HADS, participants were asked whether they had ever been told they had diabetes or a stroke or transient ischaemic attack (TIA); participants in the ABC, CaPS, HAS and LBC were also asked about history of heart attack. Information on the number of current medications was available for the ABC, HAS, HCS and LBC.
Statistical analysis
We used logistic regression to examine the odds ratio (OR) for anxiety or depression (HADS score ⩾8) according to the risk factors described above, analysing men and women in each cohort separately. Preliminary analyses showed that among our participants increasing age was associated with higher depression scores; adjustment for age modified some associations, so we adjusted for age in our analyses. We did not adjust for age when examining risk factors for anxiety as there was no association between age and anxiety scores, and adjustment for it did not alter associations. To be able to combine effect estimates from each cohort despite differences in some of the measures used, we converted all risk factors that were continuously distributed (except number of medications) into sex-cohort specific standard deviation (s.d.) scores. To obtain an overall estimate of the effect of each risk factor and to quantify the uncertainty of that estimate, we used meta-analysis to combine the sex-specific estimates from each cohort. We calculated the pooled effect of each potential risk factor using DerSimonian and Laird random effect models, thereby incorporating an estimate of between-sample variation into the calculation (Deeks et al. Reference Deeks, Altman, Bradburn, Egger, Davey Smith and Altman2001). We examined the heterogeneity of the estimates between the samples using I 2 [with 95% confidence intervals (CIs)] and Q statistics (Higgins et al. Reference Higgins, Thompson, Deeks and Altman2003). The I 2 statistic provides the percentage of total variation across studies due to heterogeneity rather than chance. Values for I 2 of 25%, 50% or 75% suggest low, moderate or high heterogeneity, respectively (Higgins et al. Reference Higgins, Thompson, Deeks and Altman2003). We produced forest plots to describe the results of each meta-analysis. Finally, we examined how our findings changed if meta-analyses were based on effect estimates that had been adjusted for covariates. We chose as covariates variables that were correlated with both the outcomes and the characteristic of interest with a p value <0.1 in one or more cohorts. For cognition, physical function or chronic illness, each of which was assessed by more than one variable, each variable was considered separately and was not adjusted for the other related measure(s), e.g. grip strength was not adjusted for flamingo stand time, or history of diabetes for number of medications. The exception was change in fluid intelligence, which was estimated by adjusting current fluid intelligence for peak prior intelligence (see footnotes to Tables 2 and 3).
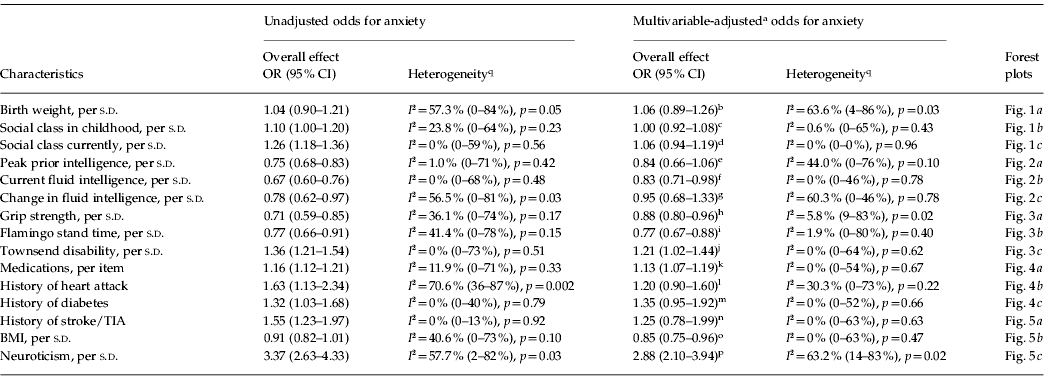
Results of meta-analyses of risk factors for anxiety

OR, Odds ratio; CI, confidence interval; s.d., standard deviation; TIA, transient ischaemic attack; BMI, body mass index.
a Details of the choice of covariates for the multivariable analyses are given in the Method section. The covariates included in the multivariable analyses of each characteristic are listed in footnotes b to p. b Childhood social class, BMI. c Current social class, fluid intelligence, neuroticism, grip strength, BMI. d Childhood social class, fluid intelligence, neuroticism, medications, flamingo stand time, grip strength, Townsend disability, diabetes. e Childhood and current social class, neuroticism, grip strength, Townsend disability. f,g Childhood and current social class, neuroticism, medications, diabetes, heart disease, BMI, grip strength, Townsend disability. h Current social class, BMI, medications, heart disease, peak prior intelligence, Townsend disability. i Childhood and current social class, BMI, fluid intelligence, heart disease, stroke, medications. j Current social class, neuroticism, fluid intelligence, BMI, grip strength, flamingo stand time, medications, stroke, heart disease. k Current social class, Townsend disability, grip strength, flamingo stand time. l Fluid intelligence, grip strength, flamingo stand time, Townsend disability. m Childhood and current social class, BMI, flamingo stand time, grip strength, Townsend disability. n Townsend disability, fluid intelligence. o Childhood and current social class, fluid intelligence, neuroticism, flamingo stand time, medications, diabetes, Townsend disability. p Childhood and current social class, fluid intelligence, BMI, heart disease, medications, Townsend disability. qI 2 statistic with 95% CIs; p values from Cochran's Q statistic.
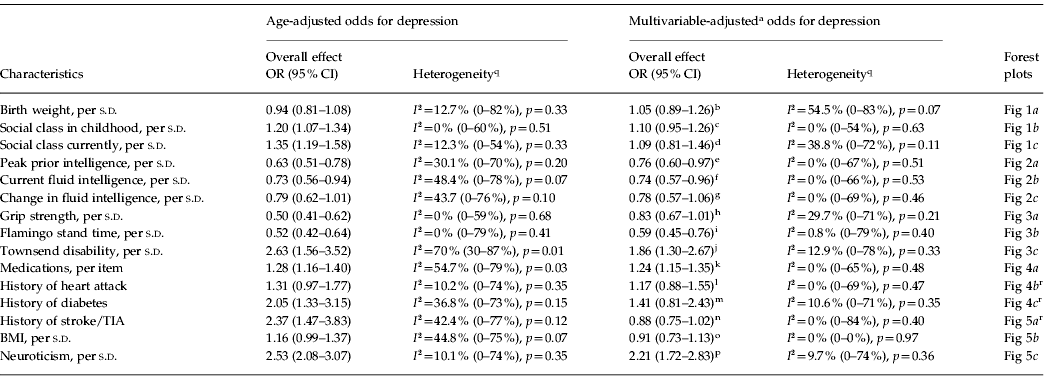
Results of meta-analyses of risk factors for depression

OR, Odds ratio; CI, confidence interval; s.d., standard deviation; TIA, transient ischaemic attack; BMI, body mass index.
a Details of the choice of covariates for the multivariable analyses are given in the Method section. The covariates included in the multivariable analyses of each characteristic as well as age are listed in footnotes b to p. b Childhood social class, BMI. c Current social class, fluid intelligence, neuroticism, grip strength, BMI. d Childhood social class, fluid intelligence, neuroticism, medications, flamingo stand time, grip strength, Townsend disability, diabetes. e Childhood and current social class, neuroticism, grip strength, Townsend disability. f,g Childhood and current social class, neuroticism, medications, diabetes, heart disease, BMI, grip strength, Townsend disability. h Current social class, BMI, medications, heart disease, peak prior intelligence, Townsend disability. i Childhood and current social class, BMI, fluid intelligence, heart disease, stroke, medications. j Current social class, neuroticism, fluid intelligence, BMI, grip strength, flamingo stand time, medications, stroke, heart disease. k Current social class, BMI, Townsend disability, grip strength, flamingo stand time. l Fluid intelligence, grip strength, flamingo stand time, Townsend disability. m Childhood and current social class, BMI, flamingo stand time, grip strength, Townsend disability. n Townsend disability, fluid intelligence. o Childhood and current social class, fluid intelligence, neuroticism, flamingo stand time, medications, diabetes, Townsend disability. p Childhood and current social class, fluid intelligence, BMI, heart disease, medications, Townsend disability. qI 2 statistic with 95% CIs; p values from Cochran's Q statistic. r In the Lothian Birth Cohort 1921, there were no cases of heart attack, stroke/TIA, or diabetes among the small number of men with depression, so only the women from this cohort are included in the meta-analyses.
Results
Table 1 describes the cohorts. The prevalence of possible or probable anxiety was higher in women than in men, though there were no differences between the sexes in the prevalence of depression. The prevalence of possible or probable depression was consistently lower than the prevalence of anxiety.
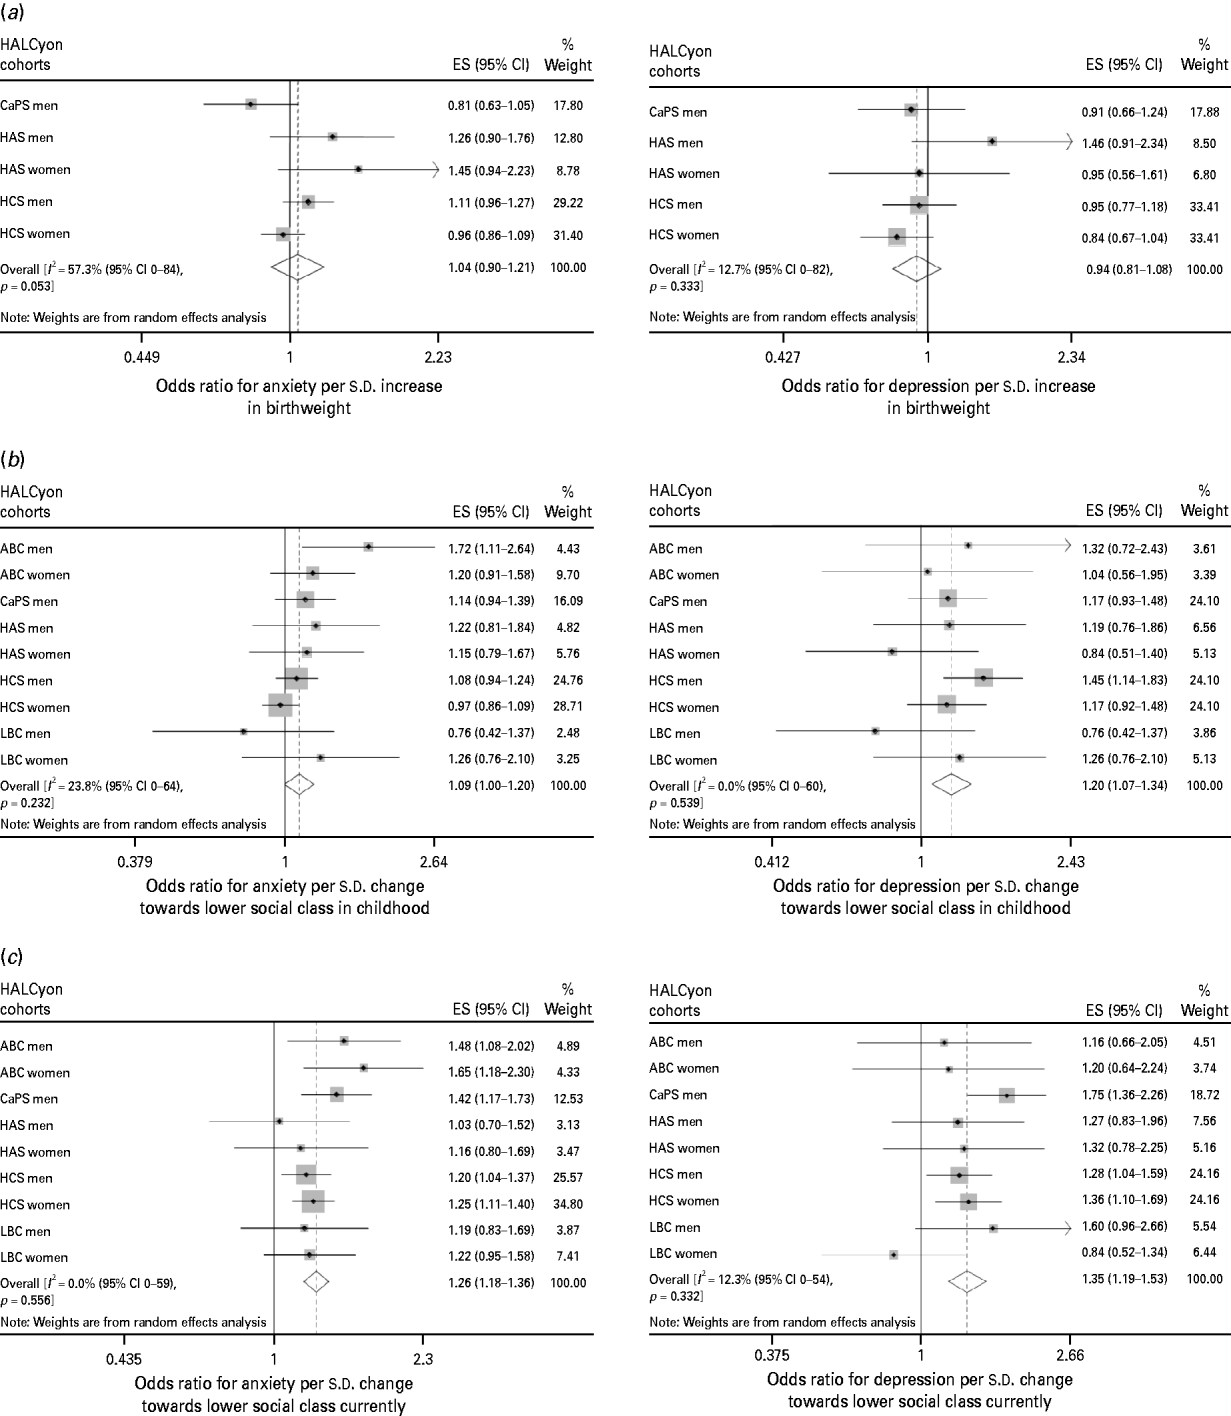
We examined the odds for anxiety or depression according to each risk factor, analysing each sample of men and women separately. Tables 2 and 3 show results of the meta-analyses of these effect estimates. Figs 1, 2, 3, 4 and 5 present forest plots of the minimally adjusted meta-analyses.
Forest plots of meta-analyses of the relationships between (a) birth weight, (b) social class in childhood and (c) social class in adulthood and odds for anxiety or depression. HALCyon, Healthy Ageing across the Life Course; ES, effect size; CI, confidence interval; CaPS, Caerphilly Prospective Study; HAS, Hertfordshire Ageing Study; HCS, Hertfordshire Cohort Study; s.d., standard deviation; ABC, Aberdeen Birth Cohort 1936; LBC, The Lothian Birth Cohort 1921.

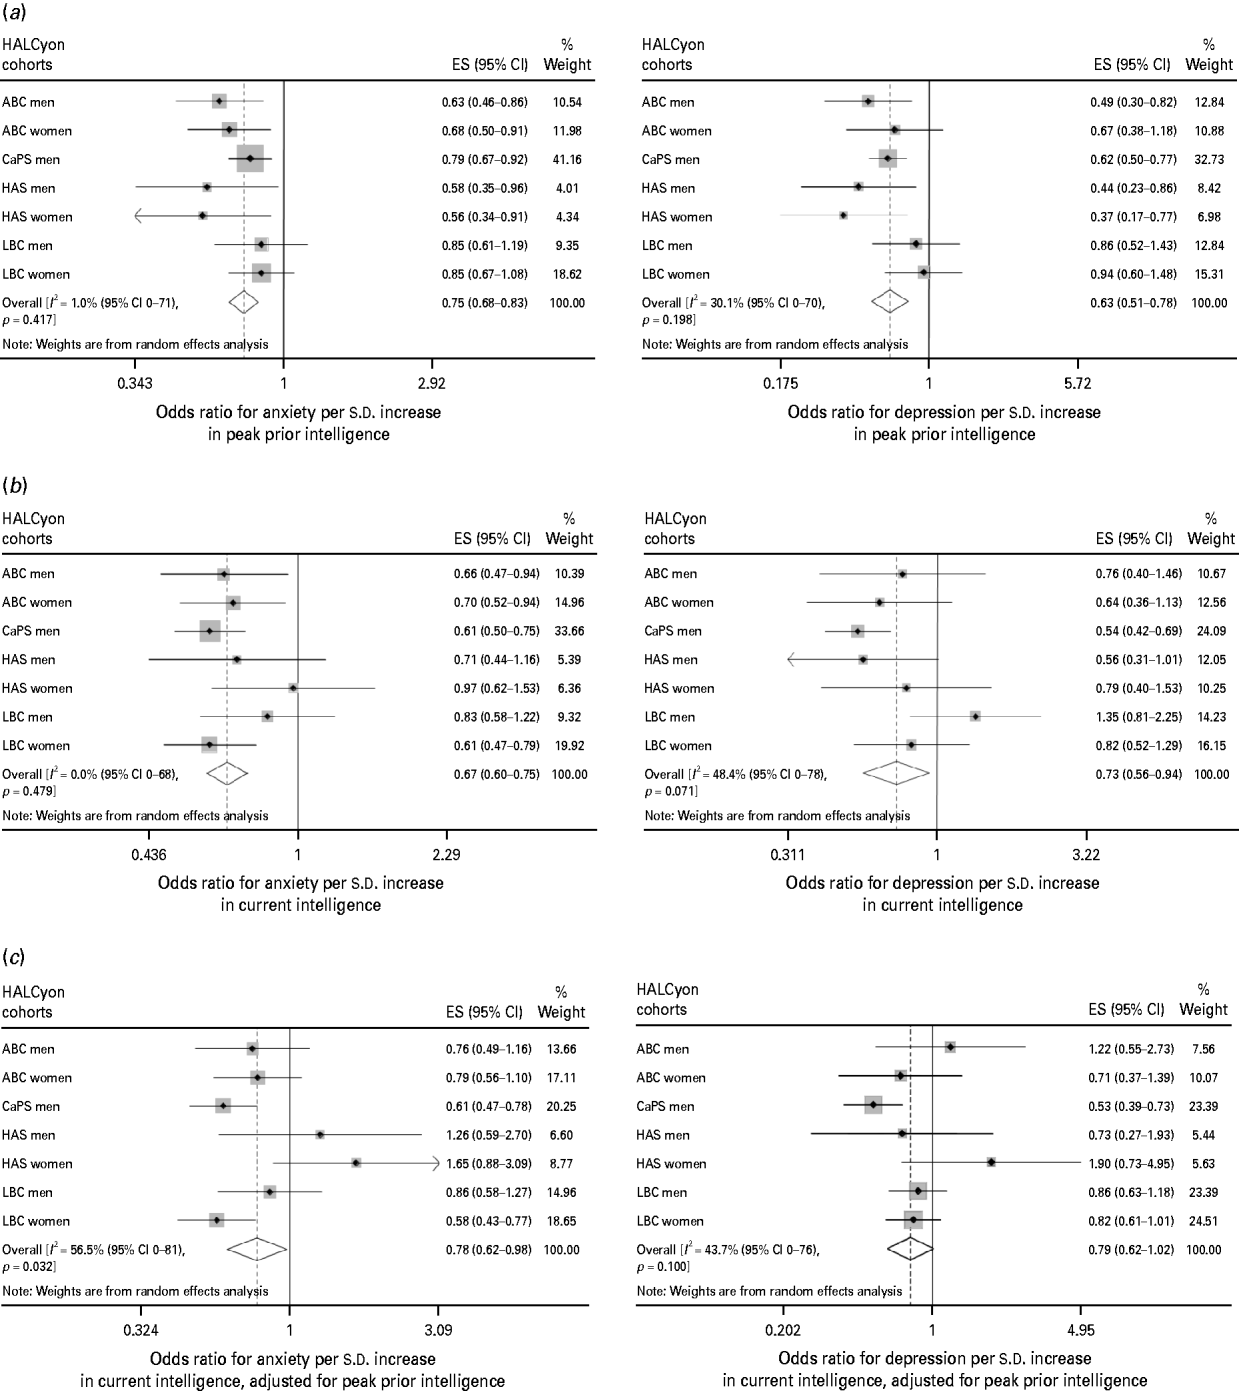
Forest plots of meta-analyses of the relationships between (a) peak prior intelligence, (b) current fluid intelligence and (c) change in fluid intelligence and odds for anxiety or depression. HALCyon, Healthy Ageing across the Life Course; ES, effect size; CI, confidence interval; ABC, Aberdeen Birth Cohort 1936; CaPS, Caerphilly Prospective Study; HAS, Hertfordshire Ageing Study; LBC, The Lothian Birth Cohort 1921; s.d., standard deviation.

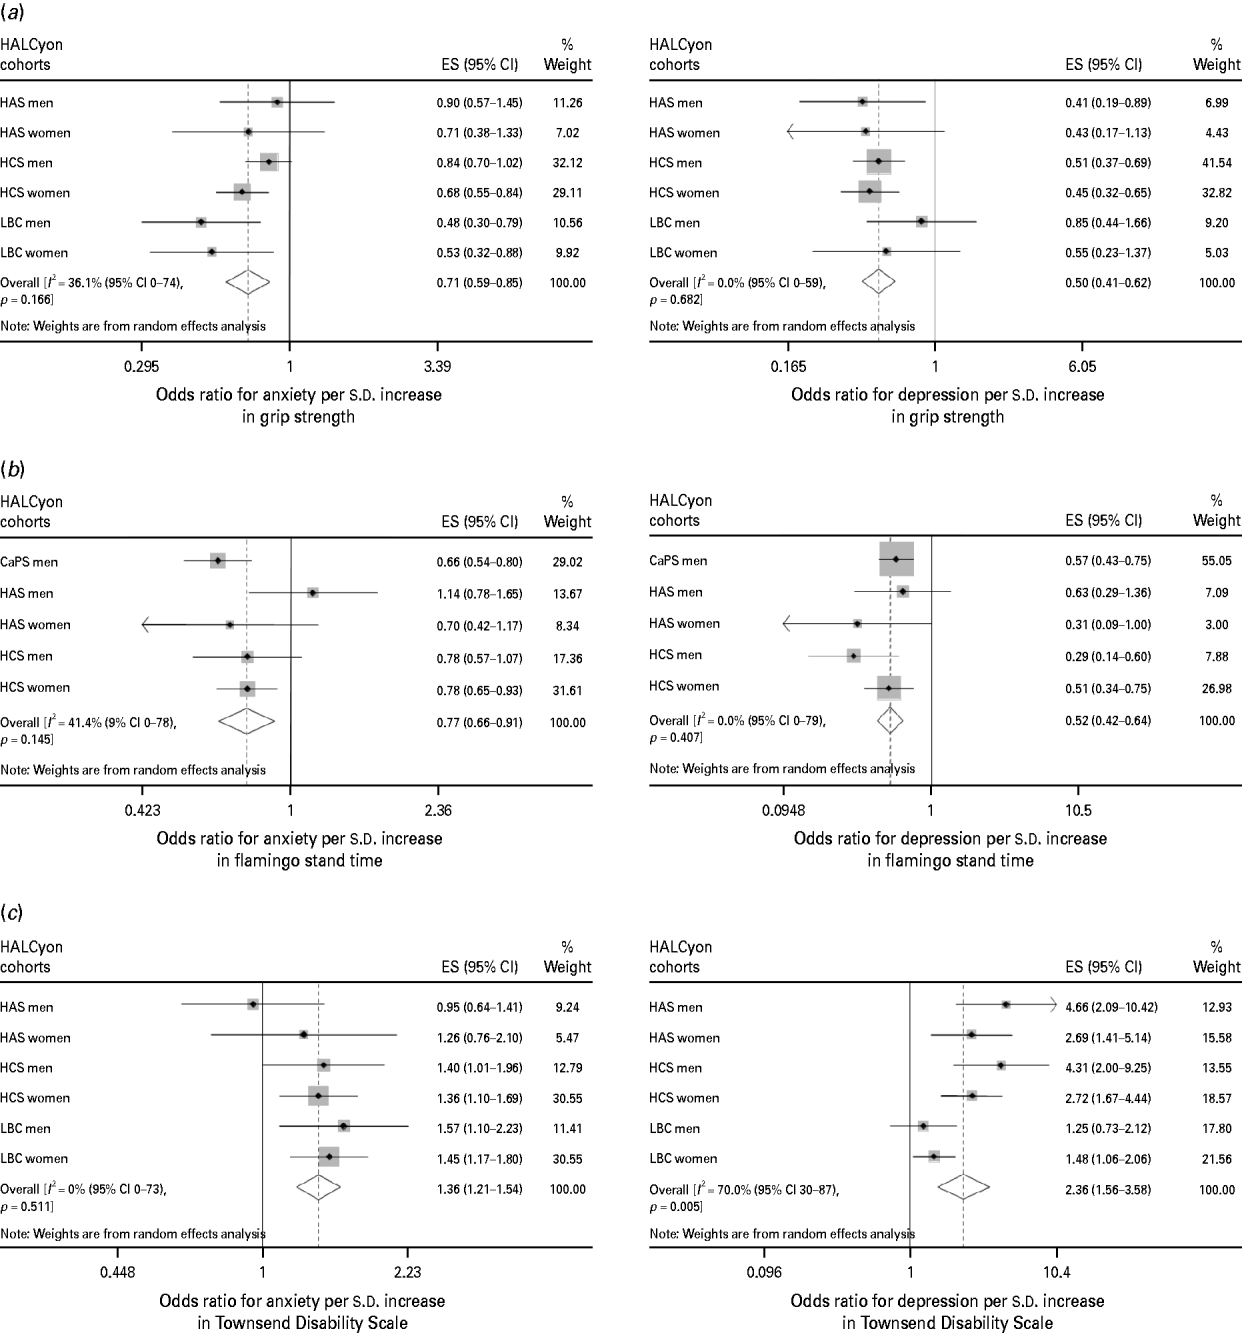
Forest plots of meta-analyses of the relationships between (a) grip strength, (b) flamingo stand time and (c) Townsend disability scale and odds for anxiety or depression. HALCyon, Healthy Ageing across the Life Course; ES, effect size; CI, confidence interval; HAS, Hertfordshire Ageing Study; HCS, Hertfordshire Cohort Study; LBC, The Lothian Birth Cohort 1921; s.d., standard deviation; CaPS, Caerphilly Prospective Study.

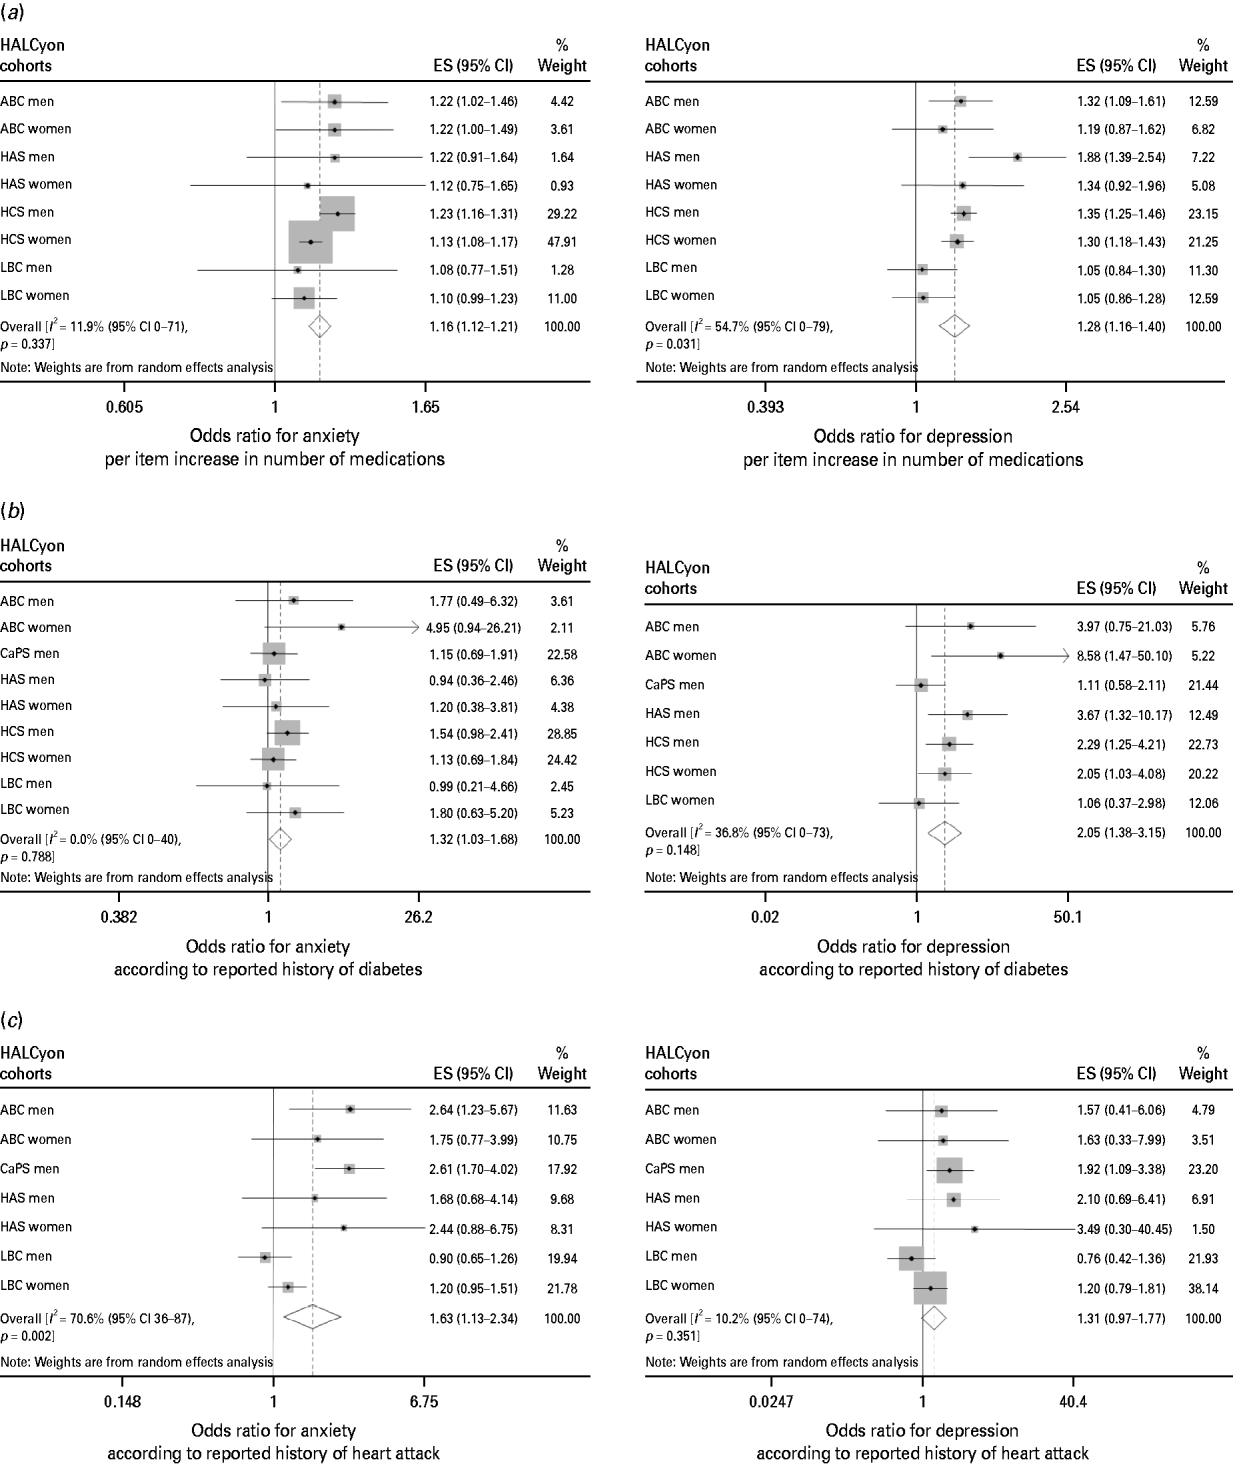
Forest plots of meta-analyses of the relationships between (a) number of medications, (b) history of heart attack and (c) history of diabetes and odds for anxiety or depression. HALCyon, Healthy Ageing across the Life Course; ES, effect size; CI, confidence interval; ABC, Aberdeen Birth Cohort 1936; HAS, Hertfordshire Ageing Study; HCS, Hertfordshire Cohort Study; LBC, The Lothian Birth Cohort 1921; s.d., standard deviation; CaPS, Caerphilly Prospective Study.

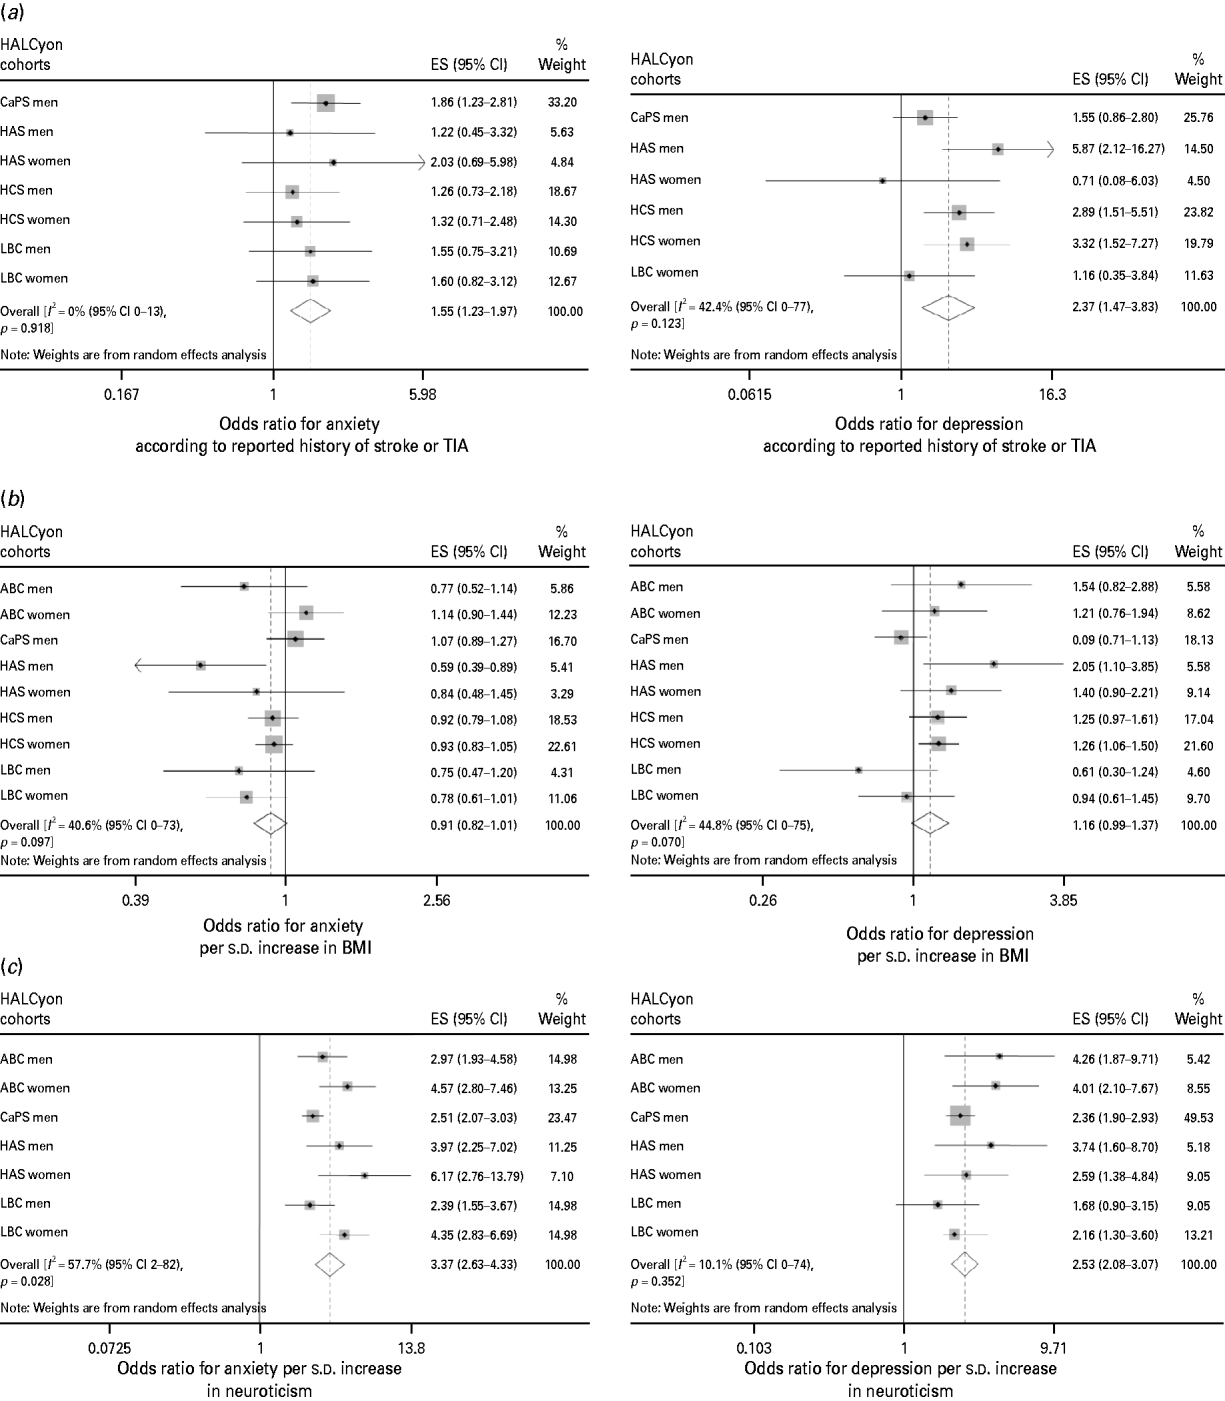
Forest plots of meta-analyses of the relationships between (a) history of stroke or transient ischaemic attack (TIA), (b) body mass index (BMI) and (c) neuroticism and odds for anxiety or depression. HALCyon, Healthy Ageing across the Life Course; ES, effect size; CI, confidence interval; CaPS, Caerphilly Prospective Study; HAS, Hertfordshire Ageing Study; HCS, Hertfordshire Cohort Study; LBC, The Lothian Birth Cohort 1921; s.d., standard deviation; ABC, Aberdeen Birth Cohort 1936.

Meta-analyses of univariate estimates showed that overall, an increased likelihood of anxiety was associated with lower social class, either in childhood or currently, poorer cognition (whether assessed as peak prior intelligence, current fluid intelligence or change in fluid intelligence), poorer physical function (measured by lower grip strength or shorter duration of a flamingo stand), greater disability, poorer health (as indicated by number of medications or history of heart attack, diabetes, or stroke/TIA), and greater neuroticism (Table 2). There was no overall association between either birth weight or current BMI and anxiety. Multivariable adjustment for potential confounding or mediating factors attenuated most of the effect estimates such that there was no significant overall association between anxiety and social class or history of chronic disease, but poorer physical function, greater disability, poorer current fluid intelligence, number of medications and greater neuroticism were significantly associated with risk of anxiety. Multivariable adjustment strengthened the weak association between BMI and anxiety, such that higher BMI was associated with a lower likelihood of anxiety.
There was virtually complete overlap between the factors associated with anxiety and those associated with depression – the direction of the association with BMI being the only difference. Meta-analyses of age-adjusted effect estimates showed that an increased likelihood of depression was associated with lower social class, both in childhood and currently, poorer cognition, poorer physical function, greater disability, poorer health, greater neuroticism and higher BMI (Table 3). There was no overall association between birth weight and risk of depression. After multivariable adjustment, the associations between social class, history of chronic disease or BMI and depression ceased to be statistically significant, but risk of depression remained significantly associated with poorer cognition, poorer physical function, greater disability, number of medications and greater neuroticism.
For most of the overall effect estimates for anxiety and depression, the I 2 statistics were less than 50%, implying low to moderate heterogeneity. However, as expected given the number of our samples, 95% CIs around the I 2 statistics tended to be wide, ranging from as low as 0% to as high as 87%, suggesting considerable uncertainty as to the true extent of heterogeneity.
In cases where inspection of the forest plots, coupled with the I 2 statistics, suggested that there might be sex differences in the strength of associations, we stratified by sex in order to examine differences in effect size. In general, effect sizes differed only slightly between the sexes. In the case of depression, the most pronounced difference was seen for disability, where a s.d. increase in Townsend score was associated with an OR of 2.81 (95% CI 1.11–7.11) in men and an OR of 2.10 (95% CI 1.34–3.30) in women. In the case of anxiety, the only marked difference was seen for neuroticism where a s.d. increase was associated with an OR of 2.64 (95% CI 2.26–3.08) in men and an OR of 4.65 (95% CI 3.45–6.28) in women.
In total, 66% of people categorized as having depression were also categorized as having anxiety; co-morbidity was less common among those with anxiety, of whom 20% had depression. To check whether the considerable overlap in risk factors for anxiety or depression was due to the presence of people with co-morbidity, we repeated all our analyses excluding these individuals. Results changed only slightly (data not shown).
Discussion
Neuroticism
Neuroticism was the one of the factors that was most strongly linked with risk of anxiety or depression. Overall, a s.d. increase in neuroticism was associated with a more than three-fold increase in the odds of anxiety and a more than two-fold increase in the odds of depression.
Although there is some overlap between items that define neuroticism and those that assess anxiety and depression that may contribute to the correlation between them, particularly in cross-sectional studies, the strength of this association is unlikely to be merely artifactual (Lahey, Reference Lahey2009). Neuroticism is strongly linked, not just with anxiety and depression, but with a wide range of mental disorders (Malouff et al. Reference Malouff, Thorsteinsson and Schutte2005). One explanation for this is shared genetic influences. There is a substantial overlap between the genetic factors that influence neuroticism and those that influence internalising disorders such as anxiety and depression (Hettema et al. Reference Hettema, Neale, Myers, Prescott and Kendler2006). While a genetic tendency towards neuroticism underlies vulnerability to both anxiety and depression, environmental factors appear to trigger the phenotypes (de Beurs et al. Reference de Beurs, Beekman, Geerlings, Deeg, van Dyck and van Tilburg2001).
Cognition
The observation that higher peak prior intelligence was associated overall with a reduced likelihood of anxiety or depression is consistent with findings in younger adults linking higher cognitive ability in childhood with lower later risk of psychological distress (Gale et al. Reference Gale, Hatch, Batty and Deary2009). Whether this is due to shared aetiology or greater ability to cope with stressors is unclear. At older ages, fluid intelligence reflects not just peak ability earlier in life but also the cumulative effects of disease processes. Higher fluid intelligence was associated overall with a lower likelihood of anxiety or depression, after adjustment for peak prior cognition, suggesting that decline in mental abilities may be accompanied by symptoms of psychological distress, though these latter relationships were weakened by adjustment for other potentially confounding or mediating factors, including measures of chronic illness, physical function and disability. The cross-sectional design of our study does not allow us to establish whether the experience of cognitive decline leads to depression or anxiety. In a Dutch study of community-dwelling older people, no association was found between low Mini-Mental State scores (<24) and incident depression as measured by the Center for Epidemiologic Studies Depression Scale (de Beurs et al. Reference de Beurs, Beekman, Geerlings, Deeg, van Dyck and van Tilburg2001). Also, a decline of >3 points in Mini-Mental State scores did not predict change in HADS anxiety scores. However, their analysis may have lacked statistical power because of low numbers with this degree of cognitive decline (de Beurs et al. Reference de Beurs, Beekman, Deeg, van Dyck and van Tilburg2000).
Physical function
Only a few studies have examined the relationship between poorer performance on physical function tests and anxiety or depression in older people. In cross-sectional analyses in two US cohorts, no association was found between the presence of anxiety symptoms and physical performance (Mehta et al. Reference Mehta, Yaffe, Brenes, Newman, Shorr, Simonsick, Ayonayon, Rubin and Covinsky2007), but depressive symptoms were more common in people with poorer performance (Penninx et al. Reference Penninx, Guralnik, Ferrucci, Simonsick, Deeg and Wallace1998). In our meta-analyses, we found that the overall odds of anxiety or depression were markedly lower in people with better physical performance, as assessed by grip strength or standing balance. These associations changed little after adjustment for potential confounding or mediating variables. However, the direction of effect is uncertain. Longitudinal studies suggest that higher levels of depression (Penninx et al. Reference Penninx, Guralnik, Ferrucci, Simonsick, Deeg and Wallace1998) – though not of anxiety (Mehta et al. Reference Mehta, Yaffe, Brenes, Newman, Shorr, Simonsick, Ayonayon, Rubin and Covinsky2007) – are predictive of decline in physical function. Whether this association is bi-directional is unclear.
Disability
Our finding of an overall association between greater disability, as measured by the Townsend Index, and likelihood of depression or anxiety is consistent with observations in the EURODEP study (Braam et al. Reference Braam, Prince, Beekman, Delespaul, Dewey, Geerlings, Kivela, Lawlor, Magnusson, Meller, Peres, Reischies, Roelands, Schoevers, Saz, Skoog, Turrina, Versporten and Copeland2005) and the Longitudinal Ageing Study Amsterdam (Beekman et al. Reference Beekman, de Beurs, van Balkom, Deeg, van Dyck and van Tilburg2000). Here too, there is evidence, particularly for depression, that the association may be bi-directional. Onset or increments in disability are predictive of increases in depressive symptoms (Yang & George, Reference Yang and George2005) and depression and anxiety are risk factors for disability (Lenze et al. Reference Lenze, Rogers, Martire, Mulsant, Rollman, Dew, Schulz and Reynolds2001).
Physical illness
Our findings that older people with a history of heart attack, stroke or TIA, or diabetes, or those who are taking more medications, are more likely to have high scores for anxiety or depression are in keeping with previous observations linking vascular disease with higher rates of depression in later life (Baldwin & O'Brien, Reference Baldwin and O'Brien2002) and with results of the National Institutes of Health Cognitive and Emotional Health Project (Hendrie et al. Reference Hendrie, Albert, Butters, Gao, Knopman, Launer, Yaffe, Cuthbert, Edwards and Wagster2006). This review identified that multiple chronic illnesses and some specific illnesses were linked with poor emotional outcomes in older people (Hendrie et al. Reference Hendrie, Albert, Butters, Gao, Knopman, Launer, Yaffe, Cuthbert, Edwards and Wagster2006), though the number of publications on which some of these associations were based was small, and nearly all the studies included related solely to depression. Our meta-analyses suggest that some specific illnesses, and being on more medications, may be linked with anxiety as well as depression. Multivariable adjustment for other factors, particularly physical function and Townsend Disability Index, severely attenuated the associations between specific illnesses and risk of anxiety and depression, but as these latter factors might well mediate the associations, and numbers of cases with these illnesses were often small, this is perhaps unsurprising. Here too, though, the direction of causality is not clear. The implications and effects on capability of having a heart attack, stroke, diabetes or multiple chronic illnesses may lead to anxiety or depression, but findings in one of these cohorts that depression is associated with diabetes even in those who are unaware that they have the condition (Holt et al. Reference Holt, Phillips, Jameson, Cooper, Dennison and Peveler2009) add to the evidence that depression or anxiety may be risk factors for subsequent disease (Wulsin et al. Reference Wulsin, Vaillant and Wells1999; Brenes et al. Reference Brenes, Kritchevsky, Mehta, Yaffe, Simonsick, Ayonayon, Rosano, Rubin, Satterfield and Penninx2007).
BMI
Some previous studies have suggested that the link between being obese and symptoms of depression may be stronger in women than in men (Mather et al. Reference Mather, Cox, Enns and Sareen2009). Here we found a borderline significant association between increasing BMI and greater likelihood of depression that was present in both men and women in age-adjusted analyses, though this was attenuated after multivariable adjustment, particularly for physical function and indicators of poor health. Again, the direction of the relationship between higher BMI and depression is uncertain. Recent evidence using repeated measures suggests that depression increases the risk of future obesity, rather than vice versa (Kivimäki et al. Reference Kivimäki, Lawlor, Singh-Manoux, Batty, Ferrie, Shipley, Nabi, Sabia, Marmot and Jokela2009), though this association may vary by sex and age at onset of symptoms (Gaysina et al. Reference Gaysina, Hotopf, Richards, Colman, Kuh and Hardy2011). We found some indication that higher BMI was associated with lower likelihood of anxiety, an association that was strengthened by multivariable adjustment. A similar association has been reported in an earlier study using the HADS, though other evidence suggests that the nature of the relationship between BMI and anxiety may vary with different types of anxiety disorder (Rivenes et al. Reference Rivenes, Harvey and Mykletun2009).
Socio-economic status
Many studies have found associations between higher socio-economic status and lower risk of anxiety and depression. Here we found that the risk of anxiety and depression was lower in people who had a lower social class background either in childhood or currently, but these associations were severely attenuated by adjustment for other factors, such as cognitive and physical function, neuroticism, level of disability and chronic illness. Lower social class in childhood has been previously linked with greater neuroticism in adult life (Bosma et al. Reference Bosma, van de Mheen and Mackenbach1999).
Birth weight
Several studies have shown associations between lower birth weight and increased susceptibility to symptoms of depression or anxiety (Gale & Martyn, Reference Gale and Martyn2004; Alati et al. Reference Alati, Lawlor, Mamun, Williams, Najman, O'Callaghan and Bor2007; Colman et al. Reference Colman, Ploubidis, Wadsworth, Jones and Croudace2007; Bohnert & Breslau, Reference Bohnert and Breslau2008), but only one of these studies was in older people (Thompson et al. Reference Thompson, Syddall, Rodin, Osmond and Barker2001). Here we found no overall association between lower birth weight and either anxiety or depression in later life. Other studies too have found no association (Osler et al. Reference Osler, Nordentoft and Andersen2005; Inskip et al. Reference Inskip, Dunn, Godfrey, Cooper and Kendrick2008), possibly because birth weight is a crude marker of fetal neurodevelopment.
Strengths and weaknesses
The main strength of our study is the availability of data from five cohorts, allowing us to explore the effect of a range of potential risk factors from both early and later life on risk of symptoms of depression or anxiety in older people. It also has some weaknesses. First, the majority of our analyses were based on cross-sectional data, making it hard to establish the direction of effect for some associations. Second, the prevalence of ‘probable’ depression – HADS depression subscale (HADS-D) scores ⩾11 – in these cohorts was low. Comparing prevalence between studies is complicated by methodological differences in assessment (Beekman et al. Reference Beekman, Copeland and Prince1999). Whether other studies that used the HADS in community-based older people had a similarly low prevalence of HADS-D scores ⩾11 is unclear, but mean HADS-D scores among our cohorts were very similar to those found in one such study of people aged 70–74 years (Jacka et al. Reference Jacka, Overland, Stewart, Tell, Bjelland and Mykletun2009). The presence of responder and survivor biases is unsurprising in longitudinal studies. However, if there is a bias towards less depression among our respondents, this would only be a matter of concern – and have implications for generalizability – if the relationships between risk factors and depression differed systematically between those who took part and those who did not; this seems unlikely. Third, our analyses were constrained by the availability of comparable data in the cohorts. We were unable to examine some potentially important factors, such as physical activity. Fourth, the multivariable-adjusted estimates need to be interpreted with caution. Although we identified potential confounding or mediating factors for each risk factor from among the variables included here, lack of data on some factors in some cohorts – such as cognition and neuroticism in the HCS – means that estimates from each cohort could not always be adjusted for the same variables. Finally, we were not able in these meta-analyses to explore whether the simultaneous presence of different risk factors has an additive or interactive effect on risk of anxiety or depression.
Interpretation
While declining function and poorer health might increase the risk of anxiety or depression in vulnerable individuals, another, and not incompatible, explanation might be that dysregulation of the hypothalamic–pituitary–adrenal axis and the accompanying physiological and behavioural responses to stress can have an adverse effect on many body systems including the brain, and may contribute to biological ageing (McEwen, Reference McEwen2006). Another explanation linked to biological ageing could be oxidative stress (Bokov et al. Reference Bokov, Chaudhuri and Richardson2004; Ng et al. Reference Ng, Berk, Dean and Bush2008). These explanations could help to account not just for the associations found here between symptoms of anxiety or depression and cardiovascular disease and diabetes, but also those with declining physical or cognitive function.
In summary, we used data from several cohorts of older men and women to examine the relative importance of factors from early and later life for risk of anxiety and depression. We found no indication in these data that impaired fetal growth had a long-term effect on susceptibility to psychological distress. Being brought up in socio-economic disadvantage did appear to increase risk, particularly of depression, but this relationship was attenuated after adjustment for possible confounding or mediating factors. By contrast, levels of anxiety and depression in older people were closely connected to personality, physical function, level of disability, prior and current cognitive capability, and state of health.
Acknowledgements
The HALCyon collaborative research programme is funded by the New Dynamics of Ageing (NDA) programme, a joint 7-year initiative of five UK research councils. Follow-up of the ABC was supported by L.J.W. receiving a Wellcome Trust career development award. The CaPS was conducted by the former Medical Research Council (MRC) Epidemiology Unit (South Wales), and was funded by the MRC and the Alzheimer's Society; the Department of Social Medicine, University of Bristol now maintains the data archive. The HCS was funded by the MRC, the British Heart Foundation, Arthritis Research Campaign, the National Osteoporosis Society, Wellcome Trust and the University of Southampton. The HAS was funded by the MRC and the University of Southampton. The LBC was funded by the Biotechnology and Biological Sciences Research Council and the Chief Scientist Office of the Scottish Executive Health Department. The Centre for Cognitive Ageing and Cognitive Epidemiology is funded by the Biotechnology Sciences Research Council, the Engineering and Physical Sciences Research Council, the Economic and Social Research Council, the MRC and the University of Edinburgh as part of the cross-council Lifelong Health and Wellbeing initiative.
Declaration of Interest
None.