1. Introduction
Renewal–reward or cumulative processes are processes which accumulate rewards based upon an underlying renewal process. At the renewal epochs, random rewards are realised and the process which accumulates these rewards as they occur in time is a renewal–reward process. Most often in applications, these rewards depend on the duration of the interarrival time leading up to the renewal epoch and we refer to such processes as dependent renewal–reward processes. This paper develops the distribution theory for such processes in discrete time using double transform theory, i.e. the generating function (GF) in time
 $n\in\mathbb{N}=\{0,1,\ldots\}$
of the time-indexed probability-generating function (PGF) or moment-generating function (MGF) for the cumulative reward at time n. A rich theory for such dependent reward processes results. The current literature, e.g. [Reference Zhao and Nakagawa20], [Reference Kulkarni12, Section 8.10], [Reference Nakagawa16, Chapter 6], [Reference Tijms19], and [Reference Kao10, Section 3.4], assumes the reward R during an interarrival is independent of the interarrival duration F, which may be far from realistic. For example, if the renewal process epochs refer to the service times for a system, typically the cost of such service will depend on the duration of time since the last service and will not be independent of this duration as assumed in the literature. A second limitation of the existing literature is the lack of focus on higher-order distribution theory which can be derived from using such double transforms. We provide such higher-order theory using saddlepoint and residue approximations which lead to distributional results that are very accurate and which cannot be matched by using lower-order central limit theorems.
The distributions for two important aspects of these processes are considered in detail. First, we consider the cumulative reward R(n) up to time n and develop its double PGF-GF when rewards are discrete, and double MGF-GF when rewards are continuous. Based on recent advances in the approximate inversion of such double transforms in [Reference Butler6], we develop double-saddlepoint approximations and residue-saddlepoint approximations which provide highly accurate approximation of the survival function of R(n).
The second aspect of such processes is in determining the distribution of the first-passage time
 $P_{x}$
to cumulative reward x. We develop the double transform theory for the distribution of
 $P_{x}$
for both discrete and continuous rewards. Discrete rewards entail determining the GF in
 $x\in\mathbb{N}$
of the PGF of
 $P_{x}$
, which we call a PGF-GF double transform. Continuous rewards entail determining the Laplace transform (LT) in
 $x>0$
of the PGF of
 $P_{x}$
, which we call an LT-GF double transform. In both instances, the double transform inversion methods in [Reference Butler6] provide the means for accurately determining the survival function for
 $P_{x}$
.
Such first-passage time distributions are especially important in the field of reliability where shock model processes are renewal–reward processes. Shocks occur at the renewal epochs and the reward for each shock is additional damage to the system or operating unit. If x is the failure threshold for the safe use of a mechanical system, then
 $P_{x}$
represents the useful lifetime of the system. See [Reference Zhao and Nakagawa20] for a detailed account of such processes that only considers settings in which the reward R and shock interarrival time F are independent variables.
As an example, consider the lifetime of an airplane which is retired once a measure of the cumulative stress to the wing structure exceeds amount x. The lifetime of the plane is
 $P_{x}$
for a renewal–reward process in which renewals occur at the end of flights, R is the incremental stress of a flight, and F is the duration of that flight. The correlation between R and F is certainly natural as, apart from other factors such as turbulence, longer flights tend to contribute greater incremental stress. The assumption of independence for R and F as used in the shock model literature seems questionable in this and many other contexts.
Other important aspects of the distribution theory are derived from these double transforms. Moment expansions follow for R(n) as
 $n\rightarrow\infty$
and
 $P_{x}$
as
 $x\rightarrow\infty$
. When such moments are used to standardise R(n) and
 $P_{x}$
, then central limit theorems (CLTs) are proved as a result. These derivations first use the double transforms to determine residue approximations for the cumulative generating functions of R(n) and
 $P_{x}$
. For the purpose of rigorous proof, these approximations suffice in representing the true cumulative generating functionss, and their limits as
 $n,x\rightarrow\infty$
provide the means for deriving the CLTs. Multivariate rewards can be dealt with in the same manner to determine multivariate CLTs. Throughout, we provide numerical examples which demonstrate the remarkable accuracy which results from using residue and saddlepoint approximations to invert double transforms.
In previous work when R and F are independent, [Reference Butler4] applied saddlepoint approximations to determine expansions for the first-passage distribution of
 $P_{x}$
. This approach considered the renewal–reward passage time as a boundary-crossing time in a two-dimensional random walk. Further work applying saddlepoint expansions to approximate boundary-crossing distributions has been given in [Reference Butler3, Reference Lotov13, Reference Lotov14, Reference Presman17].
2. Renewal rewards
Suppose a discrete-time renewal process has independent and identically distributed (i.i.d.) interarrival times
 $F_{1},F_{2},\ldots$
with the common mass function
 $\{0=f_{0},f_{1},f_{2},\ldots\}$
and PGF
 $\mathcal{F}(\mathrm{z})=\sum_{n=1}^{\infty}f_{n}\mathrm{z}^{n}$
with convergence radius
 $\mathfrak{r}>1$
. The distribution may be defective, in which case
 $\mathcal{F}(1)<1$
. Let F denote an arbitrary interarrival time with GF
 $\mathcal{F}$
. Assuming a renewal at time
 $n=0$
, the cumulative number of renewals N(n) occurring during
 $\{1,\ldots,n)$
is a renewal process.
Suppose at the end of the ith renewal period of duration
 $F_{i}$
, reward
 $R_{i}$
is realised and
 $R_{i}$
is allowed to depend on
 $F_{i}$
so that
 $(R_{1},F_{1}),(R_{2},F_{2}),\ldots$
form an i.i.d. sequence whose joint PGF is
 \begin{align*}\mathcal{H}(\mathrm{y},\mathrm{z})=\sum_{m=0}^{\infty}\sum_{n=1}^{\infty}\mathbb{P}\{R=m,F=n\}\mathrm{y}^{m}\mathrm{z}^{n},\qquad(\mathrm{y},\mathrm{z})\in\mathcal{N}.\end{align*}
Assume
 $\mathcal{N}$
is the maximal convergence region and includes (1, 1) in its interior. We use the notation
 $\mathrm{y}\leftrightsquigarrow m$
and
 $\mathrm{z}\leftrightsquigarrow n$
to show the association that roman variables in the transform domain have with their original function arguments. It is also standard notation to write
 $f_{n}=[\mathrm{z}^{n}]\mathcal{F}(\mathrm{z})$
and
 $\mathbb{P}\{R=m,F=n\}=[\mathrm{y}^{m}\mathrm{z}^{n}]\mathcal{H}(\mathrm{y},\mathrm{z})$
to indicate the operation of specifying the
 $\mathrm{z}^{n}$
-coefficient and
 $\mathrm{y}^{m}\mathrm{z}^{n}$
-coefficient for the respective GFs. Define
 \begin{align*}\mathcal{F}_{S}(\mathrm{z})=\frac{1-\mathcal{F}(\mathrm{z})}{1-\mathrm{z}}=\sum_{n=0}^{\infty}\mathbb{P}\{F>n\}\mathrm{z}^{n},\end{align*}
so that
 $\mathbb{P}\{F>n\}=[\mathrm{z}^{n}]\mathcal{F}_{S}(\mathrm{z})$
.
The renewal–reward process is
 $R(n)=\mathbf{1}_{\{F_{1}\leq n\}}\sum_{i=1}^{N(n)}R_{i}$
, and R(n) is the cumulative reward after time n. Denote the marginal PGF of R(n) as
 $\mathcal{R}_{n}(\mathrm{y})=\mathbb{E}\{\mathrm{y}^{R(n)}\}$
and define
 \begin{equation}\mathcal{R}(\mathrm{y},\mathrm{z})=\sum_{n=0}^{\infty}\mathcal{R}_{n}(\mathrm{y})\mathrm{z}^{n} \end{equation}
as the double GF, or equivalently the GF of the bivariate measure
 $\mu(m,n)=\mathbb{P}\{R(n)=m\}$
,
 $(m,n)\in\mathbb{N}^{2}=\{0,1,\ldots\}^{2}$
. In this bivariate measure, variable n has counting measure on
 $\mathbb{N}$
as its marginal measure.
Theorem 1. (PGF for
 $R(n)$
and GF for
 $\mathbb{E}\{R(n)\}$
.) Assume the conditions above, and that
 $\mathcal{H}(\mathrm{y},\mathrm{z})$
is convergent in a neighbourhood of (1, 1). Then
 \begin{align} \mathcal{R}(\mathrm{y},\mathrm{z}) & = \sum_{n=0}^{\infty}\mathcal{R}_{n}(\mathrm{y})\mathrm{z}^{n}=\frac{\mathcal{F}_{S}(\mathrm{z})}{1-\mathcal{H}(\mathrm{y},\mathrm{z})}, \end{align}
 \begin{align} \mathcal{R}_{n}(\mathrm{y}) & = [\mathrm{z}^{n}]\mathcal{R}(\mathrm{y},\mathrm{z}), \nonumber \\ \mathbb{P}\{R(n)=m\} & = [\mathrm{y}^{m}\mathrm{z}^{n}]\mathcal{R}(\mathrm{y},\mathrm{z}), \nonumber \\ \mathbb{E}\{R(n)\} & = [\mathrm{z}^{n}]\frac{\mathcal{H}^{\prime}_{\mathrm{y}}(1,\mathrm{z})}{\mathcal{F}_{S}(\mathrm{z})(1-\mathrm{z})^{2}}=[\mathrm{z}^{n}]\frac{\mathcal{H}^{\prime}_{\mathrm{y}}(1,\mathrm{z})}{\{1-\mathcal{F}(\mathrm{z})\}(1-\mathrm{z})}, \end{align}
where
 $\mathcal{H}^{\prime}_{\mathrm{y}}=\partial\mathcal{H}/\partial\mathrm{y}$
.
In the special case in which
 $\mathcal{H}(\mathrm{y},\mathrm{z})=$
y
 $\mathcal{F}(\mathrm{z})$
, then
 $R(n)=N(n)$
with probability 1 and the reward process is the renewal counting process. In this case, expression (2) agrees with the double GF for N(n) given in [Reference Butler6, Section 2.1] and previously derived in [Reference Howard8, Section 7.2].
Proof. We first prove (2). If
 $N(n)=0$
, then
 $\mathbb{P}\{N(n)=0\}=\mathbb{P}\{F_{1}>n\}=[\mathrm{z}^{n}]\mathcal{F}_{S}({\mathrm{z}})$
. Denote the conditional PGF of
 $F_{1}$
as
 $\mathbb{E}\{\mathrm{z}^{F_{1}} \mid R_{1}=r_{1}\} = \mathcal{F}(\mathrm{z} \mid r_{1})$
. Working conditionally on
 $R_{1}=r_{1}$
with
 $n\leftrightsquigarrow\mathrm{z}$
, then the conditional GF in
 $n\leftrightsquigarrow\mathrm{z}$
with one reward is
 \begin{align*} \sum_{n=0}^{\infty}\mathbb{P}\{N(n)=1\mid R_{1}=r_{1}\}\mathrm{z}^{n} & = \sum_{n=0}^{\infty}\sum_{m=0}^{n}\mathbb{P}\{F_{1}=m,F_{2}>n-m\mid R_{1}=r_{1}\}\mathrm{z}^{n} \\ & = \sum_{n=0}^{\infty}\sum_{m=0}^{n}\mathbb{P}\{F_{2}>n-m\}\mathrm{z}^{n-m} \mathbb{P}\{F_{1}=m\mid R_{1}=r_{1}\}\mathrm{z}^{m} \\ & = \mathcal{F}_{S}({\mathrm{z}})\mathcal{F}(\mathrm{z}\mid r_{1}). \end{align*}
In the more general argument for the conditional GF given k rewards, we condition on
 $\{R_{i}=r_{i}\,:\, i=1,\ldots,k\}$
. By induction, we are led to the general result
 \begin{equation*} \sum_{n=0}^{\infty}\mathbb{P}\{N(n)=k\mid R_{i}=r_{i}\,:\, i=1,\ldots,k\}\mathrm{z}^{n} = \mathcal{F}_{S}(\mathrm{z})\prod_{i=1}^{k}\mathcal{F}(\mathrm{z}\mid r_{i}), \quad k\geq1. \end{equation*}
For fixed k, we take the expectation over
 $R_{1},\ldots,R_{k}$
to get
 \begin{align*} \sum_{n=0}^{\infty}\mathbb{E}\big\{\mathrm{y}^{R(n)}1_{\{N(n)=k\}}\big\}\mathrm{z}^{n} & = \mathbb{E}^{R_{1},\ldots,R_{k}}\Bigg[\mathrm{y}^{R_{1}+\cdots+R_{k}} \sum_{n=0}^{\infty}\mathbb{P}\{N(n)=k\mid R_{1},\ldots,R_{k}\}\mathrm{z}^{n}\Bigg] \\ & = \mathbb{E}^{R_{1},\ldots,R_{k}}\Bigg[\mathrm{y}^{R_{1}+\cdots+R_{k}}\mathcal{F}_{S}(\mathrm{z}) \prod_{i=1}^{k}\mathcal{F}(\mathrm{z}\mid R_{i})\Bigg] \\ & = \mathcal{F}_{S}(\mathrm{z}) \prod_{i=1}^{k}\mathbb{E}\big\{\mathcal{F}(\mathrm{z}\mid R_{i})\mathrm{y}^{R_{i}}\big\} = \mathcal{F}_{S}(\mathrm{z})\mathcal{H}(\mathrm{y},\mathrm{z})^{k}. \end{align*}
Thus,
 \begin{align*} \sum_{n=0}^{\infty}\mathrm{z}^{n}\mathbb{E}\{\mathrm{y}^{R(n)}\} = \sum_{k=0}^{\infty}\mathcal{F}_{S}(\mathrm{z})\mathcal{H}(\mathrm{y},\mathrm{z})^{k} = \frac{\mathcal{F}_{S}({\mathrm{z}})}{1-\mathcal{H}(\mathrm{y},\mathrm{z})}. \end{align*}
Also,
 \begin{align*} \mathbb{E}\{R(n)\} & = [\mathrm{z}^{n}]\frac{\partial}{\partial\mathrm{y}}\mathcal{R}_{n}(\mathrm{y})\bigg|_{\mathrm{y}=1} \\ & = [\mathrm{z}^{n}]\frac{\partial}{\partial\mathrm{y}} \frac{\mathcal{F}_{S}({\mathrm{z}})}{1-\mathcal{H}(\mathrm{y},\mathrm{z})}\bigg|_{\mathrm{y}=1} = [\mathrm{z}^{n}]\frac{\mathcal{F}_{S}({\mathrm{z}})\mathcal{H}^{\prime}_{\mathrm{y}}(1,\mathrm{z})} {\{1-\mathcal{F}(\mathrm{z})\}^{2}} = [\mathrm{z}^{n}]\frac{\mathcal{H}^{\prime}_{\mathrm{y}}(1,\mathrm{z})} {\mathcal{F}_{S}({\mathrm{z}})(1-\mathrm{z})^{2}}. \end{align*}
Example 1. (Bernoulli(r) process.) Suppose the interarrival time is deterministic and has value 1 with probability 1 so that
 $\mathcal{F}(\mathrm{z})=\mathrm{z}$
. Let the rewards form a Bernoulli(p) process with
 $q=1-p$
. For this setting, we know that
 $R(n)\sim \mathrm{Binomial}(n,p)$
, which is a result confirmed from Theorem 1. Here,
 $\mathcal{F}_{S}(\mathrm{z})=1$
and
 $\mathcal{H}_{n}(\mathrm{y})=\mathrm{z}(p\mathrm{y}+q)$
, so that
 \begin{align*} \mathcal{R}_{n}(\mathrm{y})=[\mathrm{z}^{n}]\frac{1}{1-\mathrm{z}(p\mathrm{y}+q)}=(p\mathrm{y}+q)^{n}. \end{align*}
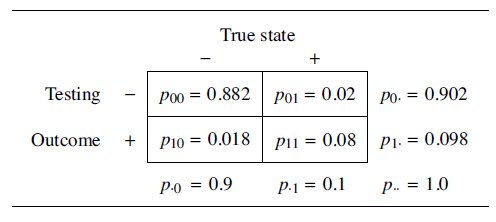
Example 2. (Viral RNA tests.) Assume laboratory RNA tests for a virus have a false negative rate of 20% and a false positive rate of 2%. Independent swab samples are drawn from a population with a 10% infection rate. The four possible outcomes for the classification of each swab sample are displayed in Table 1 along with the classification probabilities.
Suppose that lab results are reported in batches following the occurrence of a positive test result. The number of tests before such a positive test is the interarrival time for a positive test and has distribution
 $F\sim\mathrm{Geometric}(p_{1\cdot})$
with
 $\mathbb{P}\{F=n\}=p_{1\cdot}p_{0\cdot}^{n-1}$
for
 $n\geq1$
. Let the ‘reward’ R from an interarrival be the count for the number of true positive cases that can be found within the interarriving F tests. The joint PGF of (R, F) may be computed by noting that
 $R\mid F=n\sim\mathrm{Binomial}(n-1,p_{01}/p_{0\cdot})+\mathrm{Bernoulli}(p_{11}/p_{1\cdot})$
, where these two quantities are independent. The binomial count is for the first
 $n-1$
negative tests and the Bernoulli count is for the last positive test. This gives
 \begin{align*} \mathcal{H}(\mathrm{y,z}) = \mathbb{E}^{F}\{\mathbb{E(}\mathrm{y}^{R}\mid F)\mathrm{z}^{F}\} = \mathbb{E}^{F}\bigg[\bigg\{\frac{B_{0}(\mathrm{y})}{p_{0\cdot}}\bigg\}^{F-1} \bigg\{\frac{B_{1}(\mathrm{y})}{p_{1\cdot}}\bigg\}\mathrm{z}^{F}\bigg], \end{align*}
with
 $B_{0}(\mathrm{y})=p_{01}\mathrm{y}+p_{00}$
and
 $B_{1}(\mathrm{y})=p_{11}\mathrm{y}+p_{10}$
, so that
 \begin{equation} \mathcal{H}(\mathrm{y,z}) = \frac{\mathrm{z}B_{1}(\mathrm{y})}{1-\mathrm{z}B_{0}(\mathrm{y})}. \end{equation}
Quite a few other bivariate mass functions for (R, F) have tractable joint PGFs which would serve in renewal–reward modelling. These include the bivariate Bernoulli, the bivariate Poisson, and the various sorts of bivariate geometric models arising from shock models; see [Reference Johnson, Kotz and Balakrishnan9, Reference Kocherlakota and Kocherlakota11]. The next example is a variation on a bivariate geometric model.
Cross-classification probabilities of test results (rows) with true states (columns) for an RNA test of a swab sample.

Example 3. (Bivariate geometric rewards.) Consider the failure time of a parallel connection of two identical electrical components. At all times there is a single backup component available to protect against a single component failure but not against a double failure. At each tick of the clock the status of the circuit follows a multivariate Bernoulli distribution: both components fail simultaneously with probability
 $p_{2}$
, one of the two components fails with probability
 $p_{1}$
, and neither fails with probability
 $p_{0}=1-p_{1}-p_{2}$
. The time to failure F of the circuit is the interarrival time of a renewal event. Let the reward R be the count of the number of components which fail during time F. The marginal distribution of F is Geometric
 $(p_{2})$
and the joint mass function of (R, F) is the bivariate geometric mass function
 \begin{align*} \mathbb{P}\{R=m,F=n\} = \dbinom{n-1}{m-2}p_{1}^{m-2}p_{0}^{n-m+1}p_{2}, \quad 2\leq m\leq n+1,\ n\geq1. \end{align*}
For this probability, two simultaneous failures must occur at time n and the remaining
 $m-2$
single failures are spread over time points
 $\{1,\ldots,n-1\}$
. The joint PGF is
 $\mathcal{H}(\mathrm{y},\mathrm{z})=\mathbb{E}\{\mathrm{y}^{R}\mathrm{z}^{F}\}$
, where
 \begin{align*} \mathcal{H}(\mathrm{y},\mathrm{z}) & = \sum_{n=1}^{\infty}\sum_{m=2}^{n+1}\mathrm{y}^{m}\mathrm{z}^{n}\dbinom{n-1}{m-2}p_{1}^{m-2}p_{0}^{n-m+1}p_{2} \\ & = p_{2}\mathrm{y}^{2}\sum_{n=1}^{\infty}\mathrm{z}^{n}p_{0}^{n-1}\sum_{k=0}^{n-1}\dbinom{n-1}{k} \bigg(\frac{p_{1}\mathrm{y}}{p_{0}}\bigg)^{k} \\ & = p_{2}\mathrm{y}^{2}\sum_{n=1}^{\infty}\mathrm{z}^{n}(p_{0}+p_{1}\mathrm{y})^{n-1} = \frac{p_{2}\mathrm{y}^{2}\mathrm{z}}{1-(p_{0}+p_{1}\mathrm{y})\mathrm{z}}. \end{align*}
Example 4. (Reward as an interarrival random walk.) Suppose that during an interarrival a reward with PGF
 $\mathcal{G}_{0}(\mathrm{y})$
is accumulated with each tick of the clock. Then R given
 $F=n$
has PGF
 $\mathcal{G}_{0}(\mathrm{y})^{n}$
so the bivariate PGF for reward and interarrival time is
 $\mathcal{H}(\mathrm{y},\mathrm{z})=\mathcal{F}\{\mathrm{z}\mathcal{G}_{0}(\mathrm{y})\}$
. This is defined over
 $\{(\mathrm{y},\mathrm{z})\in[0,\infty)^{2}\,:\,\mathrm{z}\mathcal{G}_{0}(\mathrm{y})<\mathfrak{r},\ \mathrm{y}<\mathfrak{r}_{0}\}$
, where
 $\mathfrak{r}_{0}$
is the convergence radius of
 $\mathcal{G}_{0}$
.
Of the previous three examples, only Example 1 falls within this general class. For that example,
 $\mathcal{F}(\mathrm{z})=\mathrm{z}$
and
 $\mathcal{G}_{0}(\mathrm{y})=p\mathrm{y}+q$
so that
 $\mathcal{H}(\mathrm{y},\mathrm{z})=\mathrm{z}(p\mathrm{y}+q)$
.
3. Double GF inversion
The expression for the double GF in (2) of Theorem 1 takes on added importance once there are methods for inverting it to determine the survival function for R(n). Two methods specific to this task which use saddlepoint and residue expansions have recently been developed in [Reference Butler6]. We summarise their usage below. A sufficient condition for using both methods is that the convergence region for
 $\mathcal{H}(\mathrm{y},\mathrm{z})$
is an open neighbourhood of (0, 0) that includes (1, 1).
3.1. Skovgaard double-saddlepoint approximations
The first method is simple and easy to describe as it uses the Skovgaard double-saddlepoint approximation [Reference Skovgaard18]. This method amounts to taking the double GF
 $\mathcal{R}(\mathrm{y},\mathrm{z})$
and treating it as a bivariate PGF in variables R(T) and T, where R(T) given
 $T=n$
has the distribution of R(n), and T has an improper uniform distribution over
 $\mathbb{N}$
specified by counting measure. This is exactly how
 $\mathcal{R}(\mathrm{y},\mathrm{z})$
is computed in (1) as the GF of
 $\{\mathcal{R}_{n}(\mathrm{y})\}$
in
 $n\leftrightsquigarrow\mathrm{z}$
, with variable n associated with counting measure. This is not a proper mass function since
 $\mathcal{R}(1, 1)=\infty$
, but the point made in [Reference Butler6, Section 2] is that this doesn’t matter: the Skovgaard approximation remains valid despite this. Thus we proceed by treating
 $\mathcal{M}(\mathrm{r},\mathrm{s})=\mathcal{R}({\mathrm{e}}^{\mathrm{r}},{\mathrm{e}}^{\mathrm{s}})$
as the joint MGF of the random pair
 $\{R(T),T\}$
, and approximate the survival function of R(n) as the Skovgaard double-saddlepoint approximation for the conditional survival function
 $\mathbb{P}\{R(T)\geq m\mid T=n\}$
. We treat
 $\mathcal{K}(\mathrm{r},\mathrm{s})=\ln\mathcal{R}({\mathrm{e}}^{\mathrm{r}},{\mathrm{e}}^{\mathrm{s}})$
as the joint cumulant-generating function (CGF) and from it determine two continuity-corrected double-saddlepoint approximations
 $\mathbb{P}_{D1}$
or
 $\mathbb{P}_{D2}$
as described in the Supplementary Material and further discussed in [Reference Borovkov1, Section 4.2]. Approximation
 $\mathbb{P}_{D1}$
uses the solution
 $(\hat{r},\hat{s})$
to the saddlepoint equations
 \begin{equation} m = \mathcal{K}^{\prime}_{\mathrm{r}}(\hat{r},\hat{s}), \qquad n=\mathcal{K}^{\prime}_{\mathrm{s}}(\hat{r},\hat{s}), \end{equation}
where
 $\mathcal{K}^{\prime}_{\mathrm{r}}=\partial\mathcal{K}(\mathrm{r},\mathrm{s})/\partial\mathrm{r}$
. Approximation
 $\mathbb{P}_{D2}$
uses the saddlepoint solution
 $(\tilde{r},\tilde{s})$
to
 $m-\frac12 = \mathcal{K}^{\prime}_{\mathrm{r}}(\tilde{r},\tilde{s})$
and
 $n=\mathcal{K}^{\prime}_{\mathrm{s}}(\tilde{r},\tilde{s})$
, with m offset to the value
 $m-\frac12$
.
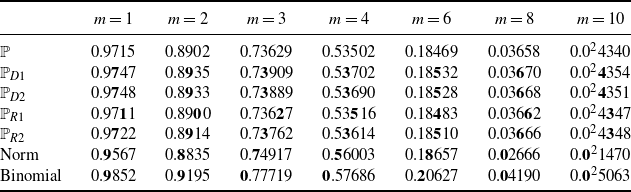
Exact values
 $(\mathbb{P})$
for
 $\mathbb{P}\{\mathcal{R}(40)\geq m\}$
are compared with two double-saddlepoint approximations (
 $\mathbb{P}_{D1}$
and
 $\mathbb{P}_{D2}$
), two residue-saddlepoint approximations (
 $\mathbb{P}_{R1}$
and
 $\mathbb{P}_{R2})$
from Section 3.2, and a continuity-corrected Normal
 $(3.79,3.69)$
approximation (Norm) from Section 4. The bold digit indicates the last ‘accurate’ digit or the last digit in agreement with the exact result when both are rounded to the same number of digits. In the notation used here,
 $0.0^{2}43=0.0043$
, etc. A Binomial
 $(40,0.1)$
upper bound (Binomial) is shown.

Example 5. (Viral RNA tests.) This example provides the means for judging the accuracy of the double-saddlepoint approximations since it is possible to compute the exact survival function of R(40) up to
 $m=10$
. The exact value of
 $\mathcal{R}_{n}(\mathrm{y})$
is
 \begin{align} \mathcal{R}_{n}(\mathrm{y}) & = [\mathrm{z}^{n}]\frac{\mathcal{F}_{S}(\mathrm{z})}{1-\mathcal{H}(\mathrm{y,z})} \nonumber \\ & =v[\mathrm{z}^{n}]\frac{(1-p_{0\cdot}\mathrm{z})^{-1}} {1-\mathrm{z}B_{1}(\mathrm{y})/\{1-\mathrm{z}B_{0}(\mathrm{y})\}} = \frac{B_{1}(\mathrm{y})}{B(\mathrm{y})-p_{0\cdot}}B(\mathrm{y})^{n} + \frac{B_{0}(\mathrm{y})-p_{0\cdot}}{B(\mathrm{y})-p_{0\cdot}}p_{0\cdot}^{n}, \end{align}
where
 $B(\mathrm{y})=B_{0}(\mathrm{y})+B_{1}(\mathrm{y})=p_{\cdot1}\mathrm{y}+p_{\cdot0}$
. Expression (6) follows from a partial fraction expansion with exact inversion in z
 $\leftrightsquigarrow n$
. The true survival function can now be computed by expanding
 $\{1-\mathrm{y}\mathcal{R}_{40}(\mathrm{y})\}/(1-\mathrm{y})$
in a power series in y using Maple, since
 \begin{align*} \mathbb{P}\{\mathcal{R}(40)\geq m\} = [\mathrm{y}^{m}]\frac{1-\mathrm{y}\mathcal{R}_{40}(\mathrm{y})}{1-\mathrm{y}}. \end{align*}
Such expansions in Maple failed for
 $n>40$
and this motivates our choice of
 $n=40$
. The exact values are shown in Table 2 as
 $\mathbb{P}$
, where they are compared with the two double-saddlepoint approximations
 $\mathbb{P}_{D1}$
and
 $\mathbb{P}_{D2}$
.
For this example, we might have mistakenly thought that R(n) has a Binomial
 $(n,p_{\cdot1})$
distribution so that
 $\mathcal{R}_{n}(\mathrm{y})$
should be
 $B(\mathrm{y})^{n}$
rather than the more complicated expression
 $\mathcal{R}_{n}(\mathrm{y})$
in (6). As such, then at time (test) n we should expect a Binomial
 $(n,p_{\cdot1})$
count of true positives. This reasoning is incorrect, and this is related to how R(n) packages the true positives. After n tests, there are N(n) packages each with a Geometric
 $(p_{1\cdot})$
number of tests so we are not counting rewards for exactly n tests. The counts from an unfulfilled renewal span at time n do not get counted so that if
 $C\sim\mathrm{Binomial}(n,p_{\cdot1})$
, then
 $R(n)\leq C$
with probability 1. Thus, the last table entry in Table 1 provides an upper bound to the true probabilities which becomes a sharper bound as n increases.
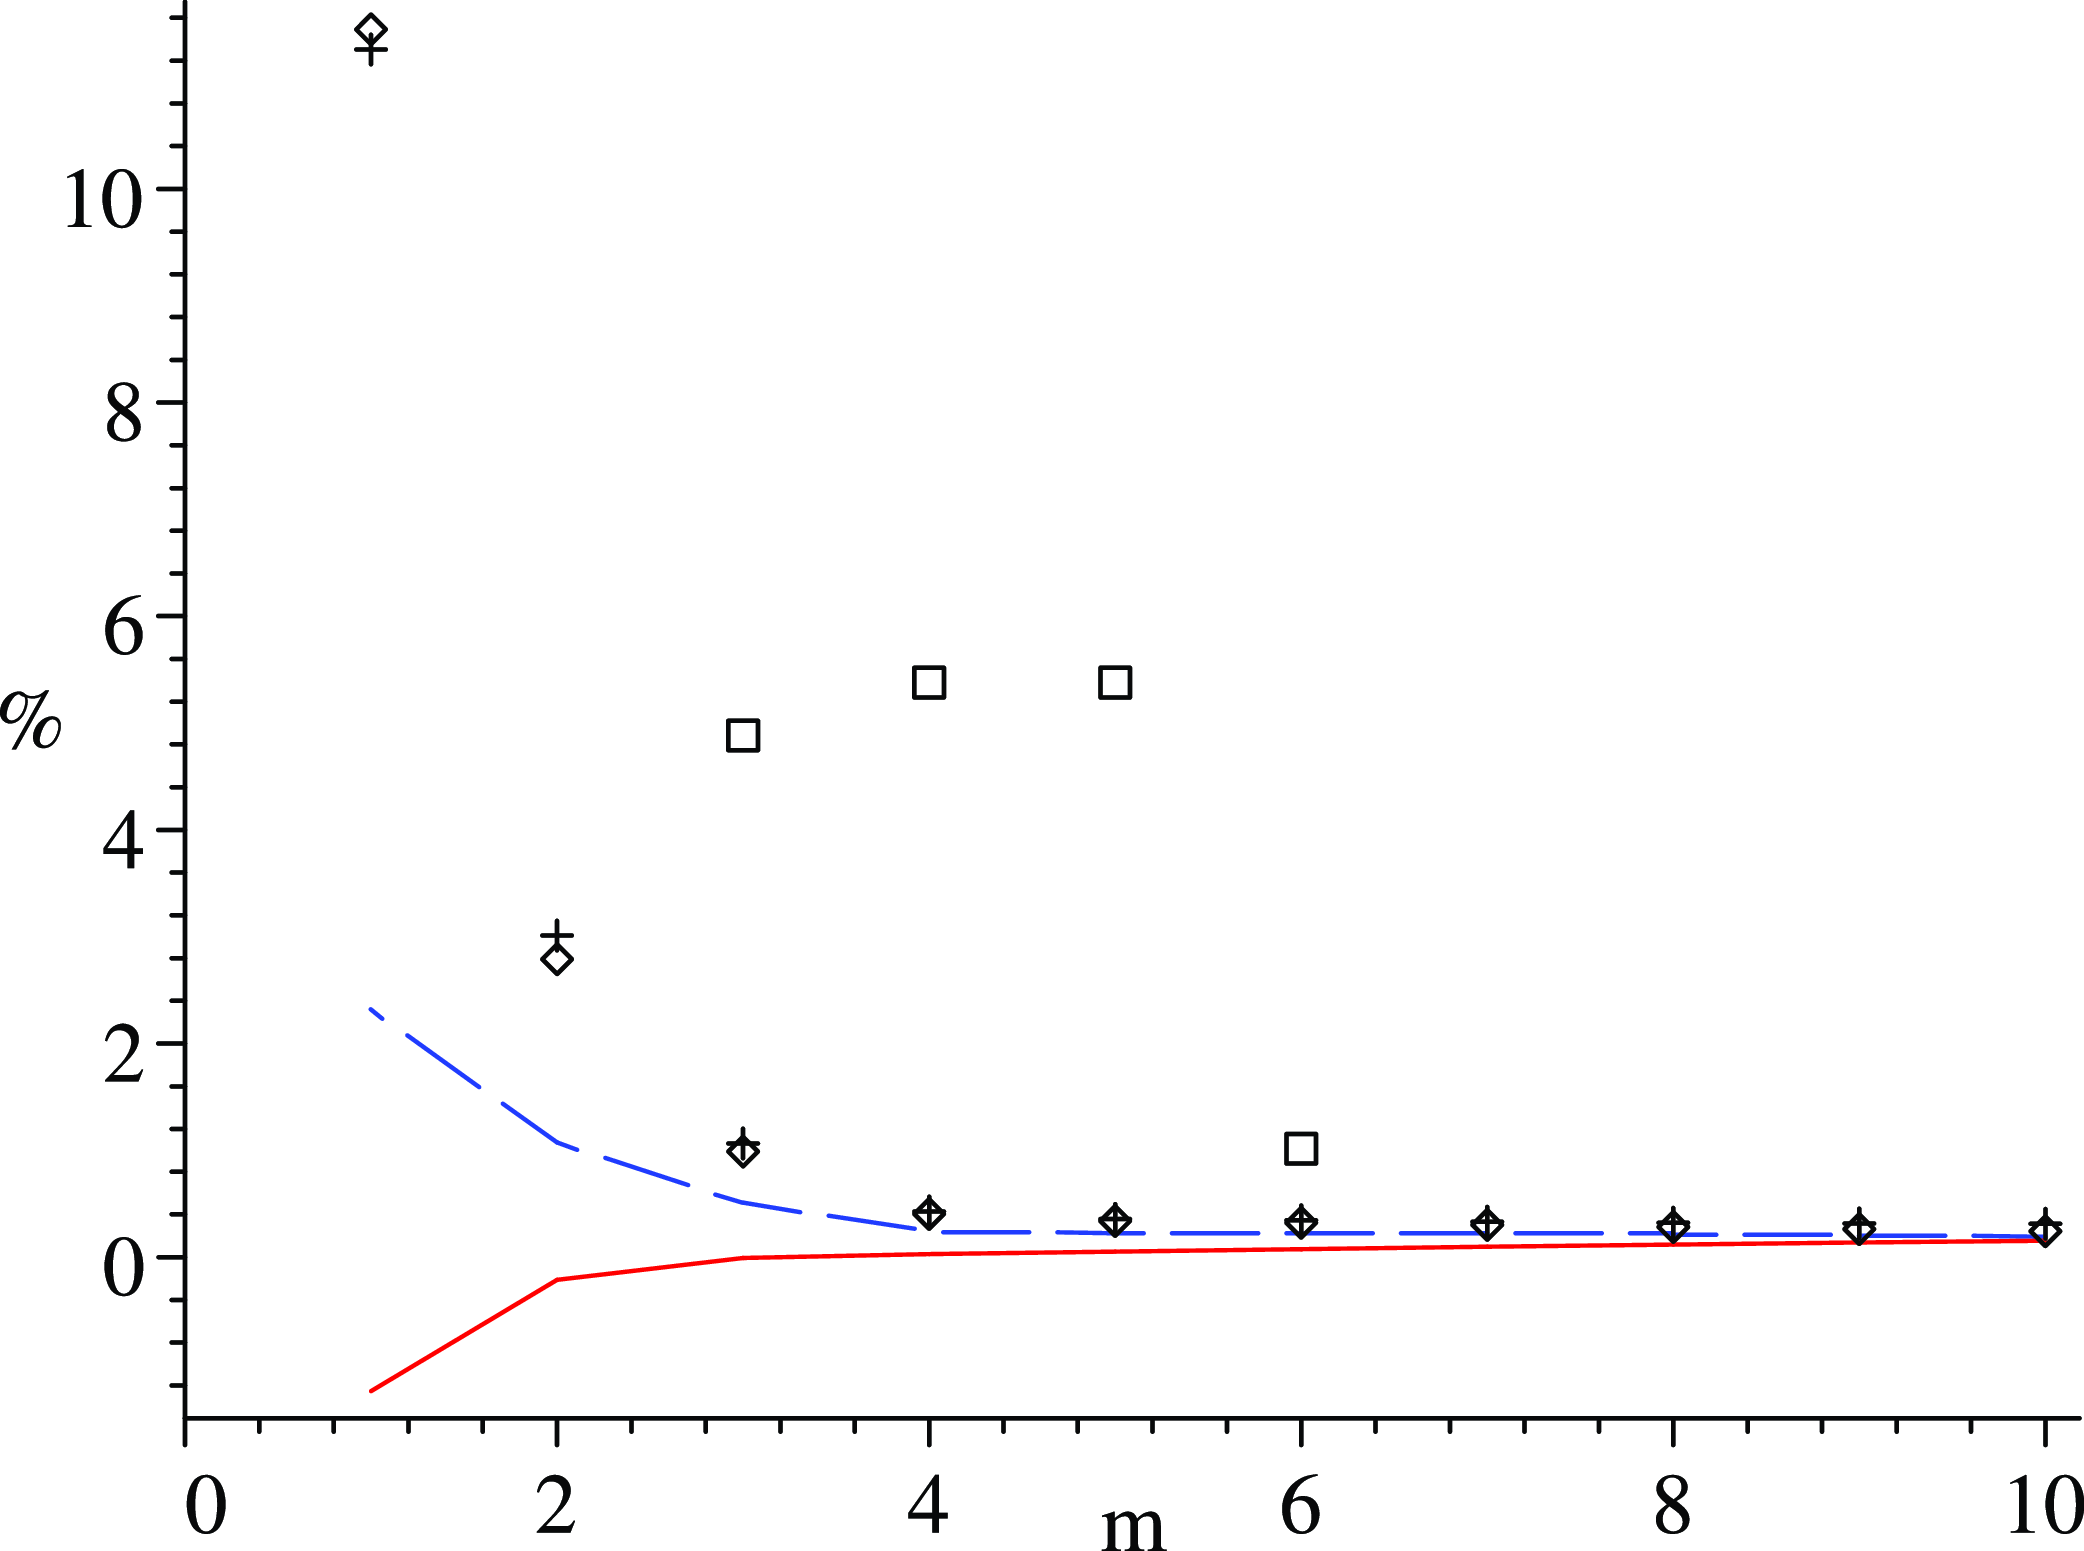
Figure 1 plots the percentage relative error for the approximations, given as
 \begin{align*} \%\text{ rel. err } = 100\frac{\mathbb{P}_{D1}\mathcal{\{}R(40)\geq m\}-\mathbb{P}(m)} {\min\{\mathbb{P}(m),1-\mathbb{P}(m)\}}, \end{align*}
where
 $\mathbb{P}(m)=\mathbb{P}\{\mathcal{R}(40)\geq m\}$
. This percentage respects both the sign of the difference as well as the tails by dividing by the smaller value of
 $\mathbb{P}(m)$
and
 $1-\mathbb{P}(m)$
. Approximations
 $\mathbb{P}_{D1}$
(crosses) and
 $\mathbb{P}_{D2}$
(diamonds) are shown along with the residue-saddlepoint approximations
 $\mathbb{P}_{R1}$
(solid red line) and
 $\mathbb{P}_{R2}$
(dashed blue line) discussed in Section 3.2 and a continuity-corrected normal approximation (boxes) developed in Section 4.
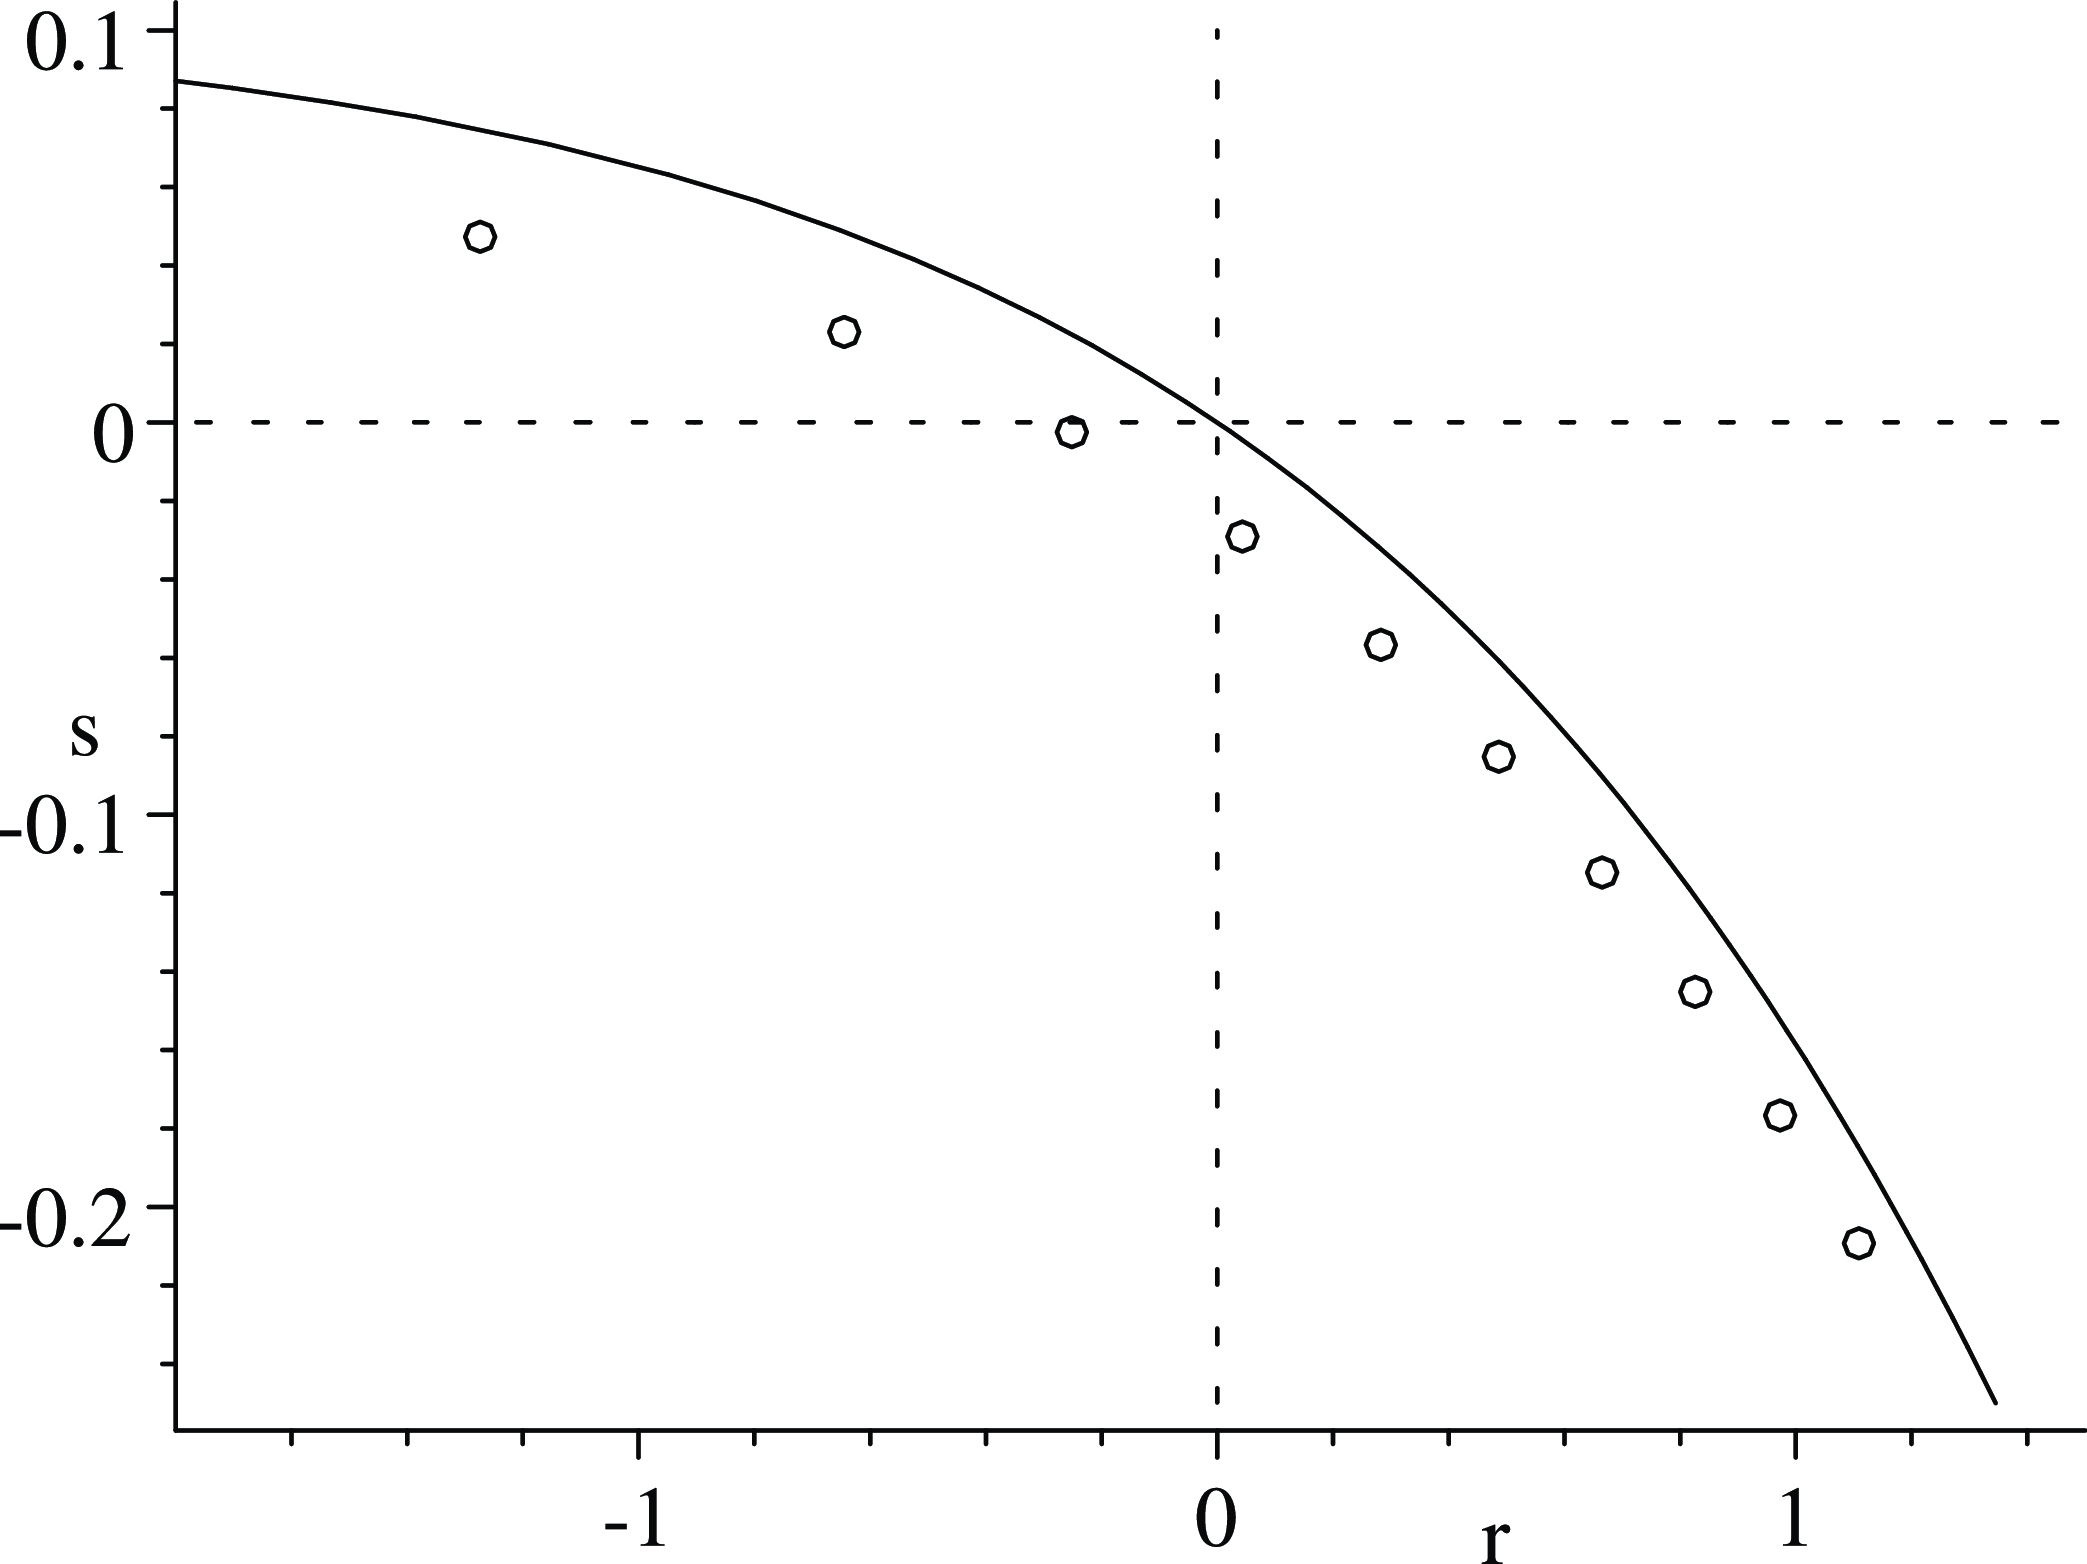
Figure 2 shows the boundary for the convergence domain of the double MGF
 $\mathcal{R}({\mathrm{e}}^{\mathrm{r}},{\mathrm{e}}^{\mathrm{s}})$
as a solid line. Plotted within its convergence domain below as circles are the saddlepoints
 $(\hat{r},\hat{s})$
solving (5) for the
 $\mathbb{P}_{D1}$
approximation.
Percentage relative errors respecting the tails for
 $\mathbb{P}_{D1}$
(crosses),
 $\mathbb{P}_{D2}$
(diamonds),
 $\mathbb{P}_{R1}$
(solid red line),
 $\mathbb{P}_{R2}$
(dashed blue line), and a continuity-corrected Normal
 $(3.79,3.69)$
approximation (boxes). Missing boxes for the normal approximation are out of the range
 $-1\%$
–11%.

Plot of the convergence boundary (solid line) for the double MGF
 $\mathcal{F}_{S}({\mathrm{e}}^{\mathrm{s}})/\{1-\mathcal{H}({\mathrm{e}}^{\mathrm{r}},{\mathrm{e}}^{\mathrm{s}})\}$
in the viral RNA example. Circles within the convergence domain show saddlepoints for the
 $\mathbb{P}_{D1}$
approximation for
 $m=1$
(upper left) up to
 $m=10$
(lower right).

In general, the convergence domain of the double MGF
 $\mathcal{R}({\mathrm{e}}^{\mathrm{r}},{\mathrm{e}}^{\mathrm{s}})$
is
 $\mathcal{B}\cap\mathcal{C}$
where
 $\mathcal{B}=\{(\mathrm{r},\mathrm{s})\in\mathbb{R}^{2}\,:\,\mathcal{H}({\mathrm{e}}^{\mathrm{r}},{\mathrm{e}}^{\mathrm{s}})<1\}$
and
 $\mathcal{C}=\{(\mathrm{r},\mathrm{s})\in\mathbb{R}^{2}\,:\,\mathrm{s}<\ln\mathfrak{r}\}$
. This leads to a piecewise convergence boundary which combines the boundaries of the two regions
 $\mathcal{B}$
and
 $\mathcal{C}$
. Only the boundary
 $\partial\mathcal{B}$
is shown in Figure 2 since
 $\partial\mathcal{C}=\{\mathrm{s}=\ln\mathfrak{r}\}$
is a horizontal line which is out of the range of the graph. The two boundaries meet at
 $(r_{0},s_{0})=({-}3.91,0.103)=\partial\mathcal{B}\cap\partial\mathcal{C}$
, so the boundary is flat for
 $\mathrm{r}<-3.91$
, and for
 $\mathrm{r}\geq-3.91$
it is concave and determined by
 $\partial\mathcal{B}$
. The proof of the next result is given in the Supplementary Material.
Corollary 1. (Convergence domain for MGF
 $\mathcal{R}({\mathrm{e}}^{\mathrm{r}},{\mathrm{e}}^{\mathrm{s}})$
.) Subject to the conditions of Theorem 1, the convergence boundary for
 $\mathcal{R}({\mathrm{e}}^{\mathrm{r}},{\mathrm{e}}^{\mathrm{s}})$
is flat for
 $\mathrm{r} \leq r_{0}$
. For
 $\mathrm{r}>r_{0}$
, the boundary is decreasing, concave, and passes through the origin as shown in Figure 2. The value
 $r_{0}$
is the coordinate of the junction point
 $(r_{0},s_{0})\in\partial\mathcal{B}\cap\partial\mathcal{C}$
.
3.2. Residue-saddlepoint approximations
The second approach to the inversion of
 $\mathcal{R}(\mathrm{y},\mathrm{z})$
is to perform the inversion in two steps. First, we approximately invert
 $\mathcal{R}(\mathrm{y},\mathrm{z})$
in
 $\mathrm{z} \leftrightsquigarrow n$
using a residue expansion as in Lemma 1 to get an approximation
 $\mathcal{\hat{R}}_{n}(\mathrm{y})$
for
 $\mathcal{R}_{n}(\mathrm{y})$
. Then, using
 $\mathcal{\hat{R}}_{n}(\mathrm{y})$
as a surrogate for the true PGF of R(n), we apply a single-saddlepoint approximation to the approximate CGF
 $\ln\mathcal{\hat{R}}_{n}({\mathrm{e}}^{\mathrm{r}})$
to determine what we call a residue-saddlepoint approximation. There are two such single-saddlepoint approximations, which we denote as
 $\mathbb{P}_{R1}$
and
 $\mathbb{P}_{R2}$
, that relate to the continuity correction applied, as presented in the Supplementary Material.
For the first stage, the residue approximation
 $\mathcal{\hat{R}}_{n}(\mathrm{y})$
for
 $\mathcal{R}_{n}(\mathrm{y})$
extends the development in [Reference Butler6, Section 3] by using residue expansions developed in [Reference Butler5, Corollary 1], which we summarise as follows.
Lemma 1. Consider the generating function
 $\mathcal{A}(\mathrm{z})=\sum_{n=0}^{\infty}a_{n}\mathrm{z}^{n}$
with
 $a_{n}\geq0$
for all n. Assume
 $\mathcal{A}(\mathrm{z})$
is analytic on
 $\{\mathrm{z}\in\mathbb{C}\,:\,|\mathrm{z}|\leq\mathfrak{r}\}$
apart from a simple pole at
 $\mathfrak{r}\in(0,\infty)$
. Then, for some
 $\varepsilon>0$
,
 \begin{equation} a_{n} = -\frac{\xi_{-1}}{\mathfrak{r}^{n+1}} + o\{(\mathfrak{r}+\varepsilon)^{-n}\}, \quad n\rightarrow\infty, \end{equation}
where
 $\xi_{-1}=\lim_{\mathrm{z}\rightarrow\mathfrak{r}}\{(\mathrm{z}-\mathfrak{r})\mathcal{A}(\mathrm{z})\}$
is the residue of
 $\mathcal{A}$
at
 $\mathfrak{r}$
.
The value of
 $\varepsilon$
is limited by any singularity
 $\mathfrak{r}_{2}\in\mathbb{C\cup\{\infty\}}$
of
 $\mathcal{A}(\mathrm{z})$
which has the next largest modulus, say
 $|\mathfrak{r}_{2}|$
. Then
 $\varepsilon$
may be any value in
 $(0,|\mathfrak{r}_{2}|-\mathfrak{r)}$
. If no other singularities exist (including at
 $\infty$
), then the approximation in (7) is exact. For a PGF, this means that
 $\mathcal{A}(\mathrm{z})=(1-1/\mathfrak{r})/(1-\mathrm{z}/\mathfrak{r}).$
Suppose
 $\mathcal{R}({\mathrm{e}}^{\mathrm{r}},{\mathrm{e}}^{\mathrm{s}})$
has a convergence region as described for Figure 2 and fix
 ${\mathrm{e}}^{\mathrm{r}}=\mathrm{y}>y_{0}={\mathrm{e}}^{r_{0}}$
. If
 $\hat{z}(\mathrm{y})$
denotes the smallest-modulus pole of
 $\mathcal{R}(\mathrm{y},\mathrm{z})$
in z for fixed y, then
 $(\mathrm{y},\hat{z}(\mathrm{y}))$
lies on the convergence boundary of
 $\mathcal{R}(\mathrm{y},\mathrm{z})$
and
 $\hat{z}(\mathrm{y})$
is the smallest positive root of
 $1-\mathcal{H}(\mathrm{y},\mathrm{z})=0$
and a dominant pole for
 $\mathcal{R}(\mathrm{y},\mathrm{z})$
. Thus, the range of allowable values of y for using Lemma 1 is
 $\mathrm{y}\in(y_{0},y_{1})$
, where
 $y_{0}={\mathrm{e}}^{r_{0}}$
and
 $y_{1}$
is the largest value of y for which
 $(\mathrm{y},\hat{z}(\mathrm{y}))$
remains on the convergence boundary of
 $\mathcal{R}(\mathrm{y},\mathrm{z})$
.
Theorem 2. (
 $\mathcal{\hat{R}}_{n}(\mathrm{y})$
). Assume
 $\mathcal{H}(\mathrm{y},\mathrm{z})$
has a maximal convergence region which is an open neighbourhood of (1, 1), and
 $\mathcal{F}(\mathrm{z})=\mathcal{H}(1,\mathrm{z})$
is aperiodic with convergence region
 $\{\mathrm{z}\in\mathbb{C}\,:\,|\mathrm{z}|<\mathfrak{r}\}$
for
 $\mathfrak{r}>1$
. A residue approximation for
 $\mathcal{R}_{n}(\mathrm{y})$
is
 \begin{align*} \mathcal{\hat{R}}_{n}(\mathrm{y}) = \frac{1}{\hat{z}(\text{y})^{n+1}} \frac{\mathcal{F}_{S}\{\hat{z}(\text{y})\}}{\mathcal{H}^{\prime}_{\mathrm{z}}\{\mathrm{y},\hat{z}(\text{y})\}}, \quad \mathrm{y}\in(y_{0},y_{1}). \end{align*}
The order of the expansion as
 $n\rightarrow\infty$
is
 $o\{(\hat{z}(\text{y})+\varepsilon)^{-n}\}$
for any
 $0<\varepsilon<\min\{\mathfrak{r}-\hat{z}(\mathrm{y}),|\hat{z}_{2}(\mathrm{y})|-\hat{z}(\mathrm{y})\}$
, where
 $|\hat{z}_{2}(\mathrm{y})|$
is the modulus of the second largest zero of
 $1-\mathcal{H}(\mathrm{y},\mathrm{z})$
, if such a zero exists, or
 $\infty$
otherwise.
Proof. While holding
 $\mathrm{y}\in(y_{0},y_{1})$
fixed,
 $\mathcal{H}(\mathrm{y},\mathrm{z})$
is monotone increasing from 0 to
 $\infty$
as z increases from 0 until
 $(\mathrm{y},\mathrm{z})$
approaches the convergence boundary of
 $\mathcal{R}(\mathrm{y},\mathrm{z})$
. Thus, a smallest positive real root
 $\hat{z}(\mathrm{y})$
exists. To show that
 $\hat{z}(\mathrm{y})$
is the dominant pole of
 $\mathcal{R}(\mathrm{y},\mathrm{z})$
as in Lemma 1, we show that it is the unique zero of
 $1-\mathcal{H}(\mathrm{y},\mathrm{z})$
with smallest modulus. It suffices to show that, for
 $\mathrm{z}\in(0,\hat{z}(\mathrm{y})]$
,
 \begin{equation} |\mathcal{H}(\mathrm{y},\mathrm{z}{\mathrm{e}}^{\mathrm{i}\theta})| < \mathcal{H}(\mathrm{y},\mathrm{z}), \quad \theta\neq0,\ (\mathrm{y},\mathrm{z})\in\mathcal{N}. \end{equation}
Then
 $ |\mathcal{H}(\mathrm{y},\mathrm{z}{\mathrm{e}}^{\mathrm{i}\theta})| < \mathcal{H}(\mathrm{y},\mathrm{z}) \leq \mathcal{H}\{\mathrm{y},\hat{z}(y)\} = 1, $
with equality only occurring when
 $\mathrm{z}=\hat{z}(y)$
and
 $\theta=0$
. Inequality (8) is proved in the Supplementary Material. It is the strict inequality in (8) that matters, as the non-strict inequality
 $(\leq)$
for (8) easily follows from the triangle inequality (see the Supplementary Material).
From (8), we see that as z increases from 0 for fixed y, the value of
 $|\mathcal{H}(\mathrm{y},\mathrm{z}{\mathrm{e}}^{\mathrm{i}\theta})|$
increases the fastest in the direction
 $\theta=0$
. Hence, for y fixed,
 $\mathcal{H}(\mathrm{y},\mathrm{z})$
is analytic on
 $\{\mathrm{z}\in\mathbb{C}\,:\,|\mathrm{z}|\leq\hat{z}(\mathrm{y})\}$
apart from the pole at
 $\hat{z}(\mathrm{y})$
, as required by Lemma 1. The pole is simple since
 $\mathcal{H}^{\prime}_{\mathrm{z}}\{\mathrm{y},\hat{z}(\mathrm{y})\}>0$
. The order of the expansion follows from the discussion of order for Lemma 1.
The assumption that
 $\mathcal{H}(\mathrm{y},\mathrm{z})$
has an open convergence domain can be relaxed as long as
 $\hat{z}(\mathrm{y})$
is uniquely defined for each y and the value of y is appropriately restricted.
Example 6. (Viral RNA tests.) The value
 $\hat{z}(\mathrm{y})$
which solves
 $\mathcal{H}(\mathrm{y},\mathrm{z})=1$
in z using (4) is
 $\hat{z}(\mathrm{y})=1/B(\mathrm{y})$
, and
 \begin{equation*} \mathcal{\hat{R}}_{n}(\mathrm{y}) = B(\mathrm{y}\mathbf{)}^{n} \frac{B_{1}(\mathrm{y})}{B(\mathrm{y})-p_{0\cdot}}, \quad \mathrm{y}>y_{0}=0.02, \end{equation*}
with
 $y_{1}=\infty$
. This replicates the dominant term in the partial fraction expansion (note that
 $p_{0\cdot}^{n}$
is small) in (6). We now use
 $\mathcal{\hat{K}}_{n}(\mathrm{r})=\ln\mathcal{\hat{R}}_{n}({\mathrm{e}}^{\mathrm{r}})$
as a surrogate for the true CGF
 $\mathcal{K}_{n}(\mathrm{r})=\ln\mathcal{R}_{n}({\mathrm{e}}^{\mathrm{r}})$
for R(n). Table 2 displays the results of this strategy where
 $\mathbb{P}_{R1}$
and
 $\mathbb{P}_{R1}$
are continuity-corrected single-saddlepoint approximations as presented in [Reference Butler3, Section 1.2.3]. To approximate
 $\mathbb{P}\{R(n)\geq m\}$
,
 $\mathbb{P}_{R1}$
uses saddlepoint
 $\hat{r}$
solving
 $\mathcal{\hat{K}}^{\prime}_{n}(\mathrm{r})=m$
and
 $\mathbb{P}_{R2}$
uses saddlepoint
 $\tilde{r}$
solving
 $\mathcal{\hat{K}}^{\prime}_{n}(\mathrm{r})=m-\frac12$
. Table 2, as well as the percentage relative error plots in Figure 1, show that
 $\mathbb{P}_{R1}$
(solid red line) and
 $\mathbb{P}_{R2}$
(dashed blue line) achieve remarkable accuracy.
At
 $\mathrm{y}=y_{0}$
,
 $B(y_{0})-p_{0\cdot}=0$
and
 $\mathcal{\hat{R}}_{n}(y_{0})$
is undefined. For
 $\mathrm{y}\in(0,y_{0})$
,
 $\mathcal{\hat{R}}_{n}(\mathrm{y})<0$
but in the true PGF expansion in (6) with both terms,
 $\mathcal{R}_{n}(\mathrm{y})>0$
. This limitation in the domain for
 $\mathcal{\hat{R}}_{n}(\mathrm{y})$
had no practical relevance in this or the other examples.
3.3. Continuous rewards
For continuously valued rewards
 $R\geq0$
, the distribution of R(n) is a mixture distribution which puts a point mass at
 $x=0$
with probability
 $\mathbb{P}\{F>n\}$
and has a continuous density over
 $(0,\infty)$
with probability
 $\mathbb{P}\{F\leq n\}$
. In order to best use saddlepoint and residue approximations, the point mass should be removed so we are dealing only with the continuous portion of the distribution.
We assume that R and F have a mixed MGF-PGF
 $\mathcal{H}_{\mathrm{c}}(\mathrm{r},\mathrm{z})=\mathbb{E}\{{\mathrm{e}}^{\mathrm{r}R}\mathrm{z}^{F}\}$
, and the maximal convergence region is an open neighbourhood of
 $(\mathrm{r},\mathrm{z})=(0,1)$
. The portion of the double transform of reward R(n) associated with the point mass is
 \begin{align*} \sum_{n=0}^{\infty}\mathbb{E}\big\{{\mathrm{e}}^{\mathrm{r}R(n)}\mathbf{1}_{\{R(n)=0\}}\big\}\mathrm{z}^{n} = \sum_{n=0}^{\infty}\mathbb{P}\{F>n\}\mathrm{z}^{n} = \mathcal{F}_{S}(\mathrm{z}).\end{align*}
Removing this from
 $\mathcal{R}_{\mathrm{c}}(\mathrm{r},\mathrm{z})$
gives
 \begin{equation} \mathcal{R}_{\mathrm{c}0}(\mathrm{r},\mathrm{z}) = \sum_{n=0}^{\infty}\mathbb{E}\big\{{\mathrm{e}}^{\mathrm{r}R(n)}\mathbf{1}_{\{R(n)>0\}}\big\}\mathrm{z}^{n} = \mathcal{R}_{\mathrm{c}}(\mathrm{r},\mathrm{z})-\mathcal{F}_{S}(\mathrm{z}) = \frac{\mathcal{F}_{S}(\mathrm{z})\mathcal{H}_{\mathrm{c}}(\mathrm{r},\mathrm{z})} {1-\mathcal{H}_{\mathrm{c}}(\mathrm{r},\mathrm{z})}, \end{equation}
and the conditional MGF of R(n) given
 $R(n)>0$
is
 $[\mathrm{z}^{n}]\mathcal{R}_{\mathrm{c}0}(\mathrm{r},\mathrm{z})/c_{n}$
, with
 $c_{n}=\mathbb{P}\{F\leq n\}$
.
To approximate the marginal probability
 $\mathbb{P}\{R(n)\geq x\}$
for
 $x>0$
, we may apply the continuous version of the Skovgaard double-saddlepoint approximation
 $\mathbb{P}_{\mathrm{C}}$
in (54) as outlined in the Supplementary Material. As noted in [Reference Butler6, Section 6.1], we may take the joint CGF as
 $\mathcal{K}(\mathrm{r},\mathrm{s})=\ln\{\mathcal{R}_{\mathrm{c}0}(\mathrm{r},{\mathrm{e}}^{\mathrm{s}})\}$
and the approximation
 $\mathbb{P}_{\mathrm{C}}$
is for
 $\mathbb{P}\{R(n)\geq x\mid R(n)>0\}$
. This needs to be scaled by
 $c_{n}=\mathbb{P}\{F\leq n\}$
to give the marginal survival probability as
 \begin{align*} \mathbb{P}\{R(n)\geq x\}\approx c_{n}\mathbb{P}_{\mathrm{C}}\{R(T)\geq x\mid T=n\}, \quad x>0.\end{align*}
The joint CGF
 $\mathcal{K}(\mathrm{r},\mathrm{s})=\ln\{\mathcal{R}_{\mathrm{c}0}(\mathrm{r},{\mathrm{e}}^{\mathrm{s}})\}$
is convergent on a region, as seen in Figure 2.
For the residue-saddlepoint approximation, the first stage gives an approximate marginal MGF for R(n). We apply Lemma 1 to (9) and take
 $\hat{z}_{\mathrm{c}}(\textit{r})$
as the smallest positive zero of
 $1-\mathcal{H}_{\mathrm{c}}(\mathrm{r},\mathrm{z})$
in z. Then, using
 $\mathcal{H}_{\mathrm{c}}\{\mathrm{r},\hat{z}_{\mathrm{c}}(\mathrm{r})\}=1$
,
 \begin{equation} \mathcal{\hat{R}}_{\mathrm{c}n}(\mathrm{r}) = \frac{1}{\hat{z}_{\mathrm{c}}(\mathrm{r})^{n+1}} \frac{\mathcal{F}_{S}\{\hat{z}_{\mathrm{c}}(\mathrm{r})\}} {\mathcal{H}_{\mathrm{c}\mathrm{z}}^{\prime}\{\mathrm{r},\hat{z}_{\mathrm{c}}(\mathrm{r})\}}, \quad \mathrm{r}\in(r_{0},r_{1}). \end{equation}
The range for r has
 $r_{0}$
such that
 $(r_{0},\mathfrak{r})$
is the junction point in the boundary of convergence for
 $\mathcal{R}_{\mathrm{c}}(\mathrm{r},\mathrm{z})$
, i.e.
 $1-\mathcal{H}_{\mathrm{c}}(r_{0},\mathfrak{r})=0$
, where
 $\mathfrak{r}$
is the convergence radius of
 $\mathcal{F}_{S}$
. The upper range
 $r_{1}$
is the supremum of values r such that
 $\mathcal{H}_{\mathrm{c}}(\mathrm{r},\hat{z}_{\mathrm{c}}(\mathrm{r}))=1$
so that
 $(\mathrm{r},\hat{z}_{\mathrm{c}}(\mathrm{r}))$
remains on the convergence boundary of
 $\mathcal{R}_{\mathrm{c}}(\mathrm{r},\mathrm{z})$
.
At the second stage,
 $\mathcal{\hat{R}}_{\mathrm{c}n}(\mathrm{r})$
is used as a surrogate for the true MGF
 $\mathcal{R}_{n}(\mathrm{r})=\mathbb{E}\{{\mathrm{e}}^{\mathrm{r}R(n)}\}$
in a single-saddlepoint approximation of the Lugannani–Rice [Reference Lugannani and Rice15] type as given [Reference Borovkov1, Section 1.2.1]. No rescaling by
 $c_{n}$
is required here as with the double saddlepoint method.
Computations for continuous rewards can be found in Example 13, and in Example 15 of the Supplementary Material.
4. Asymptotic expressions
Expansions for the mean and variance of R(n) as
 $n\rightarrow\infty$
are now given. Their derivations follow from straightforward but tedious computations from the appropriate GFs and are outlined in the Supplementary Material. The expansions hold when R(n) has either a discrete mass function or a continuous distribution. We let
 $\mathbb{E}\{R,F\}=(\rho,\mu)$
and denote the variance of R as
 $\mathbb{V}\{R\}$
and the covariance of R and F as
 $\mathbb{C}\{F,R\}$
.
Corollary 2. (Mean and variance expansions.) Under the conditions of Theorem 1, and with rewards given at the end of interarrivals, then
 \begin{equation} \mathbb{E}\{R(n)\} = (n+1)\frac{\rho}{\mu} + \frac{1}{\mu}\bigg\{{-}\mathbb{E}\{FR\} + \frac{\rho}{2\mu}[\mathbb{E}\{F^{2}\}-\mu]\bigg\} + o(1) \end{equation}
as
 $n\rightarrow\infty$
. An expansion for the variance is
 $\mathbb{V}\{R(n)\}\sim n\sigma_{R.F}^{2}$
, where
 \begin{equation} \sigma_{R.F}^{2} = \frac{1}{\mu}\mathbb{E}\bigg\{R-\frac{\rho}{\mu}F\bigg\}^{2} = \frac{1}{\mu}\bigg[\mathbb{V}\{R\}-2\frac{\rho}{\mu}\mathbb{C}\{F,R\} + \frac{\rho^{2}}{\mu^{2}}\mathbb{V}\{F\}\bigg]. \end{equation}
If
 $R=1$
with probability 1, then (11) is
 $\mathbb{E}\{N(n)\}=n/\mu+o(1)$
and (12) reduces to give
 $\mathbb{V}\{N(n)\}\sim n\mathbb{V}\{F\}/\mu^{3}$
as
 $n\rightarrow\infty$
. These expressions agree with the renewal expansions in [Reference Feller7, XIII.6].
Example 7. (Viral RNA tests.) The true mean and variance computed from
 $\mathcal{R}_{n}(\mathrm{y})$
in (6) match up with the asymptotic expansions in (11) and (12) as
 $\mathbb{E}\{R(40)\}=3.7992\approx3.7959$
and
 $\mathbb{V}\{R(40)\}=3.742\approx3.690$
.
For the special case in which the sequences
 $\{F_{n}\}$
and
 $\{R_{n}\}$
are independent, then
 $\mathbb{E}\{R(n)\}=\rho\mathbb{E}\{N(n)\}$
and
 $\mathbb{V}\{R(n)\}=\mathbb{V}\{R\}\mathbb{E}\{N(n)\}+\rho^{2}\mathbb{V}\{N(n)\}$
, and the expansions in Corollary 2 conform to these identities.
The same expansions apply when the rewards are continuously valued and
 $\mathcal{H}(\mathrm{r},\mathrm{z})=\sum_{n=0}^{\infty}\mathbb{E}\{{\mathrm{e}}^{\mathrm{r}R(n)}\}\mathrm{z}^{n}$
. This follows by noting that
 \begin{equation*} \mathbb{E}\{R(n)\} = [\mathrm{z}^{n}]\bigg\{ \frac{\partial}{\partial\mathrm{r}} \frac{\mathcal{F}_{S}(\mathrm{z})}{1-\mathcal{H}(\mathrm{r},\mathrm{z})}\bigg|_{\mathrm{r}=0}\bigg\} = [\mathrm{z}^{n}] \frac{\mathcal{H}^{\prime}_{\mathrm{r}}(0,\mathrm{z})}{\mathcal{F}_{S}(\mathrm{z})(1-\mathrm{z})^{2}} = [\mathrm{z}^{n}] \frac{\mathcal{H}^{\prime}_{\mathrm{r}}(0,\mathrm{z})}{\{1-\mathcal{F}(\mathrm{z})\}(1-\mathrm{z})}. \end{equation*}
The GF of
 $\mathbb{E}\{R(n)\}$
here depends on both the moments of R and the GF argument z in the exact same way as in (3) of Theorem 1. The same can be shown for the GF of
 $\mathbb{E}\{R(n)^{2}\}$
. Hence, the derivations of the moment expansions can be shown to lead to the same expressions as in Corollary 2.
4.1. Uniform expansion and central limit theorem
The CGF for R(n) is
 $\mathcal{K}_{n}(\mathrm{r})=\ln\mathcal{R}_{n}({\mathrm{e}}^{\mathrm{r}})$
, which is approximated by using
 $\mathcal{\hat{K}}_{n}(\mathrm{r})=\ln\mathcal{\hat{R}}_{n}({\mathrm{e}}^{\mathrm{r}})$
. The residue approximation is uniformly
 $o\{(1+\varepsilon)^{-n}\}$
as
 $n\rightarrow\infty$
over compact subsets of r, as stated in Corollary 3. Building upon this, we show that the standardised value of R(n) using the moments of Corollary 2 has a CLT. Since the distribution of R(n) tends to be quite skewed even for moderately large n, these normal limits only achieve reasonable accuracy when n is quite large.
Corollary 3. (Uniform asymptotic expansion.) For any compact interval
 $\mathcal{D}$
on which
 $\mathcal{\hat{K}}_{n}(\mathrm{r})$
is well-defined, there exists an
 $\varepsilon>0$
such that
 \begin{equation} \max_{\mathrm{r}\in\mathcal{D}}|\mathcal{K}_{n}(\mathrm{r})-\mathcal{\hat{K}}_{n}(\mathrm{r})| = o\{(1+\varepsilon)^{-n}\}, \quad n\rightarrow\infty. \end{equation}
Proof. The result follows directly from the derivation of
 $\mathcal{\hat{R}}_{n}(\mathrm{y})$
as shown in the Supplementary Material.
A central limit is now derived for
 $Z_{n}=[R(n)-\mathbb{E}\{R(n)\}]/\sqrt{\mathbb{V}\{R(n)\}}$
, the standardised value of R(n), with
 $\mathbb{E}\{R(n)\}$
and
 $\mathbb{V}\{R(n)\}$
as given in Corollary 2.
Corollary 4. (Central limit.) Subject to the conditions of Theorem 1, the standardised value of R(n) converges weakly to a standard normal distribution as
 $n\rightarrow\infty$
.
Proof. The proof is given in the Supplementary Material. Based on the uniform expansion in (13), the exact CGF
 $\mathcal{K}_{n}(\mathrm{r})$
can be replaced by
 $\mathcal{\hat{K}}_{n}(\mathrm{r})$
, which in turn can be replaced by the dominant term
 $-n\ln\{\hat{z}({\mathrm{e}}^{\mathrm{r}})\}$
as an approximation for the CGF of R(n) for r in a compact neighbourhood of 0. When transformed to an approximate CGF for
 $Z_{n}$
, we show in the Supplementary Material that the resulting approximate CGF converges to
 $\mathrm{r}^{2}/2$
in this compact neighbourhood. From this we may conclude that the weak limit is a standard normal distribution.
5. Multivariate rewards
The approach taken for univariate rewards generalises to multivariate dependent rewards as we now indicate in the bivariate case, with analogous results in higher dimensions. Denote by
 $Q(n)=\sum_{j=1}^{N(n)}Q_{j}$
a second reward process along with
 $R(n)=\sum_{j=1}^{N(n)}R_{j}$
and suppose that (Q, R) has a bivariate PGF
 $\mathcal{J}(\mathrm{x},\mathrm{y})$
convergent in a neighbourhood of (1, 1). We suppose the triple (Q, R, F) has joint PGF
 $\mathcal{H}(\mathrm{x},\mathrm{y},\mathrm{z})$
convergent in a neighbourhood of (1, 1, 1) with
 $\mathcal{J}(\mathrm{x},\mathrm{y)}=\mathcal{H}(\mathrm{x},\mathrm{y},1)$
. The approach allows general dependence among all three variables. The proof of the next result is the same as for Theorem 1.
Corollary 5. (Multivariate rewards.) Subject to the above conditions, the joint PGF for
 $\{Q(n),R(n)\}$
is
 \begin{align*} \mathcal{J}_{n}(\mathrm{x},\mathrm{y}) & = [\mathrm{z}^{n}]\frac{\mathcal{F}_{S}(\mathrm{z})}{1-\mathcal{H}(\mathrm{x},\mathrm{y},\mathrm{z})}, \\ \mathbb{P}\{Q(n)=l,R(n)=m\} & = [\mathrm{x}^{l}\mathrm{y}^{m}\mathrm{z}^{n}] \frac{\mathcal{F}_{S}(\mathrm{z})}{1-\mathcal{H}(\mathrm{x},\mathrm{y},\mathrm{z})}. \end{align*}
Assuming the convergence domain of
 $\mathcal{H}(\mathrm{x},\mathrm{y},\mathrm{z})$
is an open neighbourhood of (1, 1, 1), a residue approximation for
 $\mathcal{J}_{n}(\mathrm{x},\mathrm{y})$
is
 \begin{equation} \mathcal{\hat{J}}_{n}(\mathrm{x},\mathrm{y}) = \frac{1}{\hat{z}(\mathrm{x},\mathrm{y})^{n+1}}\frac{\mathcal{F}_{S}\{\hat{z}(\mathrm{x},\mathrm{y})\}} {\mathcal{H}^{\prime}_{\mathrm{z}}\{\mathrm{x},\mathrm{y},\hat{z}(\mathrm{x},\mathrm{y})\}}. \end{equation}
Here,
 $\hat{z}(\mathrm{x},\mathrm{y})$
is the smallest positive root of
 $1-\mathcal{H}(\mathrm{x},\mathrm{y},\mathrm{z})=0$
. This approximation is for values of
 $(\mathrm{x},\mathrm{y})$
such that
 $\mathcal{H}\{\mathrm{x},\mathrm{y},\hat{z}(\mathrm{x},\mathrm{y})\}=1$
and
 $\hat{z}(\mathrm{x},\mathrm{y})$
is in the convergence domain of
 $\mathcal{F}_{S}$
.
From Corollary 5 we may determine moment expansions for each component using the marginal expansions in Corollary 2. We write
 $\mathbb{E}\{Q,R\}=(\rho_{Q},\rho_{R})$
, so
 \begin{align*} \mathbb{E}\{Q(n),R(n)\}\sim n(\rho_{Q},\rho_{R})/\mu, \qquad \mathbb{V}\{R(n)\}\sim n\sigma_{R.F}^{2}, \qquad \mathbb{V}\{Q(n)\}\sim n\sigma_{Q.F}^{2}\end{align*}
for
 $\sigma_{R.F}^{2}$
defined in (12). The same arguments used for deriving the expansion for
 $\mathbb{V}\{R(n)\}$
lead to
 $\mathbb{C}\{Q(n),R(n)\}\sim n\sigma_{QR.F}^{2}$
, where
 \begin{equation*} \sigma_{QR.F}^{2} = \frac{1}{\mu}\mathbb{E}\bigg\{\bigg(Q-\frac{\rho_{Q}}{\mu}F\bigg) \bigg(R-\frac{\rho_{R}}{\mu}F\bigg)\bigg\}.\end{equation*}
Corollary 6. Subject to the above conditions,
 \begin{equation*} \frac{1}{\sqrt{n}\,} \begin{pmatrix} Q(n)-n\rho_{Q}/\mu \\[2mm] R(n)-n\rho_{R}/\mu \end{pmatrix} \overset{\mathrm{D}}{\longrightarrow} N_{2}\left\{ \begin{pmatrix} 0 \\[2mm] 0 \end{pmatrix}, \begin{pmatrix} \sigma_{Q.F}^{2} & \sigma_{QR.F}^{2} \\[2mm] \sigma_{QR.F}^{2} & \sigma_{R.F}^{2} \end{pmatrix} \right\} \end{equation*}
as
 $n\rightarrow\infty$
.
Proof. The proof is outlined in the Supplementary Material and follows the same outline as the proof for Corollary 4.
6. First-passage time to reward
 $m\in\mathbb{N}$

The first-passage time to reward m is
 $P_{m}=\inf\{n\in\mathbb{N}\,:\, R(n)\geq m\}$
. Given that rewards are issued at the end of interarrival times, the event
 $\{P_{m}=n\}$
means that a renewal occurred at time n and that
 $R(n-1)<m\leq R(n)$
. At epoch n, the reward count jumped from below m to m or above. Equivalent events expressed in terms of random variable
 $P_{m}$
and R(n) are
 $\{P_{m}>n\}=\{R(n)<m\}$
, and this leads to
 \begin{equation} \mathbb{P}\{P_{m}>n\}=\mathbb{P}\{R(n)<m\}=1-\mathbb{P}\{R(n)\geq m\}.\end{equation}
Thus, the survival function of R(n) at m provides the survival function for
 $P_{m}$
at
 $n-1$
. To compute (15), we may invert the double GF
 $\mathcal{R}(\mathrm{y},\mathrm{z})$
and use both residue-saddlepoint methods and double-saddlepoint approximations for R(n). However, this usage fixes the cutoff value m and allows the value for n to vary so that multiple time-indexed distributions are involved in making this computation. Residue-saddlepoint approximations from
 $\mathcal{R}(\mathrm{y},\mathrm{z})$
are especially amenable to this computation and may be used along with a parametric plot to give a smooth curve for the survival function of
 $P_{m}$
, as discussed in Section 7.
Alternatively, the identity in (15) may be used to derive the double GF
 $\mathcal{P}(\mathrm{y},\mathrm{z})$
for the sequence of PGFs for
 $\{P_{m}\,:\, m\geq1\}$
. The same inversion strategies can now be used with
 $\mathcal{P}(\mathrm{y},\mathrm{z})$
. Both approaches are developed below.
6.1. The double GF of
$\{P_{m}\,:\, m\geq0\}$

The PGF of
 $P_{m}$
is
 $\mathcal{P}_{m}(\mathrm{z})=\sum_{n=1}^{\infty}\mathbb{P}\{P_{m}=n\}\mathrm{z}^{n}$
for
 $m\geq1$
. For
 $m=0$
,
 $P_{0}=0$
with probability 1. The double GF in variables
 $(\mathrm{y},\mathrm{z})\leftrightsquigarrow(m,n)$
is
 \begin{align*} \mathcal{P}(\mathrm{y},\mathrm{z})=\sum_{m=0}^{\infty}\mathcal{P}_{m}(\mathrm{z})\mathrm{y}^{m}, \quad |\mathrm{y}|<1,\ |\mathrm{z}|<1.\end{align*}
Let
 $\mathcal{E}(\mathrm{y})=\mathcal{H}(\mathrm{y},1)$
be the reward PGF and write
 $\mathcal{E}_{\mathcal{S}}(\mathrm{y})=\{1-\mathcal{E}(\mathrm{y})\}/(1-\mathrm{y})$
.
Theorem 3. (GF for the first-passage reward mass function.) Suppose (R,F) has a joint PGF
 $\mathcal{H}(\mathrm{y},\mathrm{z})$
which is convergent in a neighbourhood of (1, 1). Then
 \begin{equation} \mathcal{P}(\mathrm{y},\mathrm{z}) = \frac{1}{1-\mathrm{y}}\bigg[1-\frac{\mathrm{y}\{1-\mathcal{F}(\mathrm{z})\}} {1-\mathcal{H}(\mathrm{y},\mathrm{z})}\bigg] , \end{equation}
so that
 $\mathcal{P}_{m}(\mathrm{z})=[\mathrm{y}^{m}]\mathcal{P}(\mathrm{y},\mathrm{z})$
and
 $\mathbb{P}\{P_{m}=n\}=[\mathrm{y}^{m}\mathrm{z}^{n}]\mathcal{P}(\mathrm{y},\mathrm{z})$
. Furthermore,
 \begin{align*} \mathbb{P}\{P_{m}\geq n\} & = [\mathrm{y}^{m-1}\mathrm{z}^{n-1}]\bigg\{\frac{\mathcal{F}_{\mathcal{S}}(\mathrm{z})} {(1-\mathrm{y})\{1-\mathcal{H}(\mathrm{y},\mathrm{z})\}}\bigg\}, \\ \mathbb{E}\{P_{m}\} & = [\mathrm{y}^{m-1}]\bigg\{\frac{\mu}{(1-\mathrm{y})^{2}\mathcal{E}_{\mathcal{S}}(\mathrm{y})\}}\bigg\}. \end{align*}
Note that
 $\mathrm{y}=1$
is a removable singularity of
 $\mathcal{P}(\mathrm{y},\mathrm{z})$
in (16) for values of z in the convergence domain of
 $\mathcal{F}(\mathrm{z})$
.
Proof. Starting with (15), compute the GF in
 $n\leftrightsquigarrow\mathrm{z}$
of the left side and the GF in
 $m\leftrightsquigarrow\mathrm{y}$
of the right side expressed as
 $\mathbb{P}\{R(n)\leq m-1\}$
. The equality in (15) says that the respective inversions of these transforms are equal and that
 \begin{align*} [\mathrm{z}^{n}]\bigg\{\frac{1-\mathcal{P}_{m}(\mathrm{z})}{1-\mathrm{z}}\bigg\} = [\mathrm{y}^{m-1}]\bigg\{\frac{\mathcal{R}_{n}(\mathrm{y})}{1-\mathrm{y}}\bigg\} = [\mathrm{y}^{m}]\bigg\{\frac{\mathrm{y}\mathcal{R}_{n}(\mathrm{y})}{1-\mathrm{y}}\bigg\} , \end{align*}
where
 $\mathcal{R}_{n}(\mathrm{y})$
is the PGF of R(n). Now take the GF in
 $m\leftrightsquigarrow\mathrm{y}$
of the left side and the GF in
 $n\leftrightsquigarrow\mathrm{z}$
on the right side to get
 \begin{align*} [\mathrm{y}^{m}\mathrm{z}^{n}]\bigg\{\frac{1}{(1-\mathrm{y})(1-\mathrm{z})} - \frac{\mathcal{P}(\mathrm{y},\mathrm{z})}{1-\mathrm{z}}\bigg\} = [\mathrm{z}^{n}\mathrm{y}^{m}]\bigg\{\frac{\mathrm{y}}{1-\mathrm{y}} \frac{\mathcal{F}_{\mathcal{S}}(\mathrm{z})}{1-\mathcal{H}(\mathrm{y},\mathrm{z})}\bigg\}, \end{align*}
where
 \begin{align*} \mathcal{R}(\mathrm{y},\mathrm{z})=\sum_{n=0}^{\infty}\mathcal{R} _{n}(\mathrm{y})\mathrm{z}^{n}=\frac{\mathcal{F}_{\mathcal{S}}(\mathrm{z} )}{1-\mathcal{H}(\mathrm{y},\mathrm{z})} \end{align*}
has been used on the right-hand side. Equating the two expressions in curly braces and solving for
 $\mathcal{P}(\mathrm{y},\mathrm{z})$
leads to (16).
To derive the survival function double GF in (16), start with
 \begin{align} \mathbb{P}\{P_{m}\geq n\} = [\mathrm{z}^{n}]\bigg\{\frac{1-\mathrm{z}\mathcal{P}_{m}(\mathrm{z})}{1-\mathrm{z}}\bigg\} & = [\mathrm{z}^{n}]\bigg\{\frac{1-\mathrm{z}[\mathrm{y}^{m}]\mathcal{P}(\mathrm{y},\mathrm{z})} {1-\mathrm{z}}\bigg\} \nonumber \\ & = [\mathrm{y}^{m}\mathrm{z}^{n}]\bigg\{\frac{1}{(1-\mathrm{y})(1-\mathrm{z})} - \frac{\mathrm{z}\mathcal{P}(\mathrm{y},\mathrm{z})}{1-\mathrm{z}}\bigg\} \nonumber \\ & = [\mathrm{y}^{m}\mathrm{z}^{n}]\bigg\{\frac{1}{1-\mathrm{y}} + \frac{\mathrm{yz}\{1-\mathcal{F}(\mathrm{z})\}} {(1-\mathrm{y})(1-\mathrm{z})\{1-\mathcal{H}(\mathrm{y},\mathrm{z})\}}\bigg\} \nonumber \\ & = [\mathrm{y}^{m-1}\mathrm{z}^{n-1}]\bigg\{\frac{\mathcal{F}_{S}(\mathrm{z})} {(1-\mathrm{y})\{1-\mathcal{H}(\mathrm{y},\mathrm{z})\}}\bigg\}. \end{align}
To get the third line we have substituted the value of
 $\mathcal{P}(\mathrm{y},\mathrm{z})$
. For the fourth line, note that
 $[\mathrm{z}^{n}]\{1/(1-\mathrm{y})\}=0$
.
Since
 $\mathbb{E}\{P_{m}\}=\sum_{n=1}^{\infty}\mathbb{P}\{P_{m}\geq n\}$
, the inverse in
 $\mathrm{y}\leftrightsquigarrow m-1$
of the double GF in (17) when evaluated at
 $\mathrm{z}=1$
gives the GF for the sequence of means as
 \begin{equation*} \sum^{\infty}_{n=0} \mathbb{P}\{P_x \geq n\} -1 = [\mathrm{y}^{m}]\left\{\frac{1}{1-y}+\frac{\mathrm{y}\mathcal{F}_{S}(1)}{(1-\mathrm{y})\{1-\mathcal{H}(\mathrm{y},1)\}}\right\} -1 = [\mathrm{y}^{m-1}]\left\{\frac{\mu}{(1-\mathrm{y})^ {2}\mathcal{E}_{\mathcal{S}}(\mathrm{y})}\right\}. \end{equation*}
6.2. Asymptotic expansions
Expansions for the moments and distribution of
 $P_{m}$
as
 $m\rightarrow\infty$
are given below.
Corollary 7. (Mean and variance expansions for first-passage reward moments.) If (R,F) has a joint PGF
 $\mathcal{H}(\mathrm{y},\mathrm{z})$
which is convergent in a neighbourhood of (1, 1), then
 \begin{align} \mathbb{E}\{P_{m}\} & = \bigg(m-\frac12\bigg)\frac{\mu}{\rho} + \frac{\mu}{2\rho^{2}}\mathbb{E}\{R^{2}\} + o(1), \nonumber \\ \mathbb{V}\{P_{m}\} & = m\frac{\mu^{2}}{\rho^{3}}\mathbb{E}\bigg\{R-\frac{\rho}{\mu}F\bigg\}^{2} + O(1) = m\bigg(\frac{\mu}{\rho}\bigg)^{3}\sigma_{R.F}^{2} + O(1), \end{align}
as
 $m\rightarrow\infty$
.
Proof. The derivations of these expansions are given in the Supplementary Material and follow from residue expansions applied to results in Theorem 3.
The passage time
 $P_{m}$
has a limiting normal distribution as
 $m\rightarrow\infty$
after standardisation using the mean and variance of Corollary 7 to order O(1). The proof is a standard result and given in the Supplementary Material.
Corollary 8. (Central limit for
 $P_{m}$
.) Subject to the conditions of Corollary 7,
 \begin{align*} \frac{P_{m}-\mathbb{E}\{P_{m}\}}{\sqrt{\mathbb{V}\{P_{m}\}}} \quad \overset{w}{\longrightarrow} \quad \mathrm{Normal}(0,1)\quad \mathrm{as}\ m\rightarrow \infty. \end{align*}
The convergence in Corollary 8 tends to be very slow as
 $P_{m}$
has a skewed distribution even for moderately large m.
Example 8. (Bivariate geometric rewards.) Expansion of
 $\mathcal{P}(\mathrm{y},\mathrm{z})$
in powers of y provides the first few PGFs for
 $P_{0},\ldots,P_{3}$
. With
 $q_{i}=1-p_{i}$
, then
 \begin{equation} \mathcal{P}(\mathrm{y},\mathrm{z}) = 1 + \frac{p_{2}\mathrm{z}}{1-q_{2}\mathrm{z}}(\mathrm{y}+\mathrm{y}^{2}) + \frac{q_{0}\mathrm{z}}{1-p_{0}\mathrm{z}}\frac{p_{2}\mathrm{z}}{1-q_{2}\mathrm{z}}\mathrm{y}^{3} + O(\mathrm{y}^{4}). \end{equation}
From this, we see that
 $P_{0}=1$
with probability 1, and
 $P_{1}$
and
 $P_{2}$
are Geometric
 $(p_{2})$
. The stopping time for a reward of at least one or two only happens when a renewal occurs in which the two fail simultaneously, hence this is a Geometric
 $(p_{2})$
waiting time as seen in (19). As a check, take
 $p_{0}=\frac{7}{10}$
,
 $p_{1}=\frac{2}{10}$
, and
 $p_{2}=\frac{1}{10}$
. The geometric probability
 $\mathbb{P}\{P_{2}=2\}=p_{2}q_{2}=\frac{1}{10}\times\frac{9}{10}=\frac{9}{100}$
and occurs in two steps with outcomes
 $\{02\}\cup\{12\}$
, where
 $\{12\}$
means one failure followed by two failures in the first two ticks of the clock. These probabilities add to
 $\frac{7}{100}+\frac{2}{100}=\frac{9}{100}$
, which agrees.
The stopping time for three or more rewards is
 $P_{3}\sim \mathrm{Geometric}(q_{0}) + \mathrm{Geometric}(p_{2})$
, with the two geometric distributions independent. This amounts to first waiting for one or two failures in Geometric
 $(q_{0})$
time followed by Geometric
 $(p_{2})$
time for a renewal event to realise the reward. To check this numerically, we compute the convolution as
 \begin{align*} \mathbb{P}\{P_{3}=3\} = \sum_{k=1}^{2}\bigg(\frac{7}{10}\bigg)^{k-1}\frac{3}{10} \bigg(\frac{9}{10}\bigg)^{3-k-1}\frac{1}{10} = \frac{6}{125}. \end{align*}
Since
 $\{P_{3}=3\}=\{012\}\cup\{102\}\cup\{202\}\cup\{022\}\cup\{112\}\cup\{212\}$
, summing these mutually exclusive outcomes gives
 \begin{align*} \mathbb{P}\{P_{3}=3\} = 2\bigg(\frac{14}{1000}\bigg) + 2\bigg(\frac{7}{1000}\bigg) + \frac{4}{1000} + \frac{2}{1000} = \frac{6}{125}. \end{align*}
The expansion terms of Corollary 7 and the true moments for
 $P_{5}$
are
 \begin{align*} 18.148 = \mathbb{E}\{P_{5}\} = 18.125 + o(1), \qquad 111.76 = \mathbb{V}\{P_{5}\} = 34.375 + O(1). \end{align*}
While the mean expansion is quite accurate, the variance expansion of order O(m) is very inaccurate. This is partly due to a small value of
 $m=5$
, but it also suggests that the quite complicated term of order O(1) which has been left out is large and most likely even larger than
 $34.375$
. Without a more accurate variance approximation, the normal approximation would be very inaccurate and misleading. The double-saddlepoint and residue-saddlepoint methods of the next section provide much greater accuracy.
7. Inversions of the double generating functions
$\mathcal{R}(\mathrm{y},\mathrm{z})$
and
$\mathcal{P}(\mathrm{y},\mathrm{z})$


We consider both the residue-saddlepoint inversions introduced in Section 3.2 and the double-saddlepoint inversions of Section 3.1. Both methods are applicable when the convergence domain of
 $\mathcal{H}(\mathrm{y},\mathrm{z})$
is an open neighbourhood of (1, 1). There are four residue-saddlepoint approximations to consider. Two of these approximations follow by using a residue approximation to the CGF of
 $P_{m}$
from
 $\mathcal{P}(\mathrm{y},\mathrm{z})$
followed by two single-saddlepoint continuity-corrected approximations; we call these approximations
 $\mathbb{P}_{R1}$
and
 $\mathbb{P}_{R2}$
, and they are based on inverting
 $\mathcal{P}(\mathrm{y},\mathrm{z})$
.
Two more continuity-corrected residue-saddlepoint approximations instead use a residue approximation to the CGF of R(n) from the double transform
 $\mathcal{R}(\mathrm{y},\mathrm{z})$
. The distribution for
 $P_{m}$
is related to the distribution of R(n) according to
 \begin{equation} \mathbb{P}\{P_{m}\geq n+1\}=1-\mathbb{P}\{R(n)\geq m\} \end{equation}
after rewriting equality (15). Thus, according to (20), the residue-approximated CGF of R(n) with the two continuity-corrected single-saddlepoint approximations provide the two remaining approximations to the distribution for
 $P_{m}$
. We also call these approximations
 $\mathbb{P}_{R1}$
and
 $\mathbb{P}_{R2}$
, and say they are based on inverting
 $\mathcal{R}(\mathrm{y},\mathrm{z})$
. In all cases, the residue expansions assume without loss of generality that F has an aperiodic mass function.
Likewise, there are four double-saddlepoint approximations of the Skovgaard type. Two continuity-corrected double-saddlepoint approximations which invert
 $\mathcal{P}(\mathrm{y},\mathrm{z})$
and the same two approximations used to invert
 $\mathcal{R}(\mathrm{y},\mathrm{z})$
.
7.1. Residue-saddlepoint inversion using
$\mathcal{R}(\mathrm{y},\mathrm{z})$

Inversion of the right-hand side of (20) starts with the double GF for mass function
 $\mathbb{P}\{R(n)=m\}$
in (2) of Theorem 1. If
 $\hat{z}(\mathrm{y})$
is the smallest positive root of
 $1-\mathcal{H}(\mathrm{y},\mathrm{z})=0$
, then the PGF of R(n) has residue approximation
 \begin{equation} \mathcal{\hat{R}}_{n}(\mathrm{y}) = \frac{1}{\hat{z}(\mathrm{y})^{n+1}} \frac{\mathcal{F}_{S}\{\hat{z}(\mathrm{y})\}}{\mathcal{H}^{\prime}_{\mathrm{z}}\{\mathrm{y},\hat{z}(\mathrm{y})\}}, \quad \mathrm{y}\in(y_{0},y_{1}), \end{equation}
where
 $0\leq y_{0}<1<y_{1}$
. The value
 $y_{0}$
solves
 $\hat{z}(y_{0})=\mathfrak{r}$
and the value
 $y_{1}$
is the supremum of the values of y which solve
 $1-\mathcal{H}\{\mathrm{y},\hat{z}(\mathrm{y})\}=0$
. Substituting
 $\mathrm{y}={\mathrm{e}}^{\mathrm{r}}$
, the approximate CGF for R(n) is
 $\mathcal{\hat{K}}_{n}(\mathrm{r})=-(n+1)\ln\{\hat{z}({\mathrm{e}}^{\mathrm{r}})\}+l(\mathrm{r})$
for
 \begin{align*} l(\mathrm{r}) = \ln\frac{\mathcal{F}_{S}\{\hat{z}({\mathrm{e}}^{\mathrm{r}})\}} {\mathcal{H}^{\prime}_{\mathrm{z}}\{{\mathrm{e}}^{\mathrm{r}},\hat{z}({\mathrm{e}}^{\mathrm{r}})\}},\end{align*}
where
 $\mathrm{r}\in(r_{0},r_{1})$
with
 $r_{0}=\ln y_{0}^{+}<0<\ln y_{1}=r_{1}$
. To compute
 $\mathbb{P}_{R1}$
, the saddlepoint
 $\hat{r}=\hat{r}(m)$
solves the saddlepoint equation
 \begin{equation} m = \mathcal{\hat{K}}^{\prime}_{n}(\hat{r}) = -(n+1)\frac{\hat{z}^{\prime}({\mathrm{e}}^{\hat{r}}){\mathrm{e}}^{\hat{r}}}{\hat{z}({\mathrm{e}}^{\hat{r}})} + l^{\prime}(\hat{r}). \end{equation}
This determines the single-saddlepoint approximation
 $\mathbb{\hat{P}}_{R1}\{R(n)\geq m\}$
for the right-hand side of (20), which is the survival approximation of
 $P_{m}$
at
 $n+1$
.
A parametric plot in Maple and Mathematica avoids having to solve (22). For fixed m, the value for n can be expressed explicitly in terms of
 $\hat{r}$
by solving (22) so that
 $\hat{r}$
becomes the parametric index for the plot. If
 $n(\hat{r})$
solves (22) in n for given
 $\hat{r}$
, then the parametric plot is
 $(n(\hat{r})+1, 1-\mathbb{P}_{R1}\{R\{n(\hat{r})\}\geq m\})$
,
 $\hat{r}\in(r_{0},r_{1})$
. This provides a smooth approximation for the survival function of
 $P_{m}$
valid at integer arguments. The form of this parametric curve follows from the identity (20) in which the second component is the survival probability at
 $n(\hat{r})+1$
for
 $P_{m}$
.
A small value of
 $\hat{r}$
just above
 $r_{0}$
computes the right tail of
 $P_{m}$
, and values approaching
 $r_{1}$
compute the left tail. To see this, note that
 $\hat{z}(\mathrm{y})$
is decreasing in
 $\mathrm{y}={\mathrm{e}}^{\mathrm{r}}$
, and hence r. Thus, a small value of
 $\hat{r}$
reflects a large value of
 $n(\hat{r})$
or the right tail for
 $P_{m}$
and the left tail of
 $R\{n(\hat{r})\}$
.
The second continuity-corrected saddlepoint approximation is much the same except that one solves saddlepoint equation (22) with m offset to
 $m^{-}=m-\frac12$
. With saddlepoint
 $\tilde{r}$
, and
 $n^{-}(\tilde{r})$
the solution using
 $m^{-}$
, the parametric plot is
 $(n^{-}(\tilde{r})+1, 1-\mathbb{P}_{R2}\{R\{n^{-}(\tilde{r})\}\geq m\})$
,
 $\tilde{r}\in(r_{0},r_{1})$
.
Example 9. (Bivariate geometric rewards.) Solving for
 $\hat{z}(\mathrm{y})$
leads to
 \begin{align*} \hat{z}(\mathrm{y}) = \frac{1}{p_{0}+p_{1}\mathrm{y}+p_{2}\mathrm{y}^{2}} =: \frac{1}{D(\mathrm{y})}, \end{align*}
where
 $D(\mathrm{y})$
is the GF for the number of failures with each tick of the clock. Since
 $\mathcal{F}_{S}(\mathrm{z})=1/(1-9\mathrm{z}/10)$
,
 \begin{align*} \big\{\mathrm{y}>0\,:\,\hat{z}(\mathrm{y})<\tfrac{10}{9}\big\} = \big\{\mathrm{y}>0\,:\, D(\mathrm{y}) > \tfrac{9}{10}\big\} = \{\mathrm{y}>0.732\}, \end{align*}
so
 $y_{0}=0.732$
. As
 $\mathrm{y}\rightarrow\infty$
,
 $\hat{z}(\mathrm{y})\rightarrow1/p_{0}$
so
 $y_{1}=\infty$
. This leads to the unbounded saddlepoint range
 $\hat{r}>\ln(0.732)=-0.312=r_{0}$
as the index range of the parametric plot. The
 $\mathbb{P}_{R1}$
survival approximation of
 $P_{5}$
is given in the left panel of Figure 3 (solid red line) with exact values shown as circles. The
 $\mathbb{P}_{R2}$
approximation is overlaid (dashed blue line) and is almost indistinguishable. Percentage relative errors are shown with matching line types in the right panel, showing under
 $-2.0\%$
and under
 $-3.5\%$
respectively above the median. As n increases, the residue approximation
 $\mathcal{\hat{R}}_{n}(\mathrm{y})$
approaches
 $\mathcal{R}_{n}(\mathrm{y})$
for each y, which helps to explain its greater accuracy for larger n.
Exact computations were based on inverting
 $\mathcal{P}(\mathrm{y},\mathrm{z})$
using symbolic Taylor expansion. The double GF
 $\mathcal{P}(\mathrm{y},\mathrm{z})$
was expanded in z to extract
 $\mathcal{P}_{5}(\mathrm{y})$
as the coefficient of
 $\mathrm{z}^{5}$
. This was followed by Taylor expansion of the GF
 $\{1-\mathrm{y}\mathcal{P}_{5}(\mathrm{y})\}/(1-\mathrm{y})$
in y. This is only feasible due to the small value of
 $m=5$
.
Left: Approximations for the survival function of
 $P_{5}$
by inverting
 $\mathcal{R}(\mathrm{y},\mathrm{z})$
. The
 $\mathbb{P}_{R1}$
(solid red line) and
 $\mathbb{P}_{R2}$
(dashed blue line) approximations are shown with exact values (circles) for odd integers of n. Right: Percentage relative errors respecting the tails are shown for the
 $\mathbb{P}_{R1}$
and
 $\mathbb{P}_{R2}$
approximations using matching line types. Also shown are the errors for the double-saddlepoint
 $\mathbb{P}_{D1}$
(red crosses) and
 $\mathbb{P}_{D2}$
(blue diamonds) approximations when inverting
 $\mathcal{R}(\mathrm{y},\mathrm{z})$
.

Example 10. (Reward as an interarrival random walk.) In the context of Example 4 in which the joint PGF takes the form
 $\mathcal{H}(\mathrm{y},\mathrm{z})=\mathcal{F}\{\mathrm{z}\mathcal{G}_{0}(\mathrm{y})\}$
, the residue expansion for the PGF of R(n) in (21) takes a particularly simple form. We assume that the convergence domains of both
 $\mathcal{F}(\mathrm{z})$
and
 $\mathcal{G}_{0}(\mathrm{y})$
are open neighbourhoods of 0 with radii
 $\mathfrak{r}>1$
and
 $\mathfrak{r}_{0}>1$
respectively. The value
 $\hat{z}(\mathrm{y})=1/\mathcal{G}_{0}(\mathrm{y})$
, and (21) reduces to
 \begin{align*} \mathcal{\hat{R}}_{n}(\mathrm{y}) = \mathcal{G}_{0}(\mathrm{y})^{n}\frac{\mathcal{F}_{S}\{1/\mathcal{G}_{0}(\mathrm{y})\}}{\mu}, \quad \mathrm{y}\in(y_{0},\mathfrak{r}_{0}). \end{align*}
Here,
 $y_{0}<1$
solves
 $1/\mathcal{G}_{0}(y_{0})=\mathfrak{r}$
. For Example 1,
 $\mathcal{F}_{S}(\mathrm{z})=1=\mu$
so that
 $\mathcal{\hat{R}}_{n}(\mathrm{y})=(p\mathrm{y}+q)^{n}$
is exact.
7.2. Double-saddlepoint inversion of
$\mathcal{R}(\mathrm{y},\mathrm{z})$

We use the double-saddlepoint method in Section 3.1 and treat
 \begin{equation*} \mathcal{K}(\mathrm{r},\mathrm{s}) = \ln\mathcal{R}({\mathrm{e}}^{\mathrm{r}},{\mathrm{e}}^{\mathrm{s}}) = \ln\frac{\mathcal{F}_{S}({\mathrm{e}}^{\mathrm{s}})}{1-\mathcal{H}({\mathrm{e}}^{\mathrm{r}},{\mathrm{e}}^{\mathrm{s}})}, \quad (\mathrm{r},\mathrm{s})\in\mathcal{B}\cap\mathcal{C}, \end{equation*}
as the CGF for
 $\{R(T),T\}$
whose joint measure is
 $\mu\{R(T)=m,T=n\}=\mathbb{P}\{R(n)=m\}$
with
 $(m,n)\leftrightsquigarrow(\mathrm{y},\mathrm{z})$
. This CGF is well-defined over the open convex region
 $\mathcal{B}\cap\mathcal{C}$
, where
 $\mathcal{B}=\{(\mathrm{r},\mathrm{s})\,:\,\mathcal{H}({\mathrm{e}}^{\mathrm{r}},{\mathrm{e}}^{\mathrm{s}})<1\}$
and
 $\mathcal{C}=\{(\mathrm{r},\mathrm{s})\,:\,\mathrm{s}<\ln\mathfrak{r}\}$
. Region
 $\mathcal{B}$
excludes the first quadrant and has the form in Figure 2. Then
 $\mathbb{P}\{P_{m}\geq n+1\}=1-\mathbb{P}\{R(n)\geq m\}=1-\mathbb{P}\{R(T)\geq m\mid T=n\}$
, where the last conditional probability is approximated to determine the survival function of
 $P_{m}$
at
 $n+1$
.
For Example 9, the
 $\mathbb{P}_{D1}$
approximation (red crosses) and the
 $\mathbb{P}_{D2}$
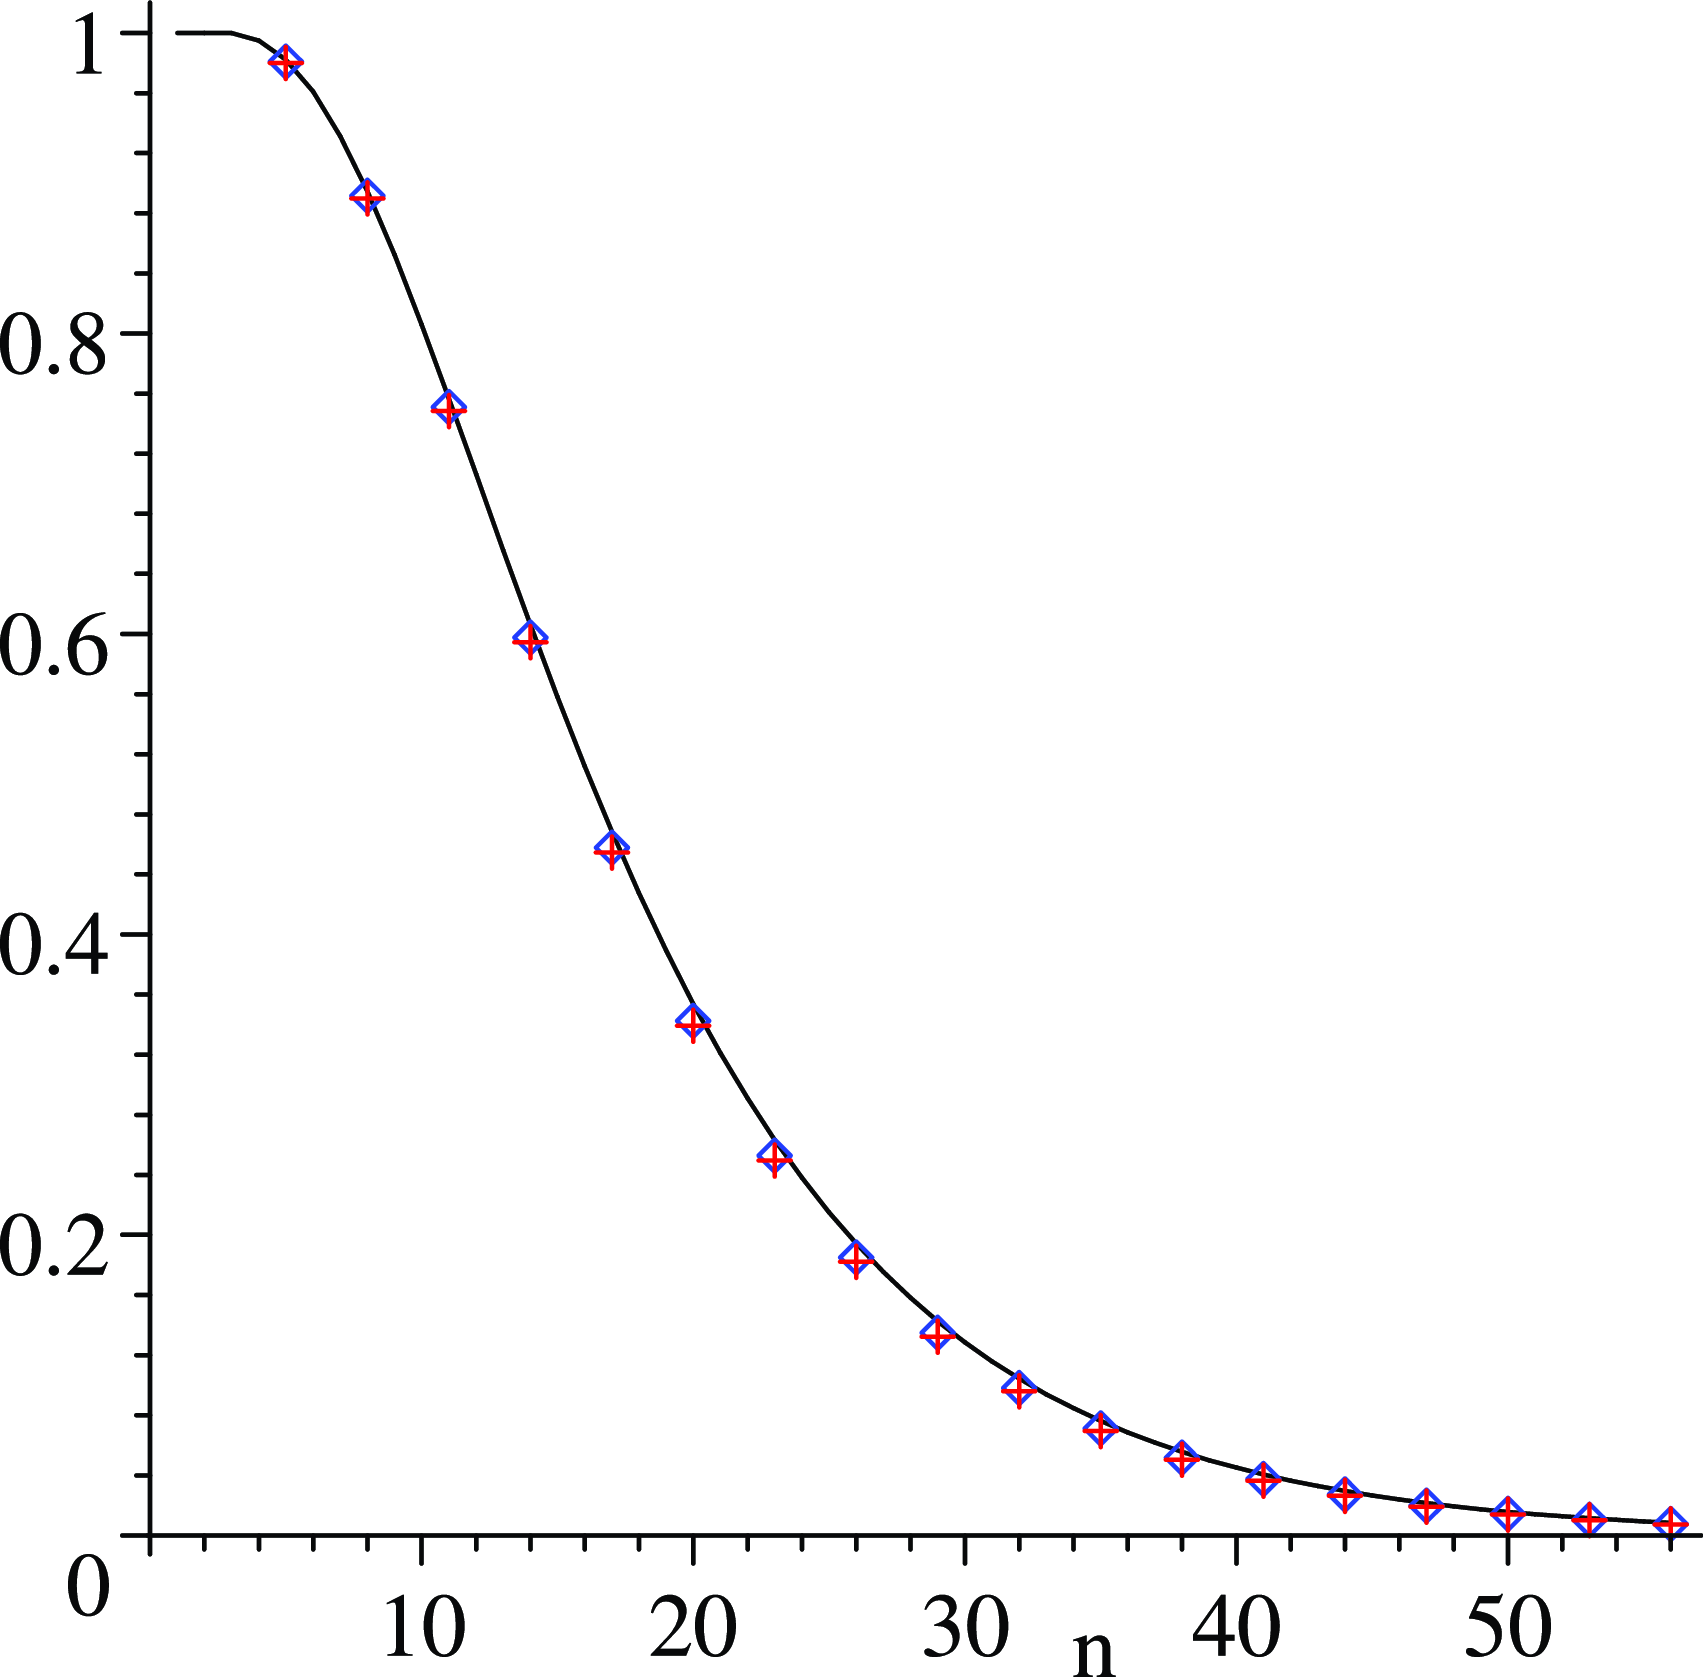
approximation (blue diamonds) are shown in Figure 4 compared with exact values (solid line). The percentage relative errors using matching symbol types are shown in the right panel of Figure 3. The residue-saddlepoint approximations are somewhat more accurate, but these double-saddlepoint approximations are still quite accurate.
Double-saddlepoint approximations for the survival function of
 $P_{5}$
by inverting
 $\mathcal{R}(\mathrm{y},\mathrm{z})$
. The
 $\mathbb{P}_{D1}$
(red crosses) and
 $\mathbb{P}_{D2}$
(blue diamonds) approximations are shown at every third value. Exact values are on the solid line.

7.3. Residue-saddlepoint inversion of
$\mathcal{P}(\mathrm{y},\mathrm{z})$

From Theorem 3,
 \begin{equation} \mathcal{P}(\mathrm{y},\mathrm{z}) = \sum_{m=0}^{\infty}\mathcal{P}_{m}(\mathrm{z})\mathrm{y}^{m} = \frac{1}{1-\mathrm{y}}\bigg[1 - \frac{\mathrm{y}\{1-\mathcal{F}(\mathrm{z})\}}{1-\mathcal{H}(\mathrm{y},\mathrm{z})}\bigg]. \end{equation}
A residue expansion as in Lemma 1, which inverts in
 $\mathrm{y}\leftrightsquigarrow m$
to approximate
 $\mathcal{P}_{m}(\mathrm{z})$
from the right-hand expression, is
 \begin{equation} \mathcal{\hat{P}}_{m}(\mathrm{z}) = \frac{1}{\hat{y}(\mathrm{z})^{m}}\frac{1-\mathcal{F}(\mathrm{z})} {\{\hat{y}(\mathrm{z})-1\}\mathcal{H}^{\prime}_{\mathrm{y}}\{\hat{y}(\mathrm{z}),\mathrm{z}\}}, \quad \mathrm{z}<\mathfrak{r}, \end{equation}
where
 $\hat{y}(\mathrm{z})$
is the smallest positive root of
 $1-\mathcal{H}(\mathrm{y},\mathrm{z})=0$
in y. This compares with the residue expansion in Section 7.1 for inverting the double GF
 $\mathcal{R}(\mathrm{y},\mathrm{z})$
in z to get
 $\mathcal{R}_{n}(\mathrm{y})$
. In that expansion,
 $\hat{z}(\mathrm{y})$
is the smallest positive root of
 $1-\mathcal{H}(\mathrm{y},\mathrm{z})=0$
in z rather than y. Thus, the functions
 $\hat{z}(\mathrm{y})$
and
 $\hat{y}(\mathrm{z})$
are inverse functions.
At
 $\mathrm{z}=1$
,
 $\mathcal{\hat{P}}_{m}(1)=1$
and
 $\mathcal{\hat{P}}_{m}(\mathrm{z})$
has a removable singularity, as may be shown using l’Hôpital’s rule. To show this, we compute
 $\hat{y}(1)=1$
and note that
 \begin{align*} \frac{{\mathrm{d}}\hat{y}(\mathrm{z})}{{\mathrm{d}}\mathrm{z}} = -\frac{\mathcal{H}^{\prime}_{\mathrm{z}}\{\hat{y}(\mathrm{z}),\mathrm{z}\}} {\mathcal{H}^{\prime}_{\mathrm{y}}\{\hat{y}(\mathrm{z}),\mathrm{z}\}}<0.\end{align*}
Thus,
 $\hat{y}(\mathrm{z})-1\gtrless0$
if and only if
 $\mathrm{z}\lessgtr1$
, which ensures that
 $\mathcal{\hat{P}}_{m}(\mathrm{z})>0$
. The factor
 $1-\mathcal{F}(\mathrm{z})$
in
 $\mathcal{\hat{P}}_{m}(\mathrm{z})$
constrains
 $\mathrm{z}\in(0,\mathfrak{r})$
, where
 $\mathfrak{r}>1$
is the convergence radius of
 $\mathcal{F}(\mathrm{z})$
. The right tail for the distribution of
 $P_{m}$
uses a saddlepoint approaching
 $\ln\mathfrak{r}$
. As
 $\mathrm{z}\uparrow\mathfrak{r}$
,
 $\hat{y}(\mathrm{z})\downarrow\hat{y}(\mathfrak{r})<\hat{y}(1)=1$
.
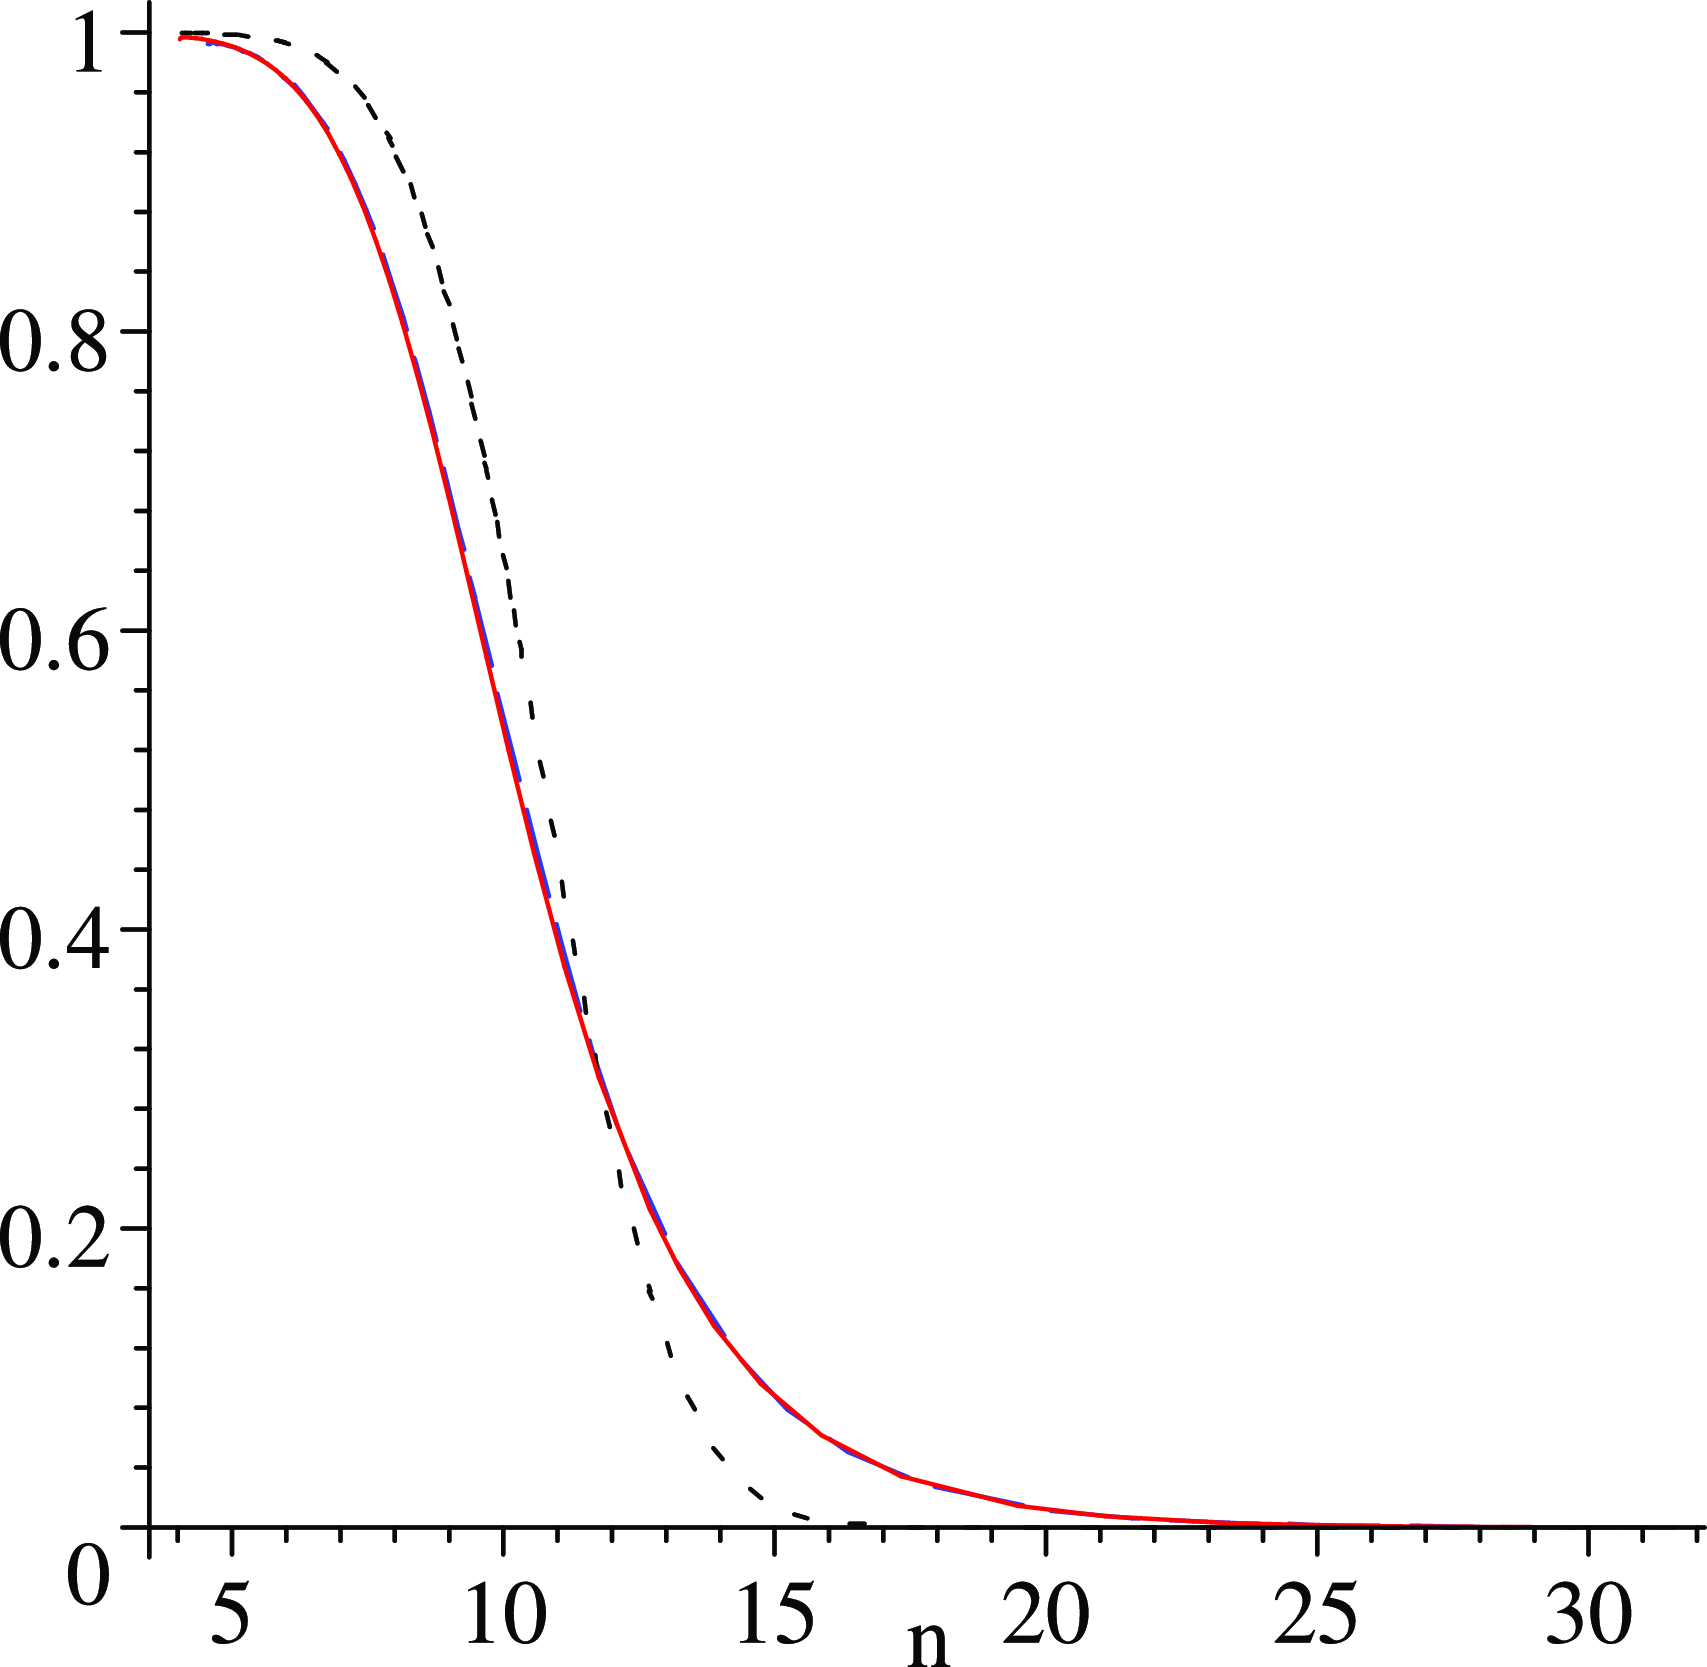
For Example 9, the left panel of Figure 5 shows the
 $\mathbb{P}_{R1}$
and
 $\mathbb{P}_{R2}$
residue-saddlepoint approximations from inverting
 $\mathcal{P}(\mathrm{y},\mathrm{z})$
, which are remarkably accurate. The right panel shows the percentage relative errors with a maximum error of
 $-2\%$
above the median for both approximations. The two double-saddlepoint approximations
 $\mathbb{P}_{D1}$
and
 $\mathbb{P}_{D2}$
from inverting
 $\mathcal{P}(\mathrm{y},\mathrm{z})$
are also shown, and both have a maximum percentage relative error of
 $-4\%$
above the median.
Left: Approximations for the survival function of
 $P_{5}$
by inverting
 $\mathcal{P}(\mathrm{y},\mathrm{z})$
. The
 $\mathbb{P}_{R1}$
(solid red) and
 $\mathbb{P}_{R2}$
(dashed blue) approximations are shown with exact values (circles) for the odd integers n. Right: Percentage relative errors respecting the tails are given for the
 $\mathbb{P}_{R1}$
and
 $\mathbb{P}_{R2}$
approximations with matching line types. Also shown are the errors for the double-saddlepoint
 $\mathbb{P}_{D1}$
(red crosses) and
 $\mathbb{P}_{D2}$
(blue diamonds) approximations from
 $\mathcal{P}(\mathrm{y},\mathrm{z})$
.

Example 11. (Reward as an interarrival random walk.) Here,
 $\mathcal{H}(\mathrm{y},\mathrm{z})=\mathcal{F}\{\mathrm{z}\mathcal{G}_{0}(\mathrm{y})\}$
and we assume both
 $\mathcal{F}$
and
 $\mathcal{G}_{0}$
convergence in open circles of radius
 $\mathfrak{r}$
and
 $\mathfrak{r}_{0}$
. A residue approximation for the first-passage PGF
 $\mathcal{P}_{m}(\mathrm{z})$
of
 $P_{m}$
, as given in (24), uses the value
 $\hat{y}(\mathrm{z})$
which solves
 $\mathcal{G}_{0}(\mathrm{y})=1/\mathrm{z}$
. The expression in (24) reduces to
 \begin{align*} \mathcal{\hat{P}}_{m}(\mathrm{z}) = \frac{1}{\hat{y}(\mathrm{z})^{m}}\frac{1-\mathcal{F}(\mathrm{z})} {\{\hat{y}(\mathrm{z})-1\}\mu\mathrm{z}\mathcal{G}^{\prime}_{0}\{\hat{y}(\mathrm{z})\}}, \quad 0<\mathrm{z}<\mathfrak{r}. \end{align*}
As
 $\mathrm{z}\downarrow0$
,
 $\mathcal{\hat{P}}_{m}(\mathrm{z})\rightarrow0=\mathcal{P}_{m}(0)$
for
 $m\geq1$
, as shown in the Supplementary Material.
For Example 1,
 $P_{m}$
has a negative Binomial(m, p) distribution. The pole is
 $\hat{y}(\mathrm{z})=(1-q\mathrm{z})/(p\mathrm{z})$
and the residue approximation is exact:
 \begin{align*} \mathcal{\hat{P}}_{m}(\mathrm{z}) = \bigg(\frac{p\mathrm{z}}{1-q\mathrm{z}}\bigg)^{m} = \mathcal{P}_{m}(\mathrm{z}).\end{align*}
7.4. Double saddlepoint inversion of
$\mathcal{P}(\mathrm{y},\mathrm{z})$

This approach for inverting
 $\mathcal{P}(\mathrm{y},\mathrm{z})$
in (23) to determine
 $\mathbb{P}\{P_{m}\geq n\}$
fixes the value of
 $m\leftrightsquigarrow\mathrm{y}$
in the double-saddlepoint expressions given in the Supplementary Material. The resulting
 $\mathbb{P}_{D1}$
(red crosses) and
 $\mathbb{P}_{D2}$
(blue diamonds) approximations are shown in the left panel of Figure 6 with exact values (solid line). Percentage relative errors are shown in the right panel of Figure 6 as red crosses and blue diamonds respectively.
Left: Approximations for the survival function of
 $P_{5}$
by inverting
 $\mathcal{P}(\mathrm{y},\mathrm{z})$
. Double-saddlepoint approximations
 $\mathbb{P}_{D1}$
(red crosses) and
 $\mathbb{P}_{D2}$
(blue diamonds) are shown at every third value. Exact values are on the solid line. Right: Percentage relative errors respecting the tails for the residue-saddlepoint approximations
 $\mathbb{P}_{R1}$
(solid red) and
 $\mathbb{P}_{R2}$
(dashed blue) which invert
 $\mathcal{P}(\mathrm{y},\mathrm{z})$
, the residue-saddlepoint approximations
 $\mathbb{P}_{R1}$
(dotted green) and
 $\mathbb{P}_{R2}$
(dot-dashed magenta) which invert
 $\mathcal{R}(\mathrm{y},\mathrm{z})$
, and the double-saddlepoint approximations
 $\mathbb{P}_{D1}$
(red crosses) and
 $\mathbb{P}_{D2}$
(blue diamonds) from inverting
 $\mathcal{P}(\mathrm{y},\mathrm{z})$
.

7.5. Summary of methods
Eight plots estimating the first-passage distribution of
 $P_{5}$
have been provided and two conclusions are apparent for this example and which we suggest will apply more generally. First, inverting
 $\mathcal{P}(\mathrm{y},\mathrm{z})$
rather than
 $\mathcal{R}(\mathrm{y},\mathrm{z})$
tends to result in slightly greater accuracy regardless of the particular method used. Secondly, the residue-saddlepoint approximations tend to provide greater accuracy than the double-saddlepoint approximations regardless of the type of continuity correction and regardless of the double GF which is inverted. The right panel of Figure 6 overlays six relative error plots for the four residue-saddlepoint approximation plots inverting both
 $\mathcal{P}(\mathrm{y},\mathrm{z})$
and
 $\mathcal{R}(\mathrm{y},\mathrm{z})$
and the two double-saddlepoint approximations from inverting
 $\mathcal{P}(\mathrm{y},\mathrm{z})$
. This shows that the residue-saddlepoint
 $\mathbb{P}_{R1}$
and
 $\mathbb{P}_{R2}$
plots (solid red, dashed blue) for inverting
 $\mathcal{P}(\mathrm{y},\mathrm{z})$
are the most accurate. The double-saddlepoint methods
 $\mathbb{P}_{D1}$
and
 $\mathbb{P}_{D2}$
still achieve remarkable accuracy even though they are not the most accurate.
8. First-passage with continuous rewards
When rewards are continuous, then
 $P_{x}$
, the first-passage time to cumulative reward x, has a distribution which may be analysed by using the identity
 $\mathbb{P}\{P_{x}>n\}=\mathbb{P}\{R(n)<x\}$
. Suppose (R, F) has a mixed MGF-PGF
 $\mathcal{H}_{\mathrm{c}}(\mathrm{r},\mathrm{z})=\mathbb{E}\{{\mathrm{e}}^{\mathrm{r}R}\mathrm{z}^{F}\}$
which converges in a neighbourhood of
 $(\mathrm{r},\mathrm{z})=(0,1)$
. Let
 $\mathcal{H}_{\mathrm{c}}(0,\mathrm{z})=\mathcal{F}(\mathrm{z})$
be the PGF of F with convergence radius
 $\mathfrak{r}>1$
and let
 $\mathcal{H}_{\mathrm{c}}({-}\mathrm{r},1)=\mathcal{E}(\mathrm{r})$
be the marginal LT of R. Denote the PGF of
 $P_{x}$
as
 $\mathcal{P}_{x}(\mathrm{z})=\sum_{n=0}^{\infty}\mathbb{P}\{P_{x}=n\}\mathrm{z}^{n}$
. Define the double LT-PGF and the LT inversion symbol
 $[{\mathrm{e}}^{-x\mathrm{r}}]$
so that
 \begin{align*}\mathcal{P}_{\mathrm{c}}(\mathrm{r},\mathrm{z})=\int_{0}^{\infty}\mathcal{P}_{x}(\mathrm{z}){\mathrm{e}}^{-\mathrm{r}x}\,{\mathrm{d}} x, \qquad \mathcal{P}_{x}(\mathrm{z})=[{\mathrm{e}}^{-x\mathrm{r}}]\mathcal{P}_{\mathrm{c}}(\mathrm{r},\mathrm{z}).\end{align*}
The proof of the next theorem is given in the Supplementary Material and is fundamentally the same method of proof as used for Theorem 3.
Theorem 4. (PGF for the first-passage reward mass function.) If
 $\mathcal{H}_{\mathrm{c}}(\mathrm{r},\mathrm{z})=\mathbb{E}\{{\mathrm{e}}^{\mathrm{r}R}\mathrm{z}^{F}\}$
converges in a neighbourhood of
 $(\mathrm{r},\mathrm{z})=(0,1)$
, then
 \begin{equation} \mathcal{P}_{\mathrm{c}}(\mathrm{r},\mathrm{z}) = \int_{0}^{\infty}\mathbb{E}\{\mathrm{z}^{P_{x}}\}{\mathrm{e}}^{-\mathrm{r}x}\,{\mathrm{d}} x = \frac{1}{\mathrm{r}}\bigg\{1-\frac{1-\mathcal{F}(\mathrm{z})} {1-\mathcal{H}_{\mathrm{c}}({-}\mathrm{r},\mathrm{z})}\bigg\}, \end{equation}
where
 $\mathcal{H}_{\mathrm{c}}({-}\mathrm{r},\mathrm{z})=\mathbb{E}\{{\mathrm{e}}^{-\mathrm{r}R}\mathrm{z}^{F}\}$
. Thus, the PGF of
 $\mathcal{P}_{x}$
is
 $\mathcal{P}_{x}(\mathrm{z})=[{\mathrm{e}}^{-x\mathrm{r}}]\mathcal{P}_{\mathrm{c}}(\mathrm{r},\mathrm{z})$
and
 $\mathbb{P}\{P_{x}=n\}=[{\mathrm{e}}^{-x\mathrm{r}}\mathrm{z}^{n}]\mathcal{P}_{\mathrm{c}}(\mathrm{r},\mathrm{z})$
. Furthermore,
 \begin{align} \mathbb{P}\{P_{x}\geq n\} & = [{\mathrm{e}}^{-x\mathrm{r}}\mathrm{z}^{n}]\bigg[ \frac{1}{r} \bigg\{ 1 + \frac{\mathrm{z}\mathcal{F}_{\mathcal{S}}(\mathrm{z})}{1-\mathcal{H}_{\mathrm{c}}({-}\mathrm{r},\mathrm{z})}\bigg\}\bigg], \\ \mathbb{E}\{P_{x}\} & = [{\mathrm{e}}^{-x\mathrm{r}}]\bigg\{ \frac{\mu}{\mathrm{r}^{2}\mathcal{E}_{\mathcal{S}}(\mathrm{r})}\bigg\}, \qquad \mathcal{E}_{\mathcal{S}}(\mathrm{r})=\frac{1-\mathcal{E}(\mathrm{r})}{\mathrm{r}}. \nonumber \end{align}
Note that
 $\mathrm{r}=0$
is a removable singularity of
 $\mathcal{P}_{\mathrm{c}}(\mathrm{r},\mathrm{z})$
. Residue expansions for inverting MGFs and LTs were developed in [Reference Borovkov and Rogozin2, Theorem 1 and Lemma 1] and lead to expansions for the mean and variance. The derivations are briefly outlined in the Supplementary Material.
Corollary 9. (First-passage continuous reward moments.) If
 $\mathcal{H}_{\mathrm{c}}(\mathrm{r},\mathrm{z})$
converges in a neighbourhood of
 $(\mathrm{r},\mathrm{z})=(0,1)$
, then
 \begin{align} \mathbb{E}\{P_{x}\} & = x\frac{\mu}{\rho} + \frac{\mu}{2\rho^{2}}\mathbb{E}\{R^{2}\} + o(1), \end{align}
 \begin{align} \mathbb{V}\{P_{x}\} & = x\frac{\mu^{2}}{\rho^{3}}\mathbb{E}\bigg\{R-\frac{\rho}{\mu}F\bigg\}^{2} + O(1) = x\bigg(\frac{\mu}{\rho}\bigg)^{3}\sigma_{R.F}^{2} + O(1) \end{align}
as
 $x\rightarrow\infty$
.
These expressions have the same form as the expansions in Corollary 7.
8.1. Double-saddlepoint inversions
To approximate
 $\mathbb{P}\{R(n)\geq x\}$
for
 $x>0$
by inverting
 $\mathcal{R}_{\mathrm{c}0}(\mathrm{r},\mathrm{z})$
in (9), the double-saddlepoint Skovgaard approximation
 $\mathbb{P}_{\mathrm{C}}$
in (54) of the Supplementary Material is used as described in Section 3.3. The expression
 $\ln\mathcal{R}_{\mathrm{c}0}(\mathrm{r},{\mathrm{e}}^{\mathrm{s}})$
is used as the CGF for the conditional joint distribution of
 $\{R(T),T\}$
given
 $R(T)>0$
. Inversion in
 $(\mathrm{r},\mathrm{s})\leftrightsquigarrow(x,n)$
gives
 \begin{align*} \mathbb{P}\{R(n)\geq x\} \approx c_{n}\mathbb{P}_{\mathrm{C}}\{R(T)\geq x\mid T=n,\ R(T)>0\}, \quad x>0,\end{align*}
where
 $c_{n}=\mathbb{P}\{R(T)>0\mid T>0\}=\mathbb{P}\{F\leq n\}$
.
Double-saddlepoint inversion of
 $\mathcal{P}_{\mathrm{c}}(\mathrm{r},\mathrm{z})$
in (25) inverts the other way round. Associate
 $(\mathrm{r},\mathrm{z}={\mathrm{e}}^{\mathrm{s}})\leftrightsquigarrow(x,n)$
and treat
 $\mathcal{K}(\mathrm{r},\mathrm{s})=\ln\mathcal{P}_{\mathrm{c}}({-}\mathrm{r},{\mathrm{e}}^{\mathrm{s}})$
as the joint CGF of
 $\{T,P_{T}\}$
. Here,
 $P_{T}\mid T=x$
has the discrete distribution of
 $P_{x}$
and marginally T has improper Lebesgue measure on
 $(0,\infty)$
. This joint distributional structure is reflected in the joint MGF
 \begin{equation} \mathcal{P}_{\mathrm{c}}({-}\mathrm{r},{\mathrm{e}}^{\mathrm{s}}) = \int_{0}^{\infty}\mathbb{E}\{{\mathrm{e}}^{\mathrm{s}P_{x}}\}{\mathrm{e}}^{\mathrm{r}x}\,{\mathrm{d}} x. \end{equation}
Then,
 $\mathbb{P}\{P_{x}\geq n\}=\mathbb{P}\{P_{T}\geq n\mid T=x\}$
, with
 $(x,n)\leftrightsquigarrow(\mathrm{r},\mathrm{s})$
. This uses either of the two continuity-corrected Skovgaard approximations
 $\mathbb{P}_{D1}$
or
 $\mathbb{P}_{D2}$
in the Supplementary Material.
8.2. Residue-saddlepoint inversions
To compute the distribution of R(n), a residue approximation first inverts
 $\mathcal{R}_{\mathrm{c}0}(\mathrm{r},\mathrm{z})$
in (9) in the variable
 $\mathrm{z}\leftrightsquigarrow n$
as described in Section 3.3. This gives
 $\mathcal{\hat{R}}_{\mathrm{c}n}(\mathrm{r})$
in (10) as an approximation to the MGF
 $\mathcal{R}_{n}(\mathrm{r})=\mathbb{E}\{{\mathrm{e}}^{\mathrm{r}R(n)})$
. Now,
 $\mathcal{\hat{R}}_{\mathrm{c}n}(\mathrm{r})$
is used as a surrogate for
 $\mathcal{R}_{n}(\mathrm{r})$
in a single-saddlepoint approximation of the Lugannani–Rice [Reference Lugannani and Rice15] type for a continuous distribution to compute an approximation to
 $\mathbb{P}\{R(n)>x\}$
. See Example 13.
When inverting
 $\mathcal{P}_{\mathrm{c}}(\mathrm{r},\mathrm{z})$
in (25) instead of
 $\mathcal{R}_{\mathrm{c}0}(\mathrm{r},\mathrm{z})$
, the residue-saddlepoint approximation first inverts
 $\mathcal{P}_{\mathrm{c}}(\mathrm{r},\mathrm{z})$
in the other continuous variable
 $\mathrm{r}\leftrightsquigarrow x$
and not in the discrete variable
 $\mathrm{z}\leftrightsquigarrow n$
. From (29), the PGF for
 $P_{x}$
is
 \begin{align*} \mathcal{P}_{x}(\mathrm{z}) = [{\mathrm{e}}^{-x\mathrm{r}}] \int_{0}^{\infty}\mathbb{E}\{\mathrm{z}^{P_{x}}\}{\mathrm{e}}^{-\mathrm{r}x}\,{\mathrm{d}} x = [{\mathrm{e}}^{-x\mathrm{r}}]\mathcal{P}_{\mathrm{c}}(\mathrm{r},\mathrm{z}).\end{align*}
Residue expansions which invert LTs and MGFs in this continuous context were developed in [Reference Butler6] and involve more conditions than those for inverting GFs as in Lemma 1. The derivation of the next theorem is given in the Supplementary Material. Define
 $\hat{r}(\mathrm{z})$
to be the largest real root of
 $0=1-\mathcal{H}_{\mathrm{c}}({-}\mathrm{r},\mathrm{z})$
in r. Note that
 $-\hat{r}(\mathrm{z})$
and
 $\hat{z}(\mathrm{r})$
are both roots of the same equation and are, in fact, inverse functions. Implicit differentiation shows that
 $\hat{r}(\mathrm{z})$
is a strictly increasing function of z. Since
 $\hat{r}(1)=0$
, then
 $\hat{r}(\mathrm{z})\gtrless0$
for
 $\mathrm{z}\gtrless1$
.
Theorem 5. (Residue approximation for
 $\mathcal{P}_{x}(\mathrm{z})$
.) Suppose
 $\mathcal{H}_{\mathrm{c}}(\mathrm{r},\mathrm{z})=\mathbb{E}\{{\mathrm{e}}^{\mathrm{r}R}\mathrm{z}^{F}\}$
has a maximal convergence region which is an open neighbourhood of
 $(\mathrm{r},\mathrm{z})=(0,1)$
. Let
 $\mathcal{F}(\mathrm{z})$
have convergence radius
 $\mathfrak{r}\leq\infty$
, and suppose condition
 $\mathcal{Z}$
below holds. Then, a residue approximation for
 $\mathcal{P}_{x}(\mathrm{z})$
is
 \begin{equation} \mathcal{\hat{P}}_{x}(\mathrm{z}) = {\mathrm{e}}^{\hat{r}(\mathrm{z})x}\frac{1-\mathcal{F}(\mathrm{z})} {-\hat{r}(\mathrm{z})\mathcal{H}^{\prime}_{\mathrm{c}\mathrm{r}}\{-\hat{r}(\mathrm{z}),\mathrm{z}\}}, \quad \mathrm{z}<\mathfrak{r}. \end{equation}
 $(\mathcal{Z})$
For each
 $\mathrm{z}<\mathfrak{r}$
, there exist
 $\eta>0$
and
 $\varepsilon>0$
such that
 $|\mathcal{H}^{\prime}_{\mathrm{c}\mathrm{r}}\{-\hat{r}(\mathrm{z})-\eta+\mathrm{i}w, \mathrm{z}\}| = o(|w|^{-\varepsilon})$
as
 $|w|\rightarrow\infty$
.
Note that
 $-\{1-\mathcal{F}(\mathrm{z})\}/\hat{r}(\mathrm{z})>0$
for all z and has a removable singularity at
 $\mathrm{z}=1$
; thus
 $\mathcal{\hat{P}}_{x}(\mathrm{z})>0$
for all z. As
 $\mathrm{z}\rightarrow1$
, then
 $\hat{r}^{\prime}(\mathrm{z})\rightarrow\mu/\rho$
and, by l’Hôpital’s rule,
 $\mathcal{\hat{P}}_{x}(\mathrm{z})\rightarrow1$
. The condition
 $\mathcal{Z}$
placed on
 $\mathcal{H}_{\mathrm{c}}(\mathrm{r},\mathrm{z})$
is extremely weak and holds for all the practical joint distributions found in [Reference Johnson, Kotz and Balakrishnan9].
Example 12. (Reward as an interarrival random walk.) Suppose each tick of the clock returns a continuous reward that has MGF
 $\mathcal{G}_{0}(\mathrm{r})$
and which is awarded at the end of the interarrival. The mixed MGF-PGF for (R, F) is
 $\mathcal{H}_{\mathrm{c}}(\mathrm{r},\mathrm{z})=\mathcal{F}\{\mathrm{z}\mathcal{G}_{0}(\mathrm{r})\}$
, and is defined over
 $\{(\mathrm{r},\mathrm{z})\in\mathbb{R}\times[0,\infty)\,:\, \mathrm{z}\mathcal{G}_{0}(\mathrm{r})<\mathfrak{r},\ \mathrm{r}<b_{0}\}$
, where
 $b_{0}>0$
is the convergence bound of
 $\mathcal{G}_{0}$
.
The residue approximation for
 $\mathcal{R}_{n}(\mathrm{r})$
, the MGF of reward at time n, is
 \begin{equation} \mathcal{\hat{R}}_{\mathrm{c}n}(\mathrm{r}) = \mathcal{G}_{0}(\mathrm{r})^{n}\frac{\mathcal{F}_{S}\{1/\mathcal{G}_{0}(\mathrm{r})\}}{\mu}, \quad \mathcal{G}_{0}^{-1}(1/\mathfrak{r})<\mathrm{r}<b_{0}. \end{equation}
This follows from the fact that
 $\hat{z}_{\mathrm{c}}(\mathrm{r})=1/\mathcal{G}_{0}(\mathrm{r})$
and
 $\mathcal{H}_{\mathrm{c}\mathrm{z}}^{\prime}\{\mathrm{r},\hat{z}_{\mathrm{c}}(\mathrm{r})\} = \mathcal{F}^{\prime}(1)\mathcal{G}_{0}(\mathrm{r})$
.
The residue approximation for
 $\mathcal{P}_{x}(\mathrm{z})$
, the PGF of the first-passage time to reward x, is
 \begin{equation*} \mathcal{\hat{P}}_{x}(\mathrm{z}) = {\mathrm{e}}^{\hat{r}(\mathrm{z})x}\frac{1-\mathcal{F}(\mathrm{z})} {-\hat{r}(\mathrm{z})\mu\mathrm{z}\mathcal{G}^{\prime}_{0}\{-\hat{r}(\mathrm{z})\}}, \quad \mathrm{z}<\mathfrak{r}, \end{equation*}
where
 $-\hat{r}(\mathrm{z})=\mathcal{G}_{0}^{-1}(1/\mathrm{z})$
and
 $\mathcal{H}^{\prime}_{\mathrm{c}\mathrm{r}}\{-\hat{r}(\mathrm{z}),\mathrm{z}\} = \mathcal{F}^{\prime}(1)\mathrm{z}\mathcal{G}^{\prime}_{0}\{-\hat{r}(\mathrm{z})\}$
has been used.
Example 13. (Reward as an interarrival random walk.) Suppose each tick of the clock returns an inverse Gaussian(2, 4) reward with mean 2, variance 2, and MGF
 $\mathcal{G}_{0}(\mathrm{r})=$
 $\exp(2-2\sqrt{1-2\mathrm{r}})$
. Then, R given
 $F=n$
is inverse Gaussian
 $(2n,4n^{2})$
with MGF
 $\mathcal{G}_{0}(\mathrm{r})^{n}$
. Taking
 \begin{align*}\mathcal{F}(\mathrm{z})=\frac{\mathrm{z}/3}{(1-2\mathrm{z}/3)}\end{align*}
with
 $\mu=3$
and
 $\mathbb{V}\{F\}=6$
, then
 \begin{equation} \mathcal{H}_{\mathrm{c}}(\mathrm{r},\mathrm{z}) = \frac{(\mathrm{z}/3){\mathrm{e}}^{2-2\sqrt{1-2\mathrm{r}}}}{1-(2\mathrm{z}/3){\mathrm{e}}^{2-2\sqrt{1-2\mathrm{r}}}}, \end{equation}
and
 $\rho=\mathbb{E}\{R\}=6$
,
 $\mathbb{V}\{R\}=30$
. The residue approximation for the MGF of R(n), the reward at time n, has
 $\hat{z}(\mathrm{r})=1/\mathcal{G}_{0}(\mathrm{r})$
so that (31) is
 \begin{align*} \mathcal{\hat{R}}_{\mathrm{c}n}(\mathrm{r}) = \mathcal{G}_{0}(\mathrm{r})^{n+1}\frac{1}{3\mathcal{G}_{0}(\mathrm{r})-2}, \quad-0.223<\mathrm{r}<\frac12. \end{align*}
For
 $n=10$
we are able to compute the exact MGF of R(10) as
 $\mathcal{R}_{10}(\mathrm{r})=[\mathrm{z}^{10}]\mathcal{R}_{\mathrm{c}}(\mathrm{r},\mathrm{z})$
, which is obtained by symbolically computing
 $\big(\partial^{10}\mathcal{R}_{\mathrm{c}}(\mathrm{r},\mathrm{z})/\partial\mathrm{z}^{10}\big|_{\mathrm{z}=0}\big)/10!$
. From this, we compute the exact mean and variance as
 $16.07$
and
 $37.15$
. We remove the point mass of
 $\big(\frac23\big)^{-10}$
at 0 and work with the conditional MGF of R(10) given
 $R(10)>0$
of the form
 $\mathcal{R}_{10+}(\mathrm{r}) = \big\{\mathcal{R}_{10}(\mathrm{r})-\big(\frac23\big)^{-10}\big\}/\big\{1-\big(\frac23\big)^{-10}\big\}$
.
Figure 7 compares three strategies for approximating the survival function of R(10). The solid line is
 $\big\{1-\big(\frac23\big)^{-10}\big\}$
times the single-saddlepoint approximation applied using the CGF
 $\ln\mathcal{R}_{10+}(\mathrm{r})$
. The red dashed line is the single-saddlepoint approximation applied to
 $\ln\mathcal{\hat{R}}_{\mathrm{c},10}(\mathrm{r})$
. The dotted line is a Normal(16,20) approximation based on the moment approximations of Corollary 2. The normal approximation performs badly since the variance expansion value of 20 is quite far from the true variance,
 $37.15$
. The right panel plots the percentage relative error of the saddlepoint approximation using
 $\mathcal{\hat{R}}_{\mathrm{c},10}(\mathrm{r})$
and taking the saddlepoint approximation based on
 $\mathcal{R}_{10+}(\mathrm{r})$
as the standard. What this plot shows is that little is lost in applying a saddlepoint approximation to the residue approximation as opposed to the exact MGF
 $\mathcal{R}_{10+}(\mathrm{r})$
.
Left: Approximations for the survival function of R(10) using single-saddlepoint inversion of
 $\mathcal{R}_{10+}(\mathrm{r})$
(solid black line), single-saddlepoint inversion of
 $\mathcal{\hat{R}}_{\mathrm{c},10}(\mathrm{r})$
(dashed red line), and a Normal(16, 20) approximation (dotted line). Right: Plot of percentage relative errors respecting the tails for inversion using
 $\mathcal{\hat{R}}_{\mathrm{c},10}(\mathrm{r})$
as compared with inversion using
 $\mathcal{R}_{10+}(\mathrm{r})$
.

Example 14. (Reward as an interarrival random walk.) In the context of Example 13, we assess the approximation to the PGF for the first-passage time
 $P_{x}$
given in Theorem 5. With a threshold of
 $x=15$
, the moments of
 $P_{x}$
are approximated as in Corollary 9 as
 $\mathbb{E}\{P_{15}\}=10.25$
and
 $\mathbb{V}\{P_{15}\}=3.75$
. The dominant pole for
 $\mathcal{\hat{P}}_{x}(\mathrm{z})$
in (30) is the real solution in r to
 \begin{equation} 1 = \mathrm{z}\mathcal{G}_{0}(\mathrm{r}) = \mathrm{z}\exp(2-2\sqrt{(1+2\mathrm{r})}) \end{equation}
or
 $\hat{r}(\mathrm{z})=\frac{1}{2}\ln\mathrm{z}+\frac{1}{8}(\!\ln\mathrm{z})^{2}$
. Since the exponential is a multi-function, there are also pairs of complex-conjugate solutions to (33) given as
 \begin{equation} \hat{r}_{\pm k}(\mathrm{z}) = \bigg\{\frac{1}{2}\ln\mathrm{z} + \frac{1}{8}(\ln\mathrm{z})^{2} - \frac{\pi^{2}k^{2}}{2}\bigg\} \pm \mathrm{i}\pi k\bigg(1+\frac{\ln\mathrm{z}}{2}\bigg), \quad k\geq1. \end{equation}
These roots form additional simple poles which are ignored when using the approximation
 $\mathcal{\hat{P}}_{x}(\mathrm{z})$
but could be added to the expansion for greater accuracy, as described in [Reference Borovkov and Rogozin2, Section 2.3]. The dominant pole leads to the approximation
 \begin{align*} \mathcal{\hat{P}}_{x}({\mathrm{e}}^{\mathrm{r}}) = {\mathrm{e}}^{x(\mathrm{r}/2+\mathrm{r}^{2}/8)}\frac{({\mathrm{e}}^{\mathrm{r}}-1)\big(1+\frac{1}{2}\mathrm{r}\big)} {(1-2/3{\mathrm{e}}^{\mathrm{r}})(3\mathrm{r})\big(1+\frac{1}{4}\mathrm{r}\big)}, \quad -2<\mathrm{r}<\ln\tfrac{2}{3}=0.405. \end{align*}
The value
 $\mathcal{\hat{P}}_{x}(1)=1$
holds by l’Hôpital’s rule. Moment computations from this expression give an approximate mean of
 $10.25$
and variance of
 $9.646$
, with the variance quite different from the expansion value of
 $3.75$
.
Figure 8 shows smooth plots for the two continuity-corrected single-saddlepoint survival approximations depicted in solid red and dashed blue which are visually coincident. A continuity-corrected Normal
 $(10.25,3.75)$
is shown as a dotted line.
For
 $\mathcal{\hat{P}}_{x}({\mathrm{e}}^{\mathrm{r}})$
to be a valid approximation to
 $\mathcal{P}_{x}({\mathrm{e}}^{\mathrm{r}})$
, the conditions of Theorem 5 must hold for this example. Condition
 $\mathcal{Z}$
is shown to hold in the Supplementary Material.
To assess the accuracy of the approximations in Figure 8, we consider the exact MGF
 $\mathcal{P}_{x}({\mathrm{e}}^{\mathrm{r}})$
. When the additional residue expansion terms from all the poles given in (34) are added up to approximate
 $\mathcal{P}_{x}({\mathrm{e}}^{\mathrm{r}})$
, then we show in the Supplementary Material using a non-trivial argument that this infinite sum converges pointwise to the exact MGF
 $\mathcal{P}_{x}({\mathrm{e}}^{\mathrm{r}})$
. This development is based on [Reference Borovkov and Rogozin2, Corollary 2.2], which specifies when such infinite residue expansions are pointwise convergent to the exact values they approximate.
Two continuity-corrected single-saddlepoint approximations (solid red and dashed blue lines) for the survival function of
 $P_{15}$
are compared with a continuity-corrected Normal
 $(10.25,3.75)$
approximation (dotted line).

The order of the various residue terms which contribute in this infinite expansion reveal that
 $\mathcal{\hat{P}}_{x}({\mathrm{e}}^{\mathrm{r}})$
and
 $\mathcal{P}_{x}({\mathrm{e}}^{\mathrm{r}})$
are computationally in agreement to 16-significant-digit accuracy or the accuracy capable when using 64-bit floating-point arithmetic. As a consequence, saddlepoint approximation using
 $\mathcal{\hat{P}}_{x}({\mathrm{e}}^{\mathrm{r}})$
is indistinguishable from the same computations using the exact MGF
 $\mathcal{P}_{x}({\mathrm{e}}^{\mathrm{r}})$
. Let
 $\mathcal{\hat{E}}_{k}({\mathrm{e}}^{\mathrm{r}})$
denote the additive contribution to the infinite residue expansion from the complex conjugate pair of poles
 $\hat{r}_{k}(\mathrm{z})$
and
 $\hat{r}_{-k}(\mathrm{z})$
. Figure 9 in the Supplementary Material plots
 $10^{32}\mathcal{\hat{E}}_{1}({\mathrm{e}}^{\mathrm{r}})/\mathcal{\hat{P}}_{x}({\mathrm{e}}^{\mathrm{r}})$
against r, and we see that over the range of saddlepoints
 $({-}1.9,0.36)$
used in the approximation,
 \begin{align*} \max_{-1.9\leq\mathrm{r}\leq0.36}\frac{|\mathcal{\hat{E}}_{1}({\mathrm{e}}^{\mathrm{r}})|} {\mathcal{\hat{P}}_{x}({\mathrm{e}}^{\mathrm{r}})} < 5.7\times10^{-32}. \end{align*}
Likewise, the two derivatives of this ratio have similar size. This means that saddlepoint computations based on
 $\mathcal{\hat{P}}_{x}({\mathrm{e}}^{\mathrm{r}})$
and
 $\mathcal{\hat{P}}_{x}({\mathrm{e}}^{\mathrm{r}})+\mathcal{\hat{E}}_{1}({\mathrm{e}}^{\mathrm{r}})$
are computationally indistinguishable using 64-bit arithmetic. This is explained by the asymptotic orders of the various terms. For example, in the left tail where the error is the greatest at
 $\mathrm{r}=-1.9$
, the ratio of exponential factors in the residue terms for poles at
 $\hat{r}_{\pm k}$
versus the dominant pole
 $\mathrm{r}/2+\mathrm{r}^{2}/8$
are
 \begin{align*} \exp\big[x\operatorname{Re}\{\hat{r}_{\pm1}({\mathrm{e}}^{\mathrm{r}})\} - x(\mathrm{r}/2+\mathrm{r}^{2}/8)\big]_{\mathrm{r}=-1.9} & = 7.1\times10^{-33}, \\ \exp\big[x\operatorname{Re}\{\hat{r}_{\pm2}({\mathrm{e}}^{\mathrm{r}})\} - x(\mathrm{r}/2+\mathrm{r}^{2}/8)\big]_{\mathrm{r}=-1.9} & = 2.6\times10^{-129}. \end{align*}
The contributions from
 $\mathcal{\hat{E}}_{3}({\mathrm{e}}^{\mathrm{r}})$
, etc. are even smaller. Thus we see that
 $\mathcal{\hat{P}}_{x}({\mathrm{e}}^{\mathrm{r}})$
and
 $\mathcal{P}_{x}({\mathrm{e}}^{\mathrm{r}})$
are indistinguishable in floating-point computation and the errors in the saddlepoint approximations of Figure 8 are only due to the saddlepoint methods themselves and not due to using an approximation for
 $\mathcal{P}_{x}({\mathrm{e}}^{\mathrm{r}})$
.
In Example 14, there are multiple poles involved in the residue expansion. However, the pole at
 $\hat{r}(\mathrm{z})$
is dominant enough that its single-term residue expansion
 $\mathcal{\hat{P}}_{x}(\mathrm{z})$
is computationally indistinguishable from the exact PGF
 $\mathcal{P}_{x}(\mathrm{z})$
. This is not always the case. Examples 15 and 16 in the Supplementary Material replace the inverse Gaussian reward distribution for
 $\mathcal{G}_{0}(\mathrm{r})$
with a Gamma(2,1) distribution. For the first passage in Example 16, there are two real solutions to
 $1=\mathrm{z}\mathcal{G}_{0}(\mathrm{r})$
in r which result in two poles. Using
 $\mathcal{\hat{P}}_{x}(\mathrm{z})$
based on only the dominant pole does not provide adequate approximation to the exact PGF, and in fact
 $\mathcal{\hat{P}}_{x}(\mathrm{z})$
is not even analytic at
 $\mathrm{z}=0$
as it needs to be if it is to be a PGF.
Examples 14 and 16 suggest that residue expansions such as
 $\mathcal{\hat{P}}_{x}(\mathrm{z})$
should not be used blindly as a surrogate for
 $\mathcal{P}_{x}(\mathrm{z})$
. The degree of dominance shown by the dominant pole depends on the spacing of the various poles for
 $\mathcal{P}_{\mathrm{c}}(\mathrm{r},\mathrm{z})$
, and without adequate dominance, additional residue terms may be required.
Acknowledgements
The author is grateful to a referee who provided important historical references for the use of saddlepoint approximations in this context.
Funding information
There are no funding bodies to thank relating to the creation of this article.
Competing interests
There were no competing interests to declare which arose during the preparation or publication process of this article.
Supplementary material
The supplementary material for this article can be found at http://doi.org/10.1017/jpr.2024.99.