Implications
Given that feed accounts for the single largest input cost in milk production systems, scientists focus on a heritable indicator of feed efficiency – residual feed intake (RFI), and try to identify more efficient cows (low RFI) without the need for expensive intake measurement. This study provided experimental evidence indicating that protein metabolism and fat mobilization were responsible for important parts of the variation among dairy cattle in RFI. The results showed that feeding behaviors, milk protein percentage, urea nitrogen and serum levels of leptin and neuropeptide Y, were significantly different between low and high RFI cows. In addition, these findings may be useful for understanding the consequences of selective breeding for cows with reduced RFI.
Introduction
Feed inputs represent the largest variable cost in milk production (Connor et al., Reference Connor, Hutchison, Norman, Olson, Van Tassell, Leith and Baldwin2011). Selection for reduced feed inputs independent of output traits could enhance efficiency of feed utilization and substantially improve profitability. Traditionally, feed conversion efficiency is expressed as a gain : feed ratio. However, an animal in different rearing conditions will show different gain : feed ratios. These results may be misleading in selective breeding programs (Carstens et al., Reference Carstens, Welsh, Randel, Holloway, Forrest and Keisler2003). Residual feed intake (RFI), first proposed as an alternate measure of feed efficiency by Koch et al. (Reference Koch, Swiger, Chambers and Gregory1963), is calculated as the difference between actual and expected feed intake required to support maintenance and production (e.g. growth in beef cattle, or milk in dairy cattle) (Connor et al., Reference Connor, Hutchison, Norman, Olson, Van Tassell, Leith and Baldwin2011). It is expected to be a heritable indicator of metabolism-related differences among animals rather than of differences in production (Crews, Reference Crews2005). Reported heritability estimates for RFI in lactating dairy cattle have ranged from 0.01 to 0.38 (Van Arendonk et al., Reference Van Arendonk, Nieuwhof, Vos and Korver1991; Connor et al., Reference Connor, Hutchison, Norman, Olson, Van Tassell, Leith and Baldwin2011), indicating that RFI is meaningful for selective breeding.
Beef cattle selected for low RFI have decreased feed costs. Baker et al. (Reference Baker, Szasz, Klein, Kuber, Hunt, Glaze, Falk, Richard, Miller, Battaglia and Hill2006) reported that low RFI Angus steers consumed less dry matter (DM) when compared with high RFI steers. Herd and Bishop (Reference Herd and Bishop2000) and Nkrumah et al. (Reference Nkrumah, Crews, Basarab, Price, Okine, Wang, Li and Moore2007) also found that selecting low RFI phenotypes would reduce feeding costs. Although few studies have estimated RFI in lactating dairy cattle, primarily due to a lack of availability of individual feed intake measurements, limited studies showed that lactating dairy cattle with low RFI also have strong competitive advantages in production (Lopez-Villalobos et al., Reference Lopez-Villalobos, Berry, Horan, Buckley, Kennedy, O’Donovan, Shalloo and Dillon2008). Connor et al. (Reference Connor, Hutchison, Norman, Olson, Van Tassell, Leith and Baldwin2011 and Reference Connor, Hutchison, Olson and Norman2013) reported that substantial variations have been observed among cows with different RFI, including differences in DMI, feeding behaviors and fertility measures.
The biological reasons underlying the observed variation in RFI have always been of interest. Kelly et al. (Reference Kelly, McGee, Crews, Fahey, Wylie and Kenny2010a) reported that feeding behavior traits, carcass composition measures, and circulating blood metabolites contributed to ~35% of the variation in RFI. Their subsequent study also indicated that insulin explained a significant proportion of variation in RFI (Kelly et al., Reference Kelly, McGee, Crews, Sweeney, Boland and Kenny2010b). Moore et al. (Reference Moore, Johnston, Graser and Herd2005) and Johnston et al. (Reference Johnston, Herd, Reverter and Oddy2001) demonstrated that IGF-1 was genetically correlated (0.31 to 0.56) with RFI. Therefore, the present study evaluated body size, milk production performance, feeding behavior and serum metabolites of Holstein cows divergent in RFI in order to explore contributing factors to variations in RFI.
Material and methods
Animals and management
A trial was conducted from September to November 2013 at the Taizhou Dairy Farm of the WEIGANG Milk Industry Group Company of Nanjing, in Jiangsu Province, China. The total number of unique animals represented in the complete dataset was 84 (12 first-lactation heifers, 32 second-lactation cows and 40 cows in their third or greater lactation; their days in milk (DIM) ranged from 93 to 152 days). These cows were also used in analyses requiring pedigree information. In this group of 84 cows, 26 sires were represented (with one to five daughters per bull, and 13 sires represented by a single offspring). A total of 29 maternal grandsires were represented with one to six granddaughters represented. Two cows had unidentified maternal grandsires. The pedigree was traced back in the national dairy cattle genetic evaluation database until it terminated with unknown ancestors (provided by the National Quality Test Center of Cattle Frozen Semen in Jiangsu, Nanjing, China). From the total of 84 animals, 29 lactating Holstein cows were selected based on their RFI following feedlot tests. Selected cows were ranked into high RFI (RFI>Mean+1 SD, n=14) and low RFI (RFI<Mean-1 SD, n=15). The ages of cows were recorded before the experiment (low v. high=2.87±0.29 v. 3.14±0.31 year, Means±SE). The DIM were also recorded (low v. high=128.20±6.16 v. 136.36±6.01 days). The trial lasted for 57 days in total. All cows were adapted to the experimental equipment by conducting a 7-day adaptation period before the 50-day formal trial.
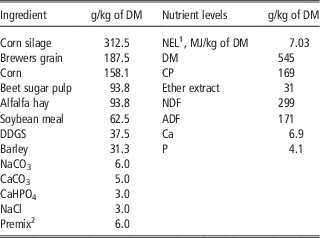
The cows in the trial were managed in a tie-stall configuration and were fed individually. They were fed total mixed rations and allowed free access to feed and water at all times. The composition of the experimental diets is given in Table 1. Feed intake was measured for each animal with feed bins (1.0 m length, 0.65 m wide and 0.5 m high). Daily feed offered and refused were measured (residual amount of feed ⩾5%). The cows were milked three times daily, at ~0730, 1430 and 2100 h. All procedures involving animals were approved by the Animal Research Ethics Committee of Nanjing Agriculture University.
Ingredient composition of the total mixed rations

DDGS=distillers dried grains with soluble; DM=dry matter.
1 NEL, net energy of lactation, estimated according to the NRC (2001) equations.
2 Premix per kg effective nutrition: vitamin A⩾600 KIU, vitamin D3⩾150 KIU, vitamin E⩾2000 IU, nicotinic acid⩾500 mg, Cu⩾1500 mg, Fe⩾1500 mg, Mn⩾1500 mg, Zn⩾7000 mg, I⩾90 mg, Se⩾50 mg, Co⩾20 mg.
Samples of the diet (~400 g, >1% of fresh feed) were taken randomly from five locations weekly and mixed for analysis. DM was determined by oven drying at 106°C for a minimum of 12 h. Ash was determined on all materials after ignition of a known weight of ground material in a muffle furnace (Nabertherm, Bremen, Germany) at 550°C for 4 h. The NDF and ADF concentrations of feed were obtained using an Ankom 200 Fiber Analyzer (Ankom Technology, Fairport, NY, USA). The CP was determined using a Leco FP 528 N Analyzer (Leco Instruments, UK Ltd., Stockport, Cheshire, UK). Ether extract was analyzed using a Soxtec instrument (Tecator, Höganäs, Sweden). The calcium and phosphorus concentrations of feed were obtained using inductively coupled plasma mass spectrometry (OPTIMA 2100DV, PerkinElmer Co., Waltham, MA, USA).
Residual feed intake
RFI was calculated after the adaptation period, and the animals were grouped into high and low RFI based on comparisons of the calculated RFI values. The amounts of feed offered and refusal were measured daily, and the feed intake was calculated by difference. Connor et al. (Reference Connor, Hutchison, Olson and Norman2013) defined RFI as the residuals from a regression model that regressed daily dry matter intake (DMI) on parity, metabolic BW, change in BW and energy-corrected milk yield. In the present study, each animal’s RFI (kg/day) was computed using the actual feed intake (kg/day) minus the expected feed intake (EFI, kg/day). A regression model was used to predict the EFI as an unknown dependent variable, given the values of the independent variables, included 4% FCM (4% fat-corrected milk yield, kg/day), BW0.75 (metabolic BW, kg), the average daily gain (ADG, kg/day), DIM (day) and age (year) and used the stepwise multiple linear regression analysis of SAS 9.2 (Institute Inc., Cary, NC, USA) (adapted from Van Arendonk et al., Reference Van Arendonk, Nieuwhof, Vos and Korver1991; Connor et al., Reference Connor, Hutchison, Olson and Norman2013). The original statistical model was:
 $$Y{\rm \,{\equals}}\,\beta {\rm 0{\plus}}\beta {\rm 1{\times}}X{\rm 1{\plus}}\beta {\rm 2{\times}}X{\rm 2{\plus}}\beta {\rm 3{\times}}X{\rm 3{\plus}}\beta {\rm 4{\times}}X{\rm 4{\plus}}\beta {\rm 5{\times}}X{\rm 5}$$
where Y was EFI, β0 was the equation intercept, β1, β2, β3, β4, β5 were the coefficients of the equation, X1 was the 4% FCM, X2 was the BW0.75, X3 was the ADG, X4 was the DIM, and X5 was the age. Based on the standard of P<0.05, independent variables, including 4% FCM (P<0.000), BW0.75 (P<0.000), ADG (P=0.02) and age (P=0.04), were selected by screening in the final regression model, and could explain 85% of the observed variation in EFI. DIM (P=0.96) was rejected by the regression analysis, because it had no significant effect on the model. Therefore, the best multitrait equation (R 2=0.85), taking collinearity among variables into account, was EFI=10.201+0.227×4%FCM+0.038× BW0.75–7.941× ADG+0.134× age.
The RFI averaged 0.0001 kg/day (n=84, SD=0.58) and ranged from −1.04 to +1.07 kg/day, representing a difference of 2.11 kg of feed DM per day between the least and most efficient animals. Supplementary Figure S1 summarizes the differences in actual and expected feed intakes of the cows (Supplemental materials). Of the 84 cows, 15 animals that showed lower RFI values (mean RFI= −0.84 kg/day, efficient) were assigned into the low RFI group. Fourteen animals with higher RFI values (mean RFI=+0.86 kg/day, inefficient) were assigned to the high RFI group.
Body measurements
Individual BW and chest girth were taken weekly at 0700 h immediately after the morning milking while animals were standing in a squeeze chute. Animals were weighed using an electronic domestic animal scale (Ani6708-hp, Nanjing Zhiheng Measuring Instruments Limited Company, Nanjing, China). Chest girths (cm) were defined as circumference of the perpendicular cross-section in the trailing edge of scapular blade and measured using a standard tape measure to the nearest 0.1 cm (Ozkaya and Bozkurt, Reference Ozkaya and Bozkurt2009). BW and chest girth were measured three times by the same observers and averaged. Individual predicted daily BW was estimated by fitting a non-linear model using the equation (SAS 9.2):
 $${\rm BW\,{\equals}}\,\alpha {\rm 0 {\plus}}\alpha {\rm 1{\times}DIM{\plus}}\alpha {\rm 2{\times}(DIM)}^{{\rm 2}} $$
where α0 is the intercept and α1, α2 the coefficients for linear and quadratic effects of DIM, respectively. Using the BW values, ADG was calculated by subtracting BW on the first day of available feed intake data from BW on the last day of available feed intake data and dividing by the number of days in the test period.
Feeding behaviors
During the experiment, 24 h feeding behaviors of all cows were recorded weekly using 20 high-definition surveillance cameras (ANNKE-C81A 960H, Shenzhen YINZHIJIE Technology Co. Ltd, Shenzhen, China) and a time-analysis software, which provided by the WEIGANG Milk Industry Group Company (Nanjing, Jiangsu, China). A total of 20 cameras had a night vision distance of 30 m and their resolution values reached at 1200 TVL. These high-definition surveillance cameras were mounted on structural beams of the barn 2.95 m above the ground using metal brackets. Basing on the locations of the cows in the test, the angle of cameras were adjusted so that each cow could be observed from two angles of left and right, avoiding a blind area when recording. The camera data was fed to two 10-channel multiplexer recorders (ANNKE), housed in a cabinet that provided forced air ventilation with filtration for dust. The data was stored at a 3 TB hard drive, viewed using WaveReader 3.0 S (GE Security, Corvallis, OR, USA) and calculated with a helper application (Timer plug-Ins, Shenzhen YINZHIJIE Technology Co. Ltd) for analysis weekly.
A head-down feeding event began when a cow already in her feed bin lowered her head to ingest feed and ended when the cow raised her head above the feed bin. A meal event duration was defined as the duration time for all head-down feeding events separated by <300 s, which includes head-down feeding duration and the time elapsed between head-down feeding events (Sowell et al., Reference Sowell, Bowman, Branine and Hubbert1998; Bingham et al., Reference Bingham, Friend, Lancaster and Carstens2014). Daily feeding duration (min/day) was computed as the sum of the duration for each individual meal event during 24 h. Eating rate (kg/min) was calculated as total DMI per day divided by daily feeding duration.
Milk analysis
Milk yields (kg/day) from all cows were recorded electronically daily during experimental period by an automatic milk meter (Alpro®, DeLaval, Tumba, Sweden). The 4% FCM (kg/day) was calculated using:
 $${\rm 4\,\%\,FCM (kg)\,{\equals}\,(0}{\rm .4{\plus}15 {\times} milk}\,{\rm fat}\,{\rm percentage){\times} milk}\,{\rm yield}$$
estimated according to Iwaniuk and Erdman (Reference Iwaniuk and Erdman2015) and Sklan et al. (Reference Sklan, Ashkenazi, Braun, Devorn and Tabori1992). Milk samples were obtained for analysis once per week by using composite pipeline milking samplers. The amount collected varied according to the time of day (20, 15 and 15 ml in the morning, afternoon, and evening, respectively). A total of 50 ml of each sample was mixed with potassium dichromate and kept at 4°C until compositions analysis. Milk compositions, including milk fat, protein, lactose, total solids, nonfat solids, milk urea nitrogen and somatic cell counts (SCC), were measured with an infrared milk analyzer (Foss Electric Ltd, Hillerød, Denmark).
Blood serum collection and analysis
Blood was sampled from all cows by jugular venipuncture in the morning, on day 1, day 25 and day 50 during the experimental period. Approximately 10 ml of blood were collected into an empty centrifuge tube (SHOUDE Biological Technology Limited Company, Nanjing, China). On collection, the samples were centrifuged 1500×g at 4°C for 15 min, and blood serum was collected and stored at −20°C for analysis of serum metabolites.
Similar with Kelly et al. (Reference Kelly, McGee, Crews, Sweeney, Boland and Kenny2010b), concentrations of β-hydroxybutyrate (β-BHA), non-esterified fatty acid (NEFA), and glucose were quantified by enzymatic colorimetry using an AV400 Clinical Analyzer (Olympus Diagnostics, Tokyo, Japan) and reagents supplied by Jiancheng Bioengineering Institute (Nanjing, China; catalog numbers TDX22, ZDX8 and F006). The test procedures were according to the instructions of each kit.
After an acid-ethanol extraction procedure, levels of serum growth hormone (GH), insulin, leptin, neuropeptide Y (NPY), prolactin and ghrelin were detected by radioimmunoassay using a fully automatic immune counter (r-911, Chinese University of Technology Industrial Corporation, China) and appropriate Iodine [125I] radioimmunoassay kits (Beijing NORTH Biological Technology Research Institute, Beijing, China) (as described by Hoefler and Hallford, Reference Hoefler and Hallford1987; Cutshaw et al., Reference Cutshaw, Hunter and Williams1992; Thomas et al., Reference Thomas, Amstalden, Hallford, Silver, Garcia and Keisler2009). The concentrations of serum IGF-1 and cholecystokinin-octopeptide were also quantified by radioimmunoassay with an immune counter (Sn-69513, Hesuo-Rihuan Photoelectric Instrument Limited Company, Shanghai, China) and appropriate Iodine [125I] radioimmunoassay kits (Beijing Kangyuan-Ruide Biotechnology Limited Company, Beijing, China) (as described by Spicer et al., Reference Spicer, Echternkamp, Canning and Hammond1988; Thomas et al., Reference Thomas, Amstalden, Hallford, Silver, Garcia and Keisler2009). All kits were designed theoretically for all animals serums (except rabbit), and validated specifically for use in human or bovine serums. All assays performed were according to manufacturer’s instructions and all serum samples were run in triplicate. Intra-assay coefficients of variation for the assays ranged from 4.4% to 8.7% (<10%) and corresponding inter-assay coefficients of variation ranged from 7.1% to 12.6% (<15%).
Statistical analysis
Data were analyzed using the MIXED procedure of SAS 9.2; the model included fixed effects of RFI group (high and low), stage (day 1, day 25 and day 50, for blood measurements) or week (1, 2, 3, 4, 5, 6 and 7, for measurements of milk samples and fodders samples), and random effects of cow and group×stage (or week). All interaction terms that were not significant for a trait (P>0.10) were dropped from the final model. Mean separation among RFI groups for different test traits was carried out by least squares in SAS. Measured means of BW, chest girth, DMI, milk yield, 4% FCM, daily feeding duration and eating rate for the entire experimental period were used in the Pearson Correlation analysis of SAS 9.2. Data were considered statistically significant when P<0.05.
Results
Body size, productivity, feeding behaviors and milk composition
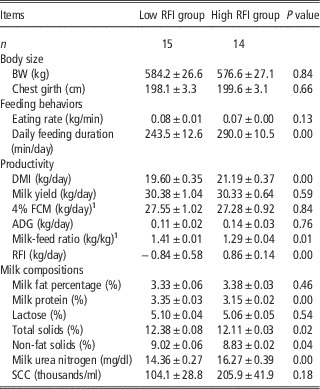
Table 2 shows the results of the comparative analysis of body size, productivity and feeding behaviors of the high and low RFI groups. The cows in the two RFI groups had no differences in body size. Daily feeding duration was shorter for the low RFI group than for the high RFI group. The mean difference between the two groups was 46.52 min (P<0.01). The low RFI group (more efficient) consumed 1.59 kg/day less DM than the high RFI group, and they produced nearly equal 4% FCM. The milk : feed ratio group was higher for the low RFI than for the high RFI group (P<0.05). Table 2 also shows the trend in the variation in the milk composition of the high and low RFI groups. Milk protein was higher and milk urea nitrogen was lower in the low RFI group compared with the high RFI group (P<0.01). Milk total solids and nonfat solids were higher in the low RFI group than in the high RFI group (P<0.05). We found no significant differences in milk fat, lactose or somatic cell counts between the two RFI groups (P>0.05).
Comparisons between different residual feed intake groups on body size, feeding behaviors, productivity and milk compositions of dairy cattle (mean±SE)

DMI=dry matter intake; 4% FCM=4% fat-corrected milk yield; ADG=the average daily gain; RFI=residual feed intake; SCC=somatic cell counts.
1 4% FCM (kg)=(0.4+15×milk fat percentage)×milk yield; Milk-feed ratio=4% FCM/DMI.
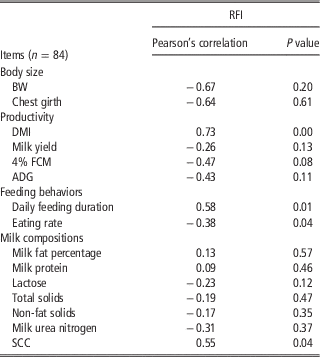
We compared correlations between the RFI value and BW, chest girth, DMI, milk yield, 4% FCM, daily feeding duration, eating rate and milk compositions. As shown in Table 3, we found that the RFI value was positively correlated with DMI (P<0.01). The RFI value was positively correlated with daily feeding duration (P=0.01), whereas it was negatively correlated with eating rate (P<0.05) between the low and high RFI groups. SCC correlated with the RFI values (P<0.05), while other composition factors showed no significance.
Correlation between residual feed intake and body size, feeding behaviors and productivity in dairy cattle

DMI=dry matter intake; 4% FCM=4% fat-corrected milk yield; ADG=the average daily gain; RFI=residual feed intake; SCC=somatic cell counts.
Serum metabolites
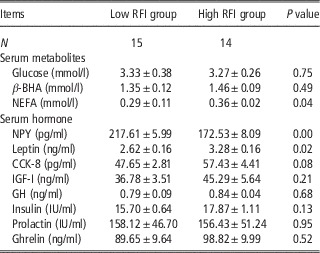
Table 4 shows the trend in the variation of serum metabolites (glucose, β-BHA, NEFA, NPY, leptin, cholecystokinin-octopeptide, prolactin, insulin, IGF-1, GH and ghrelin) in two RFI groups. The NPY levels were higher (P=0.001), while leptin levels were markedly lower (P=0.016) in the low RFI group. Cholecystokinin-octopeptide levels tended to be lower in the low RFI group (P=0.08). The NEFA levels were lower (P=0.04) in the low RFI group. We found no significant difference in levels of glucose, β-BHA, prolactin, insulin, IGF-1, GH or ghrelin (P>0.05) between the low and high RFI groups.
Comparison of serum metabolites of the two residual feed intake groups of dairy cattle (mean±SE)

β-BHA: β-Hydroxybutyrate; NEFA: non-esterified fatty acid; GH: growth hormone; NPY: neuropeptide Y; CCK-8: cholecystokinin-octopeptide; RFI: residual feed intake.
Discussion
Feed intake and body size between divergent RFI groups
Usually, the selection of cattle with low RFI decreased feed costs (Baker et al., Reference Baker, Szasz, Klein, Kuber, Hunt, Glaze, Falk, Richard, Miller, Battaglia and Hill2006; Kundu et al. Reference Kundu, Tho, Sharma and Sontakke2014). Williams et al. (Reference Williams, Pryce, Grainger, Wales, Linden, Porker and Hayes2011) found that Holstein–Friesian dairy heifers with the 10% lowest RFI ate 1.7 kg less DM each day than the 10% highest RFI ones to achieve the same rate of growth. Similarly, our results showed that the more efficient dairy cattle (the low RFI group) ate 1.59 kg less DM each day and produced nearly equal 4% FCM. Moreover, a positive correlation was observed between RFI and DMI. Likewise, another study of lactating cows by Connor et al. (Reference Connor, Hutchison, Olson and Norman2013) also reported that the mean DMI and metabolizable energy intake were significantly less in low-RFI than in high-RFI high-producing Holstein cows during the first 90 days of lactation, provided ad libitum access to a total mixed ration. Collectively, these findings confirm that, under ad libitum feeding, cows selected for low RFI consume less feed for a given milk yield, resulting in higher feed efficiency.
Feeding behaviors between divergent RFI groups
In the present study, cows in the low RFI group had shorter daily feeding durations and their RFI values were positively correlated with the daily feeding duration, with a remarkable correlation coefficient of 0.58. This finding was consistent with reported positive phenotypic or genetic correlations between RFI and daily feeding durations in lactating cows (Connor et al., Reference Connor, Hutchison, Olson and Norman2013), finishing beef cattle (Robinson and Oddy, Reference Robinson and Oddy2004), and growing beef cattle (Nkrumah et al., Reference Nkrumah, Crews, Basarab, Price, Okine, Wang, Li and Moore2007; Dobos and Herd, Reference Dobos and Herd2008). This evidence would help to explain a portion of the differences in RFI among animals. In addition, we also found a negative phenotypic correlation between eating rate and RFI, but no difference in eating rate with high- v. low-RFI. Likewise, no difference was reported in eating rate of growing bulls (Lancaster et al., Reference Lancaster, Carstens, Ribeiro, Tedeschi and Crews2009) and growing steers (Golden et al., Reference Golden, Kerley and Kolath2008) with high- v. low- RFI. On the contrary, Connor et al. (Reference Connor, Hutchison, Olson and Norman2013) found that low-RFI heifers and cows consumed feed at a slower rate than high-RFI animals, and a positive phenotypic correlation was detected between eating rate and RFI. The authors proposed that slower eating rates may contribute to increased DM digestibility in efficient animals. However, Kundu et al. (Reference Kundu, Tho, Sharma and Sontakke2014) found no difference in DM, organic matter, CP and ether extract digestibility between low and high RFI Murrah buffalo calves, nor did Cruz et al. (Reference Cruz, Rodríguez-Sánchez, Oltjen and Sainz2010) in a study of Angus×Hereford crossed steers. Obviously, there are conflicting reports on the relationship between eating rate and RFI. Moreover, we have observed that cows with low RFI have greater eating masticatory frequency (masticatory times per min during eating, times/min) and slower ruminating masticatory frequency (masticatory times per min during ruminating, times/min) than high RFI cows (unpublished data), which may provide new variables to evaluate differences between feeding behaviors and RFI. Additional study is warranted in this area of research.
Differences on milk composition between divergent RFI groups
Milk protein and milk urea nitrogen, as the end-products of the rumen nitrogen cycle, are important indicators of protein metabolism (Johnson and Young, Reference Johnson and Young2003). Measurements of milk urea nitrogen can be utilized as a diagnostic of N excretion and utilization efficiency in lactating dairy cows, and has a negative non-linear correlation with milk protein content (Jonker and Kohn, Reference Jonker and Kohn2001). Moreover, excretion of excess urea is an energy requiring process, and properly reducing of milk urea nitrogen can increase milk production (Garcia et al., Reference Garcia, Linn, Stewart, Olson and Olson1997). In the present study, higher milk protein and lower milk urea nitrogen levels were found in the low RFI group than in the high RFI group, indicating that the cows in the low RFI group might be more efficient in the synthesis of milk protein and expend less energy for N excretion in urea than in the high RFI group. Conversely, some studies of lactating dairy cattle on RFI found no differences between two divergent RFI groups for protein composition of the milk (Connor et al., Reference Connor, Hutchison, Olson and Norman2013; Macdonald et al., Reference Macdonald, Pryce, Spelman, Davis, Wales and Waghorn2014). Because their models for estimating RFI included milk protein composition, by design, this variable should not differ between RFI groups. Therefore, further analysis of relationships between RFI and mechanisms of milk protein synthesis are needed.
Although no significant differences in SCC were detected between high and low RFI cows, we found a positive phenotypic correlation between SCC and RFI, indicating that differences in SCC might partly explained variation observed in the efficiency of feed conversion to milk production among cows. Moreover, Hou et al. (Reference Hou, Bickhart, Chung, Hutchison, Norman, Connor and Liu2012) studied genetic differences between cows with high and low estimated breeding values for RFI and found that that more efficient cows exhibit copy number variations in genes associated with immunity and the inflammatory response, which could impact their ability to elicit a response to an immune challenge. Therefore, assuming that SCC is an indicator of mastitis susceptibility, this result supported the hypothesis that differences in susceptibility to mastitis exist between low- and high-RFI cows.
Differences on serum metabolites between divergent RFI groups
It is well known that hormonal regulation plays a key role in feed intake and energy metabolism (Maniam and Morris, Reference Maniam and Morris2012). In our study, we found no significant difference between the high and low RFI groups in levels of cholecystokinin-octopeptide, insulin, GH, prolactin, ghrelin or IGF-1. Evidence of a relationship between RFI values and cholecystokinin-octopeptide, GH, prolactin and ghrelin is lacking, but these hormones were not affected by RFI status in the present study.
However, the potential relationship of IGF-1 and RFI status is controversial. In accordance with the present findings, Kelly et al. (Reference Kelly, McGee, Crews, Fahey, Wylie and Kenny2010a) reported that systemic IGF-1 in yearling Limousin×Holstein–Friesian heifers was not related to RFI, as did Kundu et al. (Reference Kundu, Tho, Sharma and Sontakke2014). Conversely, IGF-1 was determined to be genetically correlated in a positive manner with RFI in growing bulls (Moore et al., Reference Moore, Johnston, Graser and Herd2005) and Nellore cattle (Nascimento et al., Reference Nascimento, Branco, Bonilha, Cyrillo, Negrão and Mercadante2015). The likely explanation for this inconsistency is that, in most studies to date in which IGF-I was correlated with RFI, the animals were measured at a young age shortly after weaning (Moore et al., Reference Moore, Johnston, Graser and Herd2005), animals were consuming a roughage-based diet (Brown, Reference Brown2005), and consequently, animals might be expected to have a greater rate of lean tissue gain and reduced carcass fatness. As cattle become more physiologically mature the genetic relationship between plasma IGF-I concentration and RFI became less positive (Johnston, Reference Johnston2007). Therefore, IGF-1 could be used as an indicator of feed utilization efficiency for growing animals, not for adult lactating dairy cattle.
In addition, the inconsistency also existed in the relationship between RFI and insulin, glucose metabolism. Kelly et al. (Reference Kelly, McGee, Crews, Sweeney, Boland and Kenny2010b) and Nascimento et al. (Reference Nascimento, Branco, Bonilha, Cyrillo, Negrão and Mercadante2015) found that insulin may affect feed efficiency, but we found no changes when we examined measures related to glucose metabolism, such as glucose and insulin, which might be related to a decrease in insulin sensitivity in muscle tissue of energetically inefficient animals (Richardson et al., Reference Richardson, Herd, Archer and Arthur2004; Brown, 2005). Considering variability of insulin sensitivity, we do not suggest the use of insulin or glucose as indicators of RFI.
Herd et al. (Reference Herd, Archer and Arthur2003) and Nkrumah et al. (Reference Nkrumah, Crews, Basarab, Price, Okine, Wang, Li and Moore2007) reported that cattle selected for low RFI had some reductions in various measures of carcass fat. Leptin is expressed predominantly in adipocytes and plasma concentrations of leptin are positively correlated with fat mass (Considine et al., Reference Considine, Sinha, Heiman, Kriauciunas, Stephens, Nyce, Ohannesian, Marco, McKee, Bauer and Caro1996). More importantly, leptin has been implicated with feed efficiency in cattle through studies that have observed associations between RFI and leptin expression (Nkrumah et al., Reference Nkrumah, Basarab, Price, Okine, Ammoura, Guercio, Hansen, Li, Benkel, Murdoch and Moore2004; Kelly et al., Reference Kelly, McGee, Crews, Fahey, Wylie and Kenny2010a). Consistent with their results, we found that that circulating leptin levels were significantly lower in the low RFI group than in the high RFI group in the present study. Taken together, these observations supported a close relationship between leptin and RFI in cattle.
Moreover, leptin can stimulate leptin receptors of the hypothalamus arcuate nucleus neurons by inducing follow-up cascade reactions and inhibiting the secretion of NPY (Collins et al., Reference Collins, Kuhn, Petro, Swick, Chrunyk and Surwit1996). In our study, serum NPY level was significantly higher in the low RFI group than in the high RFI group. Thus, we supposed that variation in RFI might be related to a change in NPY secretion caused by leptin. Indeed, in a previous study of Holstein cattle, we found that regulation of the adipokine signaling pathway, especially leptin-NPY axis, may affect RFI (Xi et al., Reference Xi, Yang, Wu, Han and Wang2015). We also found that serum LEP, LEPR, JAK1, STAT3 and SOCS3 mRNA were down-regulated and that NPY was up-regulated in the low RFI group using RT-PCR. One plausible explanation for our findings could be summarized by Higuchi et al. (Reference Higuchi, Hasegawa and Yamaguchi2005) as follows: Briefly, when body fat decreasing (low RFI animal), fat tissue secretes less leptin into the blood circulation, thereby reducing leptin levels passing through the blood-brain barrier into the hypothalamus. Less leptin unites with ob-Rb in the hypothalamus, weakening the Jak/STAT3/SOCS3 signaling pathway and accelerating the synthesis and secretion of NPY.
NEFA is an important energy substance in vivo and is a critical contributing factor to the incidence of glucose metabolic disorder and insulin resistance. Abnormalities in NEFA metabolism can sensitively reflect abnormal lipid metabolism and has a positive correlation with BW and the levels of carcass fat (Rhee et al., Reference Rhee, Paik and Kim2008). In our study, cows with low RFI had lower concentrations of NEFA (both high and low RFI groups had NEFA levels in the normal range), which may be related to reductions in carcass fat of low RFI cattle. Conversely, the previously published report of Kelly et al. (Reference Kelly, McGee, Crews, Sweeney, Boland and Kenny2010b) demonstrated that NEFA concentrations were unrelated (P>0.10) to intake, growth, or feed efficiency traits in finishing heifers. Notwithstanding this, the fatty acid metabolism in adult lactating dairy cattle was quite different from that in heifers and limited studies could examine the relationship between NEFA and RFI in dairy cattle; therefore, further research is needed to evaluate the biology of fatty acid metabolism in reference to RFI differences, especially in lactating cattle.
In conclusion, substantial differences were found in dairy cattle with differing RFI in several factors that might affect the efficiency of milk protein metabolism and fat mobilization, including DMI, daily feeding durations, milk protein percentage, urea nitrogen, and serum levels of leptin and NPY. These findings characterized the physiological differences between low and high RFI cows. In addition, these results also provided a basis for further research to better characterize the biological sources of variation in feed efficiency in dairy cattle. This will be useful for the efficient planning of breeding strategies to select cows that eat considerably less to achieve a similar level of milk production.
Acknowledgments
This research was supported by the National Natural Science Foundation of China No.31372290, the Science and Technology Sustentation Project of China (2011BAD28B02, 2012BAD12B00).
Supplementary material
To view supplementary material for this article, please visit http://dx.doi.org/10.1017/S1751731116000343.