1. INTRODUCTION
Maritime traffic has become increasingly busy over recent years resulting in frequent vessel collisions causing deaths and economic losses. Thus, this field has seen a subsequent increase in research (Li and Pang, Reference Li and Pang2013; Silveira et al., Reference Silveira, Teixeira and Guedes2013; Riveiro et al., Reference Riveiro, Pallotta and Vespe2018). Some reports have focused on the problems of risk analysis, such as the definition of risk and the decision-making process of risk avoidance (Rausand, Reference Rausand2013). To describe risk in the maritime domain, Kaplan (Reference Kaplan1997) quantified the severity of risk into three aspects, the scenario of risk, the probability and the frequency of risk and its consequences. In practice, vessel collision risk is often interpreted as a hidden variable, not as a reality in ship navigation data. This paper considers the risk consequences and divides collision risk into danger probabilities and possible consequences.
Several methods and analyses have been proposed for assessing the collision risk of ships in marine traffic. These describe studies of actual maritime transportation scenarios and are thus not constrained by the definition of risk. For example, Wilson et al. (Reference Wilson and Harris2003) proposed a navigation algorithm for two ships that allows the target ship to manoeuvre free of the collision if a collision risk exists. To analyse the navigational safety of the Singapore Strait, Qu et al. (Reference Qu, Meng and Suyi2011) raised three indices of vessel collision risk (speed, acceleration and number of overlapping fuzzing vessel domains) and Weng et al. (Reference Weng, Meng and Qu2012) concentrated on estimating vessel collision frequency. Based on a case study of the collision risk in the open waters of the Gulf of Finland, Goerlandt and Kujala (Reference Goerlandt and Kujala2014) conducted a quantitative risk assessment of reliability and effectiveness, including the numerical accuracy of the risk measures and the rank order of risk for each part of the system. By studying a collision and the likelihood of risk occurring, Montewka et al. (Reference Montewka, Goerlandt and Kujala2014a) introduced a scoring system to improve the practicability of the risk model. Using a systematic investigation for the collision risk parameters of a vessel pair, Zhang et al. (Reference Zhang, Kopca, Tang, Ma and Wang2017) evaluated and analysed the navigation risk of ships and the scope of ship safety in the narrow northern Baltic Sea. Wu et al. (Reference Wu, Mehta, Zaloom and Craig2016) used the Automatic Identification System (AIS) to identify a series of collision hot spots in the Sabine–Neches Waterway. Similarly, Critch et al. (Reference Critch, Goerlandt, Montewka and Kujala2013) and Przywarty et al. (Reference Przywarty, Gucma, Marcjan and Bąk2015) developed a reference of marine collision risks, particularly for busy, open water areas. Additionally, Goerlandt and Montewka (Reference Goerlandt and Montewka2015), and Hänninen et al. (Reference Hänninen, Mazaheri, Kujala, Montewka, Laaksonen, Salmiovirta and Klang2014) reported a risk analysis of maritime transportation systems in the Gulf of Finland.
Significant progress in risk analysis of marine collisions in open water areas has been made. However, there are still limitations highlighted in the literature, specifically the risk of multi-vessel collisions in particular areas. The complexity and importance of regional marine risk has attracted significant attention, leading to studies assessing the risk of multi-vessel collisions in complex and changeable ocean areas. Zhen et al. (Reference Zhen, Riveiro and Jin2017) proposed a framework for collision risk assessment by monitoring the spatial clustering process of ship encounter detection to test the effectiveness and efficiency of small areas under a multi-vessel collision risk model. Additionally, using the general requirements of the International Regulations for Prevention of Collisions at Sea (COLREGS), Zhang et al. (Reference Zhang, Zhang, Yan, Haugen and Soares2015a) employed a linear expansion algorithm to study multi-vessel collisions in a distributed and real-time manner by charting typical encounters with high-risk situations, which is useful in practice. Therefore, in order to further study the applicability of multiple ships as the research target within open water areas, we have developed a mathematical model that is able to quantify the risk of a near-miss collision within an open area. This method can determine the geographical distribution of multi-vessel collision risk by applying the model to dynamic AIS information. It must be noted that an open ocean area is defined in this paper as a limited area within the range of ship-borne radar. It is reasonable to consider the collision risk of vessels within six nautical miles (nm), which is a common observation range of a ship-borne radar in restricted coastal and open sea areas (Zhang et al., Reference Zhang, Goerlandt, Montewka and Kujala2015b).
Multi-vessel navigation information such as geographical location, speed and direction, provided by AIS, can support near-miss collision risk modelling and simulation in open water areas. Originally, the Vessel Conflict Ranking Operator (VCRO) model was used to assess the risk of a near-miss collision between two ships (Zhang et al., Reference Zhang, Goerlandt, Montewka and Kujala2015b), whereas traffic density complexity has been shown to reflect the geometrical density feature (Wen et al., Reference Wen, Huang, Zhou, Yang, Xiao and Wu2015; Geng et al., Reference Geng, Huang, Wen and Zhou2016). In this paper, the original VCRO reported by Zhang et al. (Reference Zhang, Goerlandt, Kujala and Wang2016) is improved by considering safety distance from both the viewpoints of the encountered ships and possible relative striking positions, and this new VCRO is named New Vessel Conflict Ranking Operator (NVCRO). Then, we show how the proposed mathematical model becomes an extension method of near-miss risk assessment to integrate both vessel conflict ranking operator and traffic density complexity. First, the Multi-Vessel Collision Risk Operator (MVCRO) is defined as a new model that is used in near-miss collision risk assessments of multiple vessels as an extension of NVCRO. Second, the regional Vessel Collision Risk Operator (RVCRO) model, a new near-miss collision risk assessment model of marine safety in a limited regional area, integrates the MVCRO and traffic density complexity. Utilising navigation data from the Baltic Sea, the proposed models are tested for severity of the near-miss collision risk and the possibility of multi-vessel conflicts in a limited area.
2. THE ASSESSMENT OF THE RISK OF REGIONAL VESSEL COLLISIONS
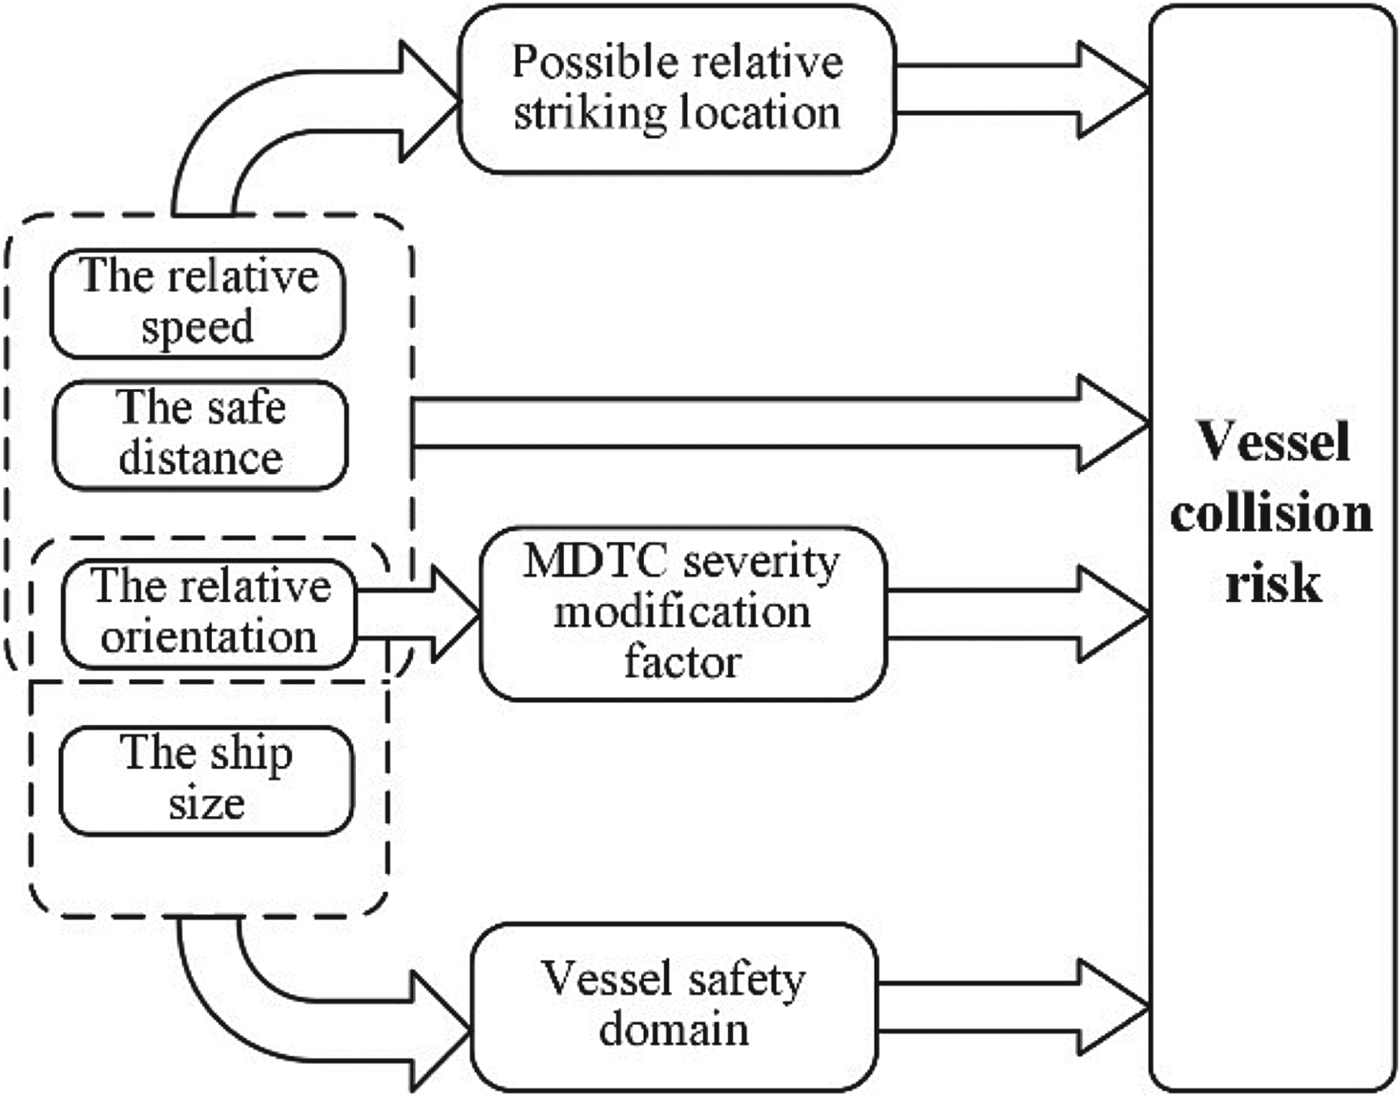
Figure 1 shows a regional vessel collision risk model, which is used to assess the severity of near-miss collision risk for vessels within 6 nm. To investigate the collision risk for an open area, two methods are used. First, the density complexity (Wen et al., Reference Wen, Huang, Zhou, Yang, Xiao and Wu2015; Masalonis et al., Reference Masalonis, Callaham and Wanke2003) is considered to estimate the traffic conditions, which has been previously applied to air traffic (Delahaye et al., Reference Delahaye, Paimblanc, Puechmorel, Histon and Hansman2002; Hilburn, Reference Hilburn2004). Second, to study the risk of a multi-vessel collision, the multi-vessel collision risk operator model is established. To make this model more readily understood, we propose a collision risk matrix and network, which can specify the relations of each of the two encountered vessels in open water areas. The NVCRO quantifies the effects of several factors, particularly the possible relative striking location (Montewka et al., Reference Montewka, Ehlers, Goerlandt, Hinz, Tabri and Kujala2014b), to illustrate the severity of the collision risk. This section comprises four parts: (1) defining the composition of the NVCRO mathematical model; (2) establishing the collision risk matrix; (3) establishing the regional risk network and (4) defining the regional collision risk for an open area.
A simplified model of a regional vessel collision risk assessment.

2.1. Defining the composition of the NVCRO mathematical model
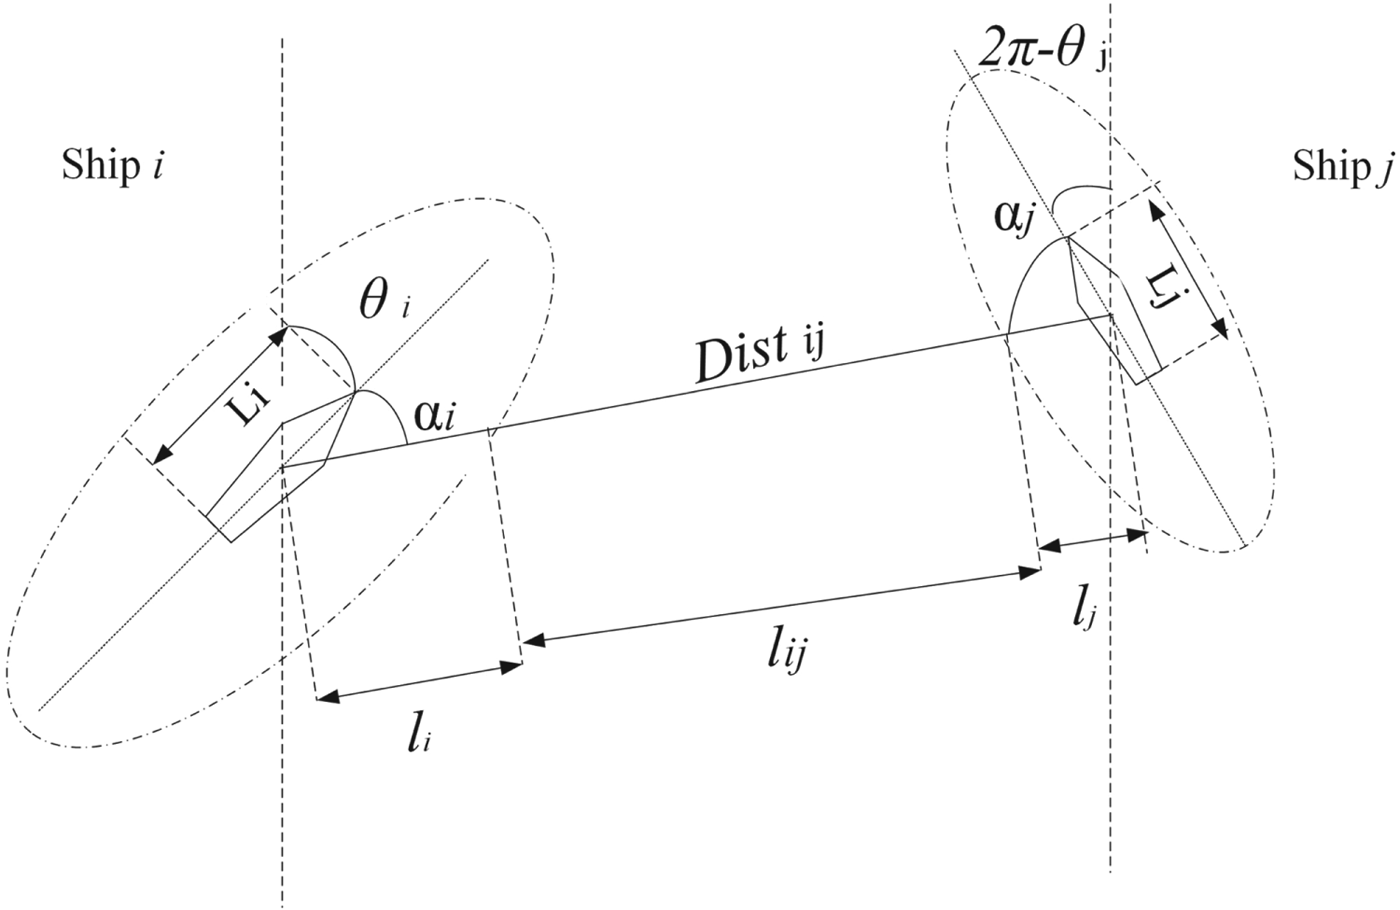
Maritime traffic conditions are recorded in AIS data, which includes time, longitude, latitude, speed, heading and the size and type of vessels (Figure 2). The mathematical model for NVCRO has a certain importance for the definition of the collision risk matrix and network which reflects the possibility and severity of the risk of collision between two vessels. Thus, in this paper, we take possible relative striking location and safety domain of the ships into consideration. The factors that affect the analysis of NVCRO are analysed as follows.
The basic factors of vessel collision risk and the construction of the NVCRO.

2.1.1. Safety distance between encountered vessels
This is the closest distance between the ships' safety domain boundaries. Previous studies have studied the safety domain boundary. Szlapczynski and Szlapczynska (Reference Szlapczynski and Szlapczynska2017) discussed a number of ship domains and considered their difference not only in size or shape but also in their purposes and definition. Wang et al. (Reference Wang, Meng, Xu and Wang2009) mentioned several approaches to measure the size of the safety domain, including ellipses, circles and polygons. This study investigates marine traffic in the Baltic Sea, an elliptical region mentioned by Yahei and Reijiro (Reference Yahei and Reijiro1971), due to the huge number of ships operating in this area with a wide variety of applications. Equations (1)–(3) are calculated based on the elliptical shape of the ship domain. If other shapes of ship domain are adopted, the following equations and results would need to be adapted accordingly.
The safety domain is usually proportional to ship size, which is defined as an area around a ship to be kept clear of other ships in order to avoid collisions (Wang and Chin, Reference Wang and Chin2016; Wang et al., Reference Wang, Meng, Xu and Wang2009). As shown in Figure 3, the safety distance l ij is the relative distance between the encountered ships' closest safety domain boundaries, which can be calculated by the following equations:
 $$\alpha_i =arccos\left(\displaystyle{{y_j-y_i}\over{\sqrt{\lpar x_j-x_i\rpar^2+\lpar y_j-y_i\rpar^2}}}\right)-\theta_i $$
 $$\alpha_j = \pi-\alpha_i-\theta_{ij} $$
 $$l_i = \sqrt{\displaystyle{{1+\tan^2\alpha_i}\over{\displaystyle{{1}\over{\lpar 1{\cdot}6L_i\rpar ^2}}+\displaystyle{{\tan^2\alpha_i}\over{\lpar 4L_i\rpar ^2}}}}} $$
 $$l_{ij} = Dist_{ij}-l_i-l_j $$
where α i is the angle between the sailing direction of ship i and the linking line between ship i and ship j. θ i is the angle between the sailing direction of ship i and longitude. (x i, y i) and (x j, y j) are the latitude and longitude coordinates of ship i and ship j, and Li and Lj are the lengths of ship i and ship j. Lij is the safe distance between ship i and ship j, and l i is the distance between ship i and ship j. The distance Dist ij between ship i and ship j is in the same direction of l i and l j, and furthermore, the calculation of these three distances are aligned with the direction of the link between geometric centres of both encountered ships i and j.
The safety distance and length of ship I and ship j.

2.1.2. Relative speed of the encountered vessels
The speed affects the foreseeable collision risk index, as described by Convertino and Valverde (Reference Convertino and Valverde2017) and You et al. (Reference You, Rhee, Park, Lee and Park2010).
2.1.3. Relative orientation of encountered vessels
In a mathematical model, the angle represents the relative heading of the bow of the two ships. Zhang et al. (Reference Zhang, Goerlandt, Montewka and Kujala2015b) defined the term ‘phase’ as positive or negative angles to imply that ships are converging (+ve) or diverging (-ve) from each other. This study uses the concept of Minimum Distance To Collision (MDTC) (Montewka et al., Reference Montewka, Hinz, Kujala and Matusiak2010), which is defined as the minimum safety distance to avoid a collision at different angles of intersection between vessels. Zhang et al. (Reference Zhang, Goerlandt, Kujala and Wang2016) fitted a MDTC curve, which allows a better distinction of the risk levels at various encounter angles. Under the different angles of intersection between ships, data from Montewka et al. (Reference Montewka, Hinz, Kujala and Matusiak2010) are adopted to describe the conflict severity. A larger MDTC indicates that a greater distance is necessary for a ship to manoeuvre to avoid collision. Zhang et al. (Reference Zhang, Goerlandt, Kujala and Wang2016) introduced C MDTC to measure the relationship between conflict severity and the intersection angle, which is formulated based on a Fourier series, as shown in Equation (5).
 $$C_{MDTC} \sim \sum_{k=1}^n {m_k \sin \lpar k\cdot \theta _{ij} \rpar } $$
where n is the expansion number of the Fourier series, θ ij is the intersecting angle of the two ships, and the Fourier expansion coefficient is m k. Equation (5) describes a sine series; the angle of θ ij in the range of (−π, 0) results in the two vessels diverging, whereas a positive value represents ships approaching.
2.1.4. Ship size
The length and width of a ship can be obtained from the AIS data. Generally, ship mass, which may be related to the consequences of a collision (Montewka et al., Reference Montewka, Ehlers, Goerlandt, Hinz, Tabri and Kujala2014b), can be roughly inferred from the ship size.
2.1.5. Possible relative striking location based on interval analysis
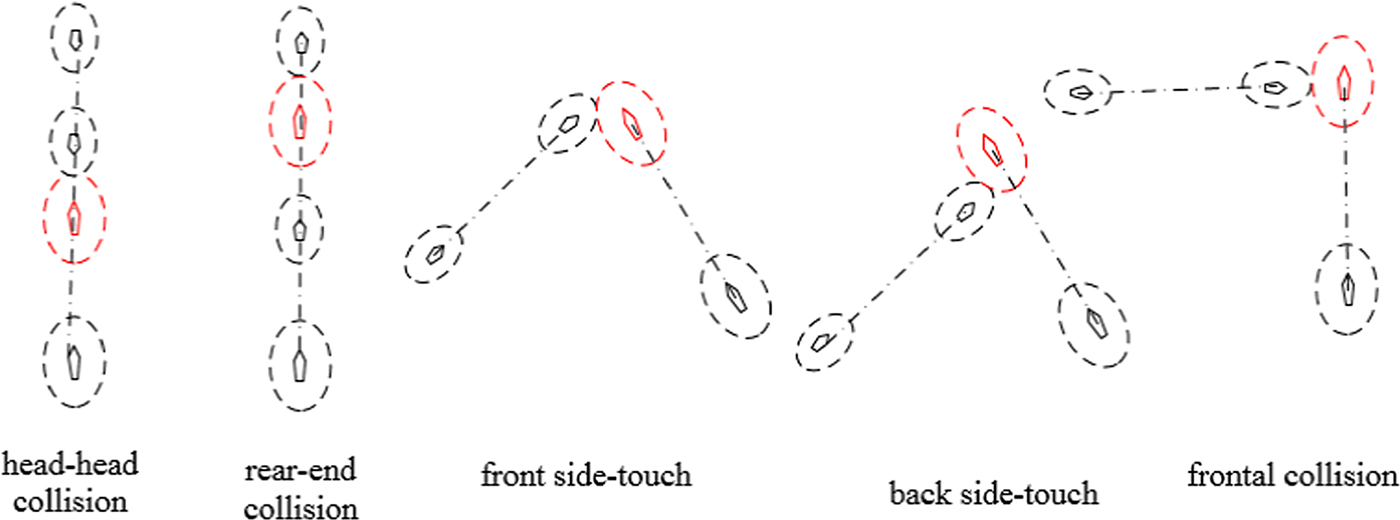
Based on interval analysis, the collision type of the target ship (red in Figure 4) is divided into five types: head-head collision, rear-end collision, front side-touch, back side-touch and frontal collision. Figure 4 shows these possible relative striking locations determined by interval analysis. The severity of damage from the different locations on the hull was assessed in Montewka et al. (Reference Montewka, Ehlers, Goerlandt, Hinz, Tabri and Kujala2014b). In this study, the possible relative striking location is further developed as an extension of the work of Montewka et al. (Reference Montewka, Ehlers, Goerlandt, Hinz, Tabri and Kujala2014b). Also, a possible violation of ship domain is used to replace the potential striking position of the hulls, which is easily handled during data processing and has an impact on collision avoidance decisions. To reflect the severity of the possible striking locations, the term ‘vessel rupture degree’ has been introduced, and the possibility of vessel rupture is one way to determine the degree of collision risk.
Five types of collision and possible relative striking positions for the target ship.

The possible consequences of the collision play an important role in risk assessment. A previous VCRO model (Zhang et al., Reference Zhang, Goerlandt, Kujala and Wang2016) did not take these possible consequences into account. Therefore, the relationship between possible consequences and the severity of the collision risk is established in this study, which considers the NVCRO and vessel rupture degree as shown in Equation (6). The vessel rupture degree is dependent on the possible striking location for a given length ratio.
 $$NVCRO_{j\to i}\sim f\lpar R_i\lpar S_i\comma \; \theta_{ij}\comma \; \sigma_{ij}\rpar \rpar $$
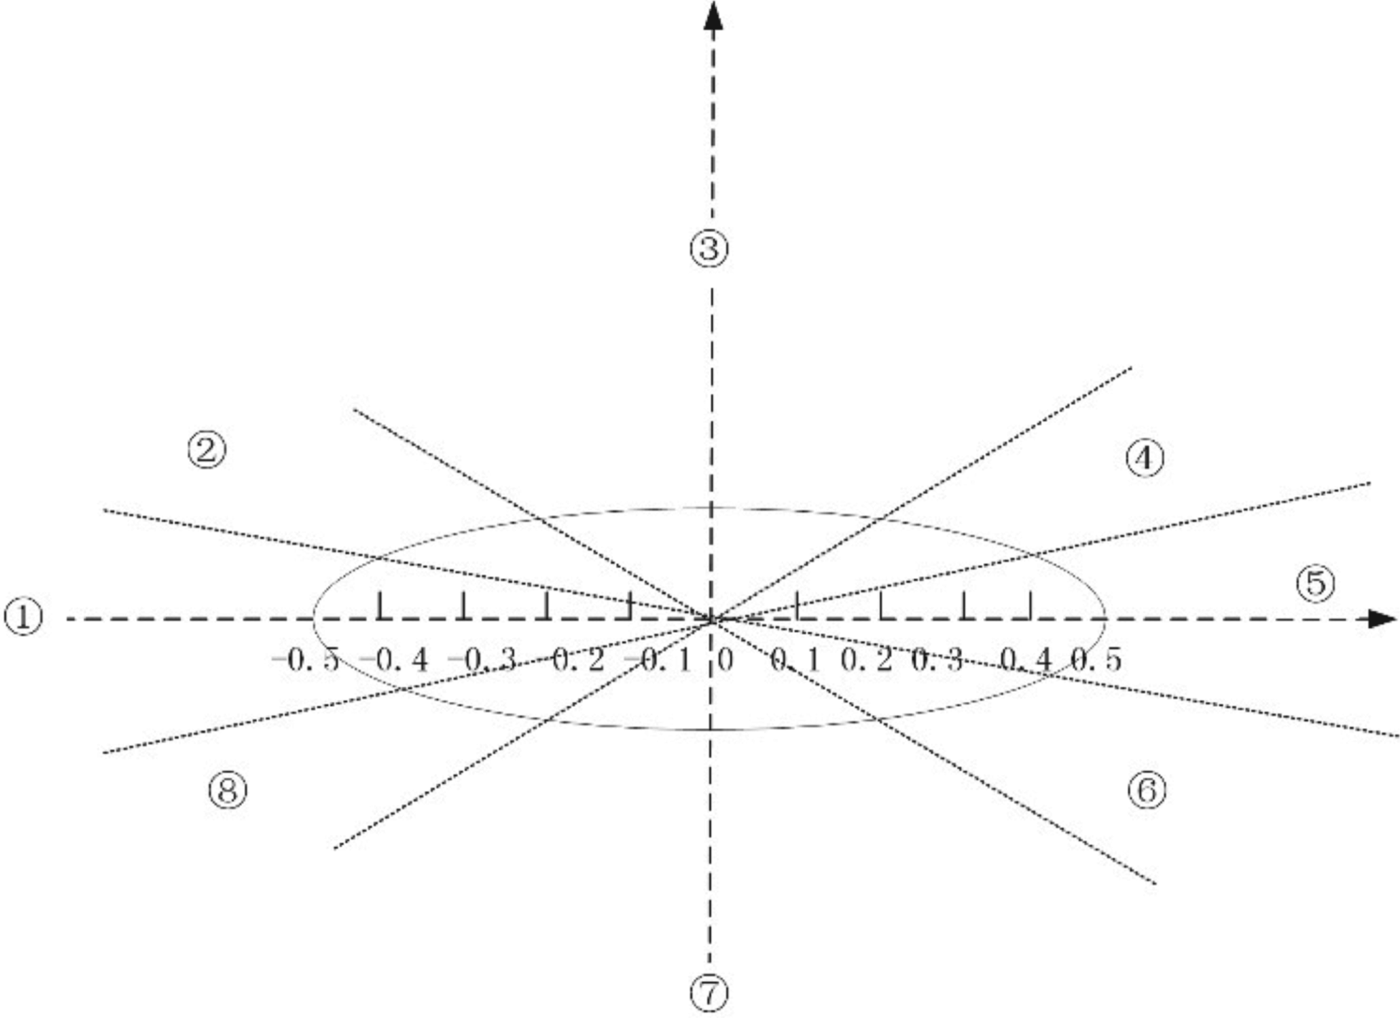
Due to the different safety domains and the possible relative striking positions, each vessel has a different NVCRO value. In this paper, NVCROj→i is the NVCRO value when ship i encounters ship j, where θ ij is the intersecting angle between two encountered ships, and σ ij is the length ratio of the two encountered ships. The possible relative striking location was modelled as a uniform distribution (Montewka et al., Reference Montewka, Ehlers, Goerlandt, Hinz, Tabri and Kujala2014b) ranging from −0·5 to 0·5 (Figure 5).
Possible relative striking location division of a vessel (Montewka et al., Reference Montewka, Ehlers, Goerlandt, Hinz, Tabri and Kujala2014b).

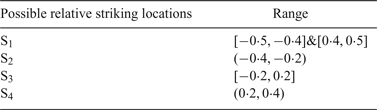
As shown in Figure 5, a head-head collision between ships results in the hull damage in ①, and a rear-end collision results in the hull being affected in ① and ⑤, respectively. Both are designated as scenario (S1). A back side-touch collision of the hull is ② or ⑧ (S2). Frontal collisions can occur in ③ or ⑦ (S3). The site of collision where the front of the hull was subjected to a side-touch is ④ or ⑥ (S4). Taking into account the possibility of the collision occurrence and a uniform distribution (Montewka et al., Reference Montewka, Ehlers, Goerlandt, Hinz, Tabri and Kujala2014b), the possible collision sites are of five types, and Si represents five types which include a head-head collision rear-end collision, front side-touch, back side-touch and frontal collision based on the relative locations as shown in Table 1.
Possible relative striking location divisions

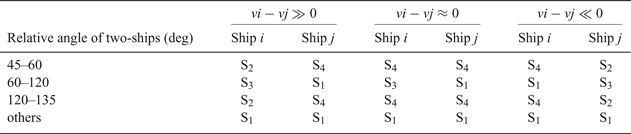
Interval analysis was used to determine the possible relative striking locations, and the sailing speed of the vessels was utilised to determine the relative striking locations. The scenarios in which two ships that are close and converging are considered. Using the intersecting angle and the ship speed, the type of collision is analysed by interval analysis, which is shown in Table 2.
Collision of vessel position under interval analysis of speed and relative angle

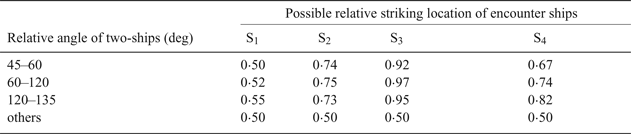
Table 3 is an extension of Montewka et al. (Reference Montewka, Ehlers, Goerlandt, Hinz, Tabri and Kujala2014b). According to this research, the striking angle in the range of 45–135° would probably cause a rupture to the hull as determined by the possible relative striking location with a given mass ratio [0 · 6, 1 · 3]. Furthermore, in this current study, ratios greater than 1·3 or less than 0·6 are simply normalised according to ship size, resulting in a series of possible damage situations. To take the difference of ship size into account during a collision, the rupture value of a smaller ship is normalised to 1, which means a more severe risk, whereas a rupture value of the larger ship is normalised to 0·5, denoting a lesser risk. The value of 0·5 is the smallest value on the curve in Montewka et al. (Reference Montewka, Ehlers, Goerlandt, Hinz, Tabri and Kujala2014b) and refers to the lowest relative available deformation energy. The smaller the rupture value, the lower the risk of collision.
Rupture values based on relative angle and striking location

If the relative angle of navigation approaches 0 or 180°, a collision between two ships will be determined by the trajectory of those ships. If they are moving in the same direction and the ship at the rear is faster than the ship at the front, then a rear-end collision will occur. Table 3 shows that the collision severity of a rear-end collision is less than the loss of the hull caused by the collision.
2.1.6. The mathematical model of NVCRO
The mathematical expression that describes the NVCRO is characterised by the effects of the risk factors and the severity of the collision risk, where the relative speed, safety distance, and heading of the ships are calculated. According to the definition of VCRO proposed by Zhang et al. (Reference Zhang, Goerlandt, Kujala and Wang2016), ships at a distance greater than 6 nm are considered safe, and the expected collision risk is defined as five, indicating a very low risk. The safety domain of vessels in this study is more realistic for open, busy waters. The general navigation risk calculation for the NVCRO is described by:
 $$NVCRO_{j\to i} =R\cdot \displaystyle{{\vert v_{ij}\vert}\over{Dist_{ij} -l_i -l_j}}\cdot \displaystyle{{R\lpar S_i \comma \; \theta _{ij} \comma \; \sigma_{ij}\rpar }\over{L_i }}\cdot\sum_{-\infty }^{+\infty } {m_k \cdot \sin \lpar k\cdot \theta _{ij} \rpar } $$
where R is a parameter for fitting the model described by Zhang et al. (Reference Zhang, Goerlandt, Kujala and Wang2016), |v ij| is the scalar value of ship i speed and ship j speed, and S i represents the category of possible relative striking locations (Table 1). The risk of hull rupture in a collision between encountered vessels is presented as Ri (Si, θ ij, σ ij) (Table 3) and C MDTC as in Equation (5). If the NVCRO value is less than zero, the two-ships would diverge, and can be ignored or simply marked as zero. Additionally, the distances from ships i and j to the safety domain boundary are l i and l j, respectively, and Dist ij is the relative distance between the two ships.
2.2. Developing a collision risk matrix
Based on the mathematical model of NVCRO, the probability and possible consequences of the collision risk between two ships for ship i m are defined by Equation (8). The vessel risk matrix is constructed for each ship as follows:
 $$i_m = \left(\matrix{NVCRO_{i_{m+1}\to i_m} & \cdots & 0 \cr \vdots & \ddots & \vdots \cr 0 & \cdots & NVCRO_{i_{m-1}\to i_m}}\right)$$
The vessel risk matrix in Equation (8) clearly reflects the severity of the collision risk between ship i m and other ships for a certain area. The probability values on the main diagonal reflect the relationship between the observed and surrounding ships. The multi-vessel risk matrix from the first ship to the n-th ship is:
 $$i_i=\left(\matrix{NVCRO_{i_{2}\to i_1} & \cdots & 0 \cr \vdots & \ddots & \vdots \cr 0 & \cdots & NVCRO_{i_{n}\to i_1}}\right)\comma \; \ldots\comma \; i_n=\left(\matrix{NVCRO_{i_{1}\to i_n} & \cdots & 0 \cr \vdots & \ddots & \vdots \cr 0 & \cdots & NVCRO_{i_{n-1}\to i_n}}\right)$$
After the construction of the risk matrix, values of the NVCRO of ship i m and ship i k were extracted. Then the base vector e extracts the value of  $NVCRO_{i_{k}\to i_{m}}$ and the following extraction value of
 $NVCRO_{i_{k}\to i_{m}}$ is:
 $$NVCRO_{i_{m}\to i_k}=\vert i_k\cdot e_{m-k}\vert\comma \; \quad NVCRO_{i_{k}\to i_m}=\vert i_m\cdot e_{n-m-k}\vert $$
There are several possible situations of the collision risk between two ships as follows:
(1) The values of
 $NVCRO_{i_{m}\to i_{m}}$ and $NVCRO_{i_{k}\to i_{m}}$ exist with a large difference;
(2) The difference between the values of
$NVCRO_{i_{m}\to i_{k}}$ and $NVCRO_{i_{k}\to i_{m}}$ is small;(3)
$NVCRO_{i_{m}\to i_{k}}$ and $NVCRO_{i_{k}\to i_{m}}$ are similar.


2.3. Establishing the regional risk network
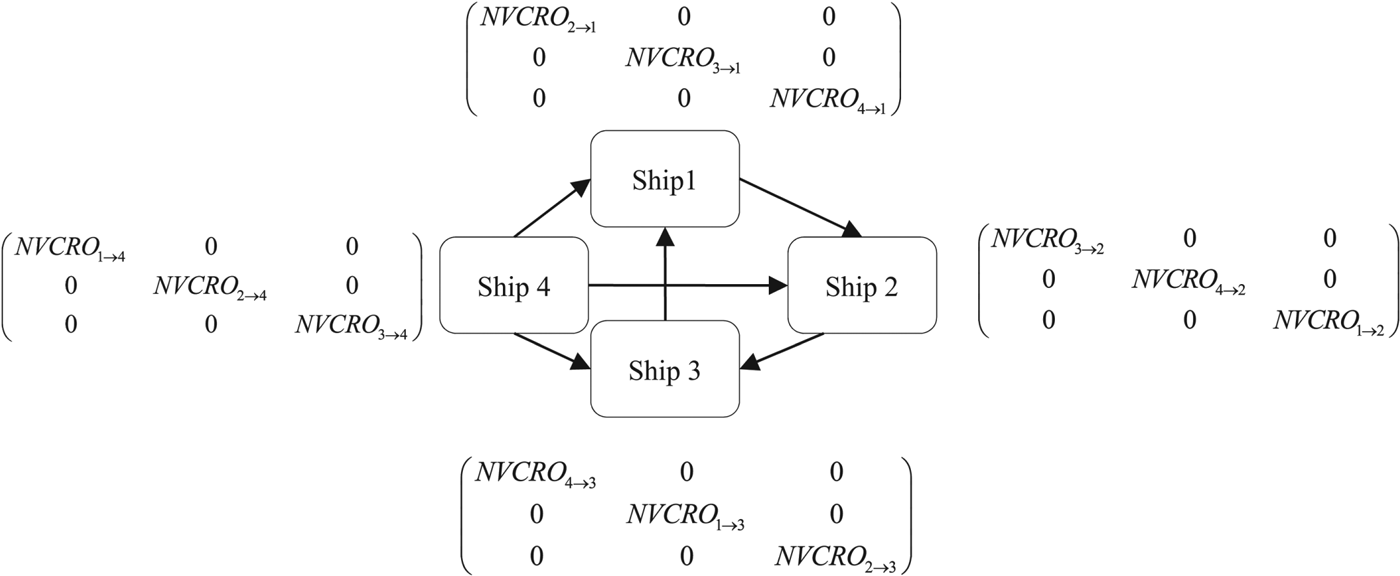
After defining the risk matrix, the model of the regional risk network reflects the vessel sailing conditions, which is taken as an important and unavoidable element in assessing the regional vessel collision risk (Figure 6). The approach adopted that models the regional risk network is to take a ship as a node. The node is marked with a ship organisation number, and the value of the vessel collision risk between vessels is reflected in the risk matrix, from which the link strength between the ships is calculated by the severity of the collision risk.
Regional risk network diagram.

Such a network can be defined by four elements: the nodes of the network with vessels, the collision risk matrix, link strength among the nodes that is shown as the network edge (Figure 6) as determined by the severity of the collision risk (Equation (11)), and the direction of network edge from a smaller value of the NVCRO to a larger one. Zhang et al. (Reference Zhang, Goerlandt, Kujala and Wang2016) considered ships more than 6 nm away as safe, where the expected collision risk value δ was defined as five to indicate a very low risk.
 $$NVCRO_{i_{m}\comma i_k}=\sqrt{\displaystyle{{NVCRO_{i_{m}\to i_k}^2+NVCRO_{i_{k}\to i_m}^2}\over{2}}} $$
The network illustrates the sailing conditions of vessels, especially the severity of the collision risk. Therefore, the method of square means is applied to some vessels with a high NVCRO value, indicating a high risk. Additionally, the direction of the network edge was determined by the value of the vessel collision risk, from a small value of NVCRO to a large one. After the quantitative and qualitative analysis of ships, the direction of the edge may enhance the safety awareness for the ship with a high NVCRO. Therefore, to define the direction of the edge, Equation (12) is proposed:
 $$I=\max\lpar NVCRO_{i_{m}\to i_k}\comma \; NVCRO_{i_{k}\to i_m}\rpar $$
The construction of a regional risk network has three steps. First, the vessels are taken as the nodes of the regional risk network that are marked with a ship organisation number. Second, the strength of the relation between the ships that represents the severity of the collision risk is used as network edges. The direction of the edge is determined by the severity of the collision risk. Third, the risk matrix, which contains the value of NVCRO, reflects the severity of any possible collision risk when a ship encounters other ships. In order to quantify the effect of the collision risk between vessels, the NVCRO is modified to increase the prediction accuracy of the collision risk between two ships. This differs from the NVCRO mentioned in Zhang et al. (Reference Zhang, Goerlandt, Kujala and Wang2016), as we show the severity of the collision risk which includes the rupture value related to the possible relative striking location for a given length ratio.
2.4. Defining the regional vessel collision risk
The specific value of the NVCRO as an element in the collision risk matrix can reflect the regional multi-vessel collision risk. Using the MVCRO, which is composed of NVCRO data, the assessment of multi-vessel collision risk was constructed to demonstrate regional multi-vessel collision risk. If the NVCRO data have an extremely high value, the sailing situations of vessels are assumed to have a high risk. For this reason, a quadratic mean was introduced, which was affected by extremely high values in a set of data as shown in Equation (13).
As demonstrated by Wen et al. (Reference Wen, Huang, Zhou, Yang, Xiao and Wu2015), density complexity is a useful method to describe the traffic complexity. Two areas of different density that contain the same number of ships may show different traffic complexity. Simulated α and λ and the parameters which depend on the type and navigation environment of a ship are replaced by the total length of the two ships multiplied by four (Wen et al., Reference Wen, Huang, Zhou, Yang, Xiao and Wu2015). In this study, Wen's length parameter setting is used in a similar way. The ellipse safety domain is used (Zhang et al., Reference Zhang, Goerlandt, Kujala and Wang2016), and the maximum value of the distance between the ships is set at four times the total length of the two ships.
 $$MVCRO = \sqrt{\displaystyle{{\sum_{j\comma i=1}^{n}\lpar NVCRO_{j\to i}^2+NVCRO_{i\to j}^2\rpar }\over{2\times C_n^2}}}\comma \; \quad i\neq j $$
 $$den_{ij} = \lambda\cdot e^{-\alpha\displaystyle{{\vert\, {\overrightarrow{Dist_{ij}}}\vert}\over{4\cdot \lpar L_i+L_j\rpar }}}\comma \; \quad i\neq j $$
In this paper, n is the number of ships within 6 nm. In order to assess the severity of multi-vessel collision risk, the MVCRO of the sailing vessels was analysed. The analysis of MVCRO is based on the risk analysis for each pair of ships and the method of permutations is used to calculate the value of  $C_{n}^{2}$. The density complexity value as an element of the regional vessel collision risk can reflect the traffic conditions in the area. After completing the two methods as described by Equations (13) and (14), the assessment of regional risk (RVCRO) is analysed using Equation (15):
 $$RVCRO=\displaystyle{{\sum_{1\leq i< j\leq n}den_{ij}}\over{C_n^2}}+MVCRO\comma \; \quad i\neq j $$
The severity of regional vessel collision risk was constructed as RVCRO, with multi-vessel sailing risk and density complexity. Due to the definition of density complexity in Equation (14), each pair of ships and the value of  $C_{n}^{2}$ were based on the method of permutations.
3. THE SIMULATION RESULTS AND VALIDATION
In order to assess the regional collision risk, we applied our model to AIS data. The data were collected from the Baltic Sea in July 2011. The regional risk network provided an intuitive picture of the collision risk between ships within a certain area. By calculating an independent NVCRO for each ship and establishing a risk matrix, the MVCRO value can be estimated. When combined with the density complexity, the RVCRO value can be applied to open water scenarios. Examples of established models to assess the regional collision risk are (1) the encounter scenarios of multiple vessels; (2) possible relative striking location based on interval analysis; (3) regional risk network and (4) the assessment of regional collision risk.
3.1. The encountered scenarios of multiple vessels
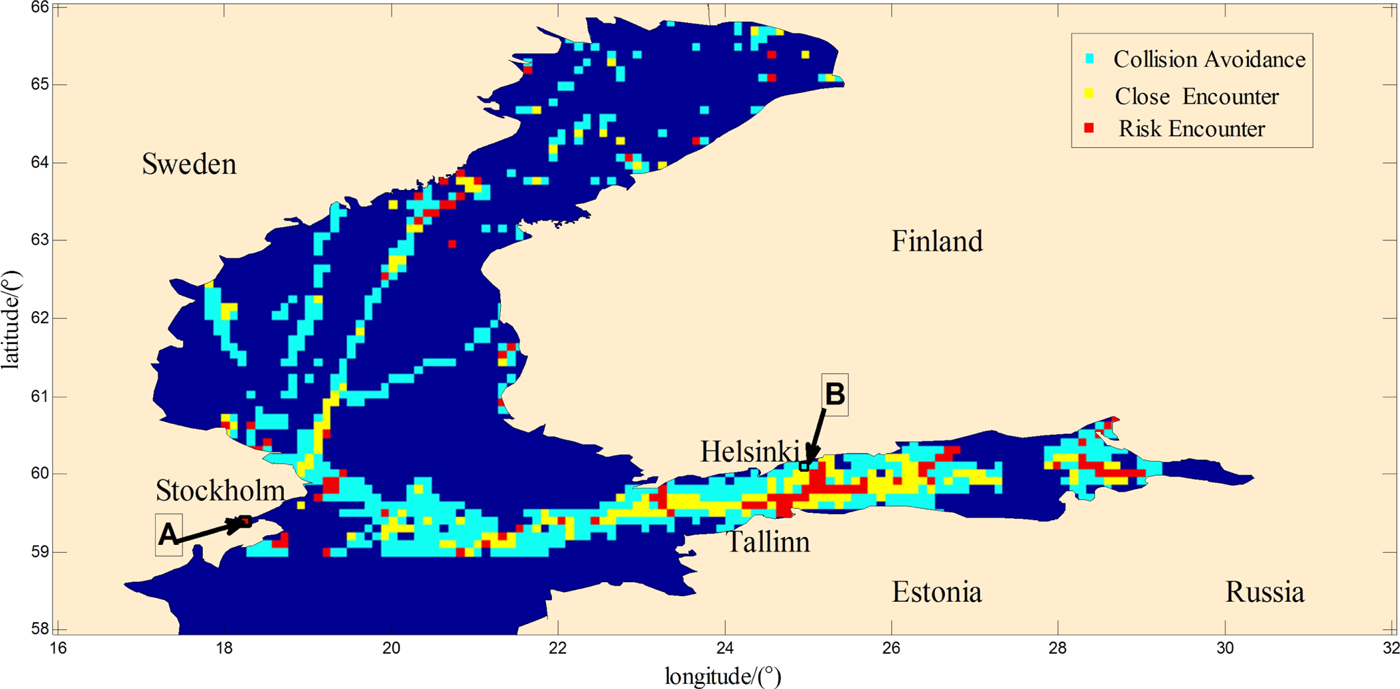
The number of vessels related to the density complexity and the process of navigation in open waters is important in establishing a regional risk network and an assessment of regional collision risk. Therefore, a study of the trajectories of multiple vessels within 6 nm of each other was undertaken. A full scenario of marine safety analysis in the Northern Baltic Sea is shown in Figure 7, which is the geographical distribution of the multi-vessel collision risk. The small coloured squares are computed and ranked by the RVCRO model, where each square represents an area of 6 by 6 nm. The locations of these scenarios in this section are shown in Figure 7.
The Baltic Sea scenario.

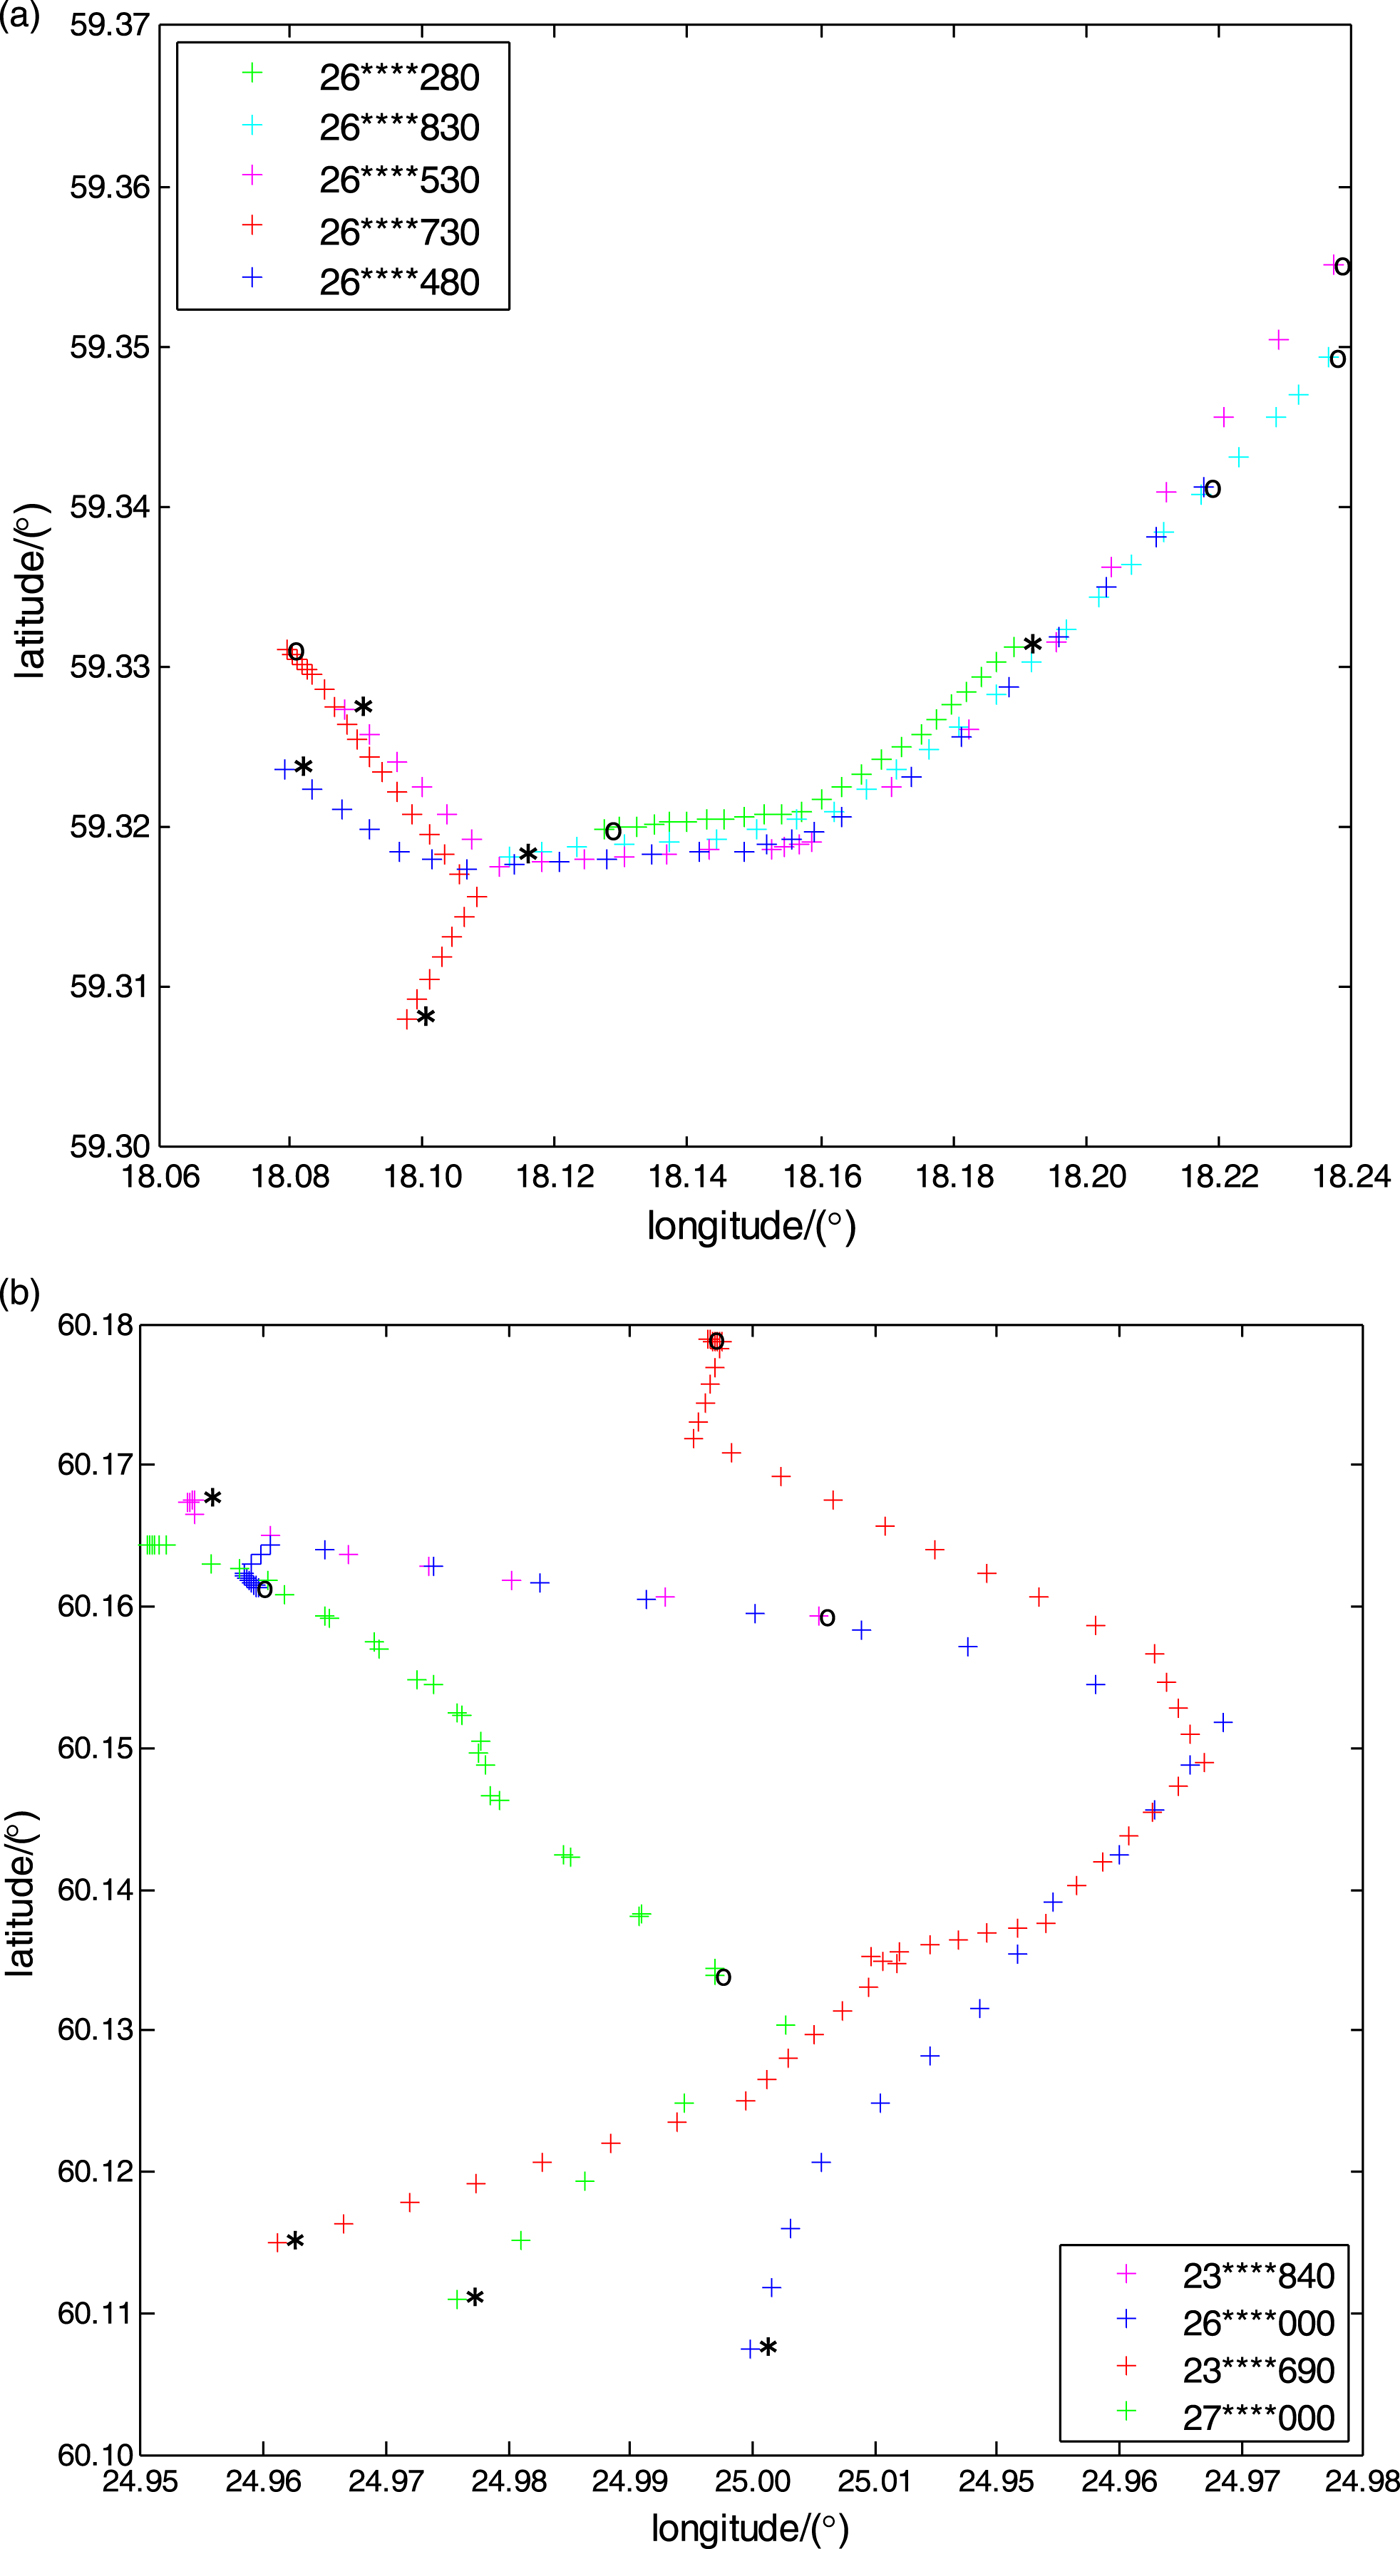
The trajectories of vessels near Stockholm (area A) in the Baltic Sea are shown in Figure 8(a), commencing at 14:33 on 8 July 2011 and finishing at 14:55 on 8 July 2011. Figure 8 shows the multi-vessel tracking close to Helsinki (area B) in the Baltic Sea, with a start time of 06:17 on 8 July 2011 and a finish time of 07:09 on 8 July 2011. In Figure 8, the lines of ‘ + ’ are defined as ship sailing trajectories, ‘*’ is the position of the vessel at the initial moment, and ‘o’ is the end point of the vessel trajectory. Figure 8 shows the trajectories of multiple vessels in area A, which are approximately parallel or overlapping. The Maritime Mobile Service Identify (MMSI) number and tracking colours of the ships are as follows (here the symbol of ‘*’ is used to hide the full MMSI number for privacy and security reasons): MMSI number 26****280 designated by a green ‘ + ’, MMSI number 26****830 designated by a cyan ‘ + ’, and MMSI number 26****530 is designated by Red ‘ + ’. As shown in Figure 8(b), the green ‘ + ’ tracked a high-speed ship, and the red “ + ” was the navigation track of a cargo ship. Moreover, the majority of the ship trajectories in this area contain intersections.
Multi-vessel sailing trajectories.

3.2. Possible relative striking location based on interval analysis
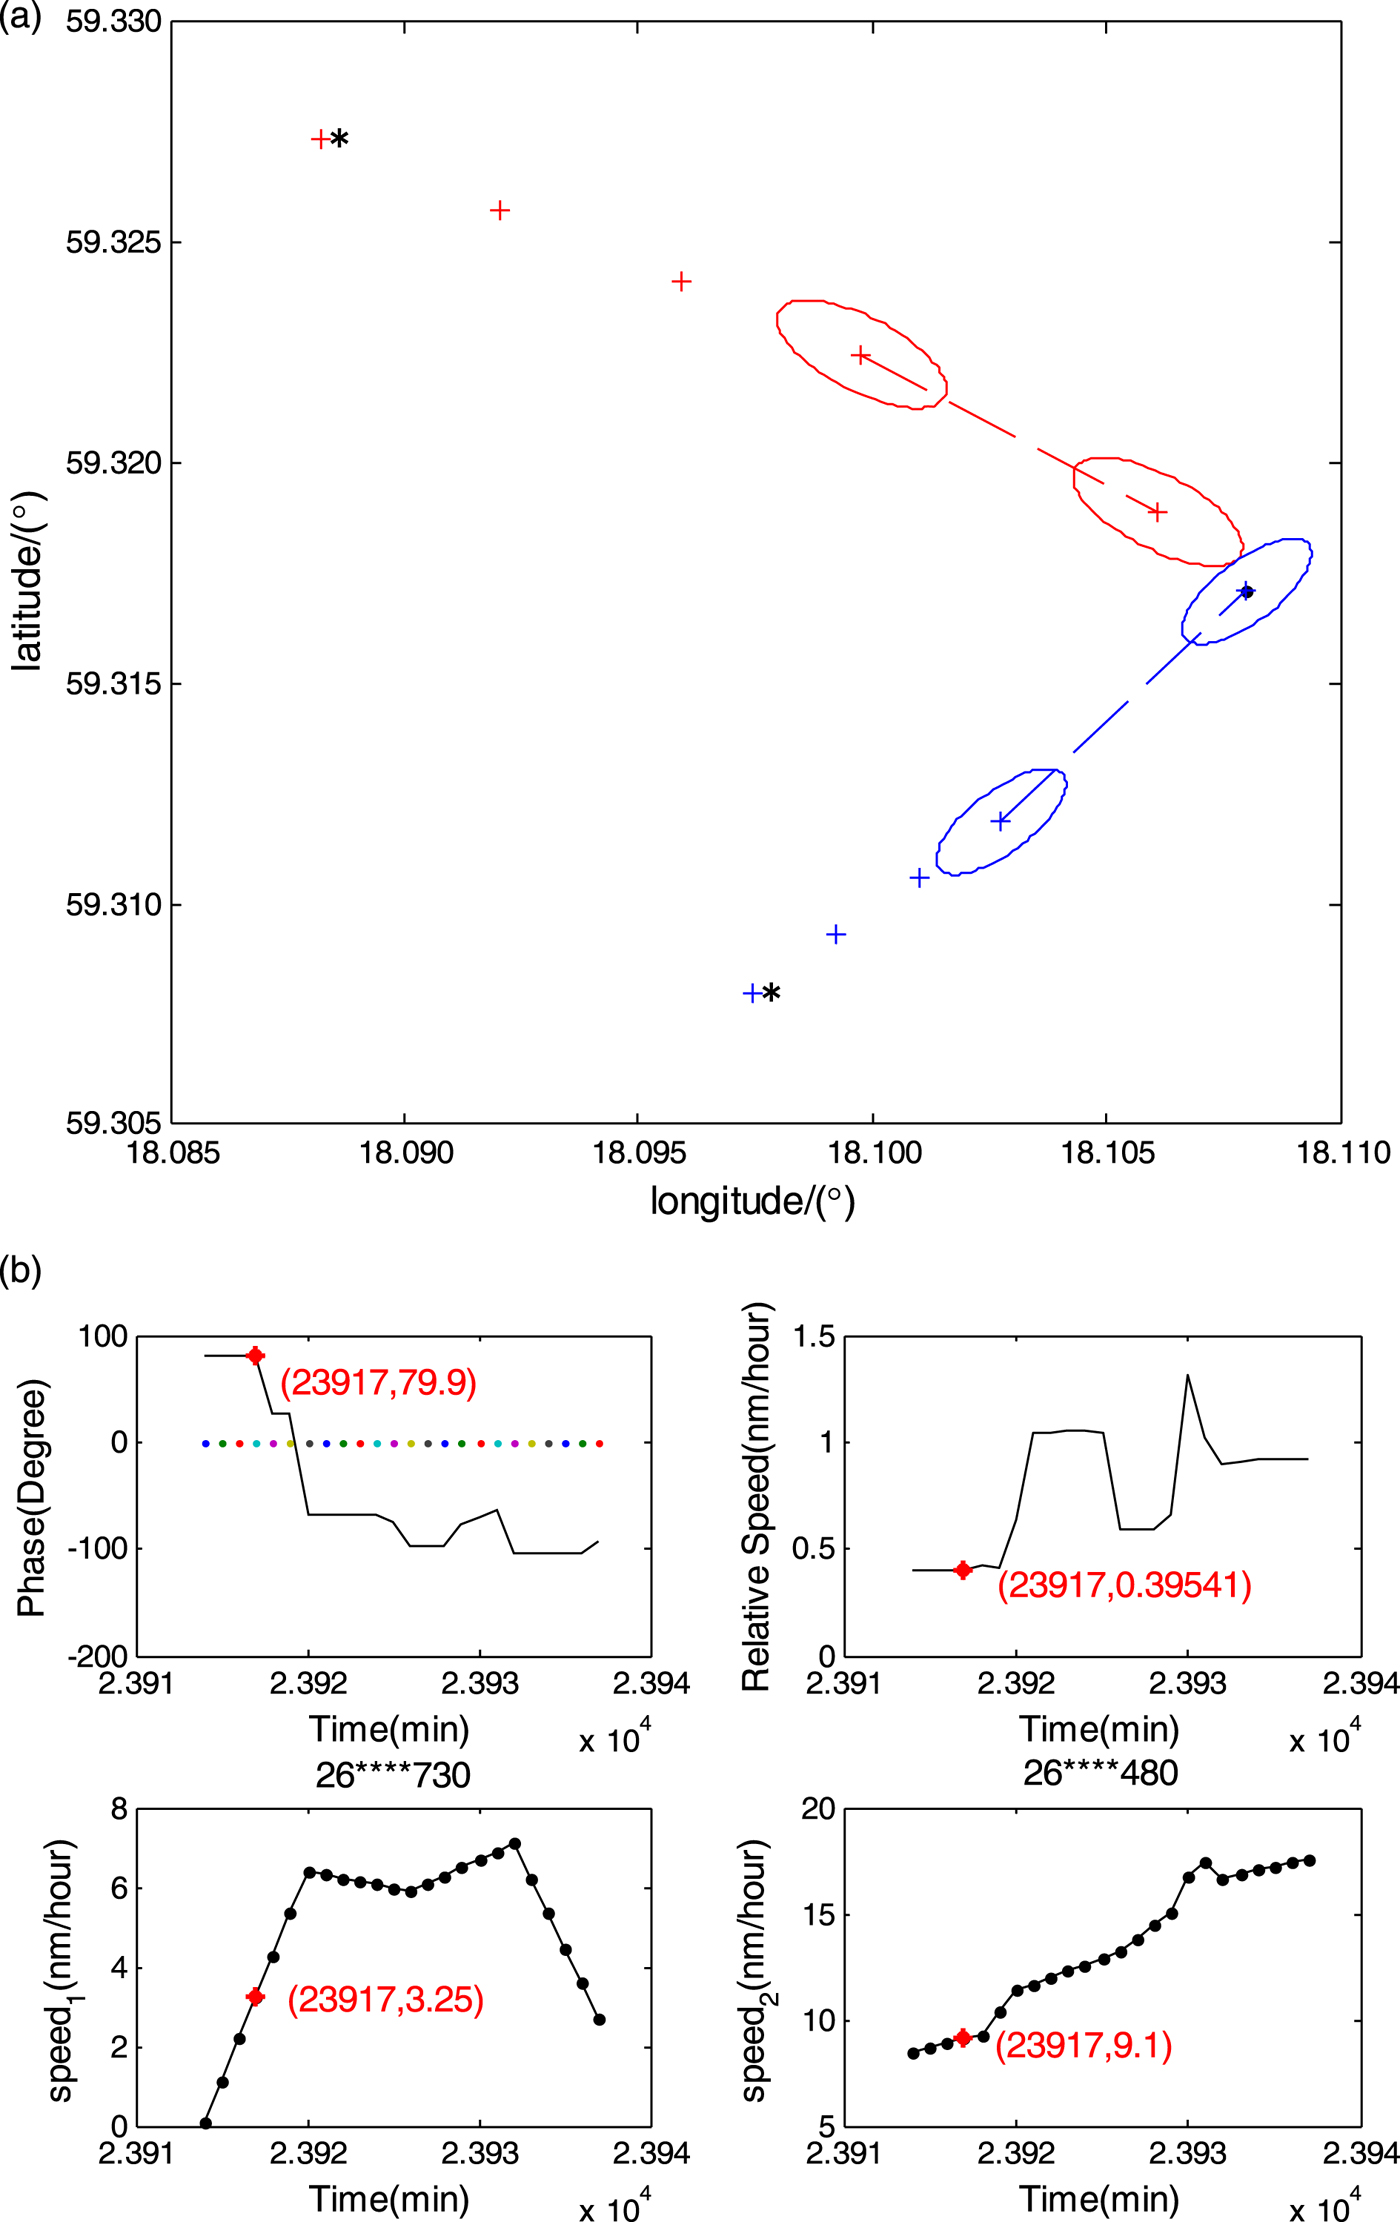
Based on the studies of ship encounter scenarios in the Baltic Sea in July 2011, possible relative striking locations can be determined using interval analysis. Figure 9(a) is the prediction of relative striking locations of two ships where the length ratio is approximately 0·83, and the MMSI numbers of the ships are 26****730 (red ‘ + ’) and 26****480 (blue ‘ + ’), respectively. The two ships sailed between 14:33 on 17 July 2011 and 14:55 on 17 July 2011. The relative angle, relative speed and speed of the two ships are shown in Figure 9(b). Ship 26****480 was faster than ship 26****730, and ship 26****480 arrived earlier than ship 26****730 at the intersection. The angle of navigation between the two ships was 79·9°. Following this trend, a collision may occur between the two ships. According to Section 2.1.5, the possible relative striking location of ship 26****480 meets the requirements for a frontal collision and ship 26****730 is predicted to possibly collide with the rear-end of the ship.
The prediction of possible relative striking location of ships 26****730 and 26****480 in the Baltic Sea at 14:35 on 17 July 2011. (a) The prediction of possible relative striking locations of two ships in the Baltic Sea, (b) Relative angle, relative speed and speed of two ships in the Baltic Sea.

3.3. Regional risk network
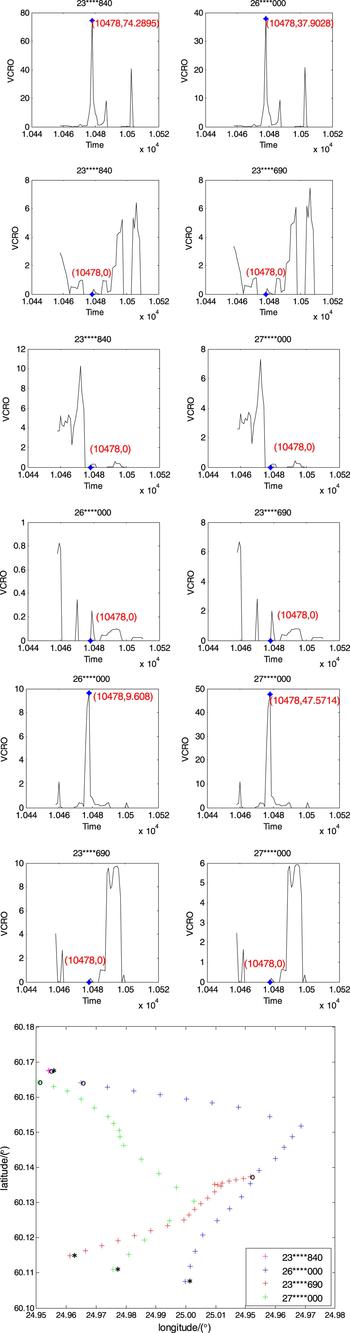
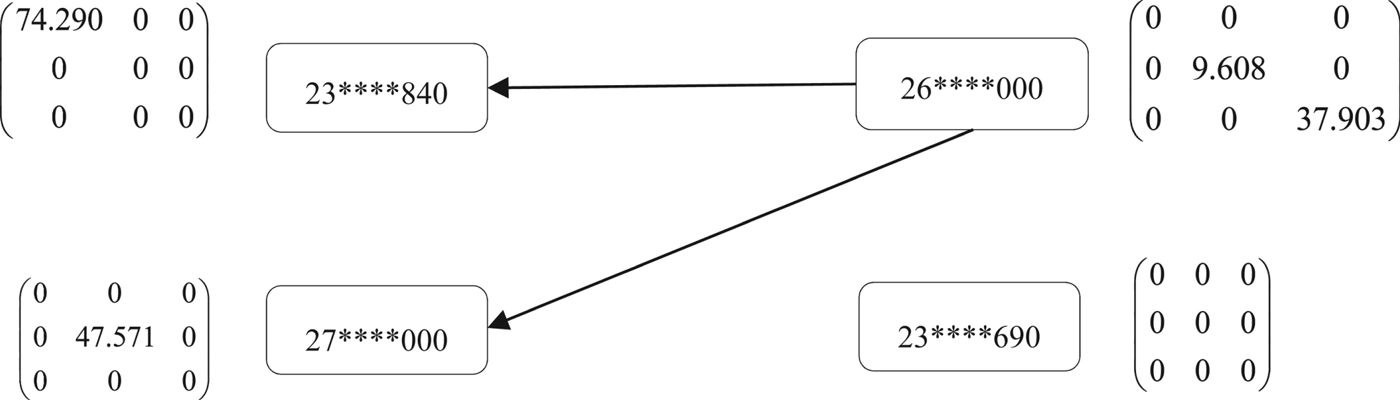
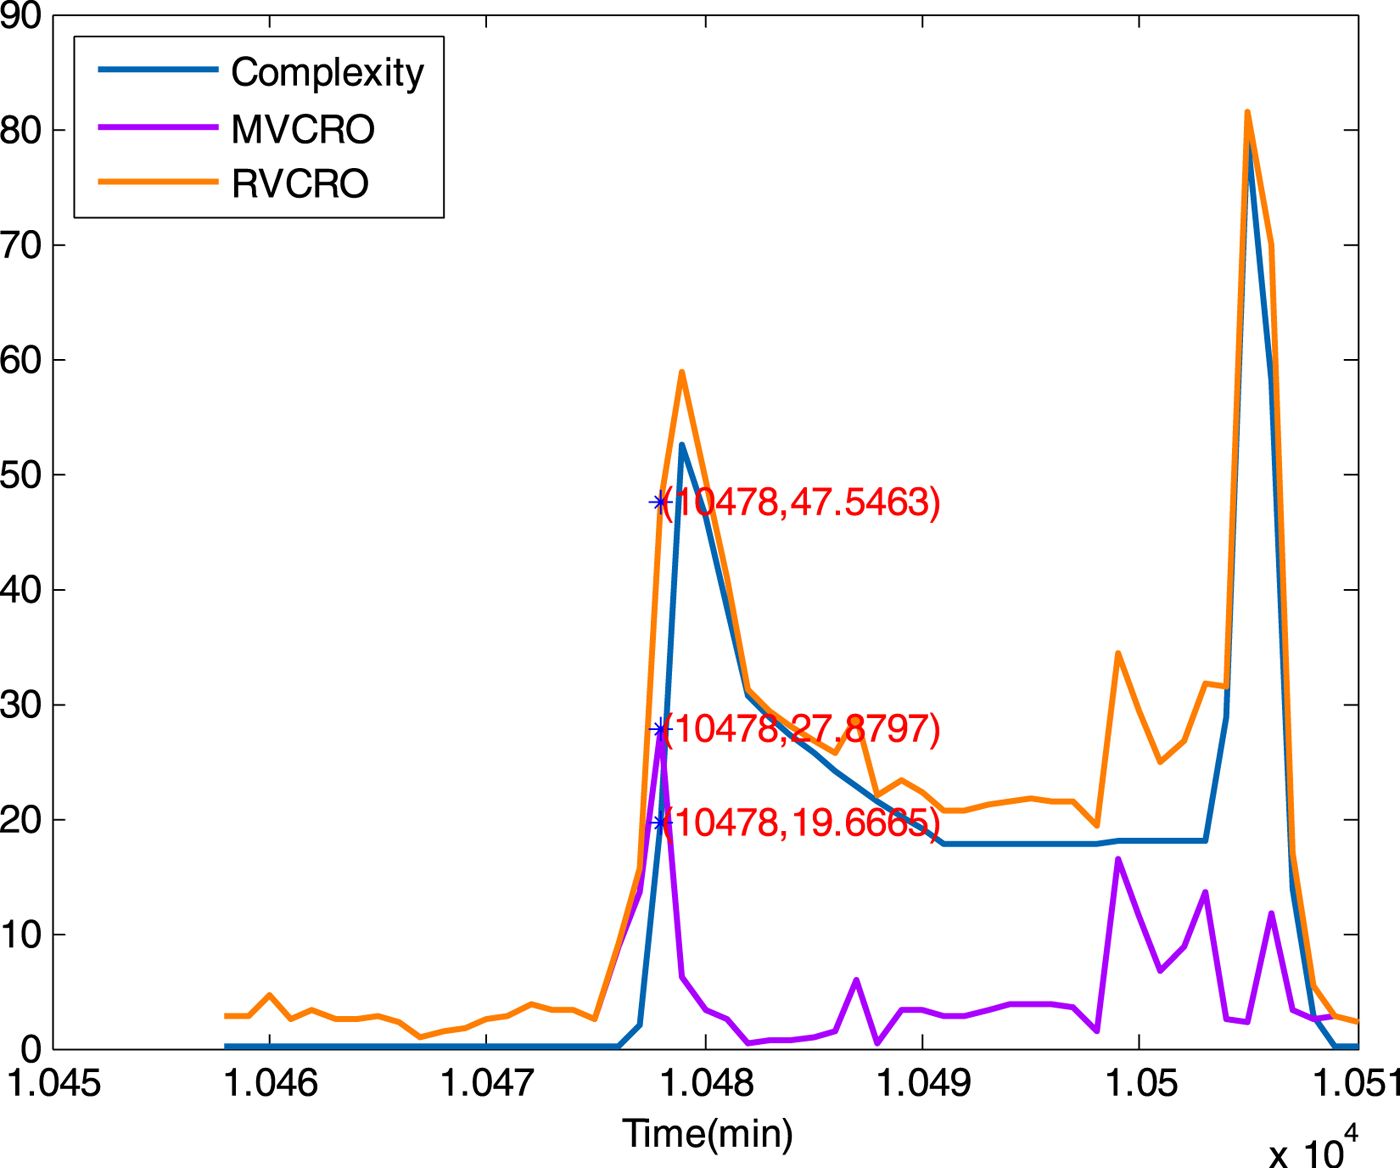
Section 2 summarises NVCRO after the qualitative analysis of vessel collision risks, which is an important part of the risk network analysis. Figure 10 presents a case where the value of NVCRO for four ships within 6 nm in the Baltic Sea, and the value of 10,478 in abscissa corresponds to the time of 06:37. Figure 10 depicts the trajectories of the vessels with MMSI numbers 23****840, 26****000, 27****000, 23****690 and the value of NVCRO in the Baltic Sea at 06:37 on 8 July 2011. As illustrated in the figure, the sailing trend of ship (magenta ‘ + ’), ship (cyan-blue ‘ + ’) and ship (blue ‘ + ’) were close to each other. The ship (red ‘ + ’) diverged from the other ships, thus its (23****690) NVCRO values are zero at 06:37.
Vessel sailing trajectory map and VCRO of our vessels within 6 nm near Helsinki in the Baltic Sea.

Figure 11 shows the regional risk network within 6 nm, where ship (23****690) (corresponding to the cyan trajectory of Figure 10) diverged from ships 26****530, 26****730 and 26****480. The data values of the risk matrix of ship (23****690) were all zeros, which means it was navigationally safe in this area. Although ship 23****840 and ship 27****000 had a risk of near-miss collision with ship 26****000, the regional risk value was not high.
Regional risk network near Helsinki in the Baltic Sea.

3.4. The assessment of regional collision risk
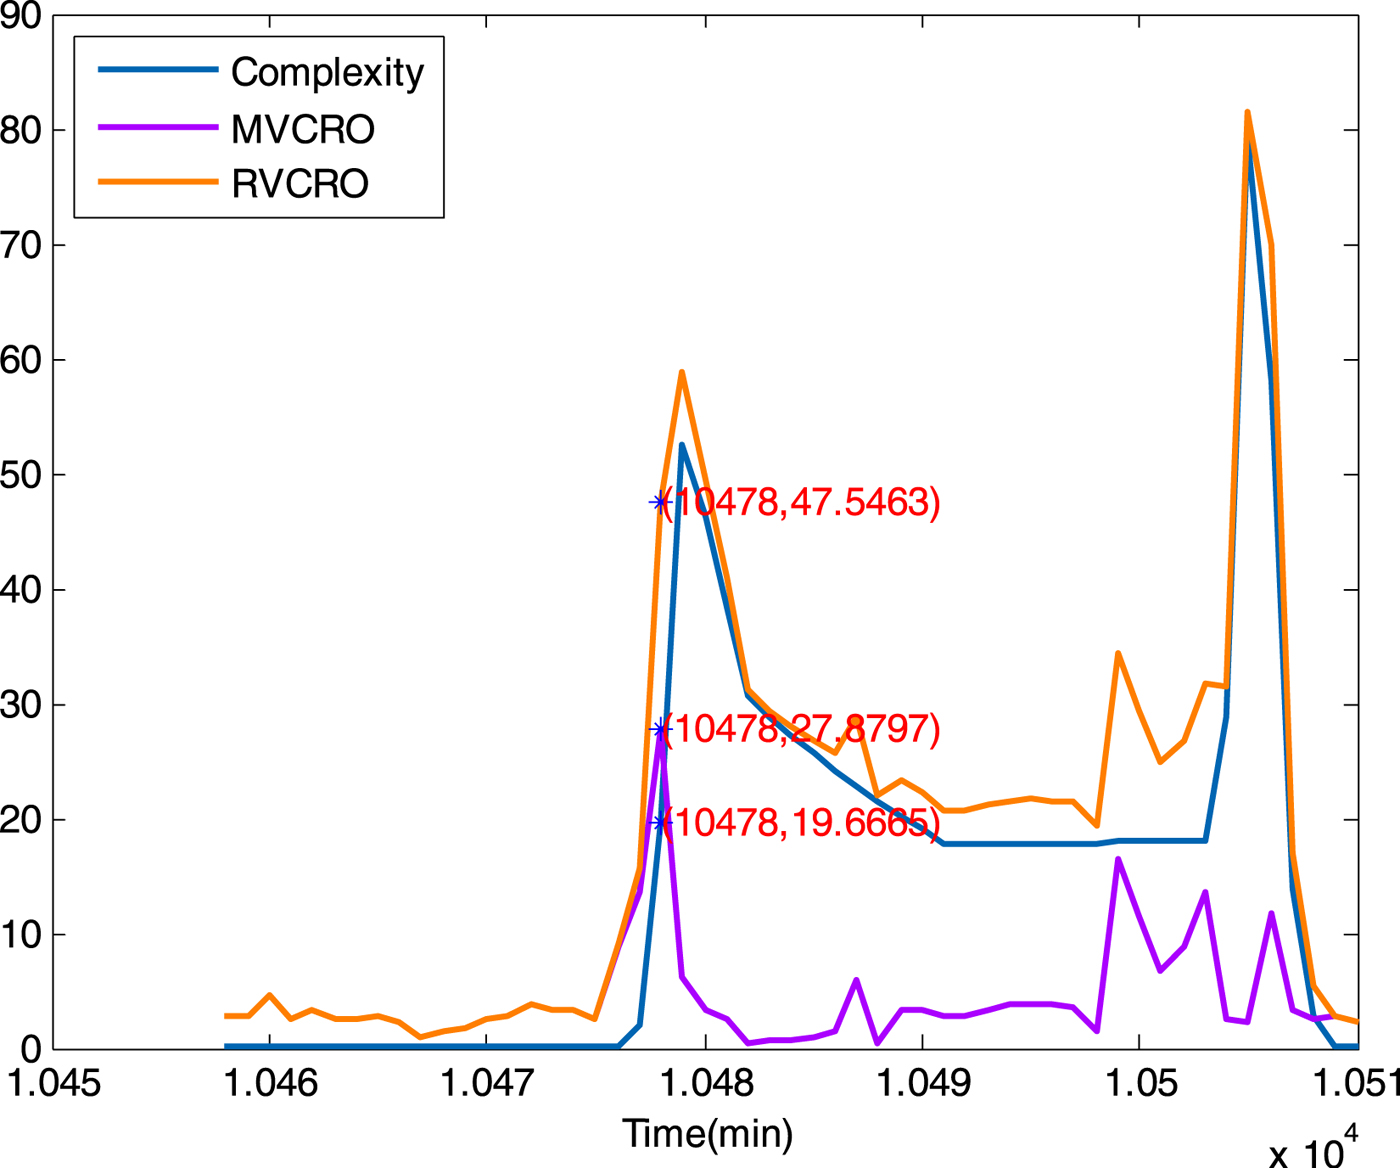
Marine collision risk of the chosen area in the Baltic Sea can be determined using the MVCRO and the density complexity (Wen et al., Reference Wen, Huang, Zhou, Yang, Xiao and Wu2015). The value of RVCRO represented actual situations of regional vessel collision risk. According to Equations (13)–(15), we analysed the total value of MVCRO and density complexity, which are shown in Figure 12. The value of MVCRO and density complexity were close to 19·7 and 27·9, respectively, which means a low collision risk based on the clustering results. The work presented here has been supported by AIS data, which validates the effectiveness of Figure 1 in Section 2 with a goal of assessing regional near-miss collision risk.
Analysis of RVCRO, MVCRO and density complexity in an encountered scenario in the Baltic Sea.
4. DISCUSSION
In this paper, the near-miss collision risk assessment model is extended to a regional model from a ship pair risk assessment model, and it is able to handle the near-miss collision risk of multiple vessels in an open water area. However, the ship kinematics factors taken into consideration are limited (distance, relative course and speed). Other factors such as climate, weather and human operations have not been considered. Additionally, more data of various complex situations of multiple vessel encounters are necessary to optimise the model parameters.
The proposed model can be used to assess the safety situation in an open water area, as well as to predict near-miss collisions in the short term with sufficient ship kinematics data, which are usually obtained from AIS data, and anticipations of ship manoeuvres. The short-term prediction of the risk of near-miss collisions will help decision making and may reduce the risk of collision. Such prediction analysis maybe of value in reducing the risk of collisions in an open water area with high collision risks. Therefore, this work has the potential to be extended to a risk prediction model to increase ship safety. To achieve this goal, more encounter scenarios, additional ship kinematics data during, before and after encounters, and an analysis to include the possibility of ship manoeuvres are necessary.
5. CONCLUSION
In this study, a model of regional risk assessment for open waters has been proposed. The Regional Vessel Collision Risk Operator (RVCRO) with two dimensions, the Multi-Vessel Collision Risk Operator(MVRCO) and the density complexity were measured. The conditions of vessels, provided by AIS data, were available during the observation period. Using data analysis and simulation of ship navigation, the feasibility of regional risk assessment and safety were improved.
The model presented in this study features several elements affecting a maritime safety situation. First, the basic sailing risk factors, such as speed, location, orientation and vessel size, were introduced, analysed and quantified using NVCRO. Second, the possible relative striking location was improved using interval analysis as part of NVCRO, for the analysis of potential collision risk. Third, a risk matrix was developed, which indicated the severity of the potential collision risk of ships within 6 nm of each other.
A regional risk network was developed with the construction of the risk matrix, and each vessel in the region had its own risk matrix, which was used to assess the multi-vessel risk. Moreover, vessels within 6 nm were considered as nodes of the regional risk network. The relationship strength of the nodes was shown as network edges and represents the severity of collision risk between two ships. The direction of the edge points from a small value of NVCRO to a bigger one. It should be noted that the network presented in this study is valid for all ships within 6 nm of each other. Finally, taking into consideration the risk factors in navigation, and combining the MVCRO and density complexity, regional collision risk situations could be identified.
Future work could focus on predicting the regional collision risk in the immediate future. It would be valuable to analyse future risk based on current sailing conditions, and useful to utilise these results to study high marine collision risks in open waters.
ACKNOWLEDGEMENTS
This research was sponsored by the National Key Research and Development Program of China: Key projects of international scientific and technological innovation cooperation between governments (Grant No. 2016YFE0108000), and Zhejiang Province Intelligent Transportation Engineering Technology Research Center Open Project (Grant No. 2017ERCITZJ-KF01).