Implications
There is little information on non-secreted regulatory factors expressed by adipose tissue from growing pigs. These studies identified several adipose tissue factors associated with leptin gene expression and therefore potentially involved in growth and pubertal development in pigs. Porcine adipose tissue from growing pigs expressed numerous nuclear and other regulatory factors, signaling factors and enzymes many of which can influence fat cells and fat cell development. In particular, our studies indicate that PTGR1 may indirectly influence adipogenesis in the pig by reducing the biological activity of prostaglandins. However, it will be important to examine these adipose tissue factors at the protein level during growth and pubertal development in the pig.
Introduction
Adipose tissue can influence feeding behavior, growth, metabolism and the development of puberty through the secretion of leptin, several interleukins and several other cytokines (reviews, Barb et al., Reference Barb, Hausman and Rekaya2006; Jacobi et al., Reference Jacobi, Gabler, Ajuwon, Davis and Spurlock2006; Trayhurn et al., Reference Trayhurn, Bing and Wood2006). Identifying key adipose tissue regulatory factors associated with leptin gene expression and gene expression of other secreted factors is critical to our understanding of adipose tissue as an endocrine organ. Many transcription factors, signaling factors and other regulatory factors are involved in the differentiation and function of adipocytes (reviews, Farmer, Reference Farmer2006; Rosen and MacDougald, Reference Rosen and MacDougald2006; Prestwich and MacDougald, Reference Prestwich and MacDougald2007) and may be associated with leptin gene expression. Associations between adipose tissue leptin gene expression and expression of a very limited number of regulatory factors such as peroxisome proliferator-activated receptor-gamma (PPARγ) and/or CCAAT/enhancer binding protein-α (C/EBPα) have been examined (Krempler et al., Reference Krempler, Breban, Oberkofler, Esterbauer, Hell, Paulweber and Patsch2000). Leptin gene expression was associated with C/EBPα protein expression in pig adipose tissue stromal-vascular cell culture studies (Chen et al., Reference Chen, Dean and Hausman1999). However, a gene microarray or global approach is preferable for these studies since mRNA levels of leptin and other adipose tissue factors can be evaluated in the context of mRNA levels of many other regulatory factors. With such an approach, several key regulatory factors were identified recently in pig adipose tissue following feed restriction and fasting (Lkhagvadorj et al., Reference Lkhagvadorj, Qu, Cai, Couture, Barb, Hausman, Nettleton, Anderson, Dekkers and Tuggle2009 and Reference Lkhagvadorj, Qu, Cai, Couture, Barb, Hausman, Nettleton, Anderson, Dekkers and Tuggle2010). A cDNA microarray – reverse transcription (RT)-PCR approach was used to show that gene expression of leptin and several other secreted factors in adipose tissue increases with age in growing pigs (Hausman et al., Reference Hausman, Barb and Dean2007 and Reference Hausman, Barb and Dean2008). In this study, we used the same approach to examine the influence of age on gene expression of transcription factors, signaling and other regulatory factors in adipose tissue from growing pigs (Hausman et al., Reference Hausman, Barb and Dean2007 and Reference Hausman, Barb and Dean2008). Furthermore, we compared outer subcutaneous adipose tissue (OSQ) and middle subcutaneous adipose tissue (MSQ) depots in regards to relative gene expression patterns for regulatory factors, given that cellular and metabolic development distinguish these depots (Anderson et al., Reference Anderson, Kauffman and Kastenschmidt1972) and expression of several cytokines and receptors distinguished MSQ from the OSQ depot (Hausman et al., Reference Hausman, Barb and Dean2007 and Reference Hausman, Barb and Dean2008). The studies presented herein represent initial efforts to identify the influence of age on gene expression of key regulatory proteins in porcine adipose tissue.
Material and methods
Animals
Data in the present and previous studies (Hausman et al., Reference Hausman, Barb and Dean2007 and Reference Hausman, Barb and Dean2008) were generated from the same tissues and pigs so details of animal handling and care are reported elsewhere (Hausman et al., Reference Hausman, Barb and Dean2007). Briefly, five PIC composite lean phenotype gilts were utilized at 90, 150 and 210 days, for a total of 15 pigs (Hausman et al., Reference Hausman, Barb and Dean2007). In this herd, the expected time of puberty was 210 days, and expression of reproductive associated pituitary and hypothalamic genes distinguished 210- and 150- from 90-day-old pigs. Consequently, 90-, 150- and 210-day-old pigs represented distinct stages of pig pubertal development (unpublished observations). Before slaughter, gilts were penned in an environmentally controlled building and fed a corn-soybean meal ration (13% to 18% crude protein and 3% to 5% crude fat as fed) on an ad libitum basis, according to the National Research Council guidelines (Hausman et al., Reference Hausman, Barb and Dean2007). All procedures were approved by the Richard B. Russell Agriculture Research Center Committee on Animal Care and Use.
Pig cDNA microarrays and gene expression analysis
Tissue collection and RNA preparation
Five pigs at 90, 150 and 210 days of age were euthanized (a total of 15 pigs) with an overdose of 10% sodium thiopental and OSQ and MSQ samples were collected at slaughter (Hausman et al., Reference Hausman, Barb and Dean2007). Samples of OSQ and MSQ were obtained from dorsal subcutaneous adipose tissue over the shoulder just right of the midline. The OSQ and MSQ were clearly separated by a connective tissue sheath. Tissue samples were flash-frozen in liquid nitrogen and stored at −80°C until RNA isolation. Total RNA was isolated from frozen tissues using Qiazol reagent and RNA Maxi Kits (Qiagen, Valencia, CA, USA) according to the manufacturer's procedure. Total RNA quality was determined using spectrophotometry at the UV absorbency of 260 nm by microfluidic technology on an Agilent 2100 Bioanalyzer (Agilent Technologies, Foster City, CA, USA). Quantity of the RNA was determined by spectrophotometry on a μQuant Microplate Spectrophotometer (Bio-Tek Instruments, Winooski, VT, USA). To correct for dye-specific bias during hybridization, a dye swap design was used as follows. Each of the total RNA sample was split and transcribed into cDNA, and the replicate cDNA's were labeled with either Cy3 or Cy5 in direct reactions using Amersham Bioscience's (Piscataway, NJ, USA) Cyscribe First- Strand cDNA labeling kit (oligo-dT primers, Cy3- dCTP, Cy5-dCTP). Labeled targets were purified with Qiagen's QIAquick PCR purification kit (Qiagen, Valencia, CA, USA). The dye swap replicates were then hybridized to different array slides.
Relative expression of normalized microarray gene intensities
Details are reported elsewhere (Hausman et al., Reference Hausman, Barb and Dean2007). Normalized microarray intensities were averaged across age, resulting in five average intensities per gene per tissue at each age. Percentages or ratios of the average intensity of a relevant or reference gene were calculated resulting in five ratios (percentages) per gene at each age. Since an age effect was generally not observed, we combined gene ratios from 90, 150 and 210 days pig adipose tissue microarrays for comparing outer (OSQ) and middle (MSQ) subcutaneous adipose tissue ratios. The expression of Lactate dehydrogenase C in microarrays was similar and constant across ages so it was used as a reference gene when a related gene was not obvious. A total of 50 OSQ and MSQ gene ratios were generated from microarray data and compared.
Determination of Cy3/Cy5 expression intensity ratios between the 90 to 150, 150 to 210 and 90 to 210 days age groups
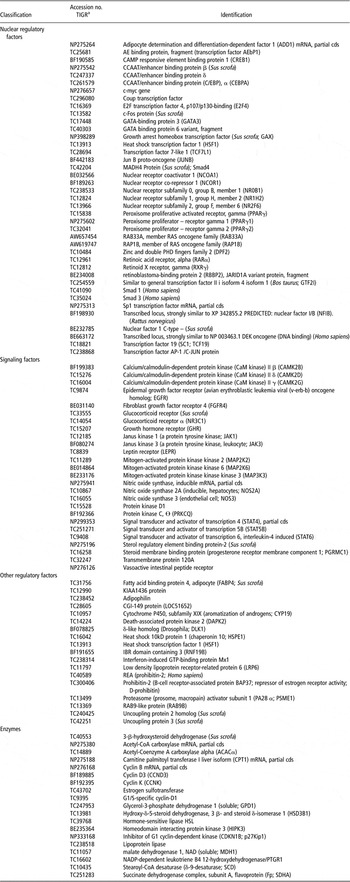
Microarrays were scanned and signal output reported as described above. As described (Hausman et al., Reference Hausman, Barb and Dean2007 and Reference Hausman, Barb and Dean2008) microarray intensities from each of five pigs/age group were utilized with two data points/pig (Cy3/Cy5 swapping) totaling 10 microarray intensities/age. Background corrected fluorescent intensities were normalized by a global mean normalization and averaged for each gene and age. These averages were used to compute Cy3/Cy5 expression ratios between the ages for each gene. The accession numbers and identity of all the genes examined in these studies are shown in Table 1.
Identities of nuclear and other regulatory factors, signaling factors and enzymes examined in outer and middle subcutaneous adipose tissue microarrays from 90, 150 and 210 days old pigs

aTIGR = The Institute of Genome Research; TC and NP accession numbers can be searched at: http://compbio.dfci.harvard.edu/cgi-bin/tgi/gireport.pl?gudb=pig
Individual pig expression values for leptin and other genes within and across age groups
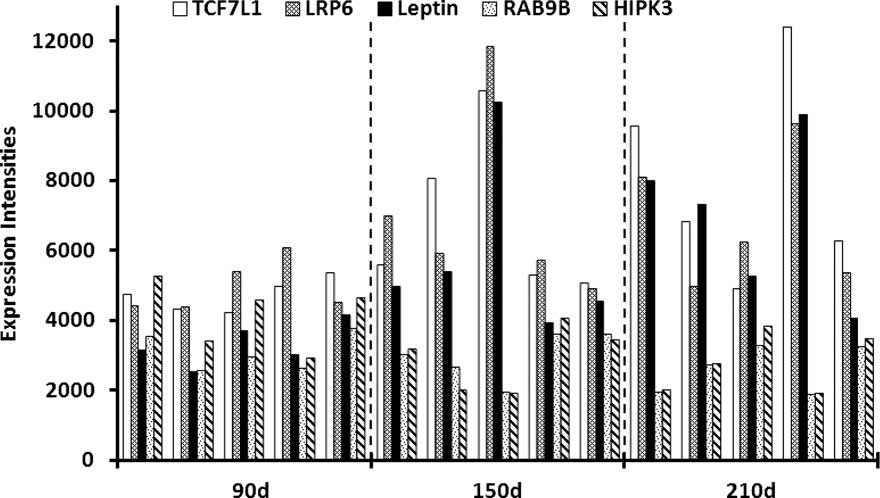
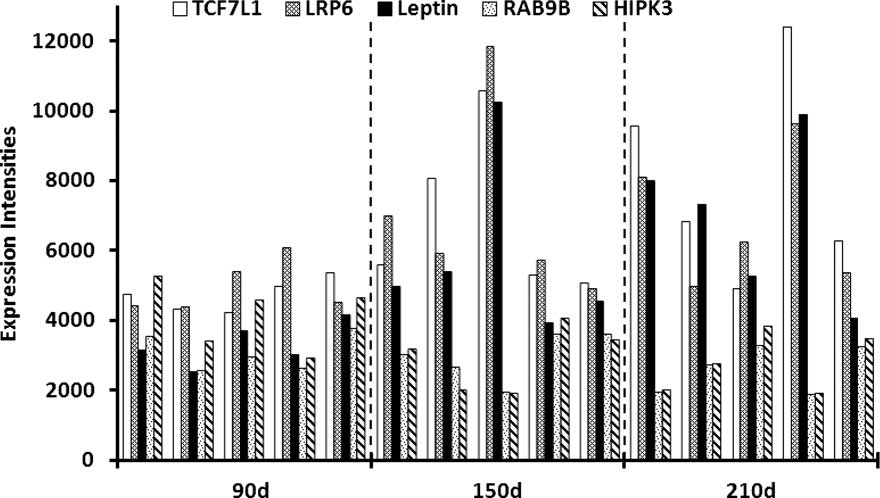
When we evaluated individual pig gene expression values from gene microarrays, we noted relationships between individual pig patterns of leptin gene expression and individual pig patterns of expression of other genes in MSQ microarray data (Figure 1). Therefore, the pattern of individual pig microarray intensities of 180 regulatory (not secreted) genes was compared to individual pig microarray intensities of leptin across all ages. Fifty genes with patterns of gene expression similar to the leptin gene expression patterns were selected for simple linear regression and correlation analysis against leptin values. Pearsons product moment correlation and simple linear regression was used to quantify relationships between individual pig expression values for leptin and selected genes across all three age groups (n = 15 values) and within each age group (n = 5) for the MSQ depot (Wessa, Reference Wessa2006). In addition, individual pig expression values for AFABP, LPL, PPARγ1, PPARγ2, ADD1 and PTGR1 were regressed against 23 of the genes that were significantly regressed against leptin. Regression analysis was pursued to a limited extent in OSQ microarray data since animal-to-animal patterns of expression of leptin and other genes were less apparent than in MSQ data.
Middle subcutaneous adipose tissue gene expression intensities for five individual pigs at each of the three ages studied, that is, 90, 150 and 210 days. When considering gene expression at the individual pig level, a positive association of TCF7L1 and LRP6 gene expression with leptin expression is demonstrated, whereas RAB9B and HIPK3 expression is negatively associated with leptin gene expression.
Quantitative real-time RT-PCR
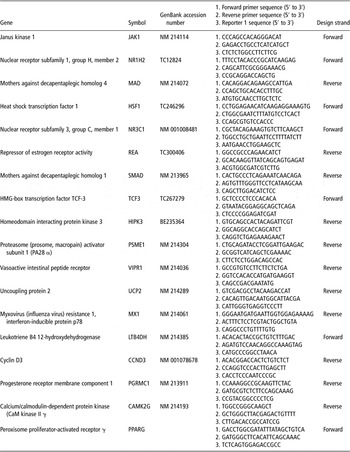
Real-time PCR (qPCR) was performed by the University of Georgia Functional Genomics Resource Facility using Applied Biosystems’ (ABI) 7900HT Sequence Detection System (Foster City, CA, USA). TaqMan® gene expression assays were custom designed by ABI (Table 2). Endogenous control was porcine 18S rRNA. Five hundred nanogram total RNA was transcribed into complementary deoxyribonucleic acid (cDNA) and was diluted 1 : 20, without quantification; 1 μl was used in each 12.5 μl reaction with 6.25 μl 2X TaqMan® Universal PCR Master Mix and 0.625 μl 20X TaqMan® assay. Thermal cycling parameters were 95°C for 10 min followed by 40 cycles of 95°C for 15 s; 60°C for 1 min. C t (threshold cycle) values were determined using ABI's 7900HT Version 2.2.1 Sequence Detection Systems software; within-sample triplicate wells were averaged. Two complementary methods were used for analysis, the 2−ΔΔCt method and REST© software tool (15). Replicate C t values for each age group were averaged for the former method but not the latter. ΔC t = C t target gene − C t 18S endogenous control; ΔΔC t = ΔC t older age group − ΔC t younger age group. For REST©, probe efficiencies were calculated with serial dilutions of pooled porcine RNA. Mean C t values from the REST analysis are shown to demonstrate gene expression.
Primer pairs for each selected gene, reporter 1 sequence and Genebank accession number from which the primer pairs were selected

Real-time RT-PCR reactions performed on middle and OSQ microarray mRNA
cDNA templates were designed to study a total of 17 genes present on our gene microarrays and were chosen based, in part, on gene expression patterns in microarrays of neonatal adipose tissue and fetal stromal-vascular cell cultures (unpublished observations). These genes were TCF7L1, HIPK3, MAD, SMAD, CAMK2G, NR1H2 and NR3C1 (Table 1). cDNA templates were also designed to study other genes (Table 1, MX1, repressor of estrogen receptor activity (REA; prohibitin-2), HSF1, UCP-2, PGRMC1, LTB4DH and VIPR1) based on significant (P > 0.001) differential expression to age indicated by analysis of the microarray data with either a LOWESS normalization based or an ANOVA normalization-based method (G. Hausman et al., Reference Hausman, Barb and Dean2007, unpublished observations). RT-PCR reactions were performed on 90 and 210 days MSQ mRNA for all of these genes and on 150 day MSQ mRNA for several of these genes. RT-PCR reactions were performed on 90 and 210 days OSQ mRNA for several of these genes.
Statistics
Pearsons product moment correlation and simple linear regression (Wessa, Reference Wessa2006) were used to examine relationships between real time RT-PCR and microarray gene expression data after log10 transformation. Differences in gene expression determined by real time RT-PCR were analyzed using a pairwise fixed allocation randomization test, utilizing the relative expression software tool (REST version 2). All means were normalized to the endogenous control 18S rRNA expression. Statistical significance was set at P < 0.05.
Results
Adipose tissue regulatory gene expression between 90 to 150, 150 to 210 and 90 to 210 days of age groups
Average Cy3/Cy5 intensity expression ratios (>1) for 90 to 150, 150 to 210 and 90 to 210 days MSQ age groups were 1.2 ± .21, 1.1 ± .12 and 1.3 ± .22 (means ± s.e.m. of 60, 30 and 45 genes, respectively). Average age group Cy3/Cy5 intensity expression ratios were similar for the OSQ, so there was little change in gene expression with age overall as an expression ratio of 1 indicates no change. One of the highest Cy3/Cy5 intensity expression ratios detected was 1.8 for MADH4 protein (Smad4) between 90 and 210 days in the MSQ depot. Simple linear regressions (r 2) of expression ratios (100 regulatory genes) from the 90 to 210 days age group v. expression ratios from the 90 to 150 and 150 to 210 days groups indicated that changes in gene expression between 90 and 210 days and 90 and 150 days were similar and greater than changes between 150 and 210 days.
Associations between leptin gene expression and expression of other genes within and across age groups in the MSQ microarray data
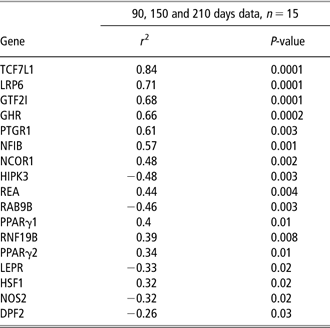
Regression analysis demonstrated that significant linear regressions between individual pig gene expression values for leptin and individual expression values for non-secreted genes were mostly positive associations (Table 3). Strong relationships between expression of these genes and leptin gene expression was also demonstrated by significant Pearson correlation coefficients ranging from 0.92 to −0.58 (P < 0.001 to P < 0.02). Therefore, positive and inverse associations were detected between expression of leptin and expression of regulatory genes. Regression analysis also demonstrated significant linear regressions between expression values of 12 of the leptin associated genes (RAB9L, NOS2A, HIPK3, TCF7L1, REA, GTF21, PTGR1, LEPR, GHR, JAK1, DP2) and PPARγ1 and PPARγ2 expression; 7 of the leptin associated genes (HIPK3, TCF7L1, REA, GTF21, PTGR1, LEPR, LRP6) were significantly regressed against LPL expression (r 2 = 0.22 to 0.53; P < 0.001 to P < 0.02 ).
Significant simple linear regression coefficients between individual pig leptin gene expression values and individual expression values of other genes for 90, 150 and 210 days data combined
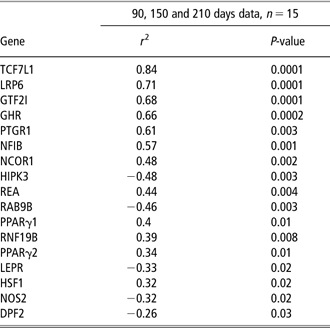
TCF7L1 = transcription factor 7- like 1; LRP6 = low density lipoprotein receptor-related protein; GTF21 = similar to general transcription factor II I isoform 4 isoform 1; GHR = growth hormone receptor; PTGR1 = 15-oxoprostaglandin 13-reductase; NF1B = nuclear factor 1/B; NCOR1 = nuclear receptor co-repressor 1; HIPK3 = homeodomain interacting protein kinase 3; REA = repressor of estrogen receptor activity (prohibitin-2); RAB9B = RAB9-like protein; PPAR γ1 = peroxisome proliferator gamma 1; PPAR γ2 = peroxisome proliferator gamma 2; RNF19B = IBR domain containing 3; LEPR = leptin receptor; HSF1 = heat shock transcription factor 1; NOS2 = nitric oxide synthase 2A; DPF2 = zinc and double fingers family 2.
Simple linear regressions of leptin normalized gene expression intensities versus matching normalized gene expression intensities of other genes generated from middle subcutaneous adipose tissue microarrays from 90, 150 and 210 days old pigs.
Associations between leptin gene expression and other gene expression across age groups in the OSQ
Regression analysis of OSQ was used to evaluate relationships between leptin expression and expression of several genes. In the OSQ data, the only significant linear regression was detected between leptin and GTF21 expression (r 2 = 0.49, P < 0.005) for 90, 150 and 210 days combined.
Relative gene expression in outer and MSQ from growing pigs
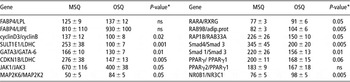
Percentages or ratios of expression levels of related genes were calculated from the combined data from 90, 150 and 210 days pig OSQ and MSQ microarrays. Comparing MSQ and OSQ expression ratios showed that expression of many regulatory genes were influenced by depot (Table 4). In particular, the relative expression of several transcription factors and signaling factors was higher in MSQ than in OSQ (Table 4). Ratios of several adipogenic markers were not influenced by depot.
The relative expression of transcription factors, nuclear receptors, enzymes, and regulatory proteins for middle (MSQ) and outer (OSQ) adipose tissue based on combined microarray data from 90, 150 and 210 days old pigsFootnote a

FABP4 = fatty acid binding protein 4, adipocyte; LIPE = hormone sensitive lipase; SULT1E1 = estrogen sulfotransferase; GATA3 = GATA-binding protein 3; GATA-6 = GATA binding protein 6 variant, fragment; CDKN1B = cyclin-dependent kinase inhibitor 1B (p27, Kip1); JAK1 = Janus kinase 1; JAK3 = Janus kinase 3; MAP2K6 = mitogen-activated protein kinase kinase 6; MAP2K2 = mitogen-activated protein kinase kinase 2; PPAR γ1 = peroxisome proliferator gamma 1; PPAR γ2 = peroxisome proliferator gamma 2; PPAR γ = peroxisome proliferator gamma; RAB33A = member of RAS oncogene family; RAP1B = member RAS oncogene family; RARα = retinoic acid receptor, alpha; RXRγ = retinoic X receptor, gamma; Smad4 = MADH4; NR3C1 = glucocorticoid receptor alpha; NR0B1 = nuclear receptor subfamily 0, group B, member 1; CCND3 = cyclin D3; LDHC = lactate dehydrogenase C.
a Ratios of expression levels of related genes were used to demonstrate relative gene expression differences between MSQ and OSQ microarrays. In several instances, LDHC was used as the reference gene since a related gene was not present in the microarray data set. Means ± s.e.m. of 15 percentages (i.e. 15 pigs) of relative normalized fluorescent intensities from each of 15 MSQ and 15 OSQ adipose tissue microarrays since data from 90, 150 and 210 days old pigs were combined..
* MSQ v. OSQ, Students ‘t’ test.
Age independent gene expression of transcription and signaling factors in middle subcutaneous adipose (MSQ) and outer subcutaneous adipose (OSQ) from growing pigs
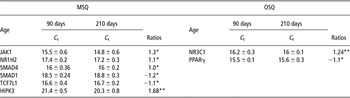
Mean C t values generated during REST analysis were used to demonstrate gene expression that was not influenced by age (Table 5). The C t values are inversely related to gene expression. Expression of JAK1, NR1H2, MADH1, SMAD4, TCF7L1 and HIPK3 was detected in the MSQ depot (Table 5) and expression of NR3C1 and PPARG was detected in the OSQ depot. Regression analysis demonstrated a significant linear regression (r 2 = 0.63, P < 0.0001) between 15 real time RT-PCR assay C t's and matching microarray intensities for the six MSQ genes after log10 transformation of the data. Microarray intensities and matching C t's from samples obtained at 150 days were included in this analysis. A strong relationship between RT-PCR C t's and matching microarray intensities was also demonstrated by a significant (P < 0.0001) Pearson correlation coefficient of 0.80. Note that RT-PCR data substantiates or supports, in part, the microarray data used to generate the gene expression ratios (Table 5).
Gene expression in middle (MSQ) and outer (OSQ) subcutaneous adipose in growing pigs that is not influenced by age: real time RT-PCR crossing points (CP = Ct) and gene expression ratios (ratios)

JAK1 = Janus kinase 1 (a protein tyrosine kinase); NRIH2 = nuclear receptor subfamily 1, group H, member 2; SMAD4 = SMAD family member 4 (MADH4); SMAD1 = mothers against decapentaplegic homolog 1 (MADH1); TCF7L1 = HMG-box transcription factor TCF3; HIPK3 = homeodomain-interacting protein kinase; NR3C1 = glucocorticoid receptor alpha; PPARγ = peroxisome proliferator activated receptor gamma.
C t values are means ± s.d. of three pigs at 90 and 210 days. C t's were normalized by subtracting 18S values before the calculation of the C t means. C t s are inversely correlated with gene expression, that is, lower C t s indicate greater gene expression.
*P-values >0.50, **P-values >0.30 determined by pair-wise fixed reallocation randomization test within REST©.
Age-dependent gene expression in MSQ in growing pigs
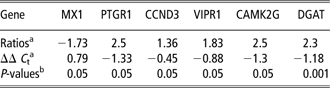
Expression ratios and associated ΔΔ C t's revealed age-dependent increases in expression of PTGR1, CCND3, VIPR1, CAMK2G and HSF1 in the MSQ depot between 90 and 210 days (Table 6). In contrast, adipose tissue MX1 expression decreased in the MSQ depot between 90 and 210 days (Table 6).
Gene expression influenced by age between 90 and 210 days in middle subcutaneous (MSQ) adipose tissue in growing pigs: real time RT-PCR analysis
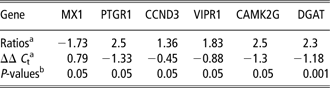
MX1 = myxovirus_(influenza) resistance 1, homolog of murine; PTGR1 = prostaglandin reductase 1; CCND3 = cyclin D3; VIPR1 = vasoactive intestinal peptide receptor; CAMK2γ = calcium/calmodulin-dependent protein kinase II gamma; DGAT = diacylglycerol acyltransferase.
aExpression ratios and associated ΔΔ C t's for MSQ adipose tissue samples collected from day 90 (n = 3) and 210 days (n = 3) old pigs, normalized to the endogenous control 18S and calculated by the software tool REST© (Relative Expression Software Tool).
bP-values determined by pair-wise fixed reallocation randomization test within REST©.
Age-dependent gene expression in OSQ in growing pigs
Expression ratios and associated ΔΔ C t's revealed age-dependent decreases in PGRMC1, REA and UCP2 expression in the OSQ depot between 90 and 210 days (Table 7). These parameters also demonstrated that adipose tissue PSME1 expression increased in the OSQ depot between 90 and 210 days (Table 7). Microarray data expression ratios of 0.8 and 0.72 between 90 and 210 days in the OSQ depot for two ‘steroid membrane binding protein’ probes substantiated the decrease in PGRMC1 expression since the annotations are very similar.
Gene expression influenced by age in the outer (OSQ) adipose tissue in growing pigs: real time RT-PCR analysis

PMSE1 = proteasome (prosome, macropain) activator subunit 1 (PA28 α); PGRMC1 = progesterone receptor membrane component 1; REA = repressor of estrogen receptor activity (prohibitin 2); UCP-2 = uncoupling protein 2.
aExpression ratios and associated ΔΔ C t's for OSQ adipose tissue samples collected from day 90 (n = 3) and 210 days (n = 3) old pigs, normalized to the endogenous control 18S and calculated by the software tool REST© (Relative Expression Software Tool).
bP-values determined by pair-wise fixed reallocation randomization test within REST©.
Discussion
In this study, we examined gene expression of 104 regulatory factors including transcription factors, nuclear receptors, enzymes and other regulatory proteins in subcutaneous adipose tissue from growing pigs utilizing either gene microarrays, RT-PCR assays or a combination of gene microarrays and RT-PCR assays. This is the first global study of porcine adipose tissue regulatory factors since the most ambitious of previous studies of porcine adipose tissue regulatory factors were limited to fewer than 10 genes (Ding et al., Reference Ding, McNeel and Mersmann1999; McNeel et al., Reference McNeel, Ding, Smith and Mersmann2000; McNeel and Mersmann, Reference McNeel and Mersmann2000). In this study we report, for the first time, gene expression of 16 non-secreted regulatory factors in subcutaneous adipose tissue from growing pigs. These included JAK1, NR1H2, SMAD4, SMAD, TCF7L1, HIPK3, NR3C1, REA, PGRMC1, CCND3, PTGR1 and HSF1. Furthermore, this is the first report of adipose tissue expression for six of these factors regardless of species. Therefore, our collective results indicate that many known and novel adipose tissue regulatory factors are indeed expressed by pig adipose tissue where they may be involved in development and metabolism.
Several studies have demonstrated a positive association between adipose tissue leptin gene expression and C/EBPα (Miller et al., Reference Miller, De Vos, Guerre-Millo, Wong, Hermann, Staels, Briggs and Auwerx1996; Krempler et al., Reference Krempler, Breban, Oberkofler, Esterbauer, Hell, Paulweber and Patsch2000) and PPARγ (Bastard et al., Reference Bastard, Hainque, Dusserre, Bruckert, Robin, Vallier, Perche, Robin, Turpin, Jardel, Laville, Forest and Vidal1999) gene expression or C/EBPα protein expression (Chen et al., Reference Chen, Dean and Hausman1999). In this study, expression of C/EBPα in adipose tissue was not associated with leptin gene expression, whereas expression of PPARγ and several other transcription factors were associated with leptin expression. Transcription related genes were nearly all positively associated with leptin expression, that is, TCF7L1, nuclear receptor co-repressors (NCOR1), HSF1, PPARγ, GTF12, LRP6 and REA, whereas HIPK3 was negatively associated with leptin expression. The positive association of negative acting transcription related regulatory factors, that is, NCOR1, HSF1, GTF12, LRP6 and prohibitin with leptin expression was unexpected and unique, whereas a positive association of PPARγ expression with leptin expression has been reported (Bastard et al., Reference Bastard, Hainque, Dusserre, Bruckert, Robin, Vallier, Perche, Robin, Turpin, Jardel, Laville, Forest and Vidal1999).
Associations of leptin associated genes with expression of adipogenic genes and physiological changes in adipose tissue demonstrated unexpected relationships or associations. Seven genes positively associated with leptin were negatively associated with AFABP or AFABP and LPL. Several of these factors, that is, LRP6, (Kawai et al., Reference Kawai, Mushiake, Bessho, Murakami, Namba, Kokubu, Michigami and Ozono2007), NCOR1 (Powell et al., Reference Powell, Kuhn and Xu2007), TCF7L1 (Farmer, Reference Farmer2006; Prestwich and MacDougald, Reference Prestwich and MacDougald2007) and HSF1 (Liu et al., Reference Liu, Choi and Bae-Lee1990) are known to negatively influence adipogenesis which would be consistent with a negative relationship with AFABP and LPL. Furthermore, upregulation of NCOR1 and nuclear receptor co-activators (NCOA1) in adipose tissue from fasted pigs (Lkhagvadorj et al., Reference Lkhagvadorj, Qu, Cai, Couture, Barb, Hausman, Nettleton, Anderson, Dekkers and Tuggle2010) and associations of NCOA1 with pig intramuscular adipose tissue have been reported (Wang et al., Reference Wang, Xue, Wang, Liu, Xu, Zhao, Jiang, Dodson and Chen2009). It is important to note that none of the genes negatively associated with leptin (except LEPR) were significantly associated with LPL and AFABP. Possibly, these negative associations indicate that local leptin decreases or antagonizes adipogenesis. This contention is supported by in vitro studies that deomonstrate leptin inhibition of lipogenesis in porcine adipocytes (Ramsay, Reference Ramsay2003 and Reference Ramsay2004). Furthermore, it is important to note that LPL and ADD1 were negatively correlated with leptin, whereas AFABP expression was not correlated with leptin. LRP6 (Kawai et al., Reference Kawai, Mushiake, Bessho, Murakami, Namba, Kokubu, Michigami and Ozono2007), NCOR1 (Powell et al., Reference Powell, Kuhn and Xu2007), TCF7L1 (Farmer, Reference Farmer2006; Prestwich and MacDougald, Reference Prestwich and MacDougald2007), HSF1 (Liu et al., Reference Liu, Choi and Bae-Lee1990) and prohibitin 2 (Mishra et al., Reference Mishra, Murphy and Murphy2006) were negatively associated with LPL, AFABP and ADD1 consistent with their inhibitory influence on adipogenesis. In general, locally produced leptin may antagonize or inhibit adipogenesis at the local level consistent with the ability of leptin to antagonize adipogenesis at the central level by inhibiting feed intake.
It is important to consider the unique and original observations of age-related expression of several genes in porcine adipose tissue. For instance, utilizing RT-PCR assays and microarray analysis, we demonstrated upregulation of PTGR1, also known as 15-oxoprostaglandin 13-reductase among other names, with age in the MSQ. PTGR1 was upregulated to the greatest degree of all upregulated genes in the MSQ. This is the first report of an association between PTGR1 gene expresssion and adipogenesis or leptin gene expression. In swine tissues, PTGR1 catalyzes the NADH/NADPH dependent reduction of the Δ13 double bond of 15-ketoprostaglandins to yield 15-keto-13,14-dihydroprostaglandins and results in a further reduction of the biological activities of prostaglandins (Anggard et al., Reference Anggard, Larsson and Samuelsson1971). Enzyme assays detected PTGR1 activity in a number of swine tissues, but adipose tissue contained the highest PTGR1 specific activity (Anggard et al., Reference Anggard, Larsson and Samuelsson1971). It is important to consider information on another prostaglandin reductase, that is, PTGR2, which is also a 15-oxoprostaglandin 13-reductase (Chou et al., Reference Chou, Chuang, Chou, Wang, Lawson, FitzGerald and Chang2007) as both PTGR1 and PTGR2 are predominantly distributed in adipose tissue and both catalyze the NADH/NADPH dependent reduction of the Δ13 double bond of 15-ketoprostaglandins to yield 15-keto-13,14-dihydroprostaglandins which results in a further reduction of the biological activities of prostaglandins. Furthermore, mouse PTGR2 protein has 40% amino acid sequence identity with mouse PTGR1 and human PTGR1 (Chou et al., Reference Chou, Chuang, Chou, Wang, Lawson, FitzGerald and Chang2007). In addition, pig PTGR1 (NM_214385) has 97% query coverage and 82% max identity to human PTGR1 (NM_012212.2), when BLASTed against the human Genome and has 83% query coverage and 81% max identity to mouse PTGR1 (NM_025968.3), when BLASTed against the mouse genome. PTGR2 catalyzes the reaction converting 15-keto-PGE2 to 13,14-dihydro-15-keto-PGE2 (Chou et al., Reference Chou, Chuang, Chou, Wang, Lawson, FitzGerald and Chang2007). A unique aspect of PTGR2 action was revealed in studies that indicated a unique link between PGE2 catabolism and regulation of ligand-induced PPAR gamma activation of adipogenesis (Chou et al., Reference Chou, Chuang, Chou, Wang, Lawson, FitzGerald and Chang2007). For instance, overexpression of PTGR2 represses transcriptional activity of PPARG and inhibits 3T3-L1 adipocyte differentiation (Chou et al., Reference Chou, Chuang, Chou, Wang, Lawson, FitzGerald and Chang2007). These observations on PTGR2 coupled with the age-associated increase in adipose tissue PTGR1 in this study may indicate that PTGR1 may have a role in adipogenesis in porcine adipose tissue. However, further research is necessary to validate this claim.
Cyclin D (CCND3) expression increased with age in porcine MSQ to a lesser extent than PTGR1 and several other genes. Regardless, several studies indicate cyclin D may be involved in adipogenesis. For instance, Hishida et al. (Reference Hishida, Naito, Osada, Nishizuka and Imagawa2008) concluded that cyclin D2 may play a crucial role in adipogenesis in 3T3 L1 studies. Furthermore, cyclin D3 promoted adipogenesis in 3T3-L1 preadipocyte cultures by activating PPARγ (Sarruf et al., Reference Sarruf, Iankova, Abella, Assou, Miard and Fajas2005). In primay porcine stromal-vascular cell cultures, cyclin D1 was co-localized with C/EBPα in the nuclei of preadipocytes during and after differentiation (Kim et al., Reference Kim, Hausman, Hausman, Martin and Dean2001).
Gene expression was generally lower and decreased with age to a greater extent in the OSQ than in the MSQ. Gene expression ratios showed that the relative expression of many regulatory genes were lower in the OSQ depot. Although the hormonal and nutritional regulation of UCP-2 and UCP-3 protein and mRNA in pig adipose tissue (Damon et al., Reference Damon, Vincent, Lombardi and Herpin2000; Ramsay and Rosebrough, Reference Ramsay and Rosebrough2005; Ramsay and Mitchell, Reference Ramsay and Mitchell2008) has been studied the influence of age on expression of UCP-2 or REA has not been evaluated. Direct evidence showed that repressor of estrogen receptor activity, REA and UCP2 expression decreased with age in the OSQ during several time periods. The overall decrease in gene expression in the OSQ is consistent with a decreased metabolic activity and smaller adipocytes in the OSQ v. the MSQ (Anderson et al., Reference Anderson, Kauffman and Kastenschmidt1972). In particular, UCP2 and prohibitin are associated with mitochondria indicating a reduced oxidative activity with age in the OSQ. In conclusion, early in development OSQ may play a role in thermogenesis, somewhat as brown adipose tissue, (review, Klein et al., Reference Klein, Permana, Owecki, Chaldakov, Bohm, Hausman, Lapiere, Atanassova, Sowinski, Fasshauer, Hausman, Maquoi, Tonchev, Peneva, Vlachanov, Fiore, Aloe, Slominski, Reardon, Ryan, Pond and Ryan2007) but based on this study, this function diminishes with age in pigs.
However, the functional anatomical role of OSQ (review, Klein et al., Reference Klein, Permana, Owecki, Chaldakov, Bohm, Hausman, Lapiere, Atanassova, Sowinski, Fasshauer, Hausman, Maquoi, Tonchev, Peneva, Vlachanov, Fiore, Aloe, Slominski, Reardon, Ryan, Pond and Ryan2007) seems to increase with age. For instance, in these studies connective tissue growth factor (CTGF) increased considerably with age in the OSQ (Hausman et al., Reference Hausman, Barb and Dean2008). Many aspects of connective tissue development are enhanced by CTGF indicating that connective tissue development is inversely correlated with adipose tissue development and metabolism in the OSQ. In a related study, young female mice experienced a rapid thickening of subcutaneous tissue (little fat) when exposed to male mice. The cause of this response seemed to be an enhanced secretion of ovarian estrogen (Bronson, Reference Bronson1979). In our study, CTGF increased markedly, whereas REA decreased in OSQ. Therefore, indirect evidence indicates that estrogen may increase connective tissue preferentially in the OSQ.
Acknowledgements
This research was supported by United States Department of Agriculture funds. The authors wish to thank J. Gamble and L. Lee-Rutherford for their technical assistance. Mention of a trade name, proprietary product, or specific equipment does not constitute a guarantee or warranty by the US Department of Agriculture and does not imply its approval to the exclusion of other products which may be suitable.