Introduction
Antidepressants are the cornerstone of acute and long-term treatment for major depressive disorder (MDD). At present, there are four primary classes of antidepressants available on the US market. They are distinguished by their mechanisms of action (MOAs): selective serotonin reuptake inhibitors (SSRIs), serotonin–norepinephrine reuptake inhibitors (SNRIs), tricyclic antidepressants (TCAs), and monoamine oxidase inhibitors (MAOIs). Each class has multiple representatives available from different manufacturers. In addition, there are other (‘atypical’) antidepressants with alternative MOAs that do not belong in these primary classes, such as bupropion (a dopamine–norepinephrine reuptake inhibitor) and mirtazapine (an α2 adrenergic receptor antagonist). These atypical antidepressants are often prescribed as an alternative or adjunct to the primary classes because of their superior sexual side-effect profiles (Serretti & Chiesa, Reference Serretti and Chiesa2009; Frost et al. Reference Frost, Sandvik and Spigset2010).
Clinical trials suggest that only 50–60% of patients with uncomplicated MDD respond to any single antidepressant (Papakostas & Fava, Reference Papakostas and Fava2009), and general clinical experience suggests even lower response rates (Kirchheiner et al. Reference Kirchheiner, Nickchen, Bauer, Wong, Licinio, Roots and Brockmoller2004; Souery et al. Reference Souery, Oswald, Massat, Bailer, Bollen, Demyttenaere, Kasper, Lecrubier, Montgomery, Serretti, Zohar and Mendlewicz2007). Compounding the difficulty of identifying successful treatment, antidepressant use is frequently associated with adverse drug reactions, with the inability to tolerate side-effects being the most common reason for discontinuing antidepressant therapy (Maddox et al. Reference Maddox, Levi and Thompson1994; Bull et al. Reference Bull, Hu, Hunkeler, Lee, Ming, Markson and Fireman2002a, Reference Bull, Hunkeler, Lee, Rowland, Williamson, Schwab and Hurtb; Mitchell, Reference Mitchell2006). Clinicians currently have no way to predict individual efficacy and side-effect profiles, and trial-and-error switching often leaves MDD patients in psychological distress for weeks or months. Clearly, improved methods of patient–antidepressant matching to minimize side-effects would greatly improve depression treatment.
Studies have consistently indicated that antidepressant response is substantially heritable (Pare & Mack, Reference Pare and Mack1971; Oreilly et al. Reference Oreilly, Bogue and Singh1994; Franchini et al. Reference Franchini, Serretti, Gasperini and Smeraldi1998; Malhotra et al. Reference Malhotra, Murphy and Kennedy2004), suggesting that pharmacogenomic approaches represent a particularly promising avenue toward individualizing antidepressant treatment. Preliminary pharmacogenetic research has, for example, suggested an important role for genes related to serotonin function in antidepressant side-effects (Kato & Serretti, Reference Kato and Serretti2010; Zobel & Maier, Reference Zobel and Maier2010; Porcelli et al. Reference Porcelli, Drago, Fabbri, Gibiino, Calati and Serretti2011). The serotonergic system is involved in the regulation of many physiological functions that are disturbed in depression, including neuroendocrine mechanisms regulating reproductive events such as ovulation, spermatogenesis and sexual behavior (Segraves, Reference Segraves1989; Pollack et al. Reference Pollack, Reiter and Hammerness1992; Ayala, Reference Ayala2009; Kato & Serretti, Reference Kato and Serretti2010; Zobel & Maier, Reference Zobel and Maier2010). However, to date, robust consistent evidence implicating any specific candidate gene or polymorphism to antidepressant side-effect response has been rare. More generally, candidate gene approaches are inherently restricted by our current, limited knowledge of the biological mechanisms underlying depression and antidepressant MOAs. Methods that systematically screen variants across the whole genome for association with antidepressant side-effects are therefore crucial to discovering relevant variants in novel genes. Furthermore, such approaches have begun to yield tangible results, with the number of new replicated marker–disease associations increasing dramatically since the introduction of genome-wide association studies (GWAS; Altshuler et al. Reference Altshuler, Daly and Lander2008), and some initial applications in the context of drug response (Byun et al. Reference Byun, Caillier, Montalban, Villoslada, Fernandez, Brassat, Comabella, Wang, Barcellos, Baranzini and Oksenberg2008; Link et al. Reference Link, Parish, Armitage, Bowman, Heath, Matsuda, Gut, Lathrop and Collins2008; Liu et al. Reference Liu, Batliwalla, Li, Lee, Roubenoff, Beckman, Khalili, Damle, Kern, Furie, Dupuis, Plenge, Coenen, Behrens, Carulli and Gregersen2008a; Lavedan et al. Reference Lavedan, Licamele, Volpi, Hamilton, Heaton, Mack, Lannan, Thompson, Wolfgang and Polymeropoulos2009; Aberg et al. Reference Aberg, Adkins, Bukszar, Webb, Caroff, Miller, Sebat, Stroup, Fanous, Vladimirov, McClay, Lieberman, Sullivan and van den Oord2010a, Reference Aberg, Adkins, Liu, McClay, Bukszar, Jia, Zhao, Perkins, Stroup, Lieberman, Sullivan and van den Oordb; Adkins et al. Reference Adkins, Aberg, McClay, Bukszar, Zhao, Jia, Stroup, Perkins, McEvoy, Lieberman, Sullivan and van den Oord2011; McClay et al. Reference McClay, Adkins, Aberg, Bukszar, Khachane, Keefe, Perkins, McEvoy, Stroup, Vann, Beardsley, Lieberman, Sullivan and van den Oord2011a, Reference McClay, Adkins, Aberg, Stroup, Perkins, Vladimirov, Lieberman, Sullivan and van den Oordb).
In this study, we used a GWAS approach to search for genetic variation affecting the susceptibility for antidepressant-induced side-effects. Our study sample consisted of the 1439 MDD patients who did not respond to citalopram-only treatment from the Sequenced Treatment Alternatives to Relieve Depression (STAR*D) study (Rush et al. Reference Rush, Fava, Wisniewski, Lavori, Trivedi, Sackeim, Thase, Nierenberg, Quitkin, Kashner, Kupfer, Rosenbaum, Alpert, Stewart, McGrath, Biggs, Shores-Wilson, Lebowitz, Ritz and Niederehe2004). The drug-specific analyses were performed on the four primary side-effect dimensions indicated by factor analyses of a battery of 35 side-effect indicators (Rush et al. Reference Rush, Fava, Wisniewski, Lavori, Trivedi, Sackeim, Thase, Nierenberg, Quitkin, Kashner, Kupfer, Rosenbaum, Alpert, Stewart, McGrath, Biggs, Shores-Wilson, Lebowitz, Ritz and Niederehe2004).
Method
STAR*D
Subjects came from the STAR*D study, which has been described in detail elsewhere (Rush et al. Reference Rush, Fava, Wisniewski, Lavori, Trivedi, Sackeim, Thase, Nierenberg, Quitkin, Kashner, Kupfer, Rosenbaum, Alpert, Stewart, McGrath, Biggs, Shores-Wilson, Lebowitz, Ritz and Niederehe2004). In brief, STAR*D is a multistage trial of different treatment options for patients with non-psychotic MDD. STAR*D enrolled a total 4041 out-patients with MDD (Wisniewski et al. Reference Wisniewski, Rush, Balasubramani, Trivedi and Nierenberg2006). In level 1, patients were given citalopram. Those patients who did not have an efficacious response, or could not tolerate side-effects, to citalopram only were then randomized to other treatment options in other levels, 2a or 2–4. Other treatment options included, but were not limited to, sertraline, bupropion, buspirone, cognitive therapy, various combinations of these treatments, and using one of these treatments in combination with citalopram. This study focuses exclusively on the 1439 patients who did not benefit from citalopram only and those treatment options with at least 100 patients, which were bupropion, buspirone, sertraline, venlafaxine, citalopram+bupropion and citalopram+buspirone. The results of a GWAS of the side-effects for the citalopram treatment options will be presented in a separate publication (Adkins et al., unpublished observations).
Measures
Side-effect presence and tolerance were measured by the Patient Rated Inventory of Side-Effects (PRISE; Rush et al. Reference Rush, Fava, Wisniewski, Lavori, Trivedi, Sackeim, Thase, Nierenberg, Quitkin, Kashner, Kupfer, Rosenbaum, Alpert, Stewart, McGrath, Biggs, Shores-Wilson, Lebowitz, Ritz and Niederehe2004). For each of the eight biological systems assessed (gastrointestinal, heart, skin, nervous system, vision/hearing, genital/urinary, sleep and sexual functioning), patients were asked two types of questions, one relating to specific side-effects (e.g. dry mouth, heart palpitations) and one relating to the overall tolerability of side-effects for a given biological system. For the specific side-effects, patients were asked to indicate whether the side-effect was present (0=no side-effect, 1=side-effect present). There were four items for the gastrointestinal system, three for the heart system, four for skin, four for the nervous system, two for vision/hearing, four for the genital/urinary system, two for sleep and four for sexual functioning. In addition, an overall score of side-effect tolerability was given for each of the eight biological systems as a trichotomous item with the follow categories: 0=no side-effects, 1=tolerable side-effects, 2=distressing side-effects (Wisniewski et al. Reference Wisniewski, Rush, Balasubramani, Trivedi and Nierenberg2006).
Side-effect phenotype specification
Specifying side-effect phenotypes for the GWAS proceeded in two steps. The first was to condense the 35 side-effect indicators of the PRISE using factor analysis, thereby improving measurement by identifying the latent phenotypic constructs underlying the battery of side-effect indicators (Bollen, Reference Bollen1989; Loehlin, Reference Loehlin2004). The second was to estimate the treatment effects for each drug based on the factor scores obtained (van den Oord et al. Reference van den Oord, Adkins, McClay, Lieberman and Sullivan2009).
Factor analysis
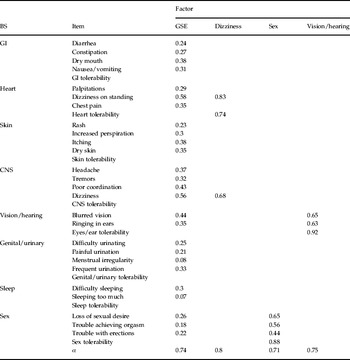
Using Mplus 6.0 (Muthén & Muthén, 1998–Reference Muthén and Muthén2010), exploratory factor analyses were conducted to examine the factor structure of the 35 side-effect indicators of the PRISE scale. Of the several potential factors emerging from the exploratory analyses, four were retained based on overall fit to the data, interpretability, and having a Cronbach's α >0.70, which indicates good reliability of the factor (Nunnally & Bernstein, Reference Nunnally and Bernstein1994). The four factors were: (1) a general side-effect burden factor in which all of the symptom measures served as factor indicators, (2) a sexual factor, (3) a dizziness factor, and (4) a factor relating to vision/hearing. Once the optimal factor structure was determined, factor scores for each of the four factors were calculated using the standard regression scoring approach. The factor loadings and Cronbach's α for each factor are displayed in Table 1.
Factor loadings for side-effect factors

BS, Biological system; GSE, general side-effect; GI, gastrointestinal; CNS, central nervous system.
The factor analysis results presented in Table 1 were based on all observations for an individual irrespective of treatment or time spent on a treatment. Given that side-effects vary by antidepressant and number of days taking a specific drug (Demyttenaere et al. Reference Demyttenaere, Albert, Mesters, Dewe, De Bruyckere and Sangeleer2005), additional factor analyses were performed that divided the STAR*D sample based on which treatment a patient was given and the number of days on a given treatment. This was done to confirm that the factor solution was robust across drugs and treatment duration, and not artifactual due to heterogeneity across time or drug. Another confounding issue in treatment with antidepressants is the presence of anxiety because individuals with anxiety disorders often present with symptoms similar to depression (e.g. irritability, sleeping problems, etc.), anxiety and depression often co-occur, and most importantly, perception of the presence and severity of side-effects could potentially be influenced by anxiety independently of actual side-effects (Barbee, Reference Barbee1998; Regier et al. Reference Regier, Rae, Narrow, Kaelber and Schatzberg1998). Thus, the factor analyses discussed above were repeated controlling for anxiety status. Similar factors emerged with similar patterns of loadings when the sample was broken down by treatment, days on drug and when controlling for anxiety. Because all factor structures were similar to what was found in the overall factor analysis, the sensitivity results are not presented here (available upon request).
Estimating treatment effects
To maximize power for the GWAS, we developed a method to estimate treatment effects from all available information (van den Oord et al. Reference van den Oord, Adkins, McClay, Lieberman and Sullivan2009) using mixed modeling (Searle et al. Reference Searle, Casella and McCulloch1992; Goldstein, Reference Goldstein1995). Our method first determines the optimal functional form of over-time drug response, then screens many possible covariates to select those that improve the precision of the treatment effect estimates, and finally generates the individual treatment effect estimates based on the best-fitting model using best linear unbiased predictors (BLUPs; Pinheiro & Bates, Reference Pinheiro and Bates2000). As this approach takes advantages of all available information in STAR*D, it results in more precise estimates than traditional approaches that estimate treatment effects using only two assessments (e.g. subtracting pre- from post-treatment observations).
Specifically, to determine the optimal model of over-time drug response for each side-effect outcome, we fit a series of models specifying linear change for a given number of days on drug and flat thereafter. This series began with a model assuming that maximal drug response was achieved at day 1. Each subsequent model specified an incrementally longer duration until maximal drug response was achieved, with the final model assuming that the drug effect did not plateau (i.e. linear change throughout the trial). The function produced by the log likelihoods of this series was then optimized to determine the best estimate of the average number of days until maximal drug response. This duration varied across side-effect outcomes with dizziness plateauing earliest (36 days on drug), and sexual and general side-effect burden plateauing latest (130 and 137 days on drug respectively).
After determining the optimal functional form of over-time drug response, 55 covariates were screened to identify those that improved the precision of the treatment effect estimates, using a criterion based on reduction in residual error variance relative to treatment random effect variance (Adkins et al. Reference Adkins, Aberg, McClay, Bukszar, Zhao, Jia, Stroup, Perkins, McEvoy, Lieberman, Sullivan and van den Oord2011). Screened covariates consisted of trial design characteristics, sociodemographic measures, clinical information, health care access and reason for study exit. The number of selected covariates ranged from six for vision/hearing and sexual side-effects to seven for general side-effect burden and dizziness. Design characteristics and concurrent psychiatric diagnoses (particularly drug and/or alcohol abuse and hypochondriasis) were the most commonly selected covariates.
Finally, treatment effects were generated by using a unique feature of the mixed model–random effects. To elaborate briefly, the mixed model estimates two types of parameters, coefficients that describe the predictors' average effects for the full sample (i.e. fixed effects) and deviations from the average effects for each subject (i.e. random effects). Thus, for each of the antidepressants investigated, we were able to output treatment effects as random drug effects. Intuitively, these treatment effects quantify how much each subject's side-effect phenotype changes in response to a given drug, relative to the average effect for all subjects who took the drug. Treatment effects estimated in the manner described here have been published previously, both in GWAS of the STAR*D data (Adkins et al. Reference Adkins, Aberg, McClay, Hettema, Kornstein, Bukszar and van den Oord2010) and in several CATIE (Clinical Antipsychotic Trials of Intervention Effectiveness) schizophrenia clinical trial GWAS (Aberg et al. Reference Aberg, Adkins, Liu, McClay, Bukszar, Jia, Zhao, Perkins, Stroup, Lieberman, Sullivan and van den Oord2010b; Adkins et al. Reference Adkins, Aberg, McClay, Bukszar, Zhao, Jia, Stroup, Perkins, McEvoy, Lieberman, Sullivan and van den Oord2011; McClay et al. Reference McClay, Adkins, Aberg, Bukszar, Khachane, Keefe, Perkins, McEvoy, Stroup, Vann, Beardsley, Lieberman, Sullivan and van den Oord2011a, Reference McClay, Adkins, Aberg, Stroup, Perkins, Vladimirov, Lieberman, Sullivan and van den Oordb).
Genotyping, quality control, and ancestral background
Details of the STAR*D genotyping and quality control methods have been described previously (Garriock et al. Reference Garriock, Kraft, Shyn, Peters, Yokoyama, Jenkins, Reinalda, Slager, McGrath and Hamilton2010). In brief, approximately half the sample was genotyped on the Affymetrix Human Mapping 500k Array Set, and the other half was genotyped using the Affymetrix Genome-Wide Human Array 5.0. Both versions genotype the same set of single nucleotide polymorphisms (SNPs), the only difference being that the later 5.0 version accomplishes this with a single microarray rather than a set of two arrays. SNPs with minor allele frequencies <1% or call rates <95% were excluded. We included individuals regardless of race/ethnicity and thus did not test for Hardy–Weinberg equilibrium within specific ethnic groups. PLINK (Purcell et al. Reference Purcell, Neale, Todd-Brown, Thomas, Ferreira, Bender, Maller, Sklar, De Bakker, Daly and Sham2007) was used to identify 89 potential genotype–clinical sex disagreements, which were excluded from analysis. Although the sex disagreement default settings are very conservative, this ensures that no unambiguous data are included in the statistical analysis. In total, we analyzed 421 789 SNPs from 1439 subjects with a successful genotyping rate of 99.6%.
Association testing and false discovery rate (FDR) control
All association testing was conducted in PLINK (Purcell et al. Reference Purcell, Neale, Todd-Brown, Thomas, Ferreira, Bender, Maller, Sklar, De Bakker, Daly and Sham2007) using a linear regression model with five population stratification multidimensional scaling (MDS) dimensions as covariates to control for ancestry. We used an FDR-based approach (Benjamini & Hochberg, Reference Benjamini and Hochberg1995) to declare significance. In comparison to controlling a family-wise error rate (e.g. Bonferroni correction), FDR (a) provides a better balance between finding true effects versus controlling false discoveries, (b) results in comparable standards for declaring significance across studies because it does not depend directly on the number of tests, and (c) is relatively robust against having correlated tests (Brown & Russell, Reference Brown and Russell1997). FDR is commonly used in many high-dimensional applications and has been successfully applied in the context of GWAS (Lei et al. Reference Lei, Yang, Tan, Chen, Guo, Guo, Zhang, Liu, Yan, Pan, Zhang, Peng, Zhou, He, Zhu, Cheng, Liu, Papasian and Deng2009; Liu et al. Reference Liu, Guo, Wang, Tan, Liu, Pei, Yan, Xiong, Deng, Yu, Zhang, Zhang, Lei, Chen, Liu, Zhu, Levy, Papasian, Drees, Hamilton, Recker and Deng2009; Beecham et al. Reference Beecham, Martin, Li, Slifer, Gilbert, Haines and Pericak-Vance2009). We set an FDR threshold of 0.05 for declaring genome-wide significance and 0.10 for declaring suggestive findings. This means that, on average, 5% of the SNPs declared significant are expected to be false discoveries. Operationally (Black, Reference Black2004), FDR was controlled using q values, which are FDRs calculated using the p value of the markers as thresholds for declaring significance (Storey, Reference Storey2003; Storey & Tibshirani, Reference Storey and Tibshirani2003), and can be described as:

where π0 is an estimate of the proportion of null associations, p is the observed p value, P is a random normally distributed variable, H 0 is the null hypothesis that the SNP–side-effect association β=0, and H 1 is the alternative hypothesis that β≠0. Thus, the numerator equals the product of the proportion of null associations×the observed p value; and the denominator is the weighted sum of the probability of obtaining a test statistic at least as extreme as the one observed, given the null hypothesis, and of the probability of obtaining a test statistic at least as extreme as the one observed given the alternative hypothesis, weighted by the proportion of null associations (see Storey, Reference Storey2003 for formal derivation). Although π0 may be empirically estimated, we have assumed the most conservative value π0=1; thus the formula simplifies to the observed p value divided by the probability of obtaining a test statistic at least as extreme as the one observed given the null hypothesis.
For the most promising SNPs, we performed a variety of additional analyses to examine the robustness of the signal. First, we tested the SNPs separately in the subjects who self-identified as European American (EA) only and African American (AA) only. Next, to consider to what extent SNP effects are present in other side-effect domains, we analyzed whether genome-wide significant SNPs were associated, at less stringent significant levels (p<0.05), for other side-effect measures. Although it is possible that SNP effects are side-effect factor specific, observing associations with multiple outcomes excludes the possibility of significant effects due to outcome-specific outliers and may be informative from a clinical perspective. In addition, for each SNP, we performed haplotype (proxy) analyses that incorporate information from other SNPs in that region. Such analyses may provide a technical validation of the single SNP result or point to a particularly informative haplotype.
Results
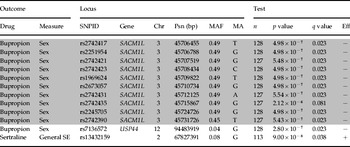
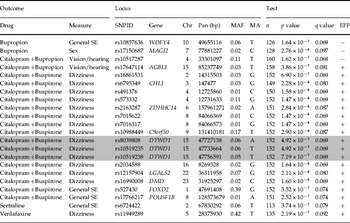
Table 2 provides details on those SNPs that were genome-wide significant (q value <0.05) and Table 3 provides details on those SNPs that were suggestive findings (0.05<q value <0.10). The Quantile–Quantile (QQ) plots and p values for each outcome variable are available for download at www.pharmacy.vcu.edu/biomarker. Fig. 1 shows QQ plots for the top hits discussed below. The plots show that the distribution of p values from the GWAS are generally on a straight line, indicating the expected p value distribution under the null hypothesis assuming no effects of the markers. However, in each of these three plots, there is also evidence that markers in the right upper corner have p values smaller than would be expected under the null hypothesis, suggesting a true association between these markers and the outcome variable. The plots also display λ values (that is, the ratio of the median observed p value of the distribution to the expected p value under the null hypothesis) approximately equal to 1, indicating no systematic test statistic inflation.
Quantile–Quantile (QQ) plots for three outcomes showing strong association in genome-wide association studies (GWAS) results.

Significant GWAS results with q values <0.05

GWAS, Genome-wide association study; SNP, single nucleotide polymorphism; Chr, chromosome number; Psn, position; MAF, minor allele frequency; MA, minor allele; n, sample size; Eff, direction of the effect of minor allele; SE, side-effect.
Locus information includes Chr and location of SNP (bp, Genome Build 35). For each test, we report n, Eff, where a ‘+’ means a higher factor score, and the p and q values of the test. Shaded rows indicate SNPs in high linkage disequilibrium (LD; r 2>0.8) with each other.
Suggestive GWAS results with q values between 0.05 and 0.10

GWAS, Genome-wide association study; SNP, single nucleotide polymorphism; Chr, chromosome number; Psn, position; MAF, minor allele frequency; MA, minor allele; n, sample size; Eff, direction of the effect of minor allele; SE, side-effect.
Locus information includes Chr and location of SNP (bp, Genome Build 35). For each test, we report n, Eff, where a ‘+’ means a higher factor score, and the p and q values of the test. Shaded rows indicate SNPs in high linkage disequilibrium (LD; r 2>0.8) with each other.
The top significant findings include a cluster of 10 SNPs spanning ~25 kb on chromosome 3, as highlighted in gray in Table 2. All 10 SNPs were situated within the boundary of the gene SACM1L, and were found to moderate bupropion's effect on sexual adverse reactions. Because there were multiple signals located close to one another in this gene, Haploview (Barrett et al. Reference Barrett, Fry, Maller and Daly2005) was used to visualize the linkage disequilibrium (LD). In Fig. 2, which shows the LD heat map for the 10 significant SNPs, we can see that all 10 SNPs are in very high LD with one another, with the lowest r 2 value being 0.96. This suggests that they represent a single signal. To see the LD structure in the region around the 10 significant SNPs, we incorporated HapMap Version 3, Release 2 (International HapMap Consortium, 2005) with our data in our LD visualization as it includes finer mapping of this region than was done in the STAR*D sample. First, we examined the entire region encompassed by rs2742390 and rs2742417, the two extreme SNPs of the SACM1L hits in Table 2, ±100 kb of flanking sequence. We saw high LD in the region, for example r 2>0.80 from 45692 to 45767 kb (see online Supplementary Fig. S1), which implies that the causal variant could potentially be much further away from the SNPs indicated here.
Linkage disequilibrium (LD) heat map for 10 significant SACM1L gene findings. Heat maps depict the D′ for each pair of SNPs with white and blue indicating D′=0; shades of pink indicating 0<D′<1, with darker shades of pink indicating larger values of D′; and red indicating D′=1. Higher values of D′ indicate higher LD, with D′=1 indicating perfect LD. The figure displays the 10 SNPs in the gene SACM1L that were significant at the q<0.10 threshold. The numbers in each cell represent the pairwise D′ value and an empty cell means the pairwise D′=1, which indicates that the pair of SNPs is in perfect LD.

Suggestive findings in Table 3 involved bupropion and citalopram+buspirone respectively. The first involved rs17150687 on chromosome 7q21.1 (p value=2.76×10⁻⁶, q value=0.097) located within an intron of the gene MAGI2, which has a moderating effect between bupropion and sexual side-effects. The second involved rs6795349 on chromosome 3p26.3 (p value=2.28×10⁻⁶, q value=0.080), 60 kb away from the gene CHL1, which has a moderating effect between citalopram+buspirone and dizziness. Both of these signals had low minor allele frequency (MAF; 0.017 and 0.035 respectively) and were not in LD with any nearby SNPs. Given the reduced confidence due to low MAF and the lack of proxies to confirm the robustness of the signals, these two associations should be viewed only as suggestive.
Another suggestive SNPs in Table 3 is rs10857636 (p value=1.64×10⁻⁷, q value=0.069) on chromosome 10q11.2 located within an intron of the gene WDFY4, which moderates the effects between bupropion and general side-effect burden. Haplotype analysis did not improve the association signal in these findings presented here, except where noted earlier.
Discussion
To maximize the benefit of antidepressant therapy to the individual patient, not only should the most efficacious drug be prescribed at the time of first presentation but also the drug with the minimal side-effect profile. Understanding individual differences in the development of side-effects following antidepressant therapy is therefore essential to personalizing the treatment of depression. In this study, we performed GWAS on four side-effect factors including general side-effect burden, sexual adverse reactions, dizziness, and vision/hearing related side-effects. We detected 34 SNPs that, according to our pre-identified criteria (FDR controlled at 0.1 level), can be considered genome-wide significant or suggestive.
Our top findings involved 10 hits within the gene SACM1L, which negatively moderated the effect of the minor allele between bupropion and sexual side-effects. The phosphatidylinositide phosphatase SAC1 is encoded by the SACM1L gene. SAC1 is an integral membrane protein of the endoplasmic reticulum and the Golgi apparatus (Rohde et al. Reference Rohde, Cheong, Konrad, Paiha, Mayinger and Boehmelt2003) that plays a direct role in the growth factor signaling in both organelles and the Golgi trafficking (Blagoveshchenskaya et al. Reference Blagoveshchenskaya, Cheong, Rohde, Glover, Knodler, Nicolson, Boehmelt and Mayinger2008). Previous studies have shown that mutations in the SACM1L gene alter SAC1 enzymatic activity and organelle localization (Liu et al. Reference Liu, Boukhelifa, Tribble, Morin-Kensicki, Uetrecht, Bear and Bankaitis2008b). Disruptions in the cellular secretory machinery alter hormone and neurotransmitter secretion, which may lead to sexual dysfunction (Corona & Maggi, Reference Corona and Maggi2010). A MAGI2 SNP was the second top hit significantly associated with sexual side-effects during bupropion treatment. MAGI2 plays a role in neuronal migration and protein–protein interactions (Wright et al. Reference Wright, Leslie, Ariza-McNaughton and Lewis2004; Deng et al. Reference Deng, Price, Davis, Mori and Burgess2006), further suggesting that alterations in cellular trafficking may be associated with sexual side-effects during bupropion treatment. Of considerable interest is the report in a recent study (Berger et al. Reference Berger, Lawrence, Demichelis, Drier, Cibulskis, Sivachenko, Sboner, Esgueva, Pflueger, Sougnez, Onofrio, Carter, Park, Habegger, Ambrogio, Fennell, Parkin, Saksena, Voet, Ramos, Pugh, Wilkinson, Fisher, Winckler, Mahan, Ardlie, Baldwin, Simons, Kitabayashi, Macdonald, Kantoff, Chin, Gabriel, Gerstein, Golub, Meyerson, Tewari, Lander, Getz, Rubin and Garraway2011) that MAGI2 polymorphisms have been associated with prostate cancer, which is closely related to spermatogenesis.
For the SACM1L and MAGI2 findings, the minor allele effects were negative, suggesting a reduction in sexual side-effects during bupropion treatment for patients with these polymorphisms. As bupropion is widely known for its almost complete lack of sexual side-effects (Serretti & Chiesa, Reference Serretti and Chiesa2009), this initially counterintuitive finding requires further interpretation. Given that patients were taking a different antidepressant immediately prior to switching to bupropion, the effect we are observing is likely to reflect the presence of a protective polymorphism, which facilitates rebound from antidepressant-induced sexual side-effects, and perhaps generally increases libido, both of which are documented effects of bupropion in subgroups of subjects (Modell et al. Reference Modell, May and Katholi2000; Clayton et al. Reference Clayton, Warnock, Kornstein, Pinkerton, Sheldon-Keller and McGarvey2004). Our association findings implicating these genes as a moderator of sexual function during bupropion treatment, in addition to functional evidence indicating sexual dysfunction, make these genes compelling candidates for additional investigation.
Two genes that are among the suggestive hits in our results (Table 3) have been associated with psychiatric-related phenotypes in previous studies, but the gene function of each is unknown. Expression of the CHL1 gene, associated with dizziness during citalopram+buspirone treatment, has previously been found to be lower in a patient group with high paroxetine sensitivity (Morag et al. Reference Morag, Pasmanik-Chor, Oron-Karni, Rehavi, Stingl and Gurwitz2011), and CHL1 polymorphisms have also been associated with schizophrenia (Sakurai et al. Reference Sakurai, Migita, Toru and Arinami2002; Chen et al. Reference Chen, Chen, Feng, Lindpaintner, Chen, Sun, Chen, Gao, Tang and He2005). The WDFY4 gene, associated with general side-effect burden during bupropion treatment in our study, has previously been implicated in successful smoking cessation therapy using bupropion (Uhl et al. Reference Uhl, Liu, Drgon, Johnson, Walther, Rose, David, Niaura and Lerman2008). Given the current lack of information about these genes, no firm conclusions about the biological mechanisms underlying their putative drug–side-effect interaction can be drawn.
Currently, it is premature to suggest direct clinical applications of these findings for prescribing antidepressants. However, once the effects of these genes are replicated and the most useful variants identified, we can envision possible ways they might be applied. For example, bupropion has been supported in clinical trials as an adjunct treatment for SSRI-induced sexual dysfunction (Demyttenaere & Jaspers, Reference Demyttenaere and Jaspers2008; Safarinejad, Reference Safarinejad2010), with no information available to identify potential respondents. For those patients who need to stay on an SSRI because of its therapeutic efficacy for major depression or an anxiety disorder, polymorphisms in genes such as SACM1L and MAGI2 might be used to predict who could benefit from such trials. Similarly, some psychiatrists add buspirone to an SSRI such as citalopram, not only to potentially augment the antidepressant effects of the latter, as was intended in STAR*D, but also to treat co-occurring anxiety symptoms not adequately relieved with monotherapy (Harvey & Balon, Reference Harvey and Balon1995). As this increases the risk of side-effects such as dizziness, genotyping variants in a gene such as CHL1 might help to select patients who would tolerate such combination therapy.
Our findings must be interpreted in the context of two potential limitations. First, the assessment of side-effects is based on patient self-report in currently depressed individuals, which may upwardly bias the report of physical symptoms. Second, patients included in STAR*D were not drug-naïve at the start of the study, and patients in this analysis had previously participated in earlier STAR*D treatment levels, so some of the effects seen here may not be the result of the patients initiating treatment with a new drug regimen. Rather, it is possible that some of the observed genetic moderation of side-effects may in fact be genetic moderation of withdrawal or ‘washout’ for the immediately preceding therapy. Although we have discussed this possibility in scenarios in which it is likely, there is no way to analytically adjudicate between withdrawal versus side-effects to newly initiated treatment, given the STAR*D study design. This limitation highlights the need for future pharmacogenomic studies of antidepressant medications focused on drug-naïve patients, so as to more fully isolate the effects of individual antidepressants and, thus, strengthen analytical inference.
As with any genetic associations, our findings will require replication and functional validation. We are currently unable to replicate our findings in an independent sample because of the lack of available data sets that are comparable to the unique multistage design of the STAR*D study. To facilitate the replication process we provide all p values (www.pharmacy.vcu.edu/biomarker) as a resource for investigators with the requisite samples to carry out replication. However, the present study shows the potential of GWAS to discover genes and pathways that moderate adverse effects of antidepressant medication. A better understanding of these mechanisms and the role of specific polymorphisms may eventually help to personalize antidepressant medication so as to minimize adverse drug reactions for patients with depression.
Note
Supplementary material accompanies this paper on the Journal's website (http://journals.cambridge.org/psm).
Acknowledgments
This project was supported by National Institute on Drug Abuse (NIDA) grant DA026119.
Declaration of Interest
None.