Implications
Fast growing meat chickens typically experience reduced mobility around 5 weeks of age. Incubation conditions that alter chick hatch time can also modify chick bone ash. Specifically, incubation temperatures that induce chicks to hatch after 492 h (20.5 days), but before 516 h (21.5 days) of incubation, result in a higher percent bone ash when compared with chicks that hatched by 492 h incubation. Alternatively, the prompt provision of feed to chicks that have hatched by 492 h incubation can improve their bone ash. Implementing these procedures is likely to improve bird mobility.
Introduction
From around 5 weeks of age fast growing meat chickens may experience impaired mobility, evidenced as difficulties in standing and a reduced ability to walk. These birds frequently squat, and, when walking, they are inclined to move in a hobbling manner (Angel, Reference Angel2007). They are also less able to express behaviours such as dust bathing (Vestergaard and Sanotra, Reference Vestergaard and Sanotra1999). The reported incidence of leg problems varies, depending on the assessment techniques used. Kestin et al. (Reference Kestin, Knowles, Tinch and Gregory1992) identified that up to 90% of meat chickens grown in intensive production systems demonstrated a modification in their gait. In another report, up to 27% of meat chickens, at an average age of 40 days, experienced reduced mobility (Knowles et al., Reference Knowles, Kestin, Haslam, Brown, Green, Butterworth, Pope, Pfeiffer and Nicol2008), with ~3% of birds having limited walking ability. It can be assumed that lame birds experience pain, as their voluntary intake of an analgesic resulted in improved mobility (Danbury et al., Reference Danbury, Weeks, Chambers, Waterman-Pearson and Kestin2000). Compromised broiler mobility represents a major welfare concern for poultry producers and consumers alike. To this end breeding companies continue to select broiler breeders with superior leg health, but, the innate variation in the population means that some birds still experience leg abnormalities (Cobb-Vantress, 2016). Variations in the conditions under which the birds are grown could also contribute to some complexities with leg health. Management of post-hatch practices such as bird stocking rates (Sanotra et al., Reference Sanotra, Lawson, Vestergaard and Thomsen2001; Dawkins et al., Reference Dawkins, Donnelly and Jones2004) and environmental enrichment through the provision of perches (Ventura et al., Reference Ventura, Siewerdt and Estevez2010; Groves and Muir, Reference Groves and Muir2013) have been assessed as mechanisms for reducing the incidence of leg problems in broiler flocks, but, with variable outcomes.
As the growth rate of meat chickens increases and age to processing decreases, the period of egg incubation becomes an increasing proportion of the birds’ lifespan. Today, the 21-day incubation period represents up to 33% of a meat chickens life. As bones develop and grow during embryogenesis it follows that incubation conditions may contribute to leg problems in poultry (Oviedo-Rondón et al., Reference Oviedo-Rondón, Wineland, Small, Cutchin, McElroy, Barri and Martin2009; Shim and Pesti, Reference Shim and Pesti2011; Groves and Muir, Reference Groves and Muir2017). Investigations have assessed incubation temperature (Oviedo-Rondón et al., Reference Oviedo-Rondón, Small, Wineland, Christensen, Grimes, Funderburk, Ort and Mann2008a and Reference Oviedo-Rondón, Small, Wineland, Christensen, Mozdziak, Koci, Funderburk, Ort and Mann2008b; Ipek and Sozcu, Reference Ipek and Sozcu2016), but with divergent outcomes for bone development. For example, Brookes and May (Reference Brookes and May1972) and Hammond et al. (Reference Hammond, Simbi and Stickland2007) observed longer bones but Oviedo-Rondón et al. (Reference Oviedo-Rondón, Small, Wineland, Christensen, Grimes, Funderburk, Ort and Mann2008a) and van der Pol et al. (Reference van der Pol, van Roovert-Reijrink, Maatjens, van den Anker, Kemp and van den Brand2014) observed reduced bone length and weight with higher incubation temperatures. Direct comparison of the research outcomes is confounded by the numerous methodologies employed, in particular the test temperatures, how temperature is measured (air or egg shell temperature (EST)), time over which temperatures are applied, and, how leg strength is assessed. As EST most closely reflects the temperature experienced by the embryo (French, Reference French1997) EST was utilized in this study. Further, in some instances the incubation conditions tested have been outside commercial hatchery practices and more so than the EST ranges evaluated in the present study. The effect of incubation temperature on bone development may be attributed to alterations in hormonal profiles (Oviedo-Rondón et al., Reference Oviedo-Rondón, Wineland, Small, Cutchin, McElroy, Barri and Martin2009). However, more recent observations (Shim and Pesti, Reference Shim and Pesti2011; Groves and Muir, Reference Groves and Muir2014 and Reference Groves and Muir2017) indicate that an earlier hatching time, and subsequently longer time spent in the hatching tray, before take-off, influences leg problems, and as such hatching time is a central observation in this study.
A field observation involving two batches of hatched chicks of a parent line of meat chicken, with a high incidence of soft bones (Groves P., personal communication), initiated a series of experiments exploring the impact of incubation conditions on leg health in that same parent line (Groves and Muir, Reference Groves and Muir2014). The incubation temperature (37.8°C), recommended for ideal chick quality at hatch, (Joseph et al., Reference Joseph, Lourens and Moran2006) may not be the ideal temperature for all chick characteristics (Decuypere et al., Reference Decuypere, Tona, Bruggeman and Bamelis2001), including leg strength. Further, there are significant differences in embryonic growth trajectory with different strains of meat chickens (Ross and Cobb) (Tona et al., Reference Tona, Onagbesan, Kamers, Everaert, Bruggeman and Decuypere2010), highlighting that ideally EST should be tailored for each strain (French, Reference French1997). Under an ‘ideal’ temperature profile Cobb embryos produce more heat, develop faster and hatch earlier than Ross embryos (Tona et al., Reference Tona, Onagbesan, Kamers, Everaert, Bruggeman and Decuypere2010). Therefore, we have explored the use of alternative ESTs that extend the in-ovo period closer to the expected 21 days incubation on bone development and leg strength. Alternative incubation conditions that delayed hatch time improved bone ash (BA) at hatch and extended bird standing time in a latency-to-lie (LTL) test at 5 weeks of age in a fast-feathering parent line of meat chickens (Groves and Muir, Reference Groves and Muir2014), and, reduced the incidence of tibial dyschondroplasia (TD) in Cobb 500 chickens (Groves and Muir, Reference Groves and Muir2017). Meta-analysis of data from several studies using the fast-feathering parent line has established that BA at hatch has a statistically significant positive correlation with their LTL at 5 weeks of age (r=0.57, P<0.05; Groves and Muir, Reference Groves and Muir2014). Therefore, in this study BA has been observed as a predictor of later leg strength in fast growing meat chickens, but it is not designed to be indicative of specific bone disorders.
As the effect of alternative incubation EST, chick hatch time and chick management at take-off from the incubator, on commercial meat chicken bone strength is not well understood they were the focus of this study with Cobb 500 meat chicks. Incubation temperatures generated groups of chicks hatching either early (E) (by 492 h (20.5 days) incubation) or late (L) (from 492 to 516 h (from 20.5 to 21.5 days) incubation). In addition, treatments introduced at hatch assessed the impact of hatchery practices on chick characteristics and BA. The post-hatch treatments were applied over the 24 h after the notional E hatch time of 492 h from setting, and included the chick remaining in the hatcher, the chick being placed in a floorpen with access to feed and water, and, the chick hatching later than 492 h incubation, thereby spending up to a further 24 h in-ovo. Reported observations include hatch window, time of take-off, chick weight, chick length, yolk weight, femoral BA, packed cell volume (PCV), serum calcium (Ca) and inorganic phosphorus (P).
Material and methods
Animal ethics
The experimental procedures described were approved by the University of Sydney Animal Ethics Committee (protocol approval no. N00/2-2011/2/5461). All procedures complied with the Australian Code of Practice for the Care and Use of Animals for Scientific Purposes, as prepared by the National Health and Medical Research Council, 1997.
Fertile eggs
Day 0, Cobb 500 fertile eggs laid by a 35-week-old breeder flock were obtained from the Baiada Hatchery,Marsden Park, NSW, Australia. The eggs were stored at 16°C for 6 days. Before setting (the start of incubation) the eggs were preheated to 25°C for 10 h.
Incubators
Fertile eggs were set in E2A incubators (Multiquip Pty Ltd, Austral, NSW, Australia), which have forced ventilation, evaporative humidity, digital temperature control and automated turning. The eggs were programmed to turn every hour during the setting phase (from 0 h (day 0) until 432 h (day 18). The incubators were housed in an environmentally controlled room maintained at 25°C, at the Poultry Research Unit, The University of Sydney, Camden, NSW, Australia.
At 432 h (day 18) of incubation all eggs were transferred to one AussiesetTM incubator (Bellsouth Pty Limited, Narre Warren, VIC, Australia) for the hatching period, which terminated at 516 h (21.5 days) of incubation. This incubator had digital temperature control with sprays and forced ventilation to provide humidity.
During the setting phase EST was measured on four eggs per incubator, each egg located on one of the four levels of the incubator (Groves and Muir, Reference Groves and Muir2014). Egg shell temperatures were determined using Remote Intelligent Multisensors (TSIC716 Advanced Sensor Technology; Netic Pty Ltd, Ryde, NSW, Australia) which were attached to the equator of the egg using thermal paste (Silicon heat transfer compound; Unick Chemical Corp., Taoyuan City, Taoyuan, Taiwan). The sensors were connected to a remote monitor (Uptime Devices, Ryde, NSW, Australia) which was connected to a notebook computer containing the Netic Sensor Man (Netic Pty Ltd) software program. Egg shell temperature was recorded every minute. If required, the incubator settings were adjusted to match the intended EST treatment.
Experimental design
The experiment contained two EST incubation treatments during the setting phase. All eggs were then hatched in one larger incubator. The hatch window was divided nominally into E and L hatch. Early hatch chicks were hatched by 492 h of incubation (20.5 days). At 492 h all E hatch chicks, selected from both incubation profiles, were allocated across three treatments, to simulate different hatchery management procedures, as described below. Late hatch chicks hatched after 492 h (20.5 days) and by 516 h (21.5 days) and were taken off at 516 h forming one treatment group.
Incubation
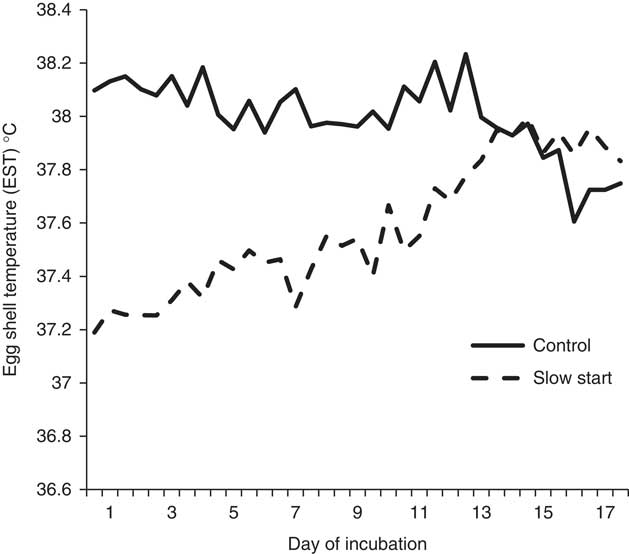
Two E2A incubators, each containing 144 eggs, were randomly allocated to each of the two incubation EST treatments. The humidity in all incubators was maintained between 50% and 60%. The Control EST incubators held the eggs between 37.8°C and 38.2°C EST from day 0 to 18 incubation. Egg shell temperatures above 38°C are higher than ‘ideal’ for the later stages of incubation, and occurred as the embryos were generating heat (Molenaar et al., Reference Molenaar, Gooding, Lamot, Wijtten, van der Pol, Maatjens and van Roovert-Reijrink2010). But, they were not out of the bounds of commercial incubation EST (Molenaar, Reference Molenaar2010). The second incubation treatment, identified as Slow start, had a low initial EST, of 37.2°C at day 0, and from there gradually increased to 37.8°C at day 13 (312 h) of incubation. EST then remained at 37.8°C until day 18 incubation, at which time eggs were transferred to the hatching trays. Hatching trays were held in a single incubator which was initially set to run at 37.4°C air temperature and 65% humidity. Air temperature was gradually decreased to 36.9°C by day 21 (504 h) of incubation.
At transfer to the hatcher each egg was candled. Non-viable eggs were removed and broken open to determine stage of embryo failure (Hill, Reference Hill2008). Each viable egg was placed into an identified cell within the hatching tray. Hence, each hatched chick was identifiable and could be traced to its incubation treatment. Each hatched chick was given a uniquely numbered wing tag, allowing it to be traced during post-hatch procedures.
Any eggs that had failed to hatch by 516 h (21.5 days) incubation were broken open and the stage of embryo failure identified. Final hatchability for the EST incubation treatments was calculated.
Hatch time and management of chicks at hatch
Hatcher trays were observed at E hatch, 492 h, and again at L hatch, 516 h, after the start of incubation, and all hatched chicks were identified. Four post-hatch treatments, linked to chick hatch time, were introduced at hatch. Chicks were taken from both the Control and Slow start incubation treatments to form the post-hatch treatments.
Early hatch chicks were allocated to three post-hatch treatments. These were: (1) E hatch chicks that were taken out of the hatching tray (taken-off) and sampled at 492 h of incubation (E hatch chicks sampled E), (2) E hatch chicks that were taken-off at 492 h, placed in a floorpen with a commercial broiler starter diet and water for 24 h before being sampled L at 516 h of incubation (E hatch chicks, fed and sampled L) and (3) E hatch chicks that remained in the hatching tray for a further 24 h before being taken-off and sampled L at 516 h of incubation (E hatch chicks sampled L). The fourth post-hatch treatment were the L hatch chicks (hatched >492 and ⩽516 h of incubation), which formed one group, being sampled L at 516 h of incubation (L hatch chicks sampled L). The three E hatch treatments allowed for comparison of observations between samples collected E from E hatching chicks, to E hatch chicks that then spent the next 24 h either in the hatching tray, or, in a floorpen with access to feed and water, and then sampled L. These three treatments were also compared with observations from chicks that had remained in the egg for up to an additional 24 h, that hatched L and were sampled L. As it is not possible to have L hatching chicks sampled E this treatment is absent from the experimental design.
Samples for biological analysis were taken from chicks selected at random from each incubation and post-hatch treatment group. The number of chicks sampled in each treatment group varied as a result of the number of hatched chicks in that treatment. For the incubation treatments, 106 chicks were sampled from the Control and 149 chicks were sampled from the Slow start incubators. In all, 80 chicks were sampled from E hatch chicks sampled E, 78 from E hatch chickens sampled L, 78 from E hatch chicks, fed and sampled L and 58 from L hatch chicks sampled L. At sampling chick weight and length (taken from the tip of the beak to the top of the toe nail on the middle toe; Hill, Reference Hill2008) were measured. A sample of blood was collected from the jugular vein from which PCV and serum Ca and inorganic P concentration were determined. The chick was then humanely euthanized by cervical dislocation, the yolk removed and weighed and the right femur was collected for BA analysis.
Laboratory procedures
Calcium and Phosphorus analysis
Calcium and P concentration was determined in serum as described by Groves and Muir (Reference Groves and Muir2014). These assays were conducted by The University of Sydney, Veterinary Teaching Hospital, Camden. Following clotting blood samples were centrifuged at 1455×g for 10 min at 4°C and the serum retrieved. Total Ca was estimated using the metallochromagen Arsenazo III reagent (Catalogue No. TR29226; Thermo Fisher Scientific Inc., Middletown, VA, USA) which forms a coloured chromophore with Ca ions at pH 6.75, measured at 650 nm. Inorganic P concentration was measured using an inorganic P reagent (direct UV method without reduction) producing unreduced phosphomolybdate and measured at 340 nm (Catalogue No. TR30026; Thermo Fisher Scientific Inc.). Colourimetric assessments were conducted using a Konelab 20 XTi (Thermo Electron, Waltham, MA, USA) clinical chemistry analyser.
Packed cell volume
For each chick a sample of blood was collected into a mini haematocrit tube (soda lime glass, ammonium heparinised; Vitrex Medical A/s, Herlev, Denmark). Tubes were spun in a Centurion Scientific Microhaemoatocrit Centrifuge at 12 000 r.p.m. for 3 min at room temperature. The percentage volume of cells and plasma was measured using a Hawksley Micro-haematocrit reader (Hawksley, Lancing, Sussex, UK) for calculation of PCV.
Bone ash
Femur samples were cleaned of any tissue by placing them in boiling water. The bones were weighed and then held in a drying oven at 105°C for 24 h. Dry bone weights were then recorded. The bone was then placed into a muffle furnace at 200°C and the temperature increased by 100°C increments with corresponding time pause, until 600°C. After 8 h, samples were removed from the furnace, allowed to cool in a dessicator and ash weights were recorded.
Statistical analyses
Statistical analyses were conducted using the computerized statistics package STATISTICA® (StatSoft Inc., Tulsa, OK, USA). Two-way ANOVA methods were applied to the factors incubation profile and hatch/sample time. Where statistical significance (P<0.05) was reached according to the F-test, means were separated using Tukey’s honestly significant difference (HSD) test for unequal sample size. No statistically significant interactions were observed and therefore only main effects are reported. Proportional data were compared using χ 2 contingency table analysis.
Results
Egg shell temperature was recorded every minute from day 0 to 18 of incubation. For presentation of EST, collected measures for both incubators under the same temperature treatment were averaged across every 12 h period. These are presented in Figure 1. There is a distinguishable difference in EST between the Control and Slow start incubation treatments from day 1 to 13 incubation.
Mean egg shell temperature (EST) during chicken egg incubation under either Control or Slow start temperature profile, recorded by temperature sensors attached to eggs, from day 0 to 18 incubation.

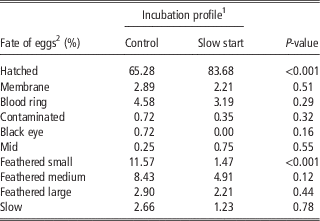
Overall, 65.28% of eggs set in the Control incubators hatched, which is significantly lower (P<0.001) than the 83.68% hatched from Slow start incubation (Table 1), and below commercial expectation. The stage of embryo failure is presented in Table 1. The Control incubation had significantly higher losses of feathered small embryos (8 to 15 cm long) (P<0.001) than the Slow start incubation. There were no other significantly different observations in embryo failure between the incubation treatments.
The fate of eggs and the stage at which the chick embryo ceased to be viable in unhatched eggs, for Control and Slow start incubation profiles

EST=egg shell temperature.
1 Control incubation involved EST between 37.8°C and 38.2°C during the setting phase. Slow start incubation involved an initial EST of 37.2°C with gradual increase to 37.8°C EST at day 13 of incubation.
2 Definition of fate outcomes (adapted from Hill Reference Hill2008). Membrane: 0 to 2 days embryonation (Em); Blood ring: 2 to 4 days Em; Black eye: 4 to 8 days Em; Mid: 5 to 8 cm, no feathers; Feathered small: 8 to 15 cm; Feathered medium: >15 to 17 cm; Feathered large: >17 cm; Slow: >17 cm alive but not hatched.
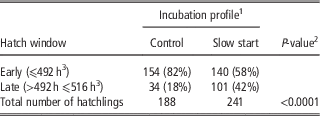
The number of hatched chicks at 492 and 516 h after setting, in both EST incubation profiles, is presented in Table 2. The Control incubation profile favoured E hatching, with 82% of chicks hatching E (by 492 h after setting), compared with 58% chicks hatching E in the Slow start incubation. In contrast, the Slow start incubation resulted in a greater number (101 chicks) and a significantly higher percent (42%; P<0.0001) of chicks hatching L, compared with the Control incubation where 34 chicks or 18% of chicks hatched L.
Number of chicks hatched either Early or Late, following incubation under either Control or Slow start incubation profiles

EST=egg shell temperature.
1 Control incubation involved EST between 37.8°C and 38.2°C during the setting phase. Slow start incubation involved an initial EST of 37.2°C with gradual increase to 37.8°C EST at day 13 of incubation.
2 χ 2 contingency table analysis.
3 Hours after the start of incubation.
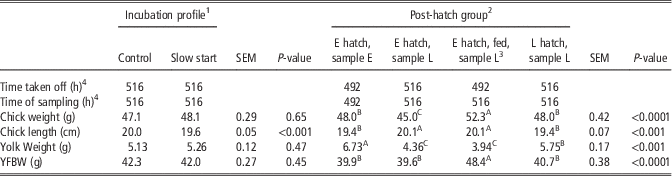
There were no significant differences in mean chick weight due to incubation treatment at take-off at 516 h from setting (Table 3). Chicks that hatched E and were sampled E, and E hatch chicks that were subsequently fed and sampled L, had a similar mean weight (48.0 and 48.3 g, respectively) at 492 h from setting, which was before the fed chicks had access to feed (data not shown). At 516 h after setting and following 24 h access to feed and water E hatch chicks, fed and sampled L were significantly heavier than all other chicks. The mean weight of L hatch chicks sampled L at 516 h was 48 g, which was the same as the E hatch chicks sampled E at 492 h. However, E hatch chicks that remained in the incubator for a further 24 h and were sampled L at 516, were significantly lighter (P<0.0001) than E hatch chicks sampled E and L hatch chicks sampled L (Table 3).
Mean chick weight, chick length, yolk weight and yolk free BW (YFBW) at sampling

E=early; L=late; EST=egg shell temperature.
A,B,CValues for post-hatch groups within a row with different letter superscripts differ significantly (P<0.05).
1 Control incubation involved EST between 37.8°C and 38.2°C during the setting phase. Slow start incubation involved an initial EST of 37.2°C with gradual increase to 37.8°C EST at day 13 of incubation.
2 Hatch and sample time: E=492 h; L=516 h from the start of incubation.
3 E hatch, fed, sampled L chicks were taken off E, followed by 24 h access to feed in a floorpen, before sampling L. In all other groups sampling occurred when chicks were taken off, that is removed from hatcher trays.
4 Hours from the start of incubation.
The Slow start incubation treatment resulted in a significantly (P<0.001) shorter mean chick length than the Control EST at take-off (516 h) (Table 3). Of the post-hatch treatments, E hatch chicks sampled E and L hatch chicks sampled L, which were sampled at their respective hatch times of 492 and 516 h, had an average length of 19.4 cm. These chicks were significantly shorter than both the E hatch chicks sampled L and E hatch chicks, fed and sampled L, being sampled 24 h after their E 492 h hatch (mean length 20.1 cm; P<0.001).
No significant differences in mean yolk weight were observed between the incubation treatments (Table 3). E hatch chicks sampled E had the highest mean yolk weight at sampling (492 h), which was significantly (P<0.001) heavier than E hatch chicks, fed and sampled L, E hatch chicks sampled L and L hatch chicks sampled L. Of the chicks sampled at 516 h from setting, the L hatch chicks sampled L, which had spent the longest time in-ovo, had significantly heavier yolks compared with chicks that had hatched at least 24 h before sampling, that is E hatch chicks sampled L and E hatch chicks, fed and sampled L. Further, there were no significant differences in the yolk weight of the latter two E hatch L sampling groups.
At take-off, there were no significant differences in chick yolk free BW (YFBW) due to incubation conditions (Table 3). Early hatched chicks, fed and sampled L had YFBW that was significantly heavier than all other post-hatch treatments (P<0.0001).
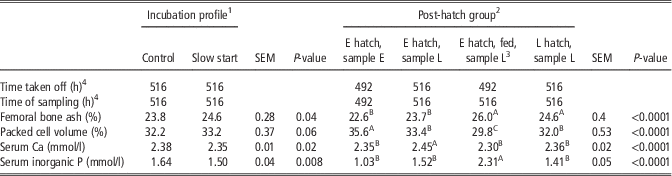
Chicks incubated under Slow start EST had significantly higher (P=0.04) femoral BA than chicks incubated with Control EST (Table 4). Of the chicks that had not had access to feed, E hatch chicks had significantly (P<0.0001) lower BA at take-off (22.6% for E hatch sampled E and 23.7% for E hatch sampled L) compared with the L hatch chicks sampled L (24.6%). Early hatch chicks that had 24 h access to feed (E hatch chicks, fed and sampled L) had significantly higher BA than the E hatch chicks held in the hatcher tray for the same 24 h before being sampled L. Interestingly the 26% BA of the E hatch chicks, fed and sampled L was not significantly different to BA in L hatch chicks sampled L (24.6%), but the former had the numerically highest percent femoral BA of all treatments.
Mean chick bone ash, packed cell volume and serum concentration of calcium (Ca) and inorganic phosphorus (P) at sampling

E=early; L=late; EST=egg shell temperature.
A,B,CValues for post-hatch groups within a row with different letter superscripts differ significantly (P<0.05).
1 Control incubation involved EST between 37.8°C and 38.2°C during the setting phase. Slow start incubation involved an initial EST of 37.2°C with gradual increase to 37.8°C EST at day 13 of incubation.
2 Hatch and sample time: E=492 h; L=516 h from the start of incubation.
3 E hatch, fed, sampled L chicks were taken off E, followed by 24 h access to feed in a floorpen, before sampling L. In all other groups sampling occurred when chicks were taken off, that is removed from hatcher trays.
4 Hours from the start of incubation.
Although there were no significant differences in PCV due to incubation EST (Table 4), there was a strong trend for a lower PCV (P=0.06) in chicks originating from Control EST incubation. E hatch chicks sampled E had the highest PCV (35.6; P<0.0001), and E hatch chicks, fed and sampled L had the lowest PCV (29.8; P<0.0001 compared with E hatch chicks sampled E, E hatch chicks sampled L and L hatch chicks sampled L). The PCV of E hatch chicks sampled L and L hatch chicks sampled L were not significantly different, but their PCVs were both significantly lower than that of the E hatch chicks sampled E and significantly higher than E hatch chicks, fed and sampled L.
Serum Ca concentration was significantly higher (P=0.02) in chicks hatched from the Control EST treatment, compared with the Slow start (Table 4). Similarly chicks incubated under Control EST had significantly higher inorganic P concentration in serum at take-off compared with the Slow incubation treatment (P=0.008). Serum Ca concentration was highest in E hatch chicks sampled L when compared with all other post-hatch treatments (P<0.0001). Serum P was highest in E hatch chicks, fed and sampled L, being significantly higher (P<0.0001) than all other post-hatch groups.
Discussion
Embryo development and hatch time is influenced by incubation temperature such that close control of EST during incubation can be utilized to manage the time the chick emerges from the egg (Groves and Muir, Reference Groves and Muir2014; Ipek et al., Reference Ipek, Sahan, Baycan and Sozcu2014). In this experiment a greater proportion (42%) of embryos exposed to lower initial EST hatched later (after 492 h incubation) than embryos incubated under Control EST (18% hatched after 492 h incubation). Early embryo losses (average 6.44% membrane and blood ring categories) were higher than 3% to 4% that is commercially desirable but there were no significant differences in these losses between incubation treatments. The significantly higher loss of feathered small embryos in the Control EST (Table 1) may have been a consequence of the elevated EST to 38.2°C between 11 and 13 days of incubation (Figure 1) leading to embryo loss after 14 days of incubation. Higher ESTs have been associated with embryo loss in the 3rd week of incubation (Molenaar, Reference Molenaar2010) and, a delay in embryo loss after the period of the high EST has also been reported in turkey embryos (French, Reference French2000). Hatchability from the Slow start EST was acceptable (83.68%). Further, an even lower starting incubation EST, for example, 36.9°C, has induced a much greater proportion of chicks to hatch L, without compromising hatchability (Groves and Muir, Reference Groves and Muir2017).
The BA of the L hatch chicks sampled L was significantly higher than the E hatch chicks that had not had access to feed, irrespective of their sampling time. This indicates that, under the conditions of the present study, a benefit for bone mineralization of the longer in-ovo phase of L hatch chicks. The exact mechanisms of this are not currently understood. An advantage of the longer in-ovo period on BA was also observed in chicks incubated under Slow start compared with the Control incubation, where a greater proportion of these chicks also hatched L.
This study is one of the first to explore the impact of chick management in the early post-hatch period on BA, including the effect of the chick’s sojourn, that is, the time spent in the hatching tray within the incubator after hatch. Our earlier work identified that a longer sojourn, as a consequence of earlier hatch, is linked to compromised chick leg strength (Groves and Muir, Reference Groves and Muir2014), and TD (Groves and Muir, Reference Groves and Muir2017). The current experiment assessed the impact of hatch time, sojourn duration and, additionally, the effect of access to feed in E hatching chicks, on BA, in the commercial Cobb 500 meat chicken.
Comparing observations from E hatch chicks sampled E with E hatch chick sampled L identified the changes that occur during the sojourn. Similarly comparisons between E hatch chicks sampled L and E hatch chicks, fed and sampled L identifies the effect of chick access to feed v. a sojourn in the hatcher without feed during the first 24 h after hatch. Throughout their sojourn E hatch chicks sampled L utilized their yolk reserves and grew in length but lost BW, predominantly through yolk and moisture loss, compared with E hatch chicks sampled E. The E hatch chicks sampled L also experienced a significant increase in serum Ca but no significant changes in serum P during the sojourn. Of the E hatch chicks, both E hatch chicks sampled E and E hatch chicks sampled L had significantly lower BA than the E hatch, fed and sampled L chicks. Therefore, it appears that in the absence of feed, E hatch chicks experience constrained bone mineralization. Interestingly E hatch chicks that were fed not only had the highest BA, but also had significantly lower serum Ca than E hatch chicks sampled L, and significantly higher serum P than both E hatch chicks sampled E and E hatch chicks sampled L. During the first 24 h after an E hatch, access to feed facilitated a significant increase in serum P and BA, whereas chicks that remained in the incubator for their first 24 h after an E hatch maintained their serum P and BA at a level similar to that observed at E hatch (E hatch chicks sampled E). Hence, during the sojourn bone formation in E hatch chicks may be limited by the availability of P, and, access to feed is required to improve their BA. Shim and Pesti (Reference Shim and Pesti2011) suggested that the longer sojourn may be compromising bone mineralization through the chick becoming dehydrated. However dehydration does not appear to be a complicating factor in this study, as there was no significant increase in PCV in chicks at the end of their 24 h sojourn (E hatch chicks sampled L). In fact under the conditions of the present study, PCV was significantly decreased in these chicks when compared with E hatch chicks sampled E, most likely due to the uptake of moisture from the yolk. This is supported by the observations of a minimal change in the YFBW of E hatch chicks sampled L compared with the E hatch chicks sampled E, and, the loss in BW of the E hatch chicks sampled L being largely explained by their decreased yolk weight.
During incubation Ca is sourced from the eggshell and accreted into the yolk, from where it is available to the embryo (Vieira, Reference Vieira2007). In contrast, the amount of P available to the embryo is that which was present in the yolk when the egg was laid. Hence a newly hatched chick has a ready supply of Ca but limited P in the residual yolk (Angel, Reference Angel2007). As mentioned previously bone mineralization in E hatch chicks can be enhanced by providing an additional source of P through, for example the starter diet. However, further investigations into the P and Ca requirements to support early bone growth and mineralization are required. In addition, current starter diet formulations may not be optimal for the development of bone in the recently hatched chick. Feeding diets with a high Ca: P to Ross 308 male chicks can compromise early bone development (Sacranie et al., Reference Sacranie, van Gerwe, De Los Mozos, Gutierrez Dell Alamo, Cowieson and Enting2013). It may be preferable to feed pre-starter or neonatal diets during the first 3 to 4 days post-hatch that more closely match the nutritional needs of the young chick (Angel, Reference Angel2007).
In this study the E hatch chicks sampled L had a 24 h sojourn without feed and water. It is not uncommon, however, for E hatch chicks to spend up to 2 days without feed and water under commercial conditions of hatchery management and chick dispatch to the grower facility (van de Ven et al., Reference van de Ven, van Wagenberg, Groot Koerkamp, Kemp and van den Brand2009). However, recently developed hatching/brooding facilities such as the Patio (van de Ven et al., Reference van de Ven, van Wagenberg, Groot Koerkamp, Kemp and van den Brand2009), HatchBrood (Molenaar et al., Reference Molenaar, Reijrink, Meijerhof and Van den Brand2014) and HatchCare (van Roovert-Reijrink, Reference van Roovert-Reijrink2014) offer the newly hatched chick rapid access to feed and water. These facilities also offer the option of providing a pre-starter diet to the hatchling. Alternatively or in combination with feeding a pre-starter diet, the embryo could be ‘fed’ before hatch, by the in-ovo delivery of a nutrient suspension (Yair et al., Reference Yair, Shahar and Uni2015).
This study has identified two mechanisms to improve bone mineralization in Cobb 500 chicks at hatch. Incubating eggs under a lower initial EST which delays the hatch time of the Cobb 500 meat chicken favours higher BA at hatch. Improved BA can also be realized in E hatching chicks by providing them with prompt access to feed. It should be noted however, that bone mineralization of Cobb 500 chicks exposed to these incubation and sojourn times has only been assessed in the young chick. An evaluation of these conditions on meat chicken growth and performance during grow out, and, their mobility close to harvest, is required.
Acknowledgements
This research was financially supported by The Australian Rural Industries Research and Development Corporation, Chicken Meat. The authors thank Joy Gill and Melinda Hayter (Poultry Research Foundation, University of Sydney, Camden Australia) and Ms Sue Ball (Zootechny Pty Ltd, Austral, NSW, Australia) for assistance with bird husbandry and laboratory procedures.