I. INTRODUCTION
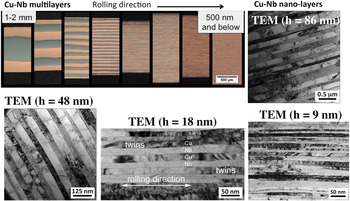
Recent studies have demonstrated that bulk nanostructured bimetallic composites with uniformly structured bimetal interfaces can be fabricated with severe plastic deformation (SPD).Reference Lee, LeDonne, Lim, Beyerlein and Rollett1–Reference Beyerlein, Mara, Wang, Carpenter, Zheng, Han, Zhang, Kang, Nizolek and Pollock3 The particular SPD technique used, accumulative roll bonding (ARB), involves repeated operations of rolling, cutting, and restacking.Reference Carpenter, Vogel, LeDonne, Hammon, Beyerlein and Mara2–Reference Quadir, Ferry, Al-Buhamad and Munroe5 ARB enables extremely large strains (of the order of 10) to be applied via a consistent strain path and without changing the original dimensions of the sample. When starting with two metals that are immiscible, such as copper (Cu) and niobium (Nb), the outcome is a sheet material comprised of alternating layers of two metals with individual layer thicknesses ranging from the submicrometer to the nanoscale (Fig. 1). At these fine length scales, the grains become severely elongated, with widths at least 10–20 times the thickness, and contain minimal substructure.Reference Carpenter, McCabe, Beyerlein, Wynn and Mara6 The layers encompass one to two of these band-like grains. The textures of ARB copper-niobium (Cu-Nb) composites are found to deviate from those expected of severely rolled monolithic Cu or Nb.Reference Carpenter, Vogel, LeDonne, Hammon, Beyerlein and Mara2 Most remarkably, the bimetal interfaces are observed to stabilize to a few orientation relationships that prevail over the bulk sample. The characteristic interface that occurs most frequently involves a Cu crystal with an orientation ranging from Copper to Dillamore (that is, from the {112}<111> component to the {4 4 11}<11 11 8> component in the {ND}<RD> nomenclature) joined to a Nb crystal with an orientation corresponding to the I-component, {112}<110>.Reference Lee, LeDonne, Lim, Beyerlein and Rollett1 In the above, RD refers to the rolling direction and ND the rolling direction. High-resolution transmission electron microscopy (HRTEM) reveals that the interfaces appear to be relatively free of extrinsic defects.Reference Zheng, Beyerlein, Wang, Carpenter, Han and Mara7 Belonging to this narrow set of predominant interfaces is the Copper/I interface, {112}<111>Cu‖{112}<110>Nb, which has a Kurdjumov-Sachs (KS) relationship (denoted hereinafter as {112}KS). Atomic-scale calculations have been performed on the Cu-Nb {112}KS interface to study its atomic structure and interface energy,Reference Demkowicz and Thilly8–Reference Wang, Kang, Zhang, Zheng, Beyerlein and Mara10 interfacial shear strength,Reference Demkowicz and Thilly8 vacancy interaction,Reference Demkowicz and Thilly8, Reference Kang, Wang, Zheng and Beyerlein9 glide dislocation nucleation,Reference Wang, Kang, Zhang, Zheng, Beyerlein and Mara10 slip transmission,Reference Beyerlein, Mara, Wang, Carpenter, Zheng, Han, Zhang, Kang, Nizolek and Pollock3 and deformation twinning.Reference Zheng, Beyerlein, Wang, Carpenter, Han and Mara7, Reference Han, Carpenter, Wang, Beyerlein and Mara11 A recent experimental study showed that nanolamellar Cu-Nb composites (∼20 nm layer thickness) exhibited outstanding thermal stability, maintaining its texture, interface distribution, layer thickness and layered architecture up to 500 °C for 1 h.Reference Carpenter, Zheng, Zhang, Vogel, Beyerlein and Mara12 From 500 to 700 °C, the layers coarsened, but the lamellar structure was maintained, and the {112}KS interfaces appeared in even higher frequency. To date, the questions of why the ultrafine and nanomicrostructures consist of few interface types after extreme straining and why the observed ones were selected remain unanswered. Moreover, the apparent mechanical stability of the interfaces dominating this ARB Cu-Nb material is expected to result in superior mechanical properties, although they have not yet been measured.
Cu-Nb ARB samples fabricated with different individual layer thicknesses ranging from 1 mm to 500 nm (in the upper left photo) and less than 100 nm, as shown in the TEM micrographs.

In this work, we develop a parameter that identifies the selection of particular interfaces in rolling deformation and investigate the hardness, strength, plastic anisotropy, and ductility of processed ARB composites through a suite of tests involving nanoindentation, micropillar compression, and bulk mechanical testing. The ARB samples tested consist of individual layer thicknesses h that lie in the submicrometer to nanoscale range (h = 7–700 nm). We report that the hardness H and tensile and compressive strengths all increased as layer thickness decreased below 100 nm, and they achieve values that greatly exceed those of either constituent by at least an order of magnitude. Nanolayered ARB samples with h = 10 nm achieved a hardness of H = 4.5 GPa and those with h = 18 nm attained a micropillar compression strength of 1.78 GPa and failed via shear localization at 10% true strain. In bulk tensile testing, the h = 58 nm material achieved an ultimate tensile strength of 1 GPa.
II. EXPERIMENTS
A. ARB synthesis
Unlike conventional rolling, the ARB process involves repeated rolling, sectioning, stacking, bonding, and rerolling.Reference Carpenter, Vogel, LeDonne, Hammon, Beyerlein and Mara2, Reference Quadir, Al-Buhamad, Bassman and Ferry4, Reference Quadir, Ferry, Al-Buhamad and Munroe5 Distinct from prior ARB processes, the Cu-Nb stack initially has alternating Cu (99.99% purity) and Nb (99.94% purity) layers of equal thickness bounded by half-thick Cu layers on top and bottom, which we refer to as the “copper-clad” method.Reference Beyerlein, Mara, Wang, Carpenter, Zheng, Han, Zhang, Kang, Nizolek and Pollock3 In this way, no new Cu-Nb interfaces are formed between surface layers during the restacking step of ARB. The material system and ARB processing procedures used in this study are the same as those described inReference Carpenter, Vogel, LeDonne, Hammon, Beyerlein and Mara2 but without the intermediate annealing steps.
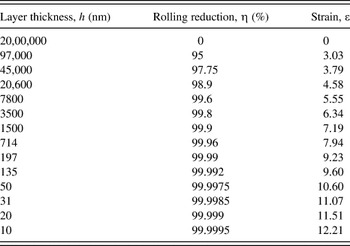
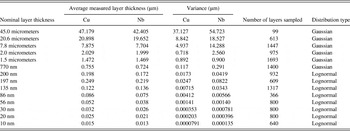
Samples were fabricated with layer thicknesses h ranging from 97 micrometers down to 10 nm, corresponding to rolling reductions of 95% and 99.9995%, respectively (Table I). For all h, the lamellar structure was maintained and the Cu-Nb interfaces were relatively flat, planar, and sharp, meaning that there was little chemical variation. This study focuses on ARB Cu-Nb composite materials with ultrafine to nanoscale interface spacing (h = 10–700 nm). For these cases, the variation in layer thickness was measured for each sample. Most layer thicknesses were measured in a scanning electron microscope (SEM) via backscattered electron detection. Samples nominally below 135 nm in layer thickness, however, were measured in the transmission electron microscope (TEM). The results are reported in Table II. In all cases, the thicknesses of the Cu and Nb are similar and nearly equal to the nominal value, indicating that the Cu and Nb codeformed. Layer thicknesses of materials with nominal layer thicknesses of 770 nm and above exhibited a Gaussian distribution; below this nominal thickness, a lognormal distribution was observed.
Layer thickness, rolling reduction, and logarithmic strain of the Cu-Nb multilayered samples fabricated by ARB.

Variation in layer thickness for the ARB Cu-Nb samples studied here. To obtain these measurements and statistics, micrographs were filtered and a threshold was applied, allowing a cross-sectional profile to be obtained. Layer thicknesses were then calculated using the respective pixels size and pixel grayscale value, either 0 or 255 post processing, dependent on layer composition and the image processing method.

B. Texture and bimetal interface evolution
Recent studies have revealed that Cu-Nb multilayers develop an unusual texture and a predominant interface character when refined below submicrometer length scales.Reference Lee, LeDonne, Lim, Beyerlein and Rollett1, Reference Carpenter, Vogel, LeDonne, Hammon, Beyerlein and Mara2, Reference Carpenter, Liu, Darbal, Nuhfer, McCabe, Vogel, LeDonne, Rollett, Barmak, Beyerlein and Mara13 This phenomenon can qualitatively be attributed to interface-driven deformation. The possible ways in which the bimetal interface can influence the deformation mechanics of neighboring crystals are many: by introducing a kinematic constraint, constraining grain shape evolution, increasing stored energy (via interfacial formation energy), affecting substructure evolution and dislocation storage, and altering slip activity,Reference Carpenter, Vogel, LeDonne, Hammon, Beyerlein and Mara2, Reference Lim and Rollett14–Reference Beyerlein, Mara, Bhattacharyya, Necker and Alexander17 to name a few. To date, experimental and simulation systems have been used to investigate some of these aspects, but a comprehensive understanding of interface-deformation-dynamics has yet to be achieved.
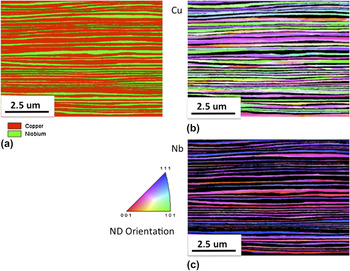
For the present ARB samples, the submicrometer length scales at which the bimetal interface begins to influence microstructure evolution appears to be tied to the number of band-like grains contained through the thickness of an individual layer. In the 100–500 nm range, one to two band-like grains span the layer thickness (Fig. 2) and thus all grains are connected to bimetal interfaces. Because the grains are severely elongated, being at least 10 times wider than they are thick (Fig. 2), they are bounded by more bimetal interfacial area than grain boundary area.
EBSD results from h = 86 nm ARB Cu-Nb sample. The sample was mounted at an inclined angle for increasing the apparent layer thickness. (a) represents a phase map where red is Cu and green is Nb. (b) and (c) are orientation maps where colors can be used to identify the orientation of the grains with respect to the normal direction by utilizing the included reference triangle.

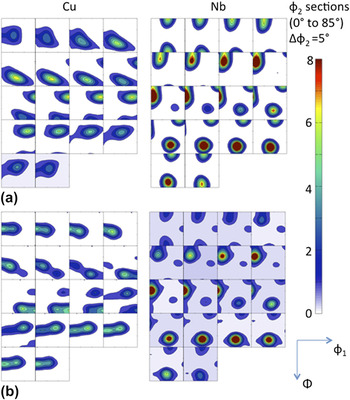
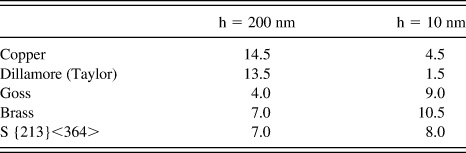
Within this length scale range, the deformation textures of the Cu and Nb phases begin to deviate significantly from conventional textures of rolled Cu and Nb. Figure 3 shows the orientation distribution functions (ODFs), as measured by neutron diffraction for samples with h = 200 nm and 10 nm, as representative textures at the submicrometer and nanoscale regimes, respectively. The intensities of some relevant texture components are given in Table III. At submicrometer length scales (h = 200 nm), the ARB Cu and Nb textures stabilize to one containing strong peaks. The texture of Cu in the nanocomposite has a strong component between Dillamore {4 4 11}<11 11 8> and Copper {112}<111>, and weaker maxima at Brass {110}<112> and the S-component {213}<364>. In contrast, monolithic Cu after severe rolling reductions has a texture containing a strong S-component, and nearly equal peaks of Copper and Brass components.Reference Hirsch and Lücke18 Below h = 50 nm, deformation twins begin to form in the Cu phase and by h = 10 nm, the twin fraction is approximately 30%. The Goss {110}<001> component develops, the Brass component is maintained, and the peaks at Copper and Dillamore have diminished (Table III). The Nb phase in the composite develops an inhomogeneous α fiber with peaks near {112}<110> and {001}<110>. As the layer thickness decreases below 50 nm, the former component increases and the latter increases until at h = 10 nm, a highly oriented texture is obtained with a peak that lies near the {112}<110> component tilted to lower ϕ (ϕ < 35.26°). Heavily rolled monolithic Nb, in contrast, develops peaks at the {111}<110> component and near {112}<110> component tilted to higher ϕ (ϕ > 35.26°).Reference Raabe, Ball and Gottstein19 In the light of these results, it is apparent that texture evolution at fine nanoscales is a consequence of the formation of a few predominant interface orientation relationships.
ODFs of the deformation textures in the ARB samples as measured by neutron diffraction: (a) Cu phase and Nb phase in the h = 200 nm composite, and (b) Cu phase and Nb phase in the h = 10 nm composite.

Intensities (in units of multiples of random distribution, m.r.d.) of some relevant rolling texture components for the Cu-Nb ARB material with individual layer thicknesses of h = 200 nm and h = 10 nm.
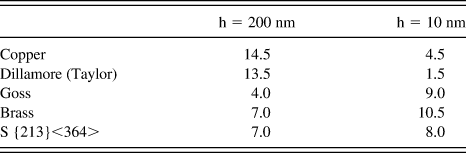
The evaluation of texture was accompanied by microstructural investigations of interface crystallography. Texture-microstructure correlations suggest that texture evolution was intimately tied to interface evolution toward a stable end crystallography. For h = 200–600 nm ARB material, the crystallography of the Cu-Nb interfaces was recently characterized using an automated heterophase interface characterization distribution (HICD) method applied to electron backscatter diffraction (EBSD) maps.Reference Lee, LeDonne, Lim, Beyerlein and Rollett1 For a given EBSD image, the HICD method determines the distribution of the five parameters that characterize the crystallography of the interface (e.g., three for the orientation relationship and two for the interface plane). The HICD method revealed that the {interface plane}, <RD>, <TD> = {112}fcc‖{112}bcc, <111>fcc‖<110>bcc, <110>fcc‖<111>bcc interface (within 15°) prevailed over the entire sample.Reference Lee, LeDonne, Lim, Beyerlein and Rollett1 In the above, TD refers to the transverse direction; “fcc” and “bcc” refer to “face-centered cubic” and “body-centered cubic” respectively. This interface joins the Copper component in the Cu phase with the I-component in the Nb phase and has a Kurdjumov-Sachs (KS) orientation relationship. Another interface {110}fcc‖{112}bcc, <112>fcc‖<110>bcc, <111>fcc‖<111>bcc, which does not have a KS orientation relationship, was also identified by the HICD method,Reference Lee, LeDonne, Lim, Beyerlein and Rollett1 although occurring much less frequently. This interface joins the Brass component in Cu with the I-component in Nb.
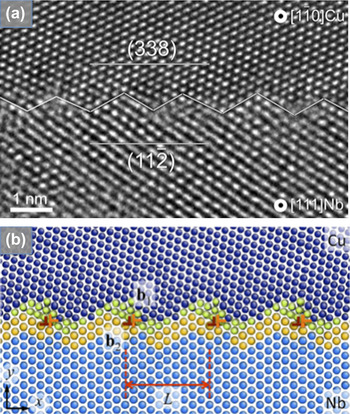
Subsequent experimental characterization of the textures and interfaces at a higher resolution in the submicrometer ARB samples indicate that the predominant interface lies in between the {interface plane} <RD> = {112}<111>Cu‖{112}<110>Nb KS interface (Copper/I) and {4 4 11}<11 11 8>Cu‖{112}<110>Nb (Dillamore/I) interface. Analysis of ARB texture measurements finds that peak intensities deviate less than 8° from {112}<111> in the Cu phase and less than 5° from {112}<110> in the Nb phase. Consistent with these analyses, HRTEM finds interfaces within a narrow range from {112}<111>Cu‖{112}<110>Nb to {4 4 11}<11 11 8>Cu‖{112}<110>Nb, where the most frequently occurring interface crystallography lies in between. One such example is the {338}<443>fcc‖{112}<110>bcc seen in Fig. 4. In Ref. Reference Kang, Wang and Beyerlein20 the authors report tilts of 7.5° from {112}<111> in the Cu crystal when bonded to a {112}<110> Nb crystal. In other fcc/bcc systems, deviations up to 10° from {112}<111>Cu‖{112}<110>Nb KS interfaces have also been reported.Reference Chen, Chen and Reynolds21
(a) HRTEM of the {338}<443>‖{112}<110> interface in comparison with (b) an MD simulation from Ref. Reference Kang, Wang and Beyerlein20.

It is worth mentioning that results from prior modeling suggest that the interfaces tilted off from {112}<111>Cu‖{112}<110>Nb would be more favorable than interfaces that are exactly {112}<111>Cu‖{112}<110>Nb. Atomic scale modeling of a Cu-Nb bilayer found that the Cu-Nb interface achieves a local minimum energy interface configuration at {338}<443>fcc‖{112}<110>bcc, which was created by tilting the Cu crystal 7.33° from {112}<111>Reference Kang, Wang and Beyerlein20 about the negative TD. Crystal plasticity finite element (CPFE) modeling of a Cu-Nb bicrystal was used to carry out an orientational stability calculation of the {112}<111>Cu‖{112}<110>Nb interface.Reference Mayeur, Beyerlein, Bronkhorst, Mourad and Hansen15 Both crystals are permitted to rotate under deformation, and it was found that the stable end orientation relationship after 60% rolling reduction was altered by a difference of 3.5° (about the negative TD) from {112}<111>fcc‖{112}<110>bcc KS.Reference Mayeur, Beyerlein, Bronkhorst, Mourad and Hansen15 Together these results suggest that both interface energy and crystalline stability are important, and in the light of this, a more general rationale for interface stability will be presented shortly.
Obtaining statistical data on interface character in the nanoscale samples (h < 100 nm) is more challenging. A study using a relatively new characterization method (that was introduced in 1994 for structure solutions of nanoscale materials), precession electron diffraction (PED), which combines orientation and phase mapping in the TEM, reported the predominance of a near {112}Cu‖{112}Nb KS interface in ARB samples with nanoscale h = 30 nm.Reference Carpenter, Liu, Darbal, Nuhfer, McCabe, Vogel, LeDonne, Rollett, Barmak, Beyerlein and Mara13 These techniques, however, provide data over a small area of the sample and cannot determine whether a characteristic interface has formed in the nanocomposites. Recent attempts using a novel wedge-mounting EBSD technique to examine much larger volumes report no predominant interface at h = 56 nm Ref. Reference Carpenter, McCabe, Beyerlein, Wynn and Mara6. This might be due to the fact that the material was in a transient state at this length scale as it transitioned from deforming by slip only at h = 100 nm and slip and twinning by h = 60 nm. By h = 10 nm, however, when the twin fraction has reached 30%, HRTEM suggests that the Goss‖{112}<110>bcc interface (including those interfaces within an 8° misorientation) may be predominant. Although this claim requires further confirmation, it is consistent with the ODFs (Fig. 3).
C. Rationale for predominant interfaces
The most intriguing result from the Cu-Nb studies is that a predominant interface forms in the submicrometer ARB samples and possibly a distinctly different one in the very fine h = 10 nm ARB samples. Another notable feature is that in all cases, the interfaces observed in the submicrometer to nanostructured ARB composites via HRTEM possess a well-defined, ordered structure and a regular array of alternating facets, where each facet is a flat plane. These interfaces were found to contain remarkably few extrinsic defects. For instance, consider the predominant {338}<443>Cu‖{112}<110>Nb interface in Fig. 4(a). When compared with a molecular dynamics (MD) calculation of the relaxed equilibrium structure of the same interface [Fig. 4(b)], most of the defects seen via HRTEM can be identified as part of the intrinsic defect structure. This consistency suggests that these interfaces have an ability to recover from defects induced during rolling. Moreover, the positive heat of mixing of Cu and Nb, as well as a demonstrated bias toward forming faceted, ordered structures during ARB processing, reduces the tendency for chemical intermixing during processing. Ashkenazy et al.Reference Ashkenazy, Vo, Schwen, Averback and Bellon22 demonstrated through MD simulations that certain fcc-bcc interfaces are chemically stable, demonstrating little intermixing, even to shear strains of 60, while others are more prone to intermixing and amorphization. This is in agreement with experimental work on wire-drawn Cu-Nb,Reference Demkowicz and Thilly8, Reference Sauvage, Renaud, Deconihout, Blavette, Ping and Hono23 where interfaces of type {112}fcc‖{112}bcc KS were shown to be faceted and chemically sharp, while others of different interface plane/orientation relationships were locally amorphous of the order of 1 nm.Reference Demkowicz and Thilly8 Because of the tendency of the Cu-Nb system to form ordered interfaces during ARB processing, it represents an ideal model system for investigation of the response of interfaces to mechanical deformation.
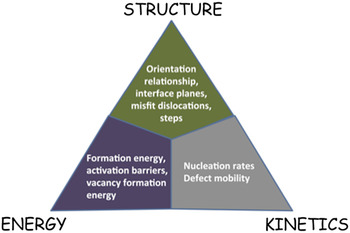
Fundamentally, it is important to understand why certain dominant interfaces emerge under severe rolling strains. To develop this understanding, we study the effects of three factors on interfacial stability under mechanical deformation: structure, energy, and kinetics. These three factors are depicted by the structure-energy-kinetics triad in Fig. 5.Reference Beyerlein, Mara, Wang, Carpenter, Zheng, Han, Zhang, Kang, Nizolek and Pollock3 As it pertains to an interface, we use the term “structure” to refer to configurational features of the interface, such as the interface character, intrinsic interface dislocation distribution, crystallography of slip across the interface, and the alignment of slip systems on each side of the interface. Relevant “energy” factors, for example, include interface formation energy and the energy of a point defect within the interface. The “kinetics” factor refers to all mechanisms that accommodate deformation, such as dislocation nucleation, dislocation transmission, dislocation absorption, interfacial sliding, or dislocation transport within the interface.
The structure-energy-kinetics triad for assessing the quality of an interface. The present work utilizes this concept to assess the orientation stability of the 5-parameter interface character in rolling.

D. Structure: Orientational stability
We first consider the structure factor, by specifically addressing the stability of the 5-parameter interface character under deformation. An interface character is stable when its orientation relationship and interface plane do not evolve with strain. For maintaining its 5-parameter crystallography, both crystals adjoining the interface must not reorient during mechanical deformation. If either crystal is unstable with respect to the imposed deformation and reorients, the interface plane and/or orientation relationship will change. Therefore, in what follows, we focus on the orientational stability of the Cu crystal and Nb crystal in the bicrystal configuration.
The orientational stability of a given crystal orientation under mechanical loading is based on a set of measures.Reference Hirsch and Lücke24–Reference Toth, Jonas, Daniel and Ray26 For instance, the reorientation of a crystal with rolling strain has been characterized by the lattice rotation rate  ${{\dot \omega }}$, the orientation rate
 ${{\dot {\rm g}}$, the divergence of the orientation rate div
 ${\dot {\rm g}}$, the time evolution of its intensity
 ${\dot {\rm f}}$, or a combination of these.Reference Zhou, Toth and Neale25, Reference Toth, Jonas, Daniel and Ray26 As a first step toward developing an understanding, we consider one parameter, the reorientation angle ΔΩ, to quantify the orientation stability in rolling of each crystal that forms the interface. ΔΩ is defined as the magnitude of the angle between the crystal orientation in the initial and deformed configurations after an imposed true strain Δε. When ΔΩ/Δε is approximately zero (i.e., within ε ∼0.01), the crystal in the bicrystal is considered to be stable or metastable. Large values of ΔΩ/Δε, on the other hand, are associated with unstable orientations. For convenience we define the function, exp (−ΔΩ/Δε), such that a value close or equal to unity indicates stability. As the stability of an interface depends on the stability of both crystals creating the interface, it can be quantified by the following productReference Mayeur, Beyerlein, Bronkhorst, Mourad and Hansen15:
 $$CX = exp\left( { - {{{\rm{\Delta \Omega }}^{{\rm{Cu}}} } \over {{\rm{\Delta }}\varepsilon }}} \right)exp\left( { - {{{\rm{\Delta \Omega }}^{{\rm{Nb}}} } \over {{\rm{\Delta }}\varepsilon }}} \right)\quad,$$
where ΔΩCu and ΔΩNb are the reorientation angles for the Cu and Nb crystals, respectively. The CX parameter ranges from 0 to 1 (for a perfectly stable interface).
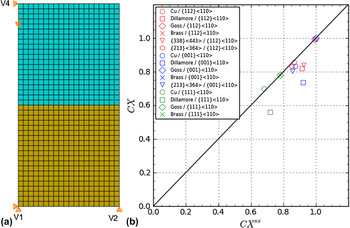
To calculate ΔΩ/Δε, we use a bicrystal finite element model developed in Ref. Reference Mayeur, Beyerlein, Bronkhorst, Mourad and Hansen15. Below, we provide a brief description of this model. Figure 6(a) presents the model set up, which consists of a niobium crystal stacked on top of a copper crystal, forming a single Cu-Nb interface. The interface normal lies in the x2 direction. Periodic boundary conditions are applied in both the x1 and x2 directions and the boundary conditions at the control vertices are illustrated in the schematic. Displacements are fully constrained at vertex 1, the x2 displacement component is constrained at vertex 2, and the x1 component of displacement is fixed at vertex 4. The compressive load is applied at vertex 4 via displacement control at a constant strain rate of 0.08/s. Displacement and traction continuity are enforced at the interface throughout deformation. In this way, the interface provides a “kinematic constraint” on the deformation of the two adjoining crystals.

While the total deformation state is two-dimensional (i.e., plane strain condition), the deformation of the crystals is fully three-dimensional (out-of-plane plastic deformation is allowed). The constitutive laws used for both Cu and Nb follow an anisotropic elastic and rate-dependent crystal plasticity formulation, which is given in Ref. Reference Hansen, Carpenter, Sintay, Bronkhorst, McCabe, Mayeur, Mourad, Beyerlein, Mara, Chen and Gray16. Plastic deformation is accommodated by dislocation glide and normal slip is assumed, wherein slip system activation is correlated with the resolved shear stress. Our model uses slip system flow kinetics based on the notion of thermally activated dislocation glide. In this classical scenario, dislocations glide from one pinning point to another and use a combination of thermal activation and mechanical stress to overcome each pinning site. In the Cu-Nb bicrystal simulations that follow, we make available the 12 {111}<110> slip systems in Cu and the 12 {110}<111> slip systems and 12 {112}<111> slip systems in Nb.Reference Wang and Beyerlein27 The importance of using both {110}<111> systems and {112}<111> slip in predicting single crystal plastic anisotropy was recently revealed in Ref. Reference Sauvage, Renaud, Deconihout, Blavette, Ping and Hono23. By this selection, we assume that slip is mediated by perfect dislocations, which may have limited applicability for layer thicknesses that are on the order of a few nanometers. The anisotropic elastic parameters used were taken from single crystal data given in Ref. Reference Simmons and Wang28. The thermal activation slip rate model introduces material parameters for each allowable slip family in Cu and in Nb. The calibrated material parameters are given in Ref. Reference Hansen, Carpenter, Sintay, Bronkhorst, McCabe, Mayeur, Mourad, Beyerlein, Mara, Chen and Gray16 and were determined by fitting to a large suite of tests with widely varying temperatures and strain rates.
With the above model, the lattice misorientations ΔΩCu and ΔΩNb for different interfaces when deformed to 60% rolling reduction are calculated and used to compute CX. This deformation is intended to assess orientation stability only and not to model the full deformation history of the ARB process. To reveal the effects of the kinematic constraint imposed by the interface, the reorientations ΔΩCu,SX and ΔΩNb,SX determined from separate single crystal simulations are used to calculate an analogous parameter  $CX^{SX} = exp\left( { - {{\Delta {\rm{\Omega }}^{{\rm{Cu}},{\rm{SX}}} } \over {\Delta \varepsilon }}} \right)exp\left( { - {{\Delta {\rm{\Omega }}^{{\rm{Nb}},{\rm{SX}}} } \over {\Delta \varepsilon }}} \right)$ for the “virtual” pair, wherein the two crystals are not physically joined.
The map shown in Fig. 6(b) plots CX versus CXSX for the interfaces considered in this work. The line CX = CXSX is drawn to represent cases in which the kinematic constraint has no effect on the orientational stability of the interface (meaning the case in which the lattice rotation of the individual crystals in the bicrystal simulations is identical to that of the single crystal simulations). Figure 6(b) shows that the data points either lie on or below the black line. This implies that the kinematic constraint imposed by the interface in the bicrystal simulations does not have a stabilizing effect, and most often interface stability is dictated by the least stable orientation of the constituent crystals.
E. Energy: Interface formation energy
The second factor considered is interface formation energy γint. It can be expected that for composites below a critical interface spacing, the crystals will be driven away from orientations that create high energy interface configurations and toward those associated with lower energy interface configurations.
The formation energy of a given interface, γint, is best calculated from the relaxed equilibrium interface structures determined by MD simulation, for example.Reference Kang, Wang, Zheng and Beyerlein9, Reference Kang, Wang and Beyerlein20, Reference Demkowicz, Hoagland and Hirth29 To calculate γint for the interfaces considered in this study in Tables IV–VI, we use the methods described in Refs. Reference Kang, Wang, Zheng and Beyerlein9 and Reference Kang, Wang and Beyerlein20. The model set up consists of a bicrystal of Cu and Nb crystal containing a single Cu-Nb interface, wherein x and z are the two in-plane directions and y is the direction normal to the Cu-Nb interface. Empirical embedded atom method (EAM) interatomic potentials are used to describe Cu-Nb system: the Voter-Chen potentialReference Voter30 for Cu-Cu interaction, the Johnson-Oh potentialReference Johnson and Oh31 for Nb-Nb interaction, and for the cross interaction the one described by Demkowicz and Hoagland.Reference Demkowicz and Hoagland32 Along the x- and z- axes, periodic boundary conditions are applied, while a fixed boundary condition is applied in the y-axis to represent the bulk response. The thickness of the fixed boundary is at least two times the cut-off distance of the interatomic potential model. Due to the dissimilarity in crystal structure and the mismatch in lattice constant between Cu and Nb, the in-plane x and z periodic dimensions of Cu and Nb must be chosen carefully to obtain a minimum the interface formation energy.Reference Kang, Wang, Zheng and Beyerlein9, Reference Kang, Wang and Beyerlein20 The height of the Cu and Nb crystals in the bicrystal model is nearly identical and it is at least 4 nm for all interfaces considered in this study. When the Cu and Nb crystals with a given orientation relationship and interface plane are joined, they are allowed to rigidly translate in all x, y, and z directions to achieve a structure of minimum interface formation energy. The interface structure is then dynamically relaxed via simulated annealing by lowering the temperature from 300 K to 100 K during 60 ps. Once the temperature is lower than 100 K, a subsequent conjugate gradient method is applied. The interface formation energy γint is given by
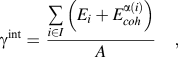 $$\gamma ^{{\mathop{\rm int}} } = \,{{\mathop\sum\limits_{i \in I} {\left( {E_i + E_{coh}^{\alpha \left( i \right)} } \right)} } \over A}\quad,$$
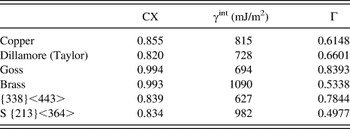
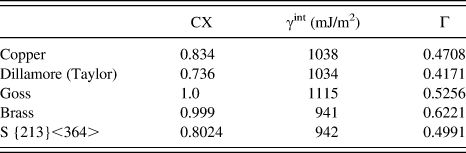
Orientation stability (CX), interface energy (γ int), and stability parameter, Γ = CX (γ KS/γ int) for interfaces joining different Cu crystal orientations with the Nb {112}<110> I-component. For Cu-Nb, γ KS = 586 mJ/m2.

where the interface region is labeled as I, Ei is the potential energy of an atom i, α(i) is the species of atom i,  $E_{coh}^{\alpha \left( i \right)} $ is the cohesive energy of species α, and A is the interfacial area. In calculating γint, we set the thickness of the interface region I to be sufficiently large such that γint is unaffected by any nonlinearities near the interface.
A dimensionless measure of the interface energy, IE, is given by normalizing γint by the {111}<110>fcc‖{110}<111>bcc KS interface formation energy, γKS, which is the lowest energy fcc/bcc interface, that is,
 $${\rm{IE}} = {{{\rm{\gamma }}^{{\rm{int}}} } \over {{\rm{\gamma }}^{{\rm{KS}}} }}\quad.$$
For a Cu-Nb system, γKS = 586 mJ/m2.Reference Demkowicz, Hoagland and Hirth29
We propose that mechanically stable interfaces may be identified by Γ, the ratio of the bicrystal stability parameter, CX, to the normalized interface energy, IE:
 $${\rm{\Gamma }} = {{{\rm{CX}}} \over {{\rm{IE}}}}\quad.$$
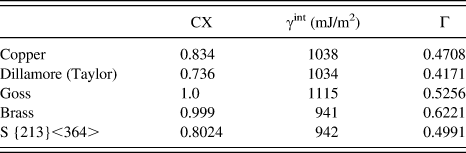
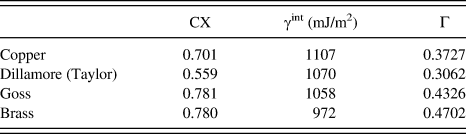
This figure-of-merit Γ can be used to identify if a candidate interface will be stable under rolling. To demonstrate its utility, Γ has been calculated for interfaces created by joining one of several selected fcc orientations with one of three bcc orientations: {112}<110> in Table IV, {001}<110> in Table V, and{111}<110> in Table VI.
Orientation stability (CX), interface energy (γ int), and stability parameter, Γ = CX (γ KS/γ int) for interfaces joining different Cu crystal orientations with the Nb {001}<110> component. (TD‖<1-10>).
Orientation stability (CX), interface energy (γ int), and stability parameter, Γ = CX (γ KS/γ int) for interfaces joining different Cu crystal orientations with the Nb {111}<1-10> component. (TD‖<11-2>).
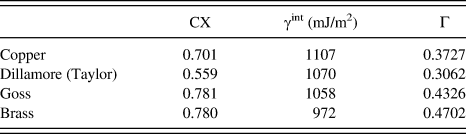
We find that the values of Γ correlate well with experimental observations. The interfaces with the highest values of Γ correspond to some of the few interfaces that prevail in the ARB nanostructured samples, such as the {338}<443>‖{112}<110> interface at submicrometer scales (h = 200 nm) Refs. 1 and 7 and the Goss‖{112}<110> interface at the nanoscale (h = 10 nm). It is also clear from Tables IV–VI why the Brass and S components are not predominant components in the Cu phase of the composite as they are in monolithic Cu. Interfaces associated with the Brass component have lower values of Γ, due to their high interface energies. Those involving the S component have even lower values of Γ, due to less mechanical stability and high interface energies. Thus, while these components are stable and increase in intensity with strain in monolithic Cu, they are unfavorable in bimetal composites as they have high interface formation energies. Another notable and perplexing change was the loss of the {001}<110> component in Nb and the sharpening to a singular component near {112}<110> (the I-component) when the layer thickness is below 100 nm. The values of Γ associated with interfaces formed with {001}<110> component in Nb in Table V are much lower than those formed with the I-component in Nb (Table IV). Thus, Γ indicates that interfaces associated with the former eventually disappear, as they are not as stable as the latter due to a lower CX and higher interface formation energy. The calculations also explain why the {111}<110> component was curiously absent from the rolling texture of the Nb phase. The Γ values for interfaces between this Nb component and all the candidate texture components in Cu are comparatively low. Based on these results, we can conclude that interfaces are stable in deformation as long as the adjoining crystals are stable and the interfaces have low formation energies.
While the figure-of-merit Γ has proven effective, the simple arguments on which it is based cannot possibly cover all possible interface orientation relationships and microstructural length scales. The effectiveness of Γ relies on the assumption of homogeneous slip within each adjoining crystal, a situation most applicable to length scales as low as a few tens of nanometers. A more complete assessment can be achieved by considering all three aspects, including kinetics, as illustrated in the triad in Fig. 5.
In the light of the above observations, it appears that when layer thicknesses are below one micrometer and the bimetal interface to grain boundary area ratio is high, significant deviations from monolithic behavior are observed. As we have shown, when layer thicknesses are refined via severe plastic deformation to the nanoscale, we attain a highly oriented microstructure with a high density of clean, defect-free interfaces. Alongside this atypical microstructure, extraordinary mechanical properties are expected. These are discussed next.
III. MECHANICAL PROPERTIES
A. Nanomechanical and bulk testing methods
The room temperature mechanical response of the ARB composites were determined via a suite of techniques encompassing bulk tension testing in addition to micropillar compression and nanoindentation. Micropillar compression and quasistatic nanoindentation were carried out on an Agilent NanoXP nanomechanical tester with either a 30-μm diameter flat tip punch or Berkovich diamond indenter tip, respectively, with the indentation axis perpendicular to the interface plane in all cases. Micropillar compression testing was executed in displacement control with the Continuous Stiffness Mode disabled at an initial strain rate of 1 × 10⁻⁴/s. Nominal dimensions of the micropillars produced via focused ion beam (FIB) milling were 8/16 μm with an aspect ratio between 2 and 2.5. It has been shown elsewhereReference Greer and De Hosson33 that extrinsic pillar size effects are minimal in this class of material. For this investigation, the stress-strain curve presented is representative of the results obtained from the compression of seven micropillars. A custom-built goniometer stage was utilized to optimize alignment between the flat tip punch and the pillar surface. Thermal drift rates were below 0.05 nm/s for all tests. Nanoindentation hardness values (strain rate of 0.05/s, displacement control) were taken for contact depths between 1000 and 1500 nm and the measured elastic modulous from all indentation data at these depths was 132 GPa, in agreement with a rule-of-mixtures bulk modulus value of 136 GPa (using 130 GPa for Cu and 143 GPa for Nb). The contact depths were chosen to ensure that at least two interfaces were penetrated, thus representing a composite response.
Bulk tension testing was carried out on an MTS Mini-Bionix load frame. The gauge section was 2.032 mm wide by 8.89 mm long by 0.2 mm thick. This specific geometry has been utilized by other investigators.Reference Eason, Odette, Nanstad and Yamamoto34 Gripping of the sample was accomplished through clamp-style grips, and fracture consistently occurred in the center of the gauge. The scaled tensile bar specimens were tested in accordance with ASTM E8 with regards to the condition of the test machine and sample preparation. In lieu of a traditional clip-on extensometer, a calibrated laser extensometer was used to determine the elongation of the gage length. The specimen geometry was based on an ASTM standard geometry with suitable scaling to allow for the testing of small samples. The sample was strained at a constant displacement rate at room temperature corresponding to an initial strain rate of 1 × 10⁻³/s.
B. Hardness
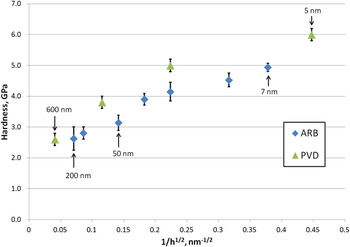
Figure 7 shows hardness measurements of the ARB Cu-Nb material as a function of layer thickness h. We only plot the ARB Cu-Nb material with layer thicknesses in the submicrometer to nano regime ranging from h = 714 nm to h = 7 nm, in which characteristic interfaces are known to prevail throughout the material. Overall, we find that the hardness increased with decreasing h, reaching an ultrahigh value of 5 GPa for h = 7 nm. This value is two orders of magnitude higher than those of Cu or Nb.
Nanohardness versus h−1/2 for ARB and PVD multilayers. Note that the hardness values for the ARB material are less than that for the PVD material.

Of particular interest is the role of the interface on overall composite strength. In this pursuit, we include in Fig. 7 for comparison, hardness values for 50/50 Cu-Nb multilayers fabricated by physical vapor deposition (PVD).Reference Misra, Hirth and Hoagland35 These PVD films were made with alternating Cu and Nb layers and formed interfaces that are sharp and planar, with predominant Kurdjumov-Sachs (KS) {111}<110>Cu‖{110}<111>Nb and Nishiyama-Wasserman (NW) {111}<110>Cu‖{001}<111>Nb interface orientation relationships. For the submicrometer layer thicknesses, like in the ARB composites, the PVD composites have polycrystalline layers, wherein one grain spans an individual layer thickness and contains minimal substructure. However, unlike the ARB interfaces, the KS and NW interfaces are not atomically faceted, but atomically flat.Reference Beyerlein, Mara, Wang, Carpenter, Zheng, Han, Zhang, Kang, Nizolek and Pollock3, Reference Misra, Hirth and Hoagland35 For all the PVD samples shown in Fig. 7, the KS and NW interfaces occurred uniformly throughout the material. The comparison in the hardness of the PVD and ARB samples reveals a significant difference, with the ARB samples showing a 15–25% decrease in average hardness for a given average layer thickness, across all length scales.
We propose that this consistent difference in hardness is caused by a difference in the crystallography of their characteristic interfaces. The prevailing interfaces in the ARB and PVD multilayers place the adjoining crystals in different orientations with respect to the direction of nanoindentation. Hardness measurements are made normal to the interfaces, compressing along the ND of the film (PVD) or sheet (ARB). In the ARB samples, the crystallographic axes aligned along the ND range from [4 4 11] to [112] in Cu in the submicrometer h samples and are predominantly along [110] in the nanoscale h samples, whereas in the PVD samples, the ND axis lies parallel to [111] in Cu for all h Ref. 1. Much higher yield strengths in [111] than [112] and [110] have been measured in several fcc crystals and calculated in model systems (for a review see Ref. Reference Wang, Beyerlein and LeSar36). The same argument can be made for Nb, with compression in [112] being weaker than in [110] in bcc crystals.Reference Wang and Beyerlein27 Thus, it appears that single crystal plastic anisotropy can provide a plausible explanation for the constant difference in hardness across this wide range of length scales.
Other explanations are still conceivable, such as one related to differences in the defect structure of the characteristic interfaces found in the PVD and ARB samples. The profound influences of atomic interface structure on interface properties and functionality were recently reviewed in Ref. Reference Beyerlein, Mara, Wang, Carpenter, Zheng, Han, Zhang, Kang, Nizolek and Pollock3. Yet, it is not possible, based on current knowledge, to attribute the hardness difference to an effect of interface properties on a particular deformation mechanism, such as interface slip transmission or twinning. The reason is that no single mechanism is expected to dominate over the submicrometer to nanoscale regime. In the case of the PVD foils, three length-scale dependent strengthening mechanisms have been proposedReference Misra, Hoagland, Schwarz, Contescu and Putyera37: Hall-Petch (>100 nm), confined layered slip (>5 nm), and slip transmission across the interface (<5 nm). For the ARB material, there is no reason to doubt that these same strengthening mechanisms would operate as well, but some evidence has suggested that they would be dominant at different length scales. For instance, deformation twinning becomes noticeable in ARB Cu-Nb material at h = 50 nm (6.6% volume fraction) and has been correlated with the slip transmission across the interface.Reference Quadir, Al-Buhamad, Bassman and Ferry4, Reference Demkowicz and Thilly8 This association implies that interface slip transmission occurs at a higher length scale in the ARB material than the PVD material (h = 2–5 nm). In summary, the fact that the ARB material is consistently lower in strength regardless of dominant deformation mechanism suggests that the difference in hardness between PVD and ARB materials is due to their differing crystallographic orientations rather than their differing interface defect structure. By virtue of geometrically “soft” ND crystal orientations associated with the ARB-predominant interfaces as compared with the geometrically “hard” ND orientations of the PVD foils, the composite hardness measured in the ND is lower in the ARB than the PVD material.
C. Micropillar compression
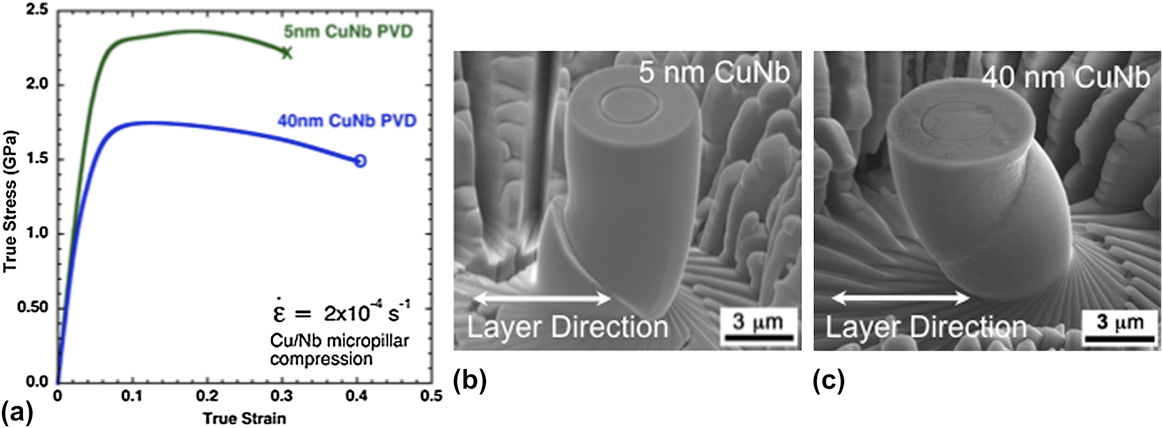
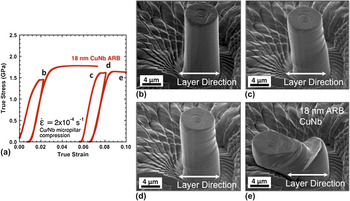
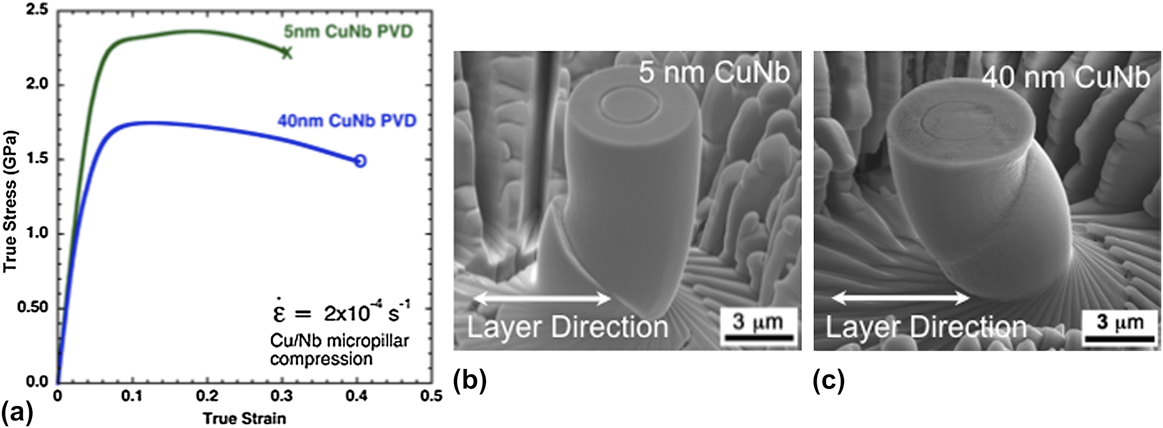
While quantities such as elastic modulus, hardness, and even in some cases, stress-strain behaviorReference Kalidindi and Pathak38, Reference Pathak, Michler, Wasmer and Kalidindi39 can be obtained from nanoindentation, it is difficult to tie these quantities to anisotropy, shear localization and failure mechanisms.Reference Mara, Bhattacharyya, Dickerson, Hoagland and Misra40, Reference Mara, Bhattacharyya, Hirth, Dickerson and Misra41 As such, techniques such as micropillar compression allow for a known stress state to be applied to small volumes of material and can provide the entire stress-strain response from elasticity to failure.Reference Uchic, Dimiduk, Florando and Nix42 The micropillar compression samples tested in this study are fabricated via a two-step milling process using a focused ion beam (FIB) microscope as detailed in Refs. Reference Mara, Bhattacharyya, Hirth, Dickerson and Misra41 and Reference Mara, Bhattacharyya, Dickerson, Hoagland and Misra40. Milling sites were chosen toward the sample centers for both the ARB and PVD multilayers. Testing was conducted using an Agilent Nanoindenter XP at a nominal strain rate of 2 × 10⁻⁴/s. Figures 8 and 9 compare the stress-strain response from micropillar compression of h = 5 and 40 nm PVD material (Fig. 8) with h = 18 nm ARB material (Fig. 9). The ultimate strengths achieved by these three materials exceed those of Cu or Nb by an order of magnitude; notably the ARB material achieves a peak strength in excess of 2 GPa. The ARB material increases in strength until it reaches a plateau. It eventually fractures at a true strain of 0.1 with minimal softening. In contrast, the PVD pillars at both layer thicknesses achieve their maximum flow stress at a true strain of ∼0.15 before the onset of strain softening over large strains.
(a) True stress versus true strain for 40-nm and 5-nm layer thickness PVD material. Note the pronounced strain softening after yield. (b) 5-nm and (c) 40-nm micropillars after deformation as in (a). Both micropillars have pronounced shear instabilities, with the 40-nm micropillar exhibiting a continuous shear band as opposed to the fracture seen in the 5-nm layer thickness sample.
(a) True stress versus true strain curves for the h = 18-nm Cu-Nb ARB material. (b–e) Scanning electron micrographs of micropillars of 18-nm layer thickness ARB material at points a through d as noted in the true stress versus true strain curve in (a). In contrast to the PVD micropillars, there is little strain softening, and the micropillar fails at a strain of 0.1. Ultimate strength is 1.7 GPa.

These differences in failure response can be attributed to characteristics of their predominant interfaces. In both the 5- and 40-nm PVD materials, strain softening was caused by the formation of a single concentrated shear band followed by interfacial sliding within the shear band [see Figs. 8(a) and 8(b)].Reference Mara, Bhattacharyya, Dickerson, Hoagland and Misra40, Reference Mara, Bhattacharyya, Hirth, Dickerson and Misra41 Internal interfacial sliding is possible as the shear band did not discontinuously cut across the layers but uniformly reoriented the layers, maintaining their continuity. The local reorientation increased the resolved shear stress on the interface planes, which drove interfacial sliding. The resistance to interfacial shearing of the KS and NW interfaces in PVD has been found to be sufficiently low that interfacial sliding becomes a favorable mechanism for failure.Reference Li, Mara, Wang, Dickerson, Huang and Misra43 In contrast to the PVD material, the ARB material failed, not by a few concentrated shear bands, but by “diffuse shear banding”, described by many fine shear bands distributed uniformly along the length of the micropillar. Figures 9(c)–9(f) shows a series of four SEM micrographs that were taken correspondingly at points A through D on the included stress-strain curve for 18-nm layer thickness ARB material. The comparison reveals that the peak stress at a 0.1 true strain corresponds with the onset of a uniform distribution of tiny shear bands. Moreover it shows that this type of failure progression does not cause macroscopic strain softening. While additional microscopy and in situ straining need to be carried out to elucidate the details behind the diffuse-type failure progression in the ARB material, it is apparent that the failure mode in the ARB and PVD materials are distinctly different. The PVD failure mode involves interfacial sliding, a deformation mechanism that we suspect is difficult for predominant ARB interfaces. Low-temperature atomic scale simulation has found that the former ARB interface is more resistant to shear than the PVD KS interfaces (e.g., being 1550 MPa for {112}<111>Cu‖{112}<110>Nb versus 300–1000 MPa for KS).Reference Demkowicz and Thilly8, Reference Wang, Kang, Zhang, Zheng, Beyerlein and Mara10 Also, the narrow set of predominantly ARB interfaces includes Cu crystals in the Copper {112}<111> orientation, which has been observed to be prone to intracrystalline banding under plane strain compression (termed microbanding in Ref. Reference Wagner, Engler and Lücke44). Once microbanding starts within individual Cu crystals, it can eventually culminate into shear banding across the layers, ultimately leading to fracture.
To conclude we suspect that in micropillar compression, failure of the ARB material is triggered by shear localization within the Cu crystals in the form of microbands, which is responsible for the development of diffuse shear banding across the material. This failure mode likely does not involve interfacial sliding as the interfaces are theoretically (2–5 times) stronger in shear than the KS interfaces in the PVD material. Additionally no strain softening was observed in the macroscopic response of the ARB material. These micropillar compression tests point to an interesting and pronounced effect of interfacial shear strength on the formation of shear instabilities in nanolamellar composites that warrants further study.
D. Bulk tensile testing
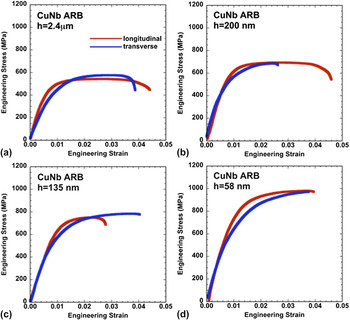
Because the ARB nanocomposites are in bulk form, tensile tests using samples of bulk geometry can be carried out in either the rolling (RD) or transverse directions (TD). Figure 10 shows the RD and TD tensile stress-strain curves for four different layer thicknesses. The ultimate tensile strengths in RD and TD increase as layer thickness decreases, reaching 1 GPa at h = 58 nm. Significantly at all length scales tested, we find only subtle differences between the work hardening behavior in the RD and TD. This response is distinct from severely deformed single-phase Cu, for instance, which exhibits pronounced plastic anisotropy.Reference Mahesh, Tomé, McCabe, Kaschner, Beyerlein and Misra45–Reference Yapici, Beyerlein, Karaman and Tomé47
Bulk tensile stress-strain curves for the (a) 2400-nm, (b) 200-nm, (c) 135-nm, and (d) 58-nm Cu-Nb ARB material tested along the RD (longitudinal) and TD (transverse) directions.

III. CONCLUSIONS
Cu-Nb multilayers fabricated by accumulative roll bonding with submicrometer to nanolayer thicknesses were studied to develop an understanding of the mechanical stability of bimetal interfaces and measure their effect on mechanical behavior. From these investigations, the following conclusions can be drawn.
(i) As interfacial areal fraction increases, the material selects interface configurations (orientation relationships and interface planes) that are associated with crystallographic orientations that accommodate the deformation and are relatively low in formation energy. For ARB multilayers with submicrometer layer thicknesses, the predominant interfaces fall within a narrow range, spanning {112}<111> fcc‖{112}<110>bcc to {4 4 11}<11 11 8>fcc‖{112}<110>bcc. For multilayers with fine nanoscale layer thicknesses (h = 10 nm), the predominant interfaces are within 10° of Goss{110}<001>fcc‖{112}<110>bcc.
(ii) Based on the above conclusions, a figure-of-merit Γ for mechanical interface stability is introduced that correlates well with experimental observations. The submicrometer- and nanoscale-predominant interfaces have the highest values of Γ of all interfaces considered.
(iii) The hardness of the ARB multilayers increases from 1.8 to 4.5 GPa as the layer thickness decreases from 700 nm to 7 nm.
(iv) Over this same range, the hardness of the ARB multilayers measured normal to the interfaces are consistently 15–25% lower than that for the PVD multilayers for the same layer thickness h.
(v) In micropillar compression, the ARB nanolayered composite (h = 18 nm) achieved a strength of 1.78 GPa at a true failure strain of 0.1.
(vi) The ARB material fails by many distributed shear bands in contrast to the PVD material, which fails by a few concentrated shear bands. Differences in failure mode are attributed to differences in the interfacial shear strength (ISS) of the predominant ARB interfaces versus the predominant PVD interfaces. Theoretically the PVD interfaces have an ISS that is less than 1000 MPa, whereas the ARB interfaces have an ISS that is greater than 1500 MPa.
(vii) Bulk nanostructured ARB material (h = 58 nm) achieved an ultimate tensile strength of 1 GPa when tested in both the TD and RD of the rolled sheet.
ACKNOWLEDGMENTS
Crystal plasticity modeling, ARB synthesis, EBSD-based characterization and nanomechanical testing were supported by a Los Alamos National Laboratory Directed Research and Development (LDRD) Project DR20110029. Atomic scale simulation was supported by the Center for Materials at Irradiation and Mechanical Extremes, an Energy Frontier Research Center funded by the U.S. Department of Energy, Office of Science, Office of Basic Energy Sciences under Award No. 2008LANL1026. TN was supported by the Department of Defense (DoD) through the National Defense Science & Engineering Graduate Fellowship (NDSEG) Program. TMP and IJB wish to acknowledge support for mechanical testing by the UC Lab Fees Research Program No. UCD-12-0045.15. This work was performed, in part, at the Center for Integrated Nanotechnologies, an Office of Science User Facility operated for the U.S. Department of Energy (DOE) Office of Science. Los Alamos National Laboratory, an affirmative action equal opportunity employer, is operated by Los Alamos National Security, LLC, for the National Nuclear Security Administration of the U.S. Department of Energy under Contract No. DE-AC52-06NA25396.