Introduction
During the last two decades, III–V technologies have been the preferred candidates for high-power and/or high-frequency applications due to its natural high performances in terms of, e.g. high breakdown voltage and superior carrier velocity saturation. However, most of these devices are still expensive and incompatible with the integration in silicon platform that permits the co-integration of control circuitry and digital functions. For these reasons, complementary metal-oxide semiconductor (CMOS) structures have been widely investigated to overcome the inherent low output power delivered by highly scaled active devices. Although radio frequency (RF) watt-level power amplifier (PA) structures have been reported in literature with advanced CMOS technologies, the main common disadvantage is the use of complicated stacked-field effect transistor (FET) active cells combined through bulky and lossy integrated passive devices (e.g. advanced distributed active transformers structures) that mitigate the final benefits in terms of RF power density versus energy efficiency for a given silicon area.
As a promising alternative, a new device termed as MASMOS was developed and patented by ACCO [1] that solves the inherent CMOS transistors breakdown voltage limitation in RF power applications. This structure is built with a unique cascode combination of two different silicon-based transistors that allows comparable RF power density with respect to conventional gallium arsenide devices, with CMOS advanced process fully integration capabilities.
In this work, the main objective will be to implement these MASMOS structures into a radio frequency power amplifier (RFPA) for long term evolution (LTE) applications purposes whose final performances will rely on the non-linear transistor model accuracy. Therefore, this paper focuses on the modeling approach followed to derive the electrical model for MASMOS structures. In our case, modeling process is based on an empirical method allowing the best compromise between development time and performances prediction accuracy. This paper is organized as follow: MASMOS characterization and model description section presents the model parameters extraction, Model validation section focuses on static small- and large-signal continuous wave (CW) model validation, Dynamic multi-tones measurement section presents large-signal dynamic model validation with the use of an innovative generic multitoned signal, and Conclusion section concludes this paper.
MASMOS characterization and model description
IV characterization and convective modeling
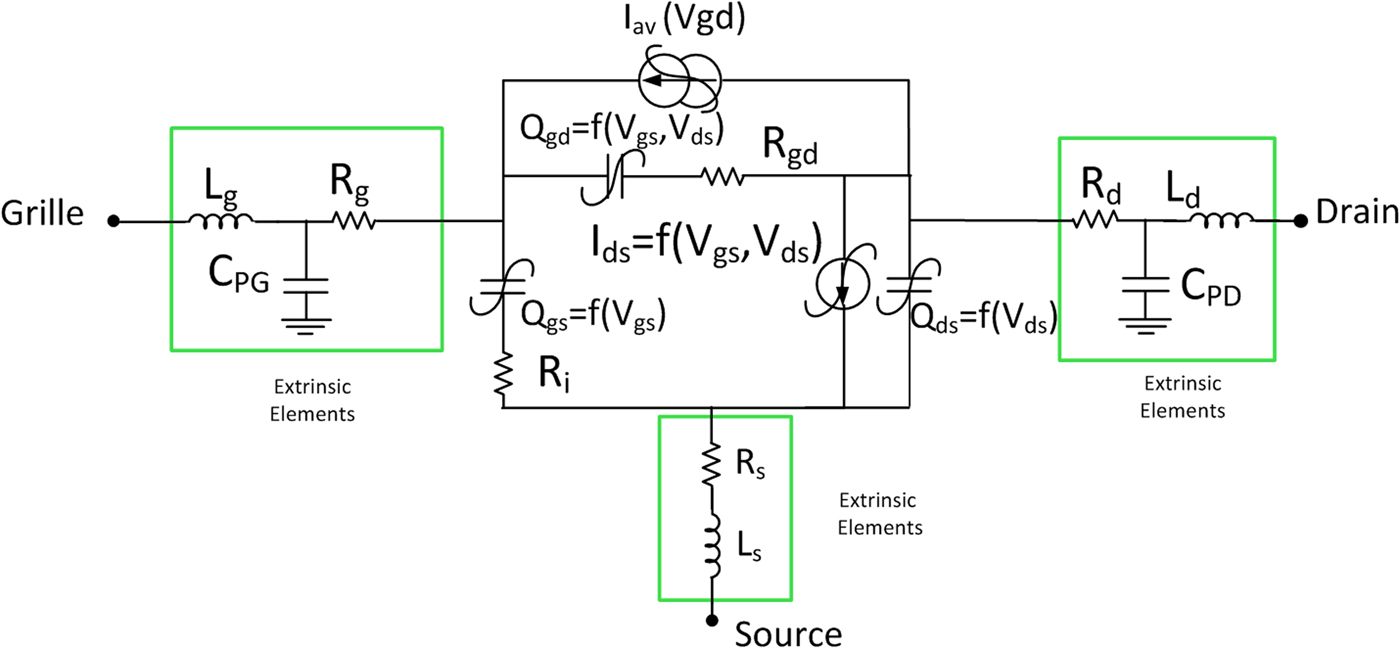
A first model has been made on MASMOS structure and detailed in [Reference Simbélie, Laurent, Medrel, Prigent, Quere, Regis and Creveuil2]. In this paper, we focus on two different MASMOS structure sizes, having total gate periphery of: MASMOS A: 0.55 mm × 0.27 mm and MASMOS B: 0.55 mm × 0.47 mm. Structures differ on the number of fingers for each N-channel metal oxide semiconductor (NMOS) and junction field effect transistor (JFET). Each NMOS and JFET transistors of MASMOS B are four times higher than those of the MASMOS A. Although the physical MASMOS structure is very complex, we will validate through small- and large-signal measurement and simulation comparisons the possibility to model electrical performances with a conventional three-port electrical non-linear model as shown in Fig. 1. Compared with the existing proprietary physical model, the main advantages are the convergence capabilities and highly reduced simulation time.
Three-port MASMOS non-linear electrical model.
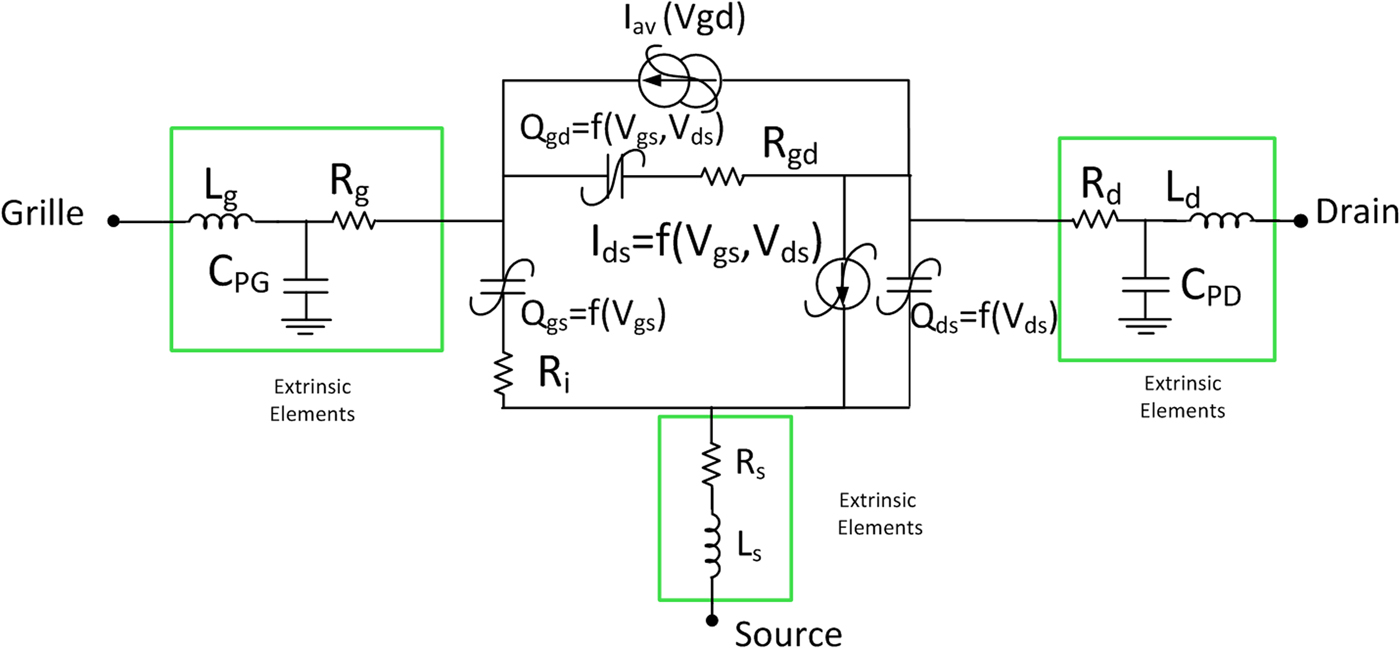
The MASMOS model is built around an intrinsic voltage-controlled non-linear current source described by a two-dimensional mathematical function whose control terminals are the internal gate to source and drain to source voltages I ds(V gs, V ds). This non-linear convective source is based on previous work reported in [Reference Jardel, Callet, Charbonniaud, Jacquet, Sarazin, Morvan, Aubry, Poisson, Teyssier, Piotrowicz and Quéré3], and is augmented here in order to account for the specific triode (non-saturated) region of the MASMOS operation. A traditional current source I av(V gd) was also added to mimic the avalanche phenomenon between gate and drain accesses that bounds the swing across the MASMOS device.
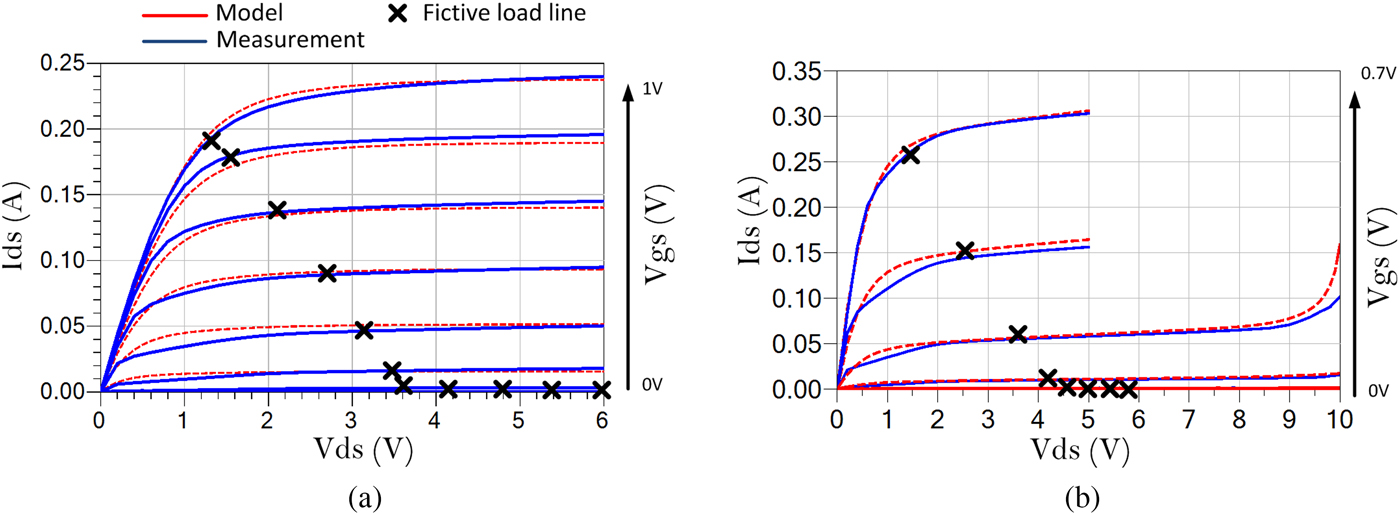
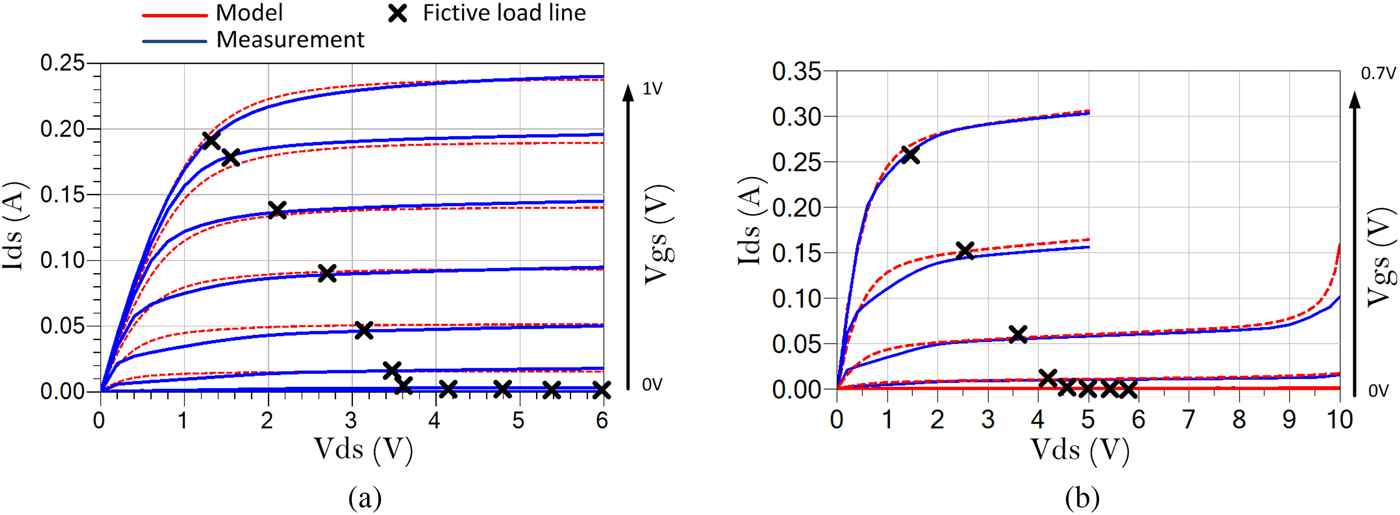
Comparisons between pulsed DC drain current measurements and simulations for both MASMOS A and MASMOS B with respect to the internal node voltages are shown in Fig. 2. DC measurements were performed using Keysight semiconductor device parameters analyzer, B1500 A. The control voltage of the second transistors is fixed to 0 V.
MASMOS A (V ds = 0–6 V, step 0.1 V and V gs = 0–1 V, step 0.1 V) and MASMOS B (V ds = 0–10 V, step 0.1 V and V gs = 0–0.8 V, step 0.1 V) DC I–V curves.
Model parameters extraction from S-parameter measurements
Low-frequency (LF) S-parameters (<100 MHz) measurements allow a direct and straightforward extraction of the intrinsic non-linear elements as they remove the influence of the extrinsic reactive effects of the device. A fictive loadline has been defined that reflects a typical class-AB operation of the MASMOS active device in a RFPA application (Fig. 2). Non-linear intrinsic capacitance values C gs, C gd, and C ds of the MASMOS are extracted from multi-bias LF S-parameters measurements as a function of the frequency (from 40 to 100 MHz) along this trajectory, and are tuned so that their values remain quasi-constant with respect to the frequency by definition. From the associated Y-parameters, the capacitances are derived from [Reference Dambrine, Cappy and Heliodore4]:
 $$C_{gs} = \displaystyle{{Im(Y_{11} ) + Im(Y_{12} )} \over {2\pi f}},$$
 $$C_{gd} = \displaystyle{{ - Im(Y_{12} )} \over {2\pi f}},$$
 $$C_{ds} = \displaystyle{{Im(Y_{22} ) + Im(Y_{12} )} \over {2\pi f}}.$$
Non-linear capacitances are modeled with the same mathematical function [Reference Forestier, Gasseling, Bouysse, Quéré and Nebus5] defined in equation (4), where the V parameter stands either for V gs, V ds, or V gd depending on the capacitance being modelized. This expression has 10 fitting parameters (C 0, C 1, C 2, C 3, A, B, C, V m, V n, V p) that have to be optimized for each capacitance being considered.
 $$\eqalign{& C = C_0 + \displaystyle{{C_1 - C_0} \over 2}\left[ {1 + \tanh (A*(V + V_m ))} \right] \cr & \qquad - \displaystyle{{C_2} \over 2}\left[ {1 + \tanh (B*(V + V_p ))} \right] \! + \displaystyle{{C_3} \over 2}\left[ {1 + {\rm tanh}(C*(V - V_n ))} \right].}$$
Finally, extrinsic parasitic parameters C PG, C PD, R g, L g, L d, L s are obtained after an iterative optimization procedure so that to ensure global consistency between S-parameters measurements and model simulations in the I–V regions where the model has been defined. It has to be noted that R s and R d access resistances were optimized at the current source model step, and are kept constant at this step. Comparison between MASMOS transistor model simulations and measurements are performed along the load line trajectory illustrated on Fig. 2 and are shown in Figs 3 and 4 for three different bias points (V gs, V ds). These figures clearly demonstrate that the proposed model of the structures are in good agreement with the obtained measurement. Thus, these models are capable to predict S-parameters for different bias points. MASMOS A and B parameter values at specific bias points (V ds = 3.45 V and V gs = 0.5 V, MASMOS A; V ds = 3.5 V and 0.47 V, MASMOS B) are given in Table 1.
S-parameters comparison between measurements (symbols) and simulations (lines) from 100 MHZ to 10 GHz at three different bias conditions of MASMOS A (V gs = 0.7 V, V ds = 2.7 V, red; V gs = 0.5 V, V ds = 3.45 V, blue; V gs = 0.4 V, V ds = 3.6 V, pink).

S-parameters comparison between measurements (symbols) and simulations (lines) from 100 MHZ to 10 GHz at three different bias conditions of MASMOS B (V gs = 0.6 V, V ds = 1.7 V, red; V gs = 0.47 V, V ds = 3.5 V, blue; V gs = 0.4 V, V ds = 4.6 V, pink).

Components values at a given bias point

Model validation
This section details the model validation steps using experimental load pull measurements and the comparison to harmonic balance simulations in Keysight's CAD Advanced Design System (ADS).
Large-signal characterizations have been performed at a fundamental frequency (f 0 = 2 GHz), corresponding to the center frequency of interest. The test bench includes a synthesized signal generator (68367 C Anritsu 10 MHz–40 GHz), two tuners (source and load impedance tuners with maximum operating frequency of 18 GHz) allowing the control of load impedance presented at f 0, 2f 0, and 3f 0, two power supply generators and a large-signal network analyzer (SWAP X402) for the measurement of current and voltage waveforms at the device accesses [Reference Ogboi, Tasker, Akmal, Lees, Benedikt, Bensmida, Morris, Beach and McGeehan6].
All the measurements have been performed at a single bias point depending on the MASMOS device being measured: MASMOS A (V gs = 0.5 V, V ds = 3.5 V) and MASMOS B (V gs = 0.47 V, V ds = 3.5 V), fixed by the application. Data measurements have been collected for the fundamental frequency and its eight first harmonics.
The procedure to validate the MASMOS non-linear model and to determine maximum power added efficiency (PAE) performances at 2 GHz frequency, for a given bias point, is depicted below. It is worth noting that optimization steps are highly iterative. In this experiment, only large-signal output loading conditions (at fundamental frequency and harmonics) have been studied. However, accounting for the optimum large-signal source impedances is also of interest optimization, as reported in [Reference Colantino, Giannini, Limiti and Teppati7].
(1) Experimentally, maximum PAE driving condition with a 50 Ω load at all frequencies is found by varying the input power.
(2) Then, we tune the f 0 load impedance to maximize PAE.
(3) Finally, we keep constant this f 0 load impedance and we tune the 2f 0 load impedance separately to maximize the PAE.
Else, the comparison between the measurement and model simulation will be made on the following three load impedance conditions:
• Condition 1: 50 Ω at all frequencies
• Condition 2: optimum load impedance at f 0, 50 Ω at the other frequencies
• Condition 3: optimum impedance at f 0 and 2f 0, 50 Ω at the other frequencies in order to maximize the PAE – these transistor's operating conditions are close to the loadline conditions defined a priori in Fig. 2.
Figure 5 shows comparison between simulation results from a previously derived physical model given in the foundry proprietary design kit and from the new compact model developed at XLIM and CW measurements, for the last load impedance configuration (condition 3) which is:
• MASMOS A: Z LOADf0 = (28 + j25) Ω; Z LOAD2f0 = (4 + j58) Ω
• MASMOS B: Z LOADf0 = (10 + j5) Ω; Z LOAD2f0 = (4 + j12) Ω
This figure shows that the model prediction for output power, power gain, PAE, and input reflection coefficient are in good agreement with the experimental load pull performances.
Large-signal CW performances comparisons: output power, gain, and PAE comparison between measurements (black dots) and simulation (red and blue lines) for MASMOS A and B in the third load condition.

Predictivity capabilities of the compact MASMOS model are also demonstrated by estimating the f 0 optimum fundamental impedance locus to be presented at the device RF drain port to maximize PAE performances. For that purpose, the real and imaginary parts of the impedance have been swept to determine the maximum PAE loading conditions. Figure 6 shows the comparison between optimum PAE load impedance found with a harmonic balance simulation of the developed model and the optimum impedance obtained during the measurement step. Input power value corresponds to a maximum PAE condition obtained from measurements shown in Fig. 5, second harmonic load impedance was fixed at 50 Ω in both cases. The optimum load impedance on the two Smith charts correspond to the PAE circle center: MASMOS A, Z LOADopt = 20 + j25 Ω and MASMOS B, Z LOADopt = 7.5 + j5 Ω.
PAE circles of MASMOS models A and B, step 2%.

It has been demonstrated that the two developed models can be effectively used to predict the optimal load impedance at the fundamental frequency in order to obtain the maximum PAE of the devices. In Fig. 6, the PAE and output power circles are presented when the load impedance at the fundamental frequency is fixed at the value determined in Fig. 5 and when the load impedance at 2f 0 is moving toward the optimum value (condition 3). In the case of MASMOS A, the PAE and output power are respectively, 61.8% and 23 dBm. For MASMOS B, the maximum PAE is 51.2% and the maximum output power is equal to 26.8 dBm. These contours can serve as a base for an optimization of the MASMOS-based PA design (Fig. 7).
PAE (step 2%) and pout (step 1 dBm) circles for MASMOS A and B.

Dynamic multi-tones measurement
To get more insights in the model accuracy, a dedicated large-signal experiment has been conducted. This measurement is based on an innovative time-domain load-pull-oriented characterization. So far, non-linear distortion-related measurements in microwave transistor/PA have consisted in quasi-static CW, even in two tone intermodulation characterizations if modulated source are available. With this kind of characterizations, complex LF/BF dynamic non-linear effects that are presented in the transistors action when used with applicative modulated signals. Today, some researches are leading to find an alternative test procedure closer to real operation conditions, e.g. complex modulations signal. Numerous techniques and related benches are exposed in literature to carry out multi-tones measurements [Reference Jose Carlos and Nuno Borges8, Reference Hajji, Beauregard and Ghannouchi9]. However, the common disadvantage of these methods is that it considers equally spaced tones conditions, so that some intermodulation products fall exactly on the same frequencies as the input signal, prohibiting the separation and measurement of in-band intermodulation (IM) products. The proposed measurements presented in this paper overcome this issue by using a specific multi-tones signal that permits to measure separately IMs and signal tones. In this case, we limit the tone number to 8 [Reference Westcott10]. The general expression of the frequency is expressed as:
 $$f_k = f_1 + (k - 1)\Delta _f + \varepsilon _k \quad 1 \le k \le 8,$$
where f 1 = l × f ε = 2.0025 GHz is the lowest frequency, Δf = m × f ε = 0.25 MHz is the frequency spacing between the tones and ε k = p k × f ε is the frequency shift of the kth frequency with respect to the position of the equally spaced frequency, with p k = [0, 27, 243, 9, 81, 1, 3, 729] and f ε = 976.6625 Hz. Expression (5) was experimentally implemented by defining a set of specific tones in a fine frequency grid having a resolution of f ε. Expression (5) is then rewritten as follows:
 $$f_k = \left[ {l + (k - 1)m + p_k} \right] \,f_\varepsilon \quad 1 \le k \le 8,$$
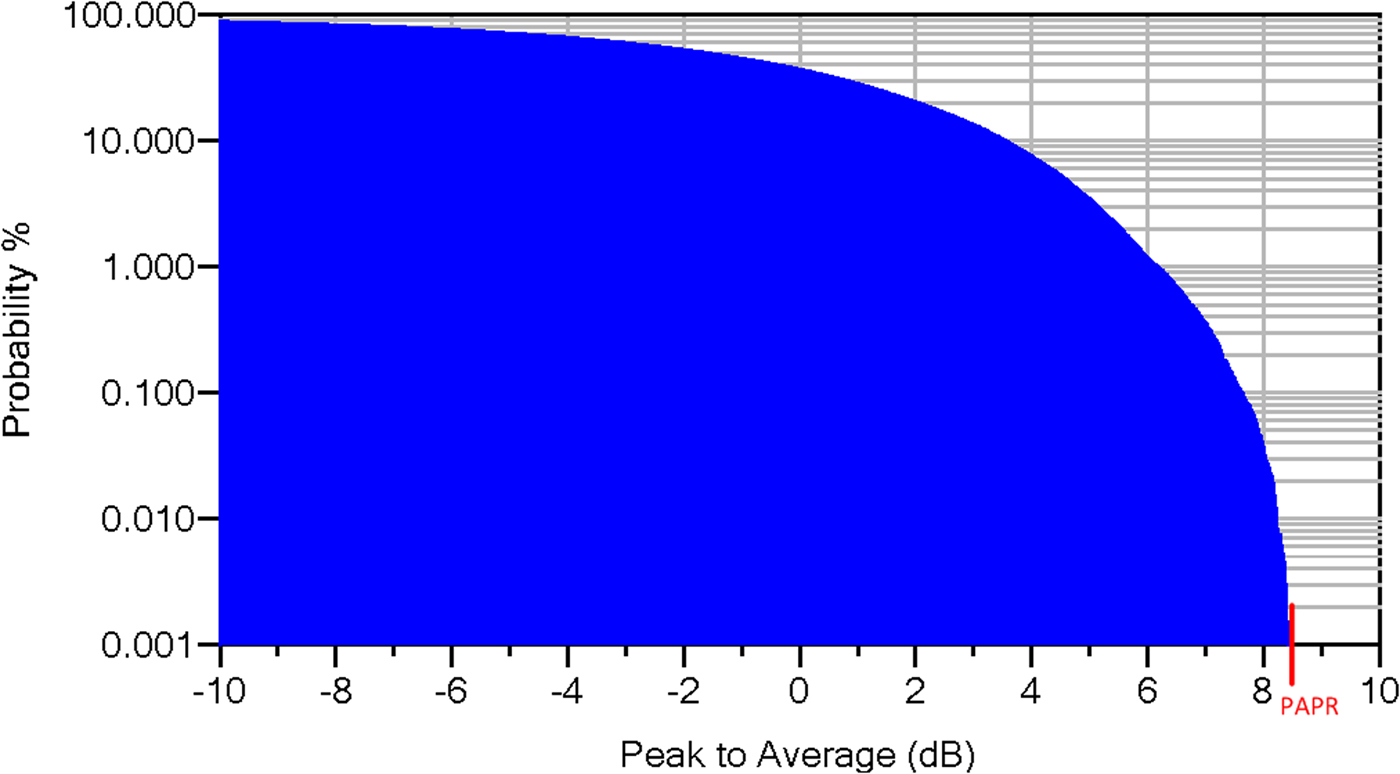
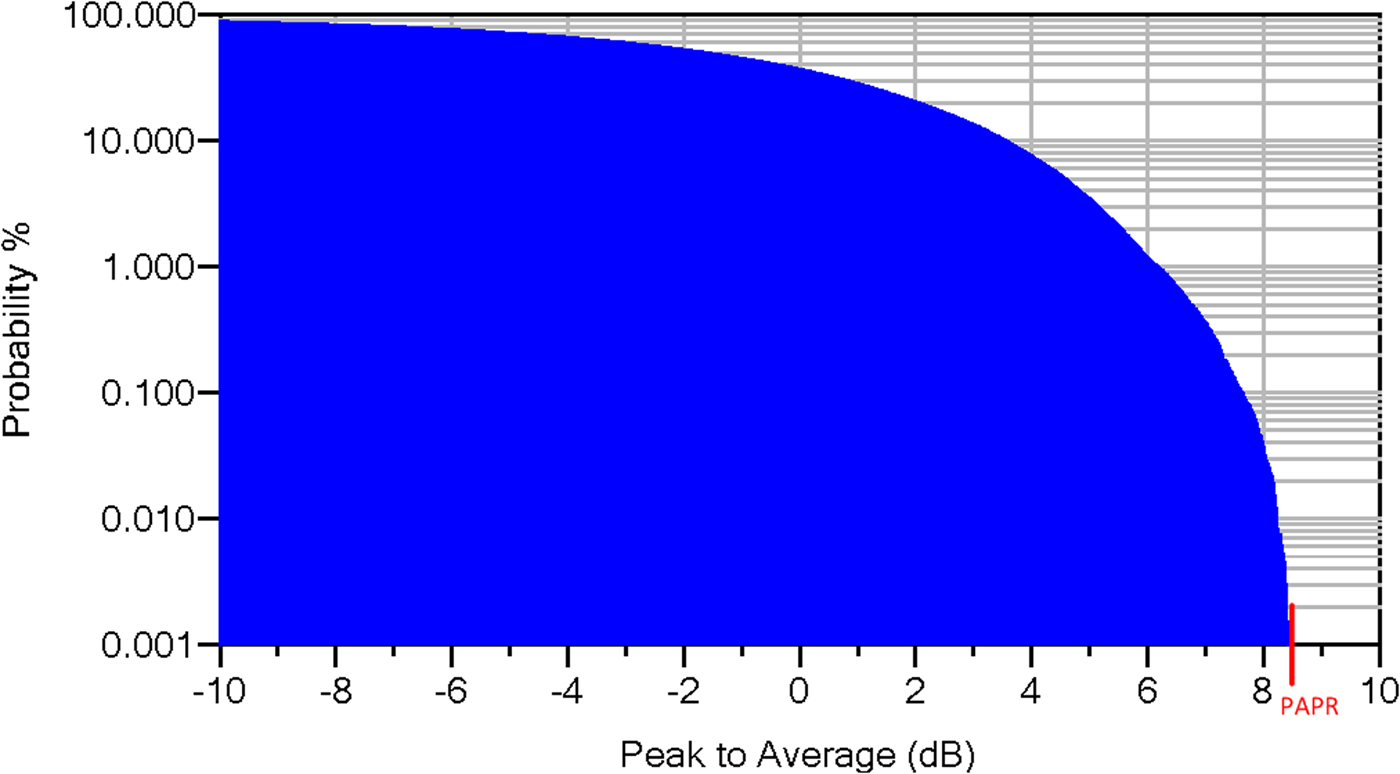
where l, k, m, p k are integers. In our experiment, we choose an eight-tone signal to perform measurement and the shifting vector p k in the expression (6) guarantees that each IM3 frequency is uniquely defined (i.e. IM products are distinct from each other and from the initial injected tones). In our case, the eight-tone signal has a bandwidth equal to 2.5 MHz (f 8 − f 1). The corresponding complementary cumulative density function (CCDF) which allows to characterize the probability provided the fact that the signal power is higher than a given envelope average power level. The computed CCDF of an eight-tone signal is shown Fig. 8 which demonstrates a PAPR of 8.6 dB.
Complementary cumulative density function of an eight-tone signal.
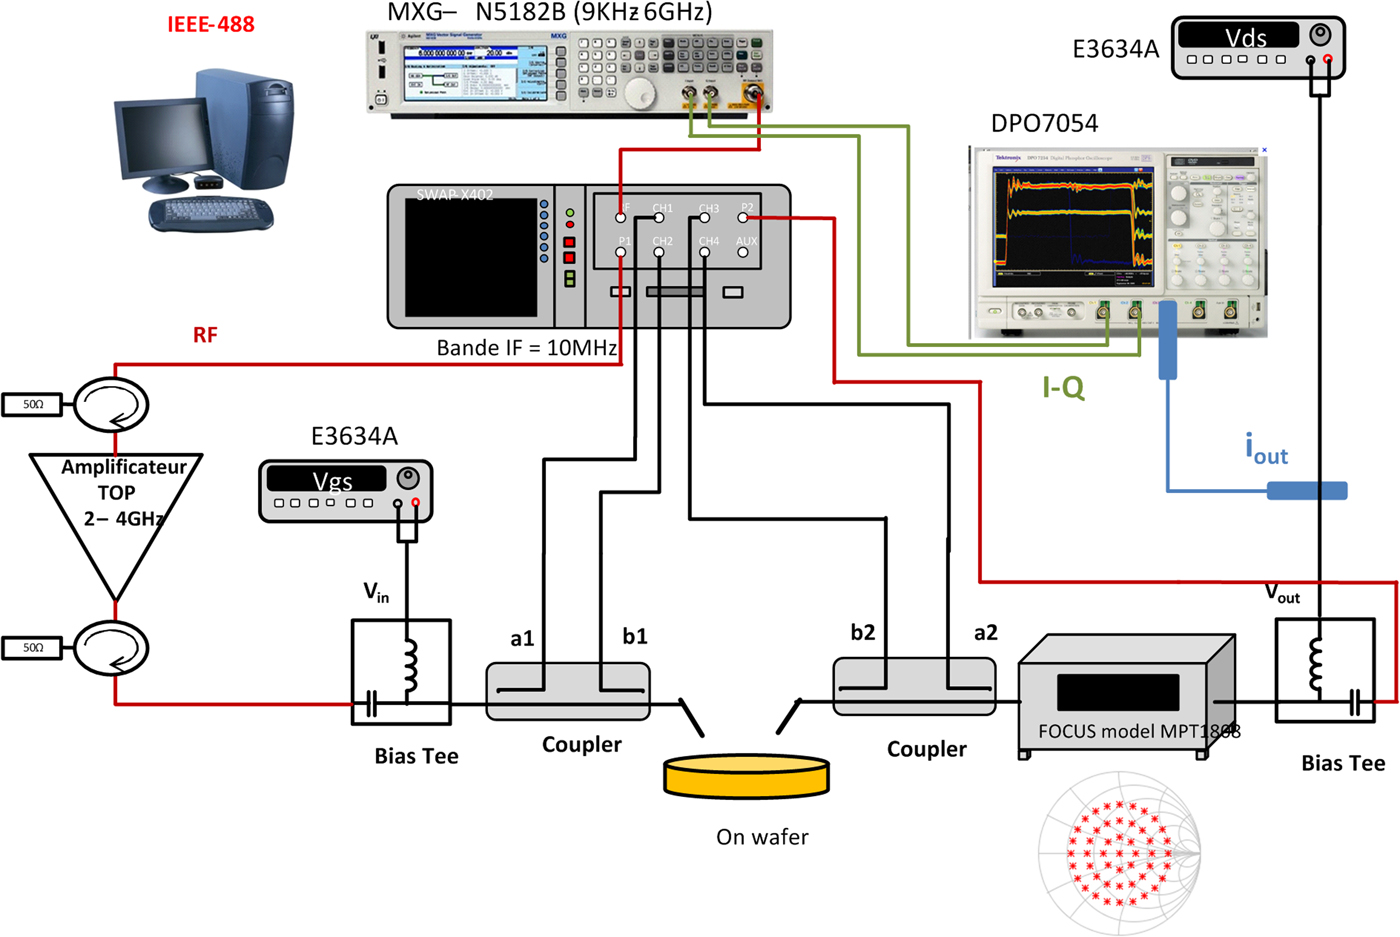
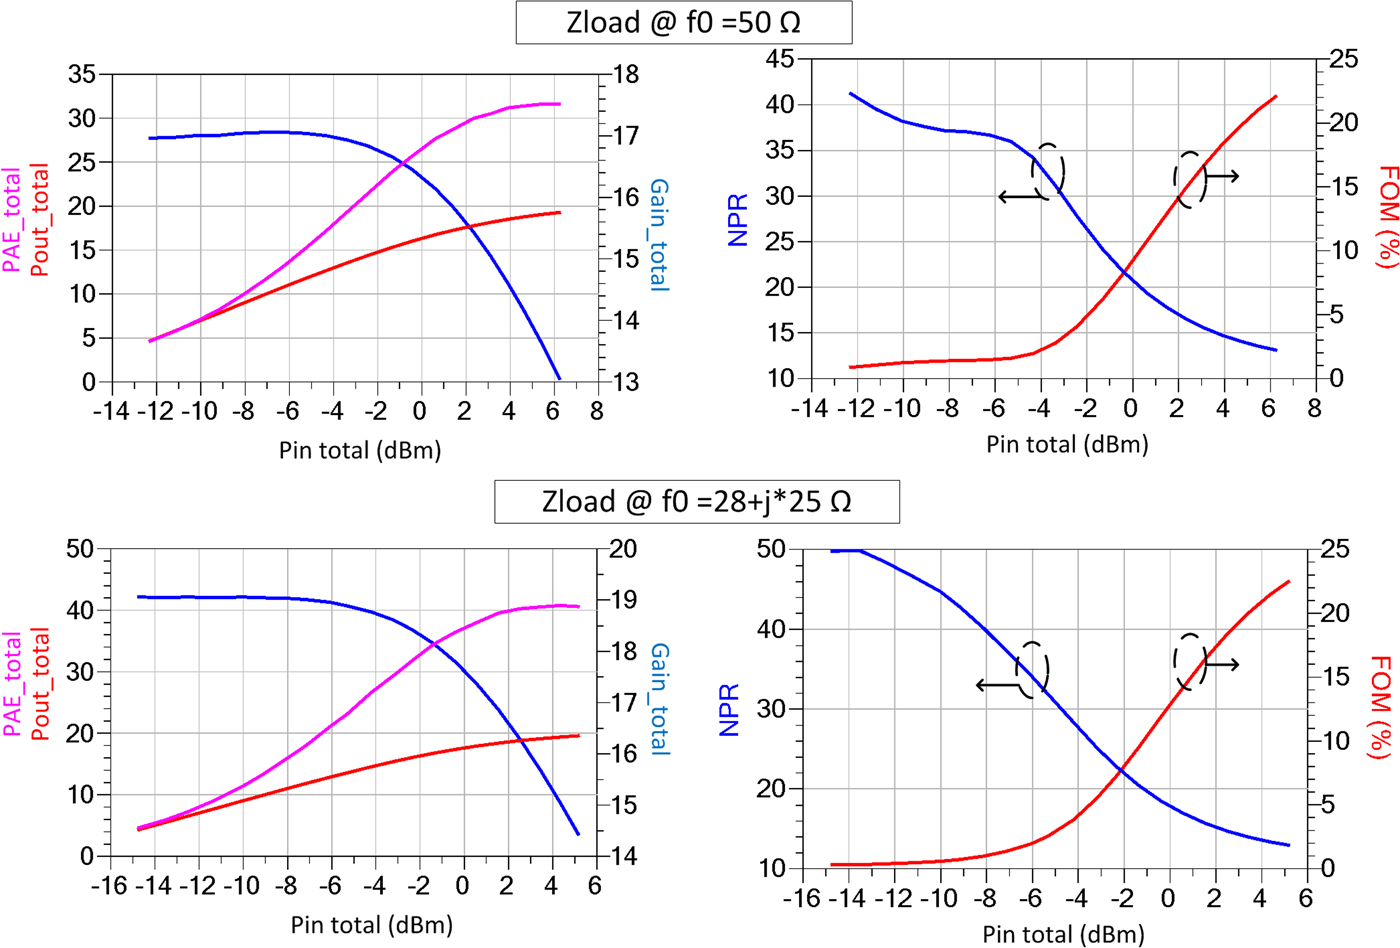
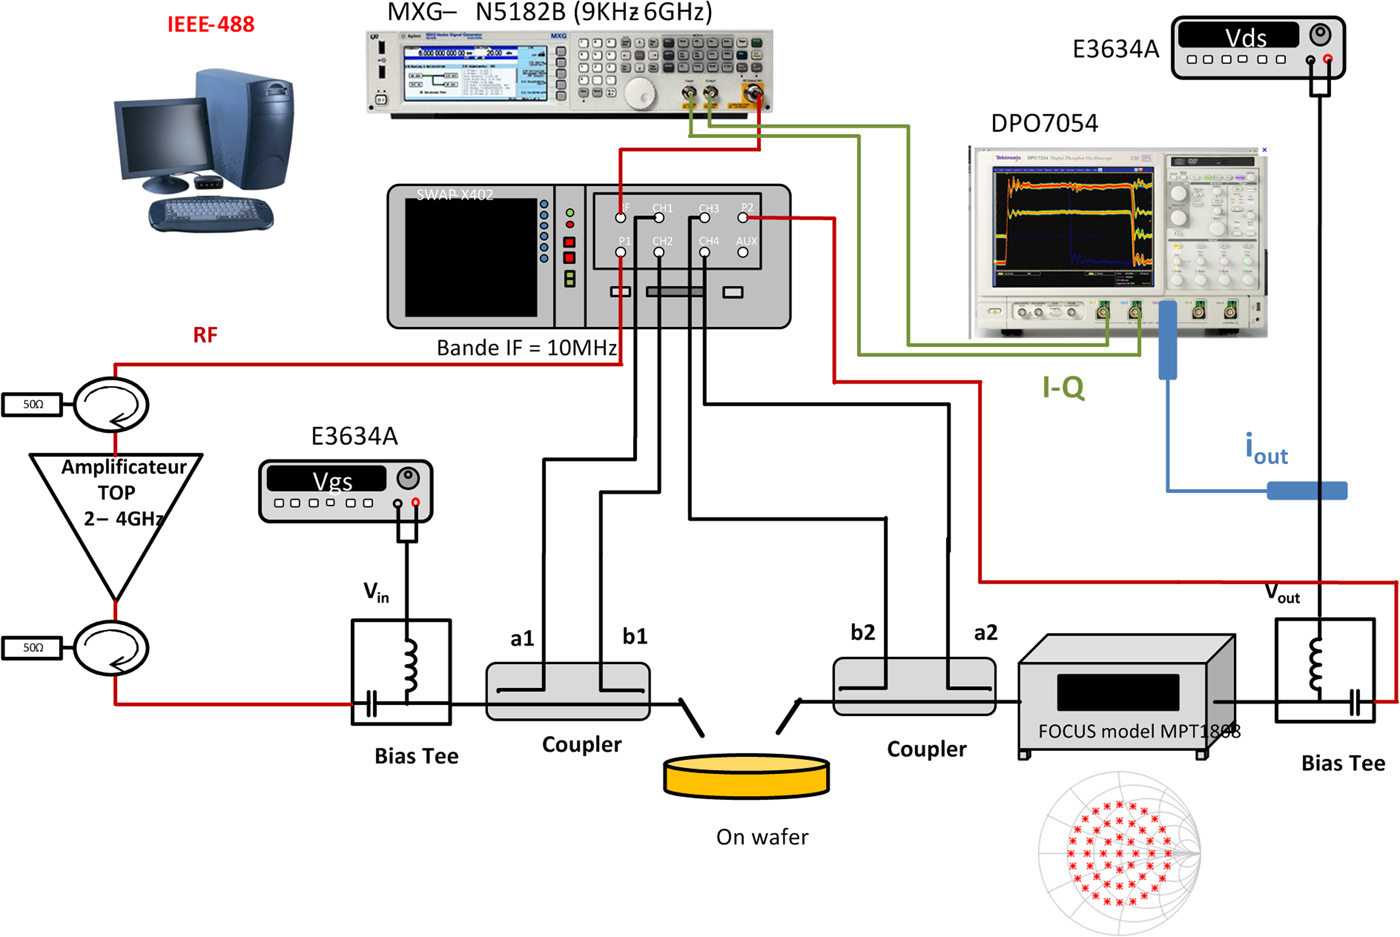
The dedicated test bench is depicted on Fig. 9. It is composed of an arbitrary waveform generator (MXG N5162B 9 kHz–6 GHz) to generate the eight-tone signal with the desired frequency spacing and arbitrary phase distribution. Data are collected thanks to a LSNA and post-processed by a tailored algorithm as previously described in [Reference Teyssier, Sombrin, Quéré, Laurent and Gizard11]. By adding an oscilloscope DPO7054, synchronized LF IQ waves have also been collected. With the present bench, the time-domain input and output RF envelope voltage and current signals can be completely measured, thus we can derive numerous DUT non-linear distortion metrics such as Carrier to Third Intermodulation Ratio (C/IM3), noise power ratio (NPR), and their dependence upon the load impedance conditions.
Setup for time domain load pull on-wafer characterizations.
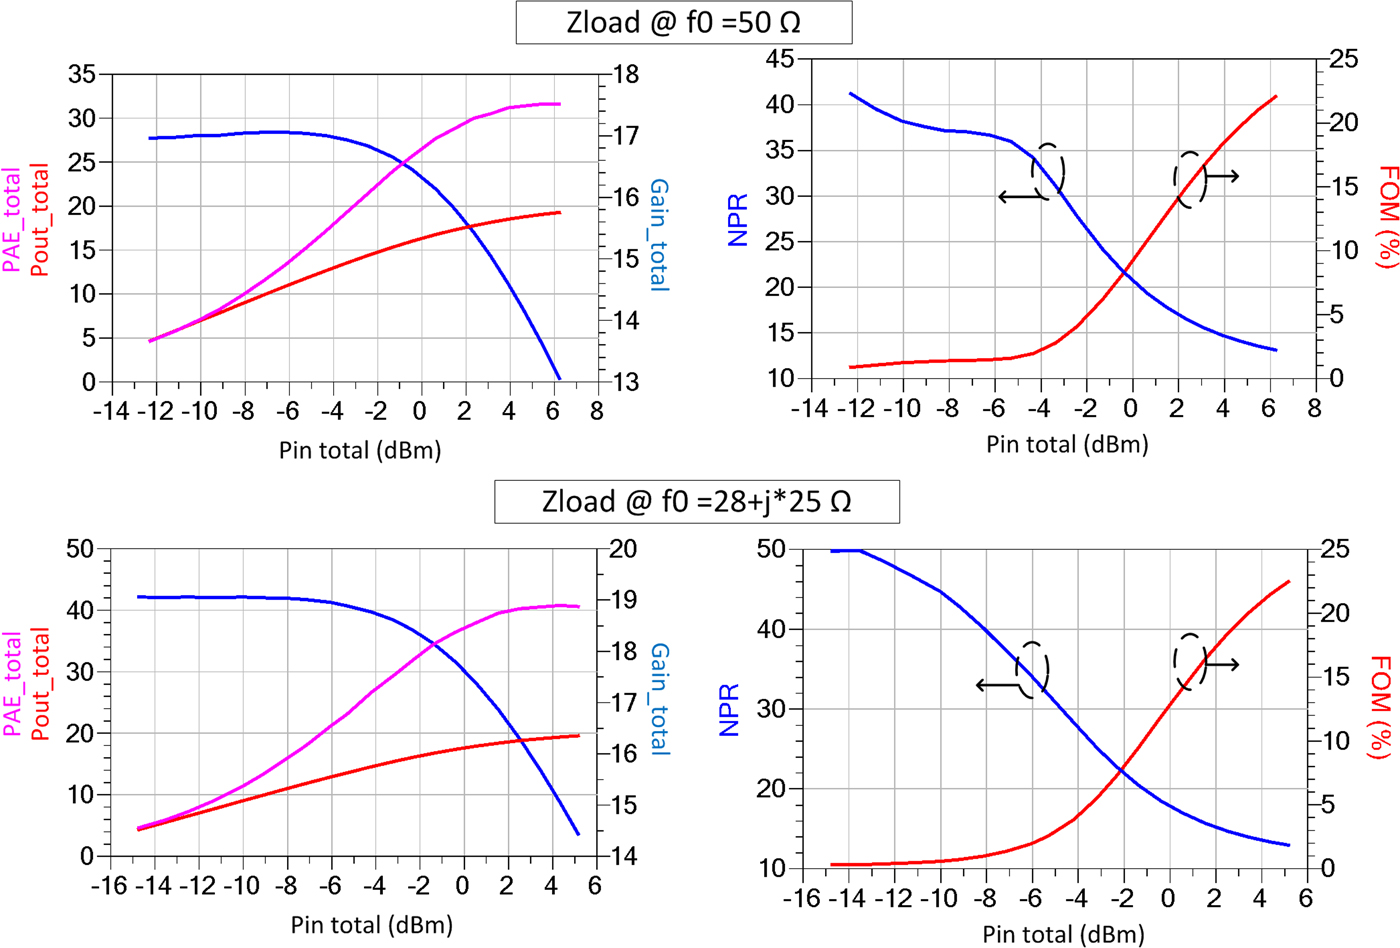
From this set-up, we are able to compute the output power, the PAE, and gain for the case of an eight-tone signal. Figure 9 shows the result for MASMOS A. Moreover, we plot two metrics, NPR and figure of merit (FOM) to determine the non-linearity of the DUT. The NPR value can be obtained by:
 $$NPR = 10{\rm log}10\left( {\displaystyle{{P_u} \over {P_{IM3}}}} \right),$$
where P u is the sum of the eight-tone signal power and P IM3 the power of the IM3 products between the first and the last fundamental frequency. Then, from NPR value we can calculate a FOM [Reference Sombrin12].
 $$20\log (FOM)({\rm dB}) = 40 - NPR.$$
To determine the impact of the load impedance on the non-linearity performances shown in Fig. 10, we compare the NPR and FOM obtained in two cases, by providing 50 Ω at all frequencies for the first case. The latter one uses an optimum load impedance at the fundamental frequency determined via load pull measurement step and 50 Ω is given at the harmonics. The comparison shown in Fig. 10 demonstrate that the metrics value (NPR and FOM) are strongly dependent of the load impedance values. For a lower input level under −6 dBm, the obtained linearity is better for optimum load impedance condition, whereas for higher input power levels, 50 Ω impedance offers better performance.
PAE, pout, gain, NPR, and figure of merit for an eight-tone signal for two load impedances at the fundamental frequency (MASMOS A).
In order to assess the model validity in large-signal dynamic conditions, we compare in Fig. 11 multi-tone time-domain load pull measurement results of the MASMOS devices with the circuit envelope simulation results. In order to give full consistency between results, this simulation has been made when the model is fed with the input voltage waveform recorded during the measurements. Comparison has been done with MASMOS A and B biased at the same single bias point used in load pull characterizations and with the load impedance fixed to 50 Ω for all frequencies. Measurements have been performed for an input power sweep between −15 and 5 dBm. For MASMOS A, the comparison is shown for a total input power level of −3 dBm which corresponds to the beginning of gain compression region of the device (see Fig. 9). For MASMOS B, the comparison is done for a total input power level of 0 dBm. In Fig. 11, we compare the LF drain current waveforms, time-domain envelope output power and gain. The amplitude modulation / phase modulation (AM/PM) plots are shown to demonstrate that the two large-signal model developed are capable to predict the effective fundamental phase deviation produced by MASMOS structures. Simulation and measurements results are coherent, with a good link between DC drain port signals and RF envelope signals, proving that the three-port compact modeling approach of the MASMOS followed here is sufficient.
Time domain envelope gain, output time domain envelope power, and drain current waveforms at the same average power level for MASMOS A and B.

Conclusion
A classical compact modeling process has been described and applied to a new device, termed as MASMOS. The modeling approach followed in this paper has proved to be efficient in predicting both static CW small and large-signal response, in terms of output power, gain compression, PAE performances, and optimum load condition. Then it has been tested and compared with measurements in large-signal dynamic operations through an innovative multi-tones generic test procedure. This new generic signal is a useful tool to assess the linearity performances of non-linear devices with memory. The proposed simplified model approach demonstrate a good agreement compared to experiment measurement in such complex stimulus. The next step will now be to implement the MASMOS model in a RF PA design flow for LTE applications.
 Frédérique Simbélie received the Master degree in Electronic, Optics and Telecommunications from the University of Limoges, France in 2014. She is currently working toward the Ph.D. degree in the field of RF and Microwave Characterization at the XLIM laboratory, University of Limoges, France. Her current research interest include characterization and modeling of non-linear components (MASMOS) in order to design power amplifiers for LTE applications.
 Sylvain Laurent received the Engineer degree from ENSIL, Limoges, France, in 2007 and the Ph.D. degree from the University de Limoges, Brive, France, in 2010. He is currently an Engineer in the ‘Composants Circuits Signaux et Systèmes Hautes Fréquences’ department of Xlim laboratory. His current research interests include the characterization of RF microwave nonlinear devices.
Pierre Medrel obtained his Ph.D. degree from XLIM laboratory, University of Limoges, Limoges, France in 2014. Since 2015, he has been with the University of Limoges, France, as Assistant Professor and Researcher in XLIM laboratory. His main field of interest is high-efficiency microwave PA architectures and non-linear device characterization.
Michel Prigent is Professor at the University of Limoges. His field of interest are the design of microwave and millimeter wave oscillator circuits. He is also involved in characterization and modeling of non-linear active components (FET, PHEMT, HBT,…) with a particular emphasis in low-frequency noise measurement and modeling for the use in MMIC CAD. Recently, he was involved in the development of test bench to linearity characterization of non-linear components and devices.
Myrianne Regis obtained her Ph.D. degree, Toulouse 3, France in 1999. She is a Project Manager in ACCO semiconductor.
Yann Creveuil obtained his DESS in Integrated Circuit and Microcomputer from Paris 7 Denis Diderot University, Paris, France in 1998. He is a Microelectronics Engineer in ACCO semiconductor since 2006.
 Raymond Quéré (Fellow IEEE) received the Electrical Engineering degree from ENSEEIHT Toulouse, France in 1976, the French ‘agrégation’ in applied physics in 1978 and a Ph.D. degree from the University of Limoges in 1989. His main field of interest is in the area of non-linear device and circuit modeling with a particular emphasis on non-linear phenomena such as stability in power amplifiers. He advises more than 40 Ph.D. students and he authors or co-authors more than 150 journal articles or communications in international conferences such as IMS/MTT, EuMW. He was the co-author of the book ‘Nonlinear Stability of Nonlinear Microwave Circuits’. In 2005, he was appointed as General Chairman of the European Microwave Week in Paris. From 2009 to 2013, he was the Editor In Chief of the International Journal of Microwave and Wireless Technologies (Cambridge University Press). Now he is the Deputy Director of the XLIM-CNRS Labs in Limoges (France).